Fairview, WV
Fairview Map
Fairview Overview
247
TOTAL POPULATION
122
MALE POPULATION
125
FEMALE POPULATION
97.60
MALES / 100 FEMALES
102.46
FEMALES / 100 MALES
63.5
MEDIAN AGE
3.0
AVG FAMILY SIZE
2.3
AVG HOUSEHOLD SIZE
$27,987
PER CAPITA INCOME
$71,250
AVG FAMILY INCOME
$60,455
AVG HOUSEHOLD INCOME
41.8%
WAGE / INCOME GAP [ % ]
58.2¢/ $1
WAGE / INCOME GAP [ $ ]
0.30
INEQUALITY / GINI INDEX
79
LABOR FORCE [ PEOPLE ]
35.9%
PERCENT IN LABOR FORCE
3.8%
UNEMPLOYMENT RATE
Fairview Zip Codes
Fairview Area Codes
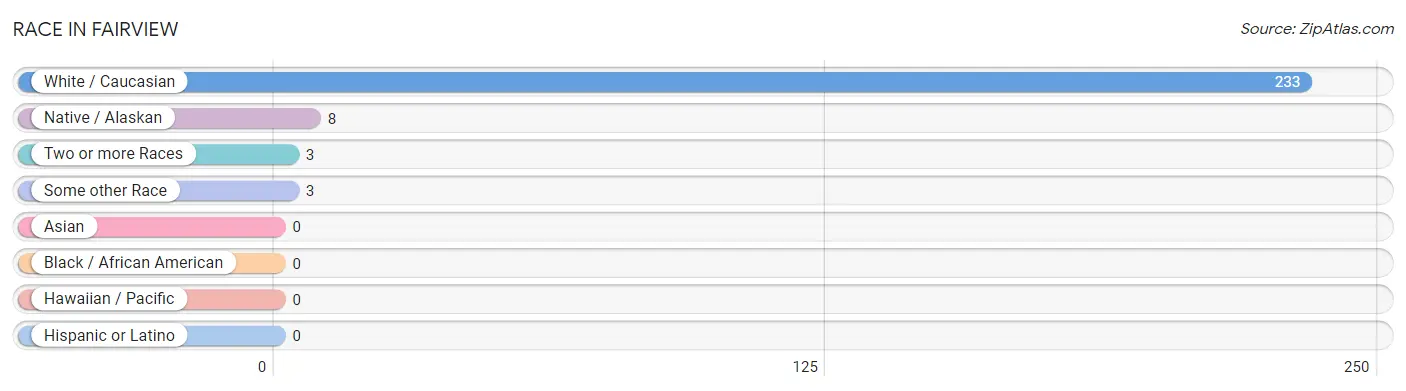
Race in Fairview
The most populous races in Fairview are White / Caucasian (233 | 94.3%), Native / Alaskan (8 | 3.2%), and Two or more Races (3 | 1.2%).
| Race | # Population | % Population |
| Asian | 0 | 0.0% |
| Black / African American | 0 | 0.0% |
| Hawaiian / Pacific | 0 | 0.0% |
| Hispanic or Latino | 0 | 0.0% |
| Native / Alaskan | 8 | 3.2% |
| White / Caucasian | 233 | 94.3% |
| Two or more Races | 3 | 1.2% |
| Some other Race | 3 | 1.2% |
| Total | 247 | 100.0% |
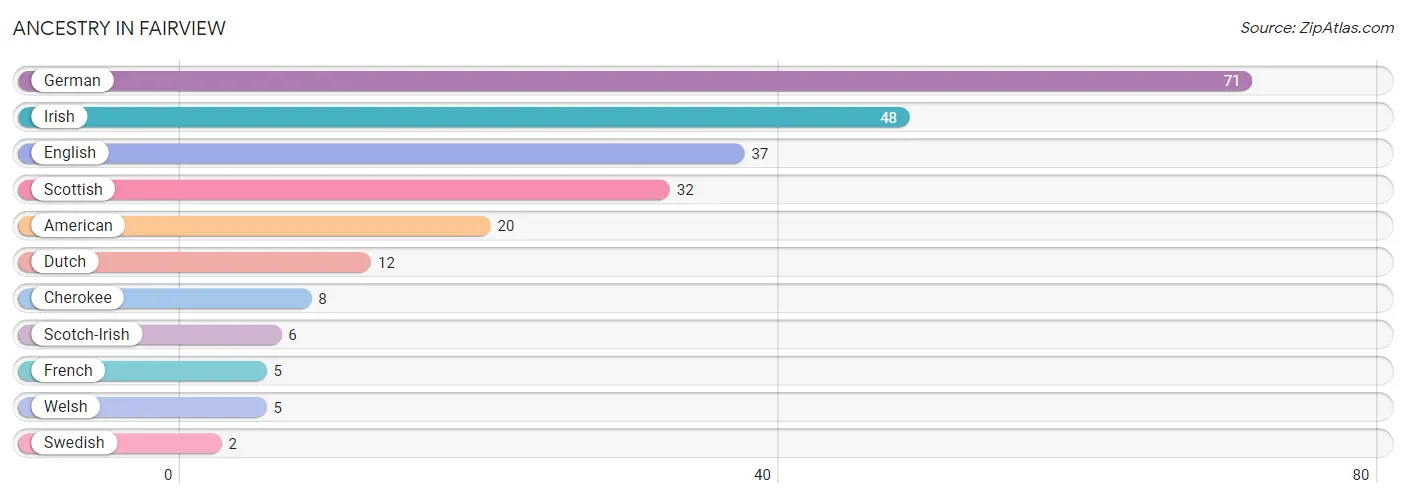
Ancestry in Fairview
The most populous ancestries reported in Fairview are German (71 | 28.7%), Irish (48 | 19.4%), English (37 | 15.0%), Scottish (32 | 13.0%), and American (20 | 8.1%), together accounting for 84.2% of all Fairview residents.
| Ancestry | # Population | % Population |
| American | 20 | 8.1% |
| Cherokee | 8 | 3.2% |
| Dutch | 12 | 4.9% |
| English | 37 | 15.0% |
| French | 5 | 2.0% |
| German | 71 | 28.7% |
| Irish | 48 | 19.4% |
| Scotch-Irish | 6 | 2.4% |
| Scottish | 32 | 13.0% |
| Swedish | 2 | 0.8% |
| Welsh | 5 | 2.0% | View All 11 Rows |
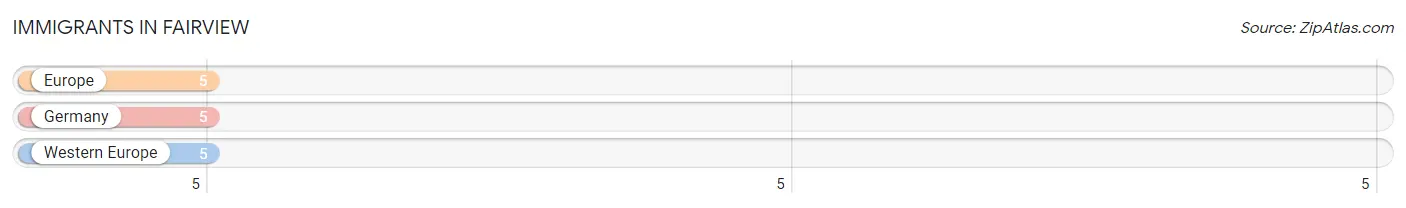
Immigrants in Fairview
The most numerous immigrant groups reported in Fairview came from Europe (5 | 2.0%), Germany (5 | 2.0%), and Western Europe (5 | 2.0%), together accounting for 6.1% of all Fairview residents.
| Immigration Origin | # Population | % Population |
| Europe | 5 | 2.0% |
| Germany | 5 | 2.0% |
| Western Europe | 5 | 2.0% | View All 3 Rows |
Sex and Age in Fairview
Sex and Age in Fairview
The most populous age groups in Fairview are 75 to 79 Years (19 | 15.6%) for men and 70 to 74 Years (25 | 20.0%) for women.
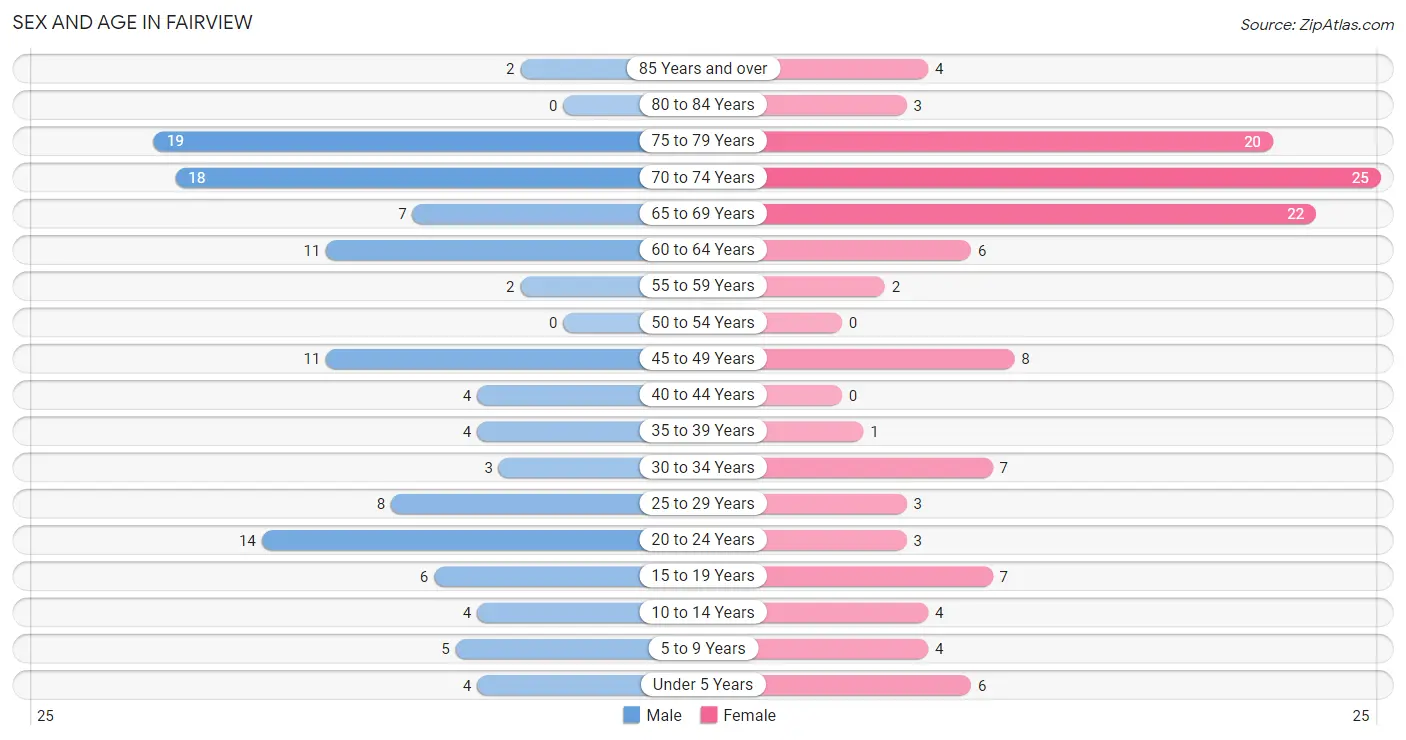
| Age Bracket | Male | Female |
| Under 5 Years | 4 (3.3%) | 6 (4.8%) |
| 5 to 9 Years | 5 (4.1%) | 4 (3.2%) |
| 10 to 14 Years | 4 (3.3%) | 4 (3.2%) |
| 15 to 19 Years | 6 (4.9%) | 7 (5.6%) |
| 20 to 24 Years | 14 (11.5%) | 3 (2.4%) |
| 25 to 29 Years | 8 (6.6%) | 3 (2.4%) |
| 30 to 34 Years | 3 (2.5%) | 7 (5.6%) |
| 35 to 39 Years | 4 (3.3%) | 1 (0.8%) |
| 40 to 44 Years | 4 (3.3%) | 0 (0.0%) |
| 45 to 49 Years | 11 (9.0%) | 8 (6.4%) |
| 50 to 54 Years | 0 (0.0%) | 0 (0.0%) |
| 55 to 59 Years | 2 (1.6%) | 2 (1.6%) |
| 60 to 64 Years | 11 (9.0%) | 6 (4.8%) |
| 65 to 69 Years | 7 (5.7%) | 22 (17.6%) |
| 70 to 74 Years | 18 (14.7%) | 25 (20.0%) |
| 75 to 79 Years | 19 (15.6%) | 20 (16.0%) |
| 80 to 84 Years | 0 (0.0%) | 3 (2.4%) |
| 85 Years and over | 2 (1.6%) | 4 (3.2%) |
| Total | 122 (100.0%) | 125 (100.0%) |
Families and Households in Fairview
Median Family Size in Fairview
The median family size in Fairview is 3.03 persons per family, with married-couple families (59 | 95.2%) accounting for the largest median family size of 3.07 persons per family. On the other hand, single male/father families (2 | 3.2%) represent the smallest median family size with 2.00 persons per family.
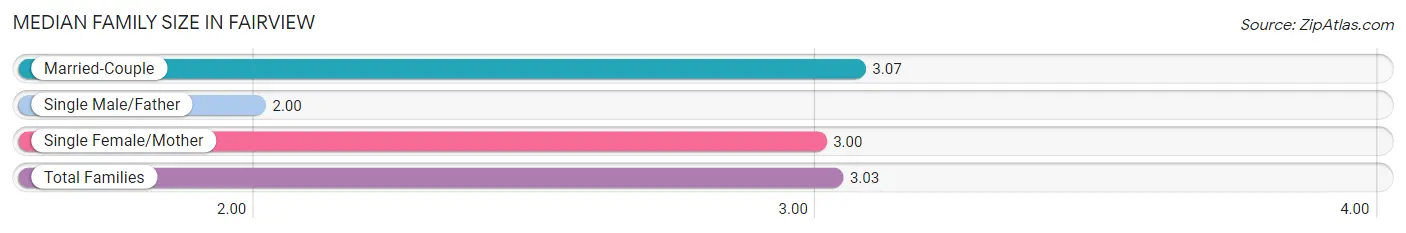
| Family Type | # Families | Family Size |
| Married-Couple | 59 (95.2%) | 3.07 |
| Single Male/Father | 2 (3.2%) | 2.00 |
| Single Female/Mother | 1 (1.6%) | 3.00 |
| Total Families | 62 (100.0%) | 3.03 |
Median Household Size in Fairview
The median household size in Fairview is 2.29 persons per household, with married-couple households (59 | 54.6%) accounting for the largest median household size of 3.07 persons per household. non-family households (46 | 42.6%) represent the smallest median household size with 1.28 persons per household.
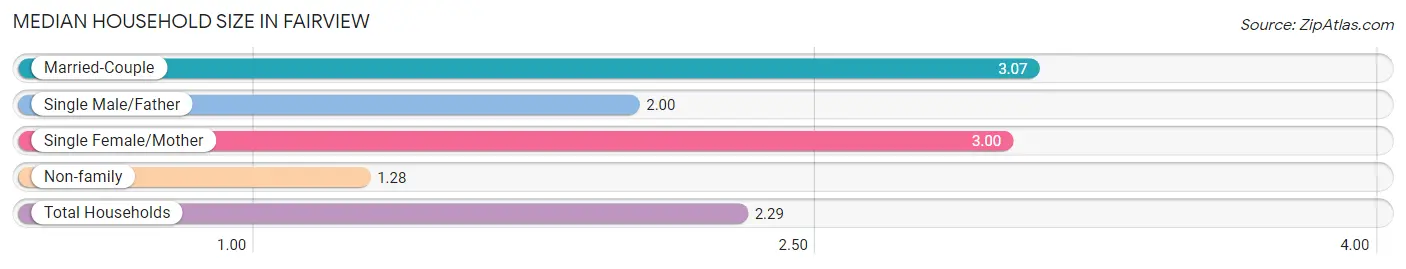
| Household Type | # Households | Household Size |
| Married-Couple | 59 (54.6%) | 3.07 |
| Single Male/Father | 2 (1.8%) | 2.00 |
| Single Female/Mother | 1 (0.9%) | 3.00 |
| Non-family | 46 (42.6%) | 1.28 |
| Total Households | 108 (100.0%) | 2.29 |
Household Size by Marriage Status in Fairview
Out of a total of 108 households in Fairview, 62 (57.4%) are family households, while 46 (42.6%) are nonfamily households. The most numerous type of family households are 2-person households, comprising 32, and the most common type of nonfamily households are 1-person households, comprising 33.
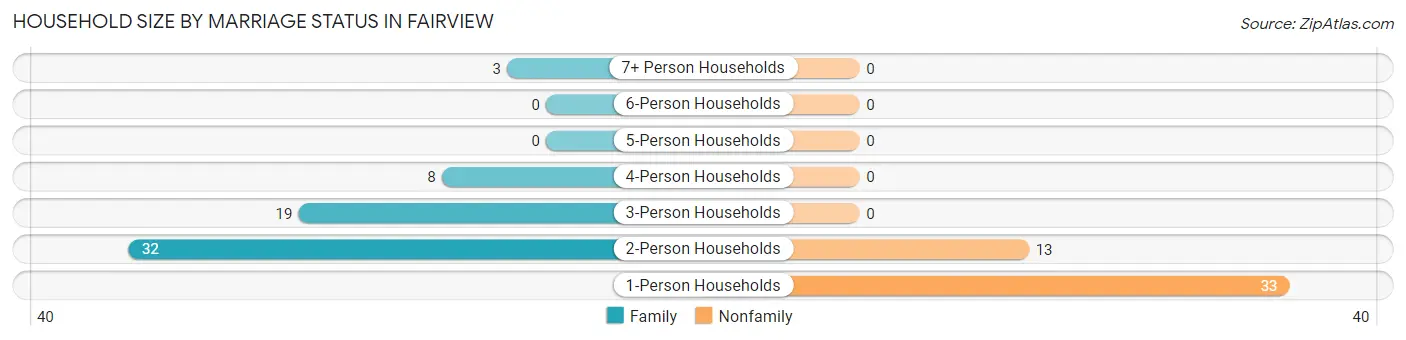
| Household Size | Family Households | Nonfamily Households |
| 1-Person Households | - | 33 (30.6%) |
| 2-Person Households | 32 (29.6%) | 13 (12.0%) |
| 3-Person Households | 19 (17.6%) | 0 (0.0%) |
| 4-Person Households | 8 (7.4%) | 0 (0.0%) |
| 5-Person Households | 0 (0.0%) | 0 (0.0%) |
| 6-Person Households | 0 (0.0%) | 0 (0.0%) |
| 7+ Person Households | 3 (2.8%) | 0 (0.0%) |
| Total | 62 (57.4%) | 46 (42.6%) |
Female Fertility in Fairview
Fertility by Age in Fairview
| Age Bracket | Women with Births | Births / 1,000 Women |
| 15 to 19 years | 0 (0.0%) | 0.0 |
| 20 to 34 years | 0 (0.0%) | 0.0 |
| 35 to 50 years | 0 (0.0%) | 0.0 |
| Total | 0 (0.0%) | 0.0 |
Fertility by Age by Marriage Status in Fairview
| Age Bracket | Married | Unmarried |
| 15 to 19 years | 0 (0.0%) | 0 (0.0%) |
| 20 to 34 years | 0 (0.0%) | 0 (0.0%) |
| 35 to 50 years | 0 (0.0%) | 0 (0.0%) |
| Total | 0 (0.0%) | 0 (0.0%) |
Fertility by Education in Fairview
| Educational Attainment | Women with Births | Births / 1,000 Women |
| Less than High School | 0 (0.0%) | 0.0 |
| High School Diploma | 0 (0.0%) | 0.0 |
| College or Associate's Degree | 0 (0.0%) | 0.0 |
| Bachelor's Degree | 0 (0.0%) | 0.0 |
| Graduate Degree | 0 (0.0%) | 0.0 |
| Total | 0 (0.0%) | 0.0 |
Fertility by Education by Marriage Status in Fairview
| Educational Attainment | Married | Unmarried |
| Less than High School | 0 (0.0%) | 0 (0.0%) |
| High School Diploma | 0 (0.0%) | 0 (0.0%) |
| College or Associate's Degree | 0 (0.0%) | 0 (0.0%) |
| Bachelor's Degree | 0 (0.0%) | 0 (0.0%) |
| Graduate Degree | 0 (0.0%) | 0 (0.0%) |
| Total | 0 (0.0%) | 0 (0.0%) |
Income in Fairview
Income Overview in Fairview
Per Capita Income in Fairview is $27,987, while median incomes of families and households are $71,250 and $60,455 respectively.
| Characteristic | Number | Measure |
| Per Capita Income | 247 | $27,987 |
| Median Family Income | 62 | $71,250 |
| Mean Family Income | 62 | $74,797 |
| Median Household Income | 108 | $60,455 |
| Mean Household Income | 108 | $61,454 |
| Income Deficit | 62 | $0 |
| Wage / Income Gap (%) | 247 | 41.77% |
| Wage / Income Gap ($) | 247 | 58.23¢ per $1 |
| Gini / Inequality Index | 247 | 0.30 |
Earnings by Sex in Fairview
Average Earnings in Fairview are $29,286, $28,750 for men and $49,375 for women, a difference of 41.8%.
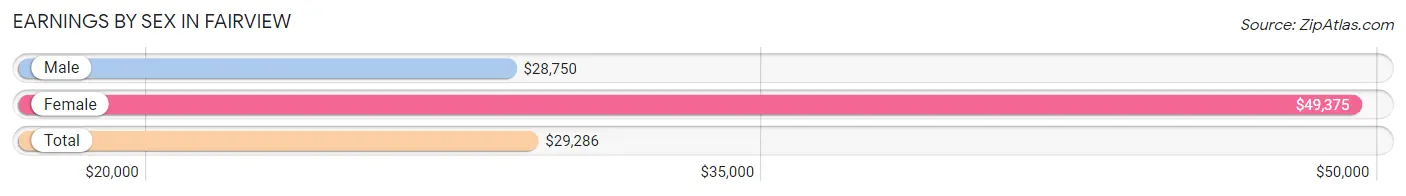
| Sex | Number | Average Earnings |
| Male | 47 (61.8%) | $28,750 |
| Female | 29 (38.2%) | $49,375 |
| Total | 76 (100.0%) | $29,286 |
Earnings by Sex by Income Bracket in Fairview
The most common earnings brackets in Fairview are $2,499 or less for men (12 | 25.5%) and $55,000 to $64,999 for women (8 | 27.6%).
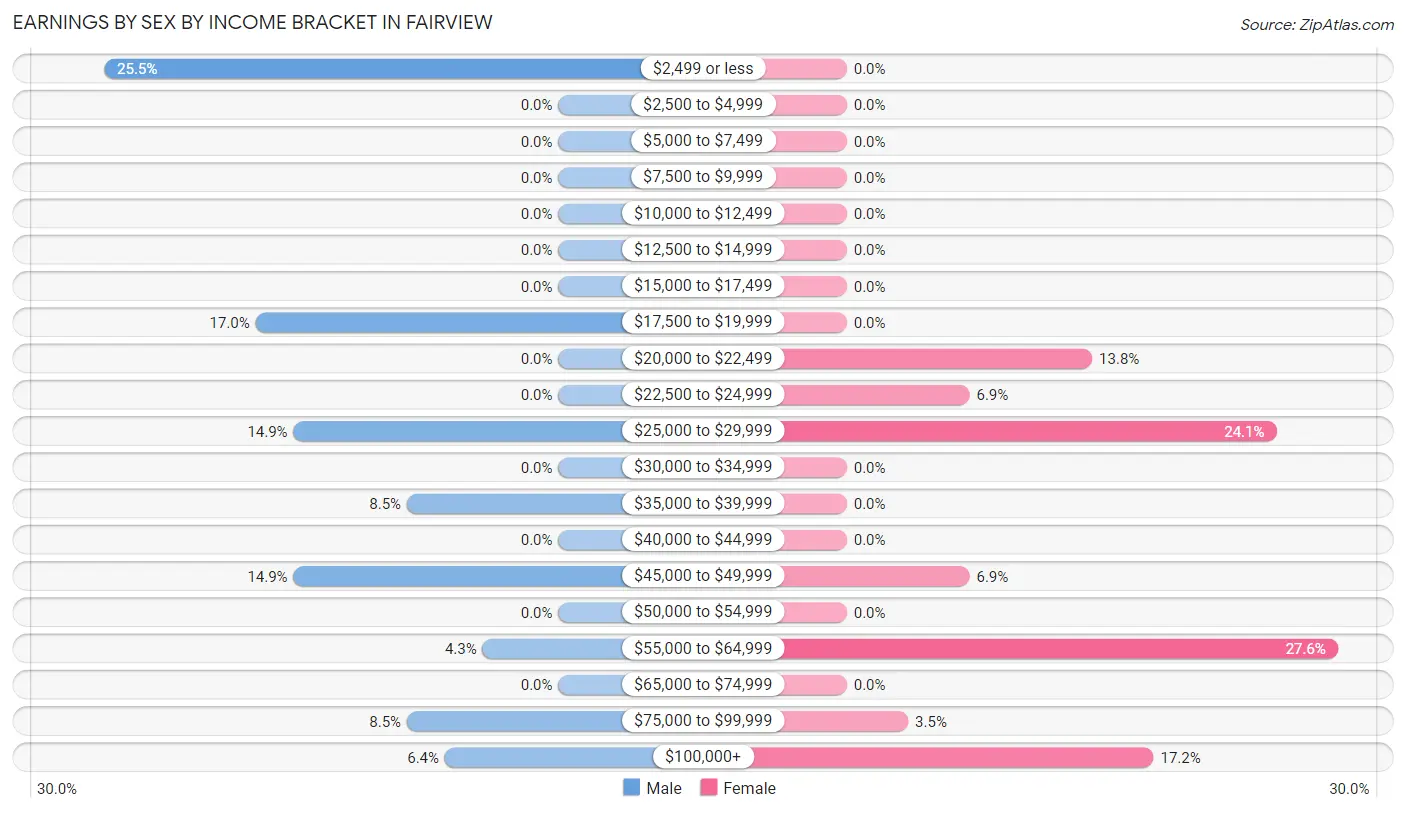
| Income | Male | Female |
| $2,499 or less | 12 (25.5%) | 0 (0.0%) |
| $2,500 to $4,999 | 0 (0.0%) | 0 (0.0%) |
| $5,000 to $7,499 | 0 (0.0%) | 0 (0.0%) |
| $7,500 to $9,999 | 0 (0.0%) | 0 (0.0%) |
| $10,000 to $12,499 | 0 (0.0%) | 0 (0.0%) |
| $12,500 to $14,999 | 0 (0.0%) | 0 (0.0%) |
| $15,000 to $17,499 | 0 (0.0%) | 0 (0.0%) |
| $17,500 to $19,999 | 8 (17.0%) | 0 (0.0%) |
| $20,000 to $22,499 | 0 (0.0%) | 4 (13.8%) |
| $22,500 to $24,999 | 0 (0.0%) | 2 (6.9%) |
| $25,000 to $29,999 | 7 (14.9%) | 7 (24.1%) |
| $30,000 to $34,999 | 0 (0.0%) | 0 (0.0%) |
| $35,000 to $39,999 | 4 (8.5%) | 0 (0.0%) |
| $40,000 to $44,999 | 0 (0.0%) | 0 (0.0%) |
| $45,000 to $49,999 | 7 (14.9%) | 2 (6.9%) |
| $50,000 to $54,999 | 0 (0.0%) | 0 (0.0%) |
| $55,000 to $64,999 | 2 (4.3%) | 8 (27.6%) |
| $65,000 to $74,999 | 0 (0.0%) | 0 (0.0%) |
| $75,000 to $99,999 | 4 (8.5%) | 1 (3.5%) |
| $100,000+ | 3 (6.4%) | 5 (17.2%) |
| Total | 47 (100.0%) | 29 (100.0%) |
Earnings by Sex by Educational Attainment in Fairview
Average earnings in Fairview are $39,063 for men and $56,563 for women, a difference of 30.9%. Men with an educational attainment of college or associate's degree enjoy the highest average annual earnings of $46,250, while those with high school diploma education earn the least with $27,857. Women with an educational attainment of high school diploma earn the most with the average annual earnings of $58,438, while those with high school diploma education have the smallest earnings of $58,438.
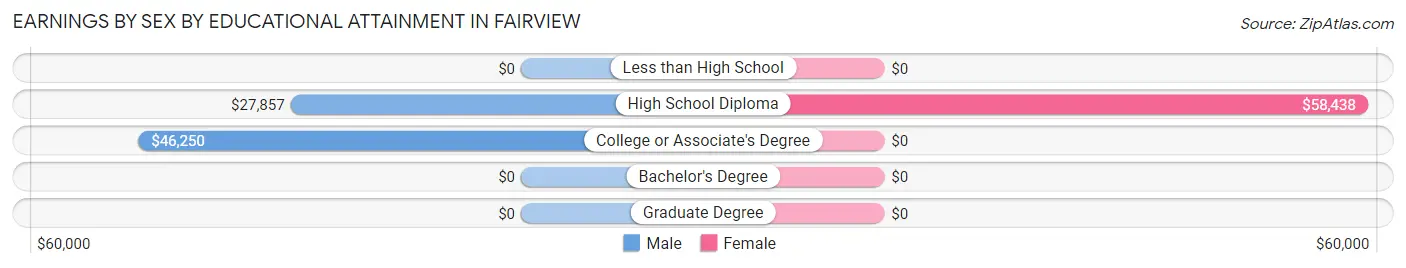
| Educational Attainment | Male Income | Female Income |
| Less than High School | - | - |
| High School Diploma | $27,857 | $58,438 |
| College or Associate's Degree | $46,250 | $0 |
| Bachelor's Degree | - | - |
| Graduate Degree | - | - |
| Total | $39,063 | $56,563 |
Family Income in Fairview
Family Income Brackets in Fairview
According to the Fairview family income data, there are 19 families falling into the $50,000 to $74,999 income range, which is the most common income bracket and makes up 30.6% of all families.
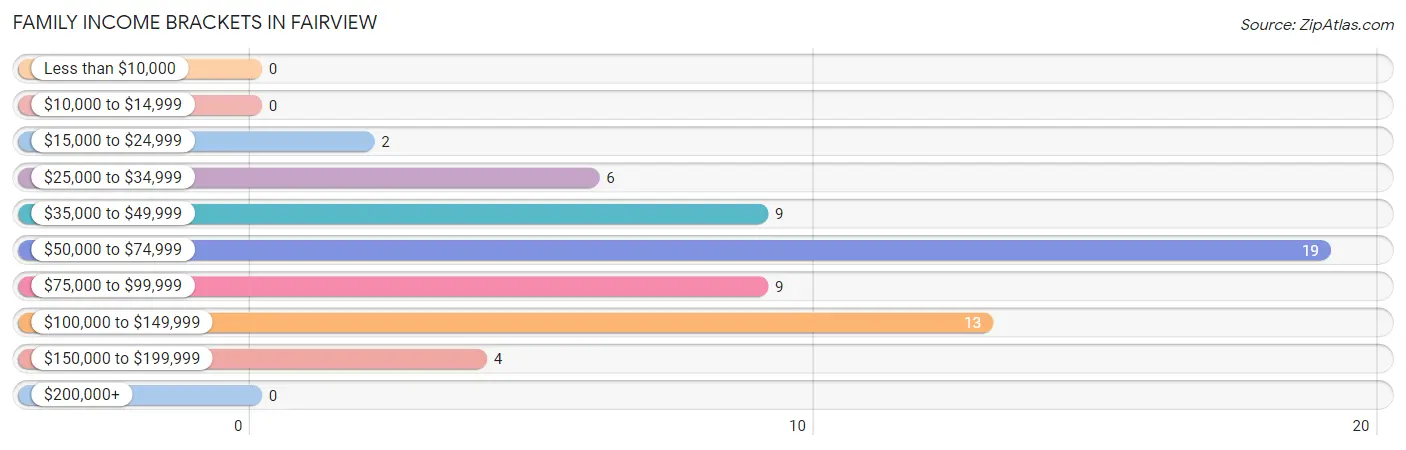
| Income Bracket | # Families | % Families |
| Less than $10,000 | 0 | 0.0% |
| $10,000 to $14,999 | 0 | 0.0% |
| $15,000 to $24,999 | 2 | 3.2% |
| $25,000 to $34,999 | 6 | 9.7% |
| $35,000 to $49,999 | 9 | 14.5% |
| $50,000 to $74,999 | 19 | 30.6% |
| $75,000 to $99,999 | 9 | 14.5% |
| $100,000 to $149,999 | 13 | 21.0% |
| $150,000 to $199,999 | 4 | 6.5% |
| $200,000+ | 0 | 0.0% |
Family Income by Famaliy Size in Fairview
4-person families (8 | 12.9%) account for the highest median family income in Fairview with $97,500 per family, while 2-person families (32 | 51.6%) have the highest median income of $30,625 per family member.
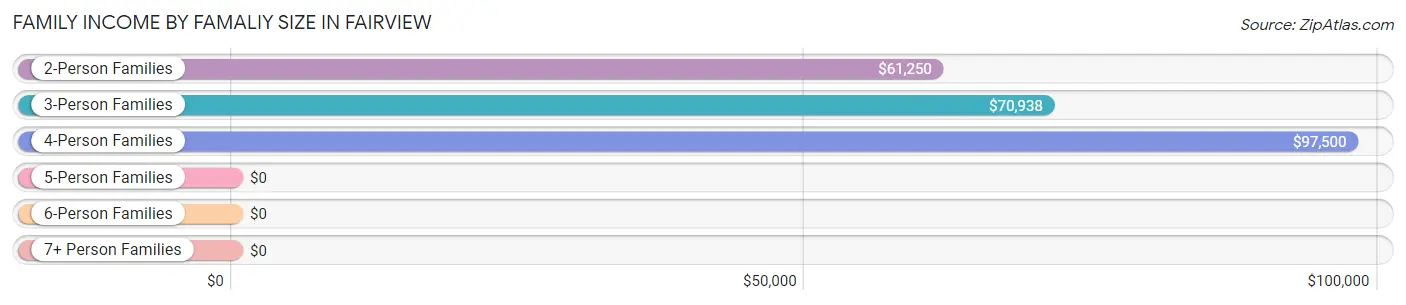
| Income Bracket | # Families | Median Income |
| 2-Person Families | 32 (51.6%) | $61,250 |
| 3-Person Families | 19 (30.6%) | $70,938 |
| 4-Person Families | 8 (12.9%) | $97,500 |
| 5-Person Families | 0 (0.0%) | $0 |
| 6-Person Families | 0 (0.0%) | $0 |
| 7+ Person Families | 3 (4.8%) | $0 |
| Total | 62 (100.0%) | $71,250 |
Family Income by Number of Earners in Fairview
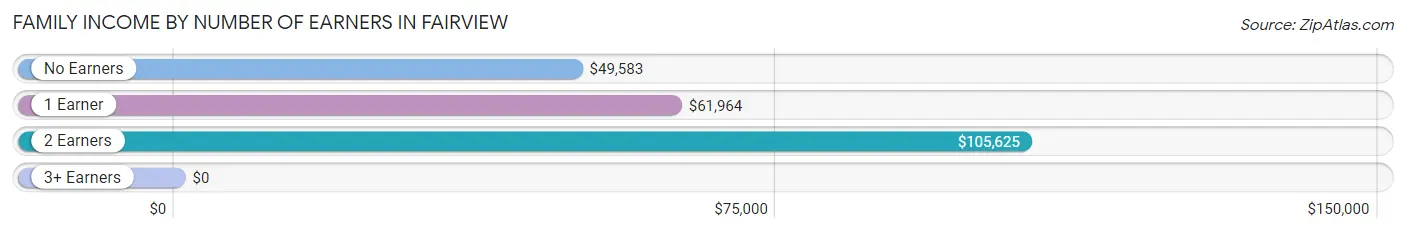
| Number of Earners | # Families | Median Income |
| No Earners | 25 (40.3%) | $49,583 |
| 1 Earner | 19 (30.6%) | $61,964 |
| 2 Earners | 18 (29.0%) | $105,625 |
| 3+ Earners | 0 (0.0%) | $0 |
| Total | 62 (100.0%) | $71,250 |
Household Income in Fairview
Household Income Brackets in Fairview
With 33 households falling in the category, the $50,000 to $74,999 income range is the most frequent in Fairview, accounting for 30.6% of all households.
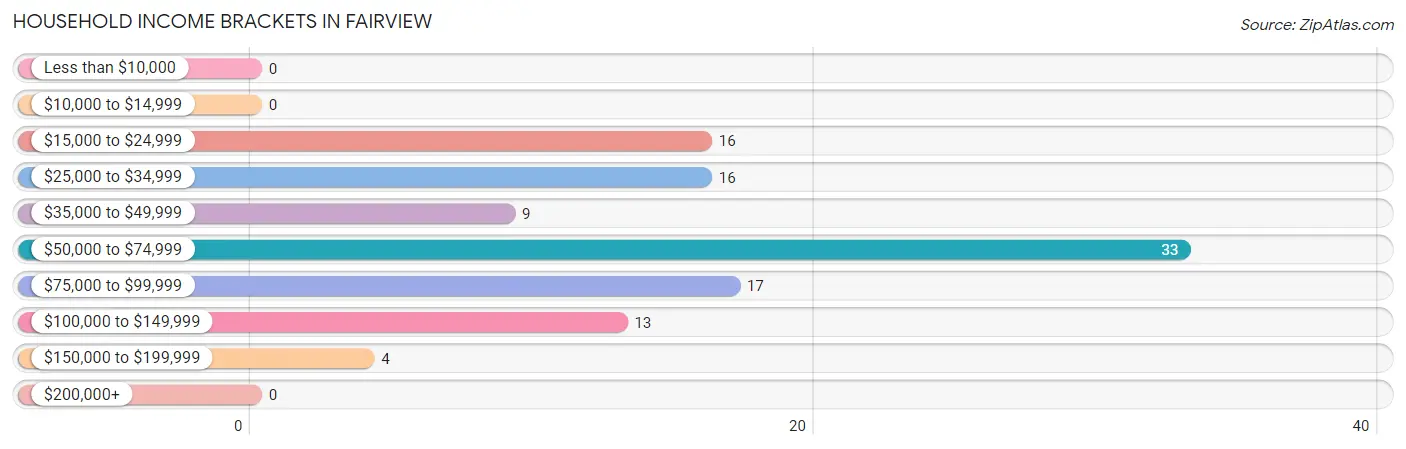
| Income Bracket | # Households | % Households |
| Less than $10,000 | 0 | 0.0% |
| $10,000 to $14,999 | 0 | 0.0% |
| $15,000 to $24,999 | 16 | 14.8% |
| $25,000 to $34,999 | 16 | 14.8% |
| $35,000 to $49,999 | 9 | 8.3% |
| $50,000 to $74,999 | 33 | 30.6% |
| $75,000 to $99,999 | 17 | 15.7% |
| $100,000 to $149,999 | 13 | 12.0% |
| $150,000 to $199,999 | 4 | 3.7% |
| $200,000+ | 0 | 0.0% |
Household Income by Householder Age in Fairview
The median household income in Fairview is $60,455, with the highest median household income of $100,625 found in the 25 to 44 years age bracket for the primary householder. A total of 10 households (9.3%) fall into this category. Meanwhile, the 15 to 24 years age bracket for the primary householder has the lowest median household income of $0, with 6 households (5.6%) in this group.
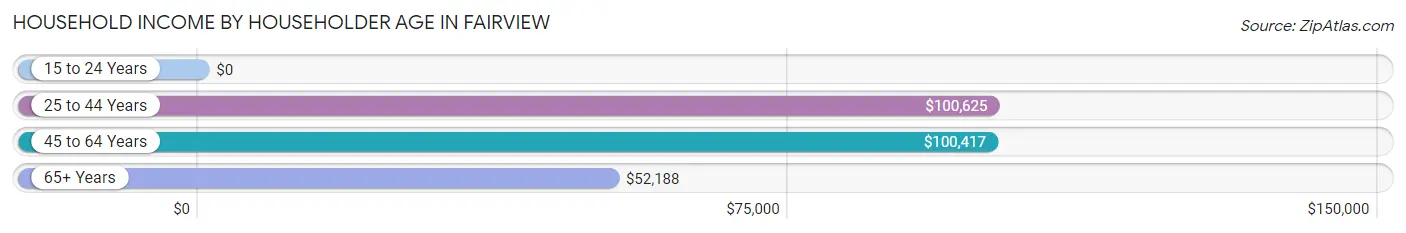
| Income Bracket | # Households | Median Income |
| 15 to 24 Years | 6 (5.6%) | $0 |
| 25 to 44 Years | 10 (9.3%) | $100,625 |
| 45 to 64 Years | 21 (19.4%) | $100,417 |
| 65+ Years | 71 (65.7%) | $52,188 |
| Total | 108 (100.0%) | $60,455 |
Poverty in Fairview
Income Below Poverty by Sex and Age in Fairview
| Age Bracket | Male | Female |
| Under 5 Years | 0 (0.0%) | 0 (0.0%) |
| 5 Years | 0 (0.0%) | 0 (0.0%) |
| 6 to 11 Years | 0 (0.0%) | 0 (0.0%) |
| 12 to 14 Years | 0 (0.0%) | 0 (0.0%) |
| 15 Years | 0 (0.0%) | 0 (0.0%) |
| 16 and 17 Years | 0 (0.0%) | 0 (0.0%) |
| 18 to 24 Years | 0 (0.0%) | 0 (0.0%) |
| 25 to 34 Years | 0 (0.0%) | 0 (0.0%) |
| 35 to 44 Years | 0 (0.0%) | 0 (0.0%) |
| 45 to 54 Years | 0 (0.0%) | 0 (0.0%) |
| 55 to 64 Years | 0 (0.0%) | 0 (0.0%) |
| 65 to 74 Years | 0 (0.0%) | 0 (0.0%) |
| 75 Years and over | 0 (0.0%) | 0 (0.0%) |
| Total | 0 (0.0%) | 0 (0.0%) |
Income Above Poverty by Sex and Age in Fairview
According to the poverty statistics in Fairview, males aged under 5 years and females aged under 5 years are the age groups that are most secure financially, with 100.0% of males and 100.0% of females in these age groups living above the poverty line.
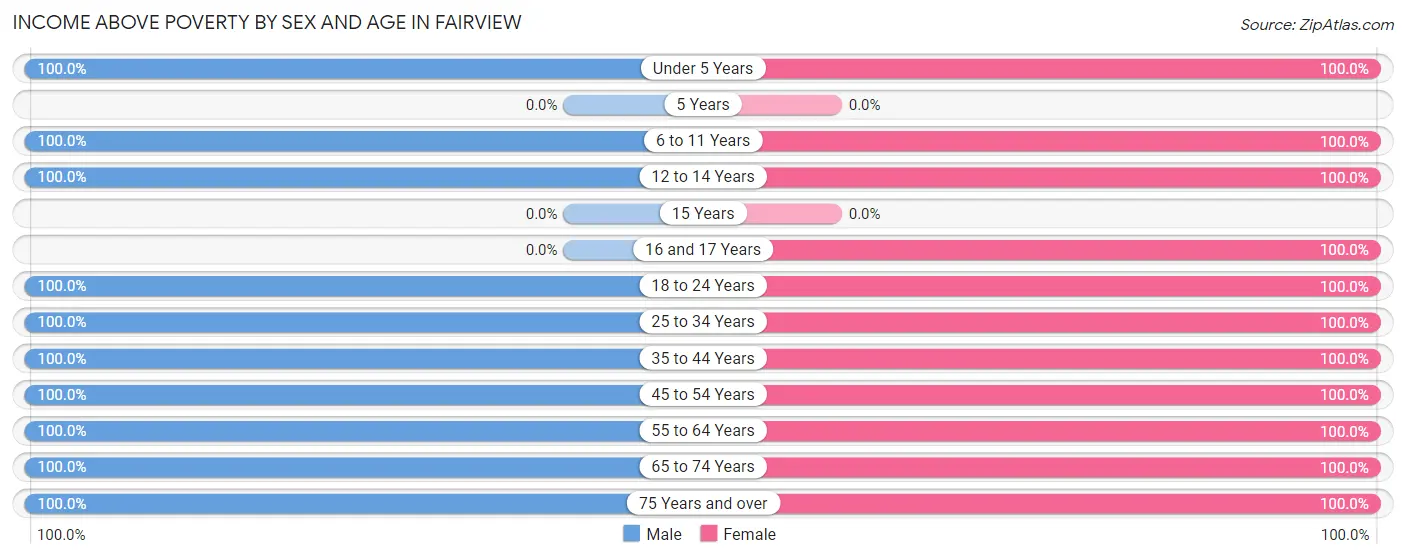
| Age Bracket | Male | Female |
| Under 5 Years | 4 (100.0%) | 6 (100.0%) |
| 5 Years | 0 (0.0%) | 0 (0.0%) |
| 6 to 11 Years | 5 (100.0%) | 4 (100.0%) |
| 12 to 14 Years | 4 (100.0%) | 4 (100.0%) |
| 15 Years | 0 (0.0%) | 0 (0.0%) |
| 16 and 17 Years | 0 (0.0%) | 1 (100.0%) |
| 18 to 24 Years | 20 (100.0%) | 9 (100.0%) |
| 25 to 34 Years | 11 (100.0%) | 10 (100.0%) |
| 35 to 44 Years | 8 (100.0%) | 1 (100.0%) |
| 45 to 54 Years | 11 (100.0%) | 8 (100.0%) |
| 55 to 64 Years | 13 (100.0%) | 8 (100.0%) |
| 65 to 74 Years | 25 (100.0%) | 47 (100.0%) |
| 75 Years and over | 21 (100.0%) | 27 (100.0%) |
| Total | 122 (100.0%) | 125 (100.0%) |
Income Below Poverty Among Married-Couple Families in Fairview
| Children | Above Poverty | Below Poverty |
| No Children | 49 (100.0%) | 0 (0.0%) |
| 1 or 2 Children | 7 (100.0%) | 0 (0.0%) |
| 3 or 4 Children | 0 (0.0%) | 0 (0.0%) |
| 5 or more Children | 3 (100.0%) | 0 (0.0%) |
| Total | 59 (100.0%) | 0 (0.0%) |
Income Below Poverty Among Single-Parent Households in Fairview
| Children | Single Father | Single Mother |
| No Children | 0 (0.0%) | 0 (0.0%) |
| 1 or 2 Children | 0 (0.0%) | 0 (0.0%) |
| 3 or 4 Children | 0 (0.0%) | 0 (0.0%) |
| 5 or more Children | 0 (0.0%) | 0 (0.0%) |
| Total | 0 (0.0%) | 0 (0.0%) |
Income Below Poverty Among Married-Couple vs Single-Parent Households in Fairview
| Children | Married-Couple Families | Single-Parent Households |
| No Children | 0 (0.0%) | 0 (0.0%) |
| 1 or 2 Children | 0 (0.0%) | 0 (0.0%) |
| 3 or 4 Children | 0 (0.0%) | 0 (0.0%) |
| 5 or more Children | 0 (0.0%) | 0 (0.0%) |
| Total | 0 (0.0%) | 0 (0.0%) |
Employment Characteristics in Fairview
Employment by Class of Employer in Fairview
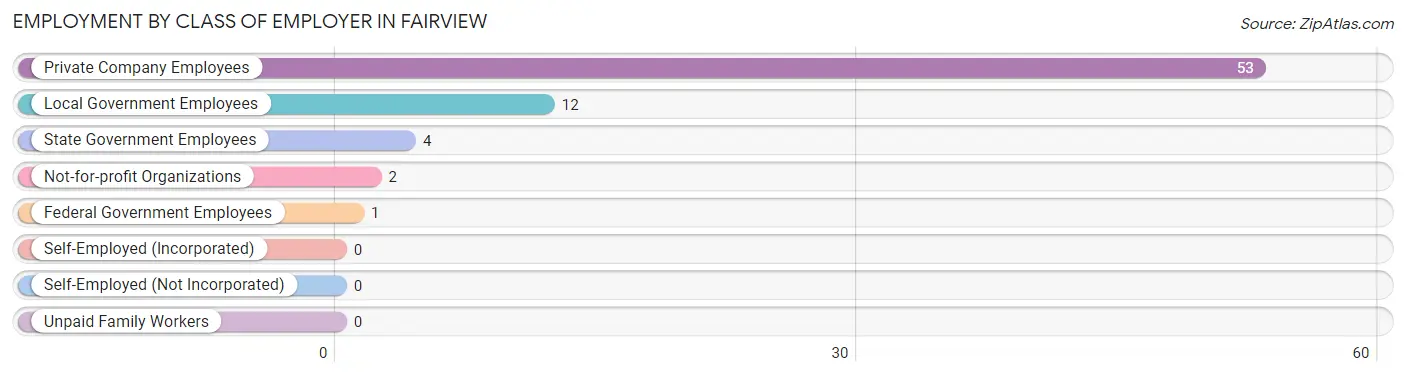
Among the 72 employed individuals in Fairview, private company employees (53 | 73.6%), local government employees (12 | 16.7%), and state government employees (4 | 5.6%) make up the most common classes of employment.
| Employer Class | # Employees | % Employees |
| Private Company Employees | 53 | 73.6% |
| Self-Employed (Incorporated) | 0 | 0.0% |
| Self-Employed (Not Incorporated) | 0 | 0.0% |
| Not-for-profit Organizations | 2 | 2.8% |
| Local Government Employees | 12 | 16.7% |
| State Government Employees | 4 | 5.6% |
| Federal Government Employees | 1 | 1.4% |
| Unpaid Family Workers | 0 | 0.0% |
| Total | 72 | 100.0% |
Employment Status by Age in Fairview
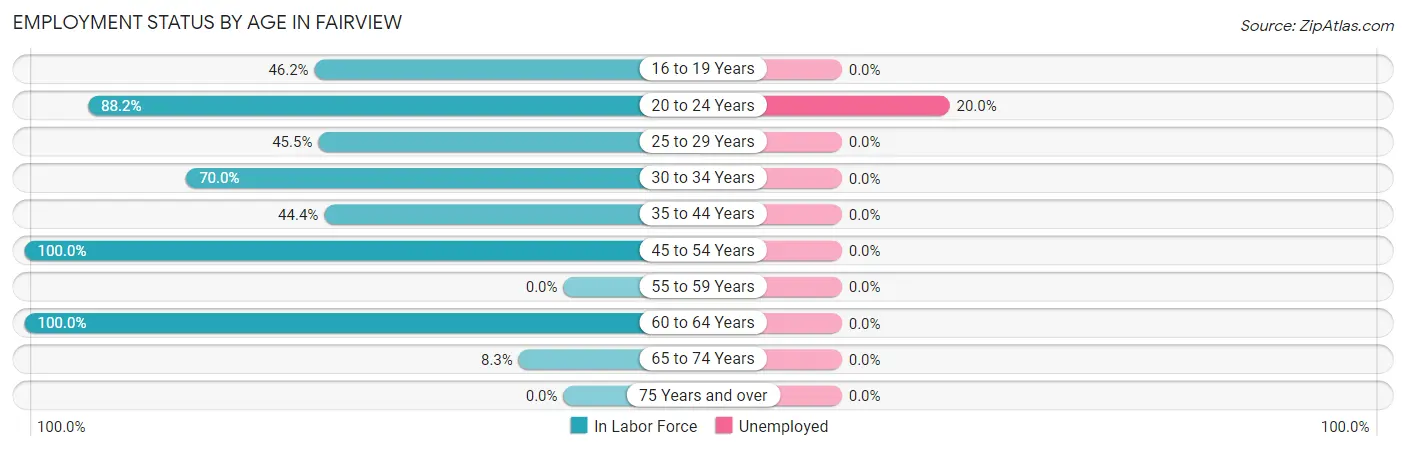
According to the labor force statistics for Fairview, out of the total population over 16 years of age (220), 35.9% or 79 individuals are in the labor force, with 3.8% or 3 of them unemployed. The age group with the highest labor force participation rate is 45 to 54 years, with 100.0% or 19 individuals in the labor force. Within the labor force, the 20 to 24 years age range has the highest percentage of unemployed individuals, with 20.0% or 3 of them being unemployed.
| Age Bracket | In Labor Force | Unemployed |
| 16 to 19 Years | 6 (46.2%) | 0 (0.0%) |
| 20 to 24 Years | 15 (88.2%) | 3 (20.0%) |
| 25 to 29 Years | 5 (45.5%) | 0 (0.0%) |
| 30 to 34 Years | 7 (70.0%) | 0 (0.0%) |
| 35 to 44 Years | 4 (44.4%) | 0 (0.0%) |
| 45 to 54 Years | 19 (100.0%) | 0 (0.0%) |
| 55 to 59 Years | 0 (0.0%) | 0 (0.0%) |
| 60 to 64 Years | 17 (100.0%) | 0 (0.0%) |
| 65 to 74 Years | 6 (8.3%) | 0 (0.0%) |
| 75 Years and over | 0 (0.0%) | 0 (0.0%) |
| Total | 79 (35.9%) | 3 (3.8%) |
Employment Status by Educational Attainment in Fairview
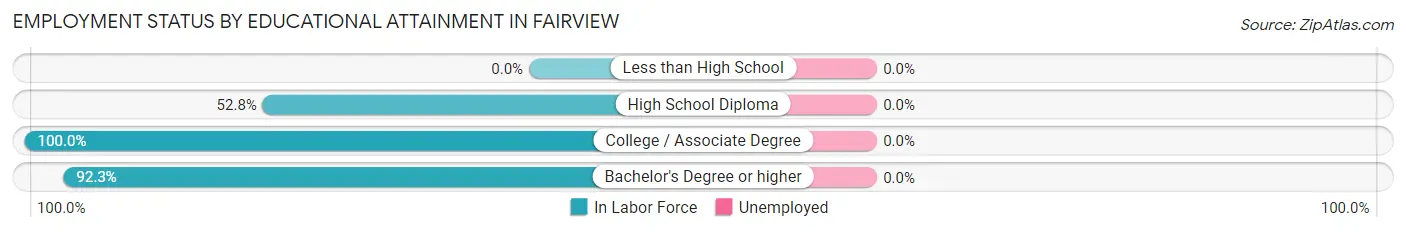
| Educational Attainment | In Labor Force | Unemployed |
| Less than High School | 0 (0.0%) | 0 (0.0%) |
| High School Diploma | 19 (52.8%) | 0 (0.0%) |
| College / Associate Degree | 21 (100.0%) | 0 (0.0%) |
| Bachelor's Degree or higher | 12 (92.3%) | 0 (0.0%) |
| Total | 52 (74.3%) | 0 (0.0%) |
Employment Occupations by Sex in Fairview
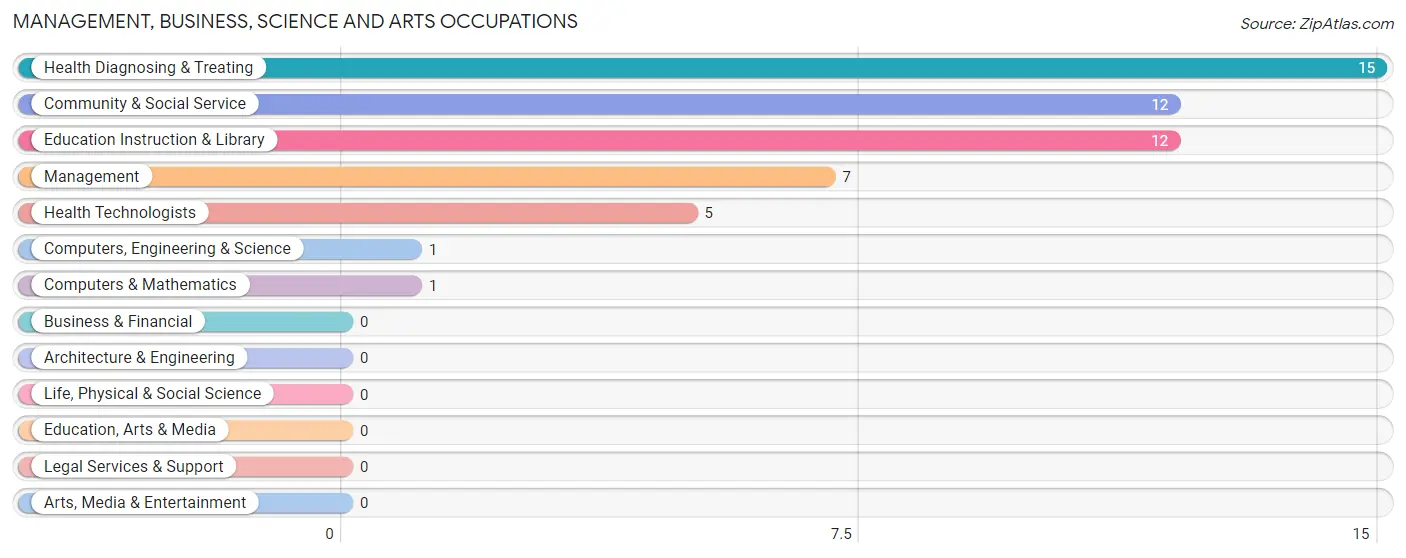
Management, Business, Science and Arts Occupations
The most common Management, Business, Science and Arts occupations in Fairview are Health Diagnosing & Treating (15 | 19.7%), Community & Social Service (12 | 15.8%), Education Instruction & Library (12 | 15.8%), Management (7 | 9.2%), and Health Technologists (5 | 6.6%).
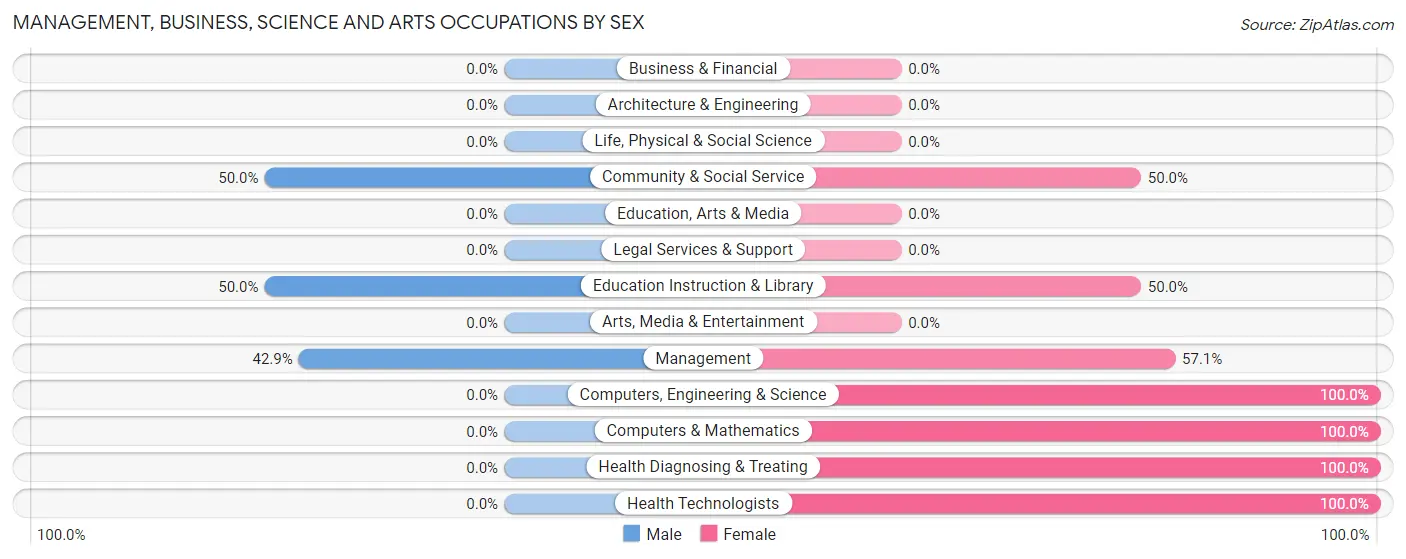
Management, Business, Science and Arts Occupations by Sex
Within the Management, Business, Science and Arts occupations in Fairview, the most male-oriented occupations are Community & Social Service (50.0%), Education Instruction & Library (50.0%), and Management (42.9%), while the most female-oriented occupations are Computers, Engineering & Science (100.0%), Computers & Mathematics (100.0%), and Health Diagnosing & Treating (100.0%).
| Occupation | Male | Female |
| Management | 3 (42.9%) | 4 (57.1%) |
| Business & Financial | 0 (0.0%) | 0 (0.0%) |
| Computers, Engineering & Science | 0 (0.0%) | 1 (100.0%) |
| Computers & Mathematics | 0 (0.0%) | 1 (100.0%) |
| Architecture & Engineering | 0 (0.0%) | 0 (0.0%) |
| Life, Physical & Social Science | 0 (0.0%) | 0 (0.0%) |
| Community & Social Service | 6 (50.0%) | 6 (50.0%) |
| Education, Arts & Media | 0 (0.0%) | 0 (0.0%) |
| Legal Services & Support | 0 (0.0%) | 0 (0.0%) |
| Education Instruction & Library | 6 (50.0%) | 6 (50.0%) |
| Arts, Media & Entertainment | 0 (0.0%) | 0 (0.0%) |
| Health Diagnosing & Treating | 0 (0.0%) | 15 (100.0%) |
| Health Technologists | 0 (0.0%) | 5 (100.0%) |
| Total (Category) | 9 (25.7%) | 26 (74.3%) |
| Total (Overall) | 47 (61.8%) | 29 (38.2%) |
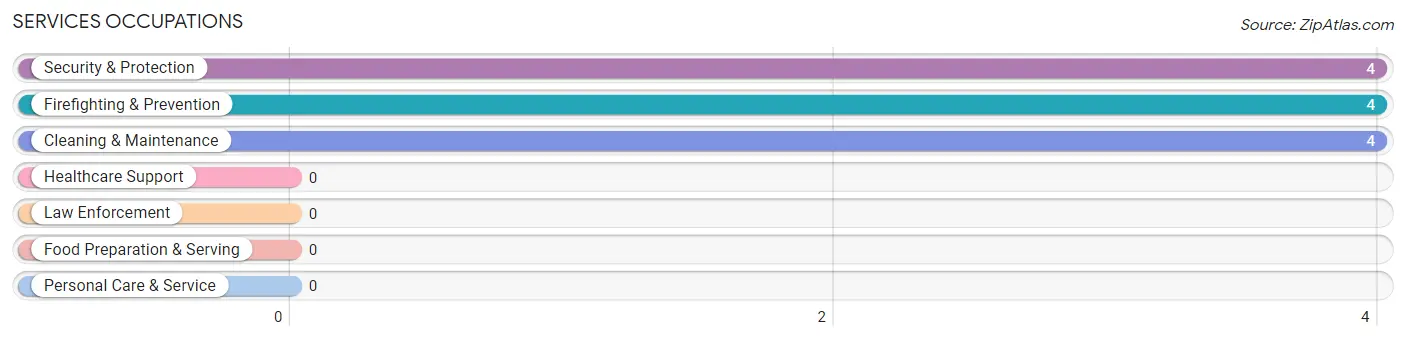
Services Occupations
The most common Services occupations in Fairview are Security & Protection (4 | 5.3%), Firefighting & Prevention (4 | 5.3%), and Cleaning & Maintenance (4 | 5.3%).
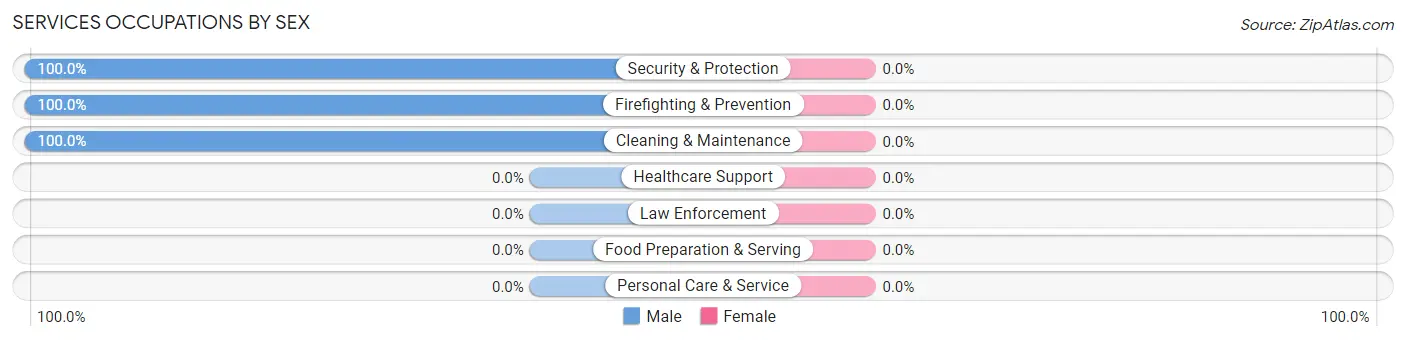
Services Occupations by Sex
| Occupation | Male | Female |
| Healthcare Support | 0 (0.0%) | 0 (0.0%) |
| Security & Protection | 4 (100.0%) | 0 (0.0%) |
| Firefighting & Prevention | 4 (100.0%) | 0 (0.0%) |
| Law Enforcement | 0 (0.0%) | 0 (0.0%) |
| Food Preparation & Serving | 0 (0.0%) | 0 (0.0%) |
| Cleaning & Maintenance | 4 (100.0%) | 0 (0.0%) |
| Personal Care & Service | 0 (0.0%) | 0 (0.0%) |
| Total (Category) | 8 (100.0%) | 0 (0.0%) |
| Total (Overall) | 47 (61.8%) | 29 (38.2%) |
Sales and Office Occupations
The most common Sales and Office occupations in Fairview are Sales & Related (3 | 4.0%), and Office & Administration (3 | 4.0%).

Sales and Office Occupations by Sex

| Occupation | Male | Female |
| Sales & Related | 3 (100.0%) | 0 (0.0%) |
| Office & Administration | 0 (0.0%) | 3 (100.0%) |
| Total (Category) | 3 (50.0%) | 3 (50.0%) |
| Total (Overall) | 47 (61.8%) | 29 (38.2%) |
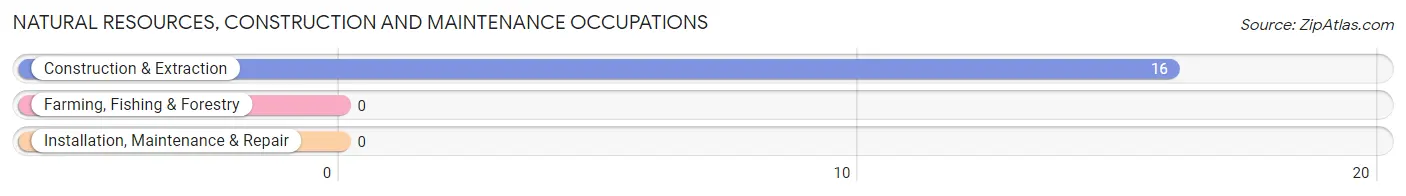
Natural Resources, Construction and Maintenance Occupations
The most common Natural Resources, Construction and Maintenance occupations in Fairview are , and Construction & Extraction (16 | 21.0%).
Natural Resources, Construction and Maintenance Occupations by Sex
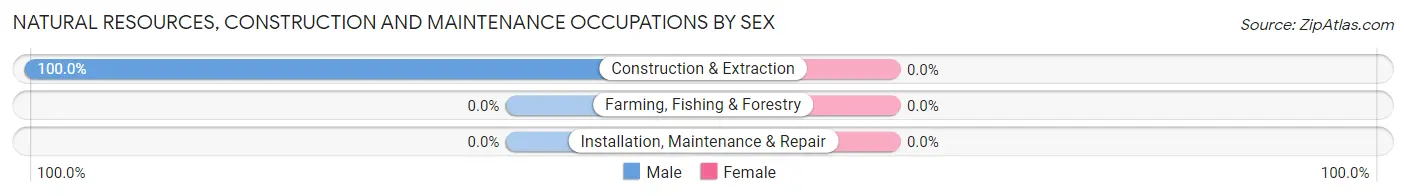
| Occupation | Male | Female |
| Farming, Fishing & Forestry | 0 (0.0%) | 0 (0.0%) |
| Construction & Extraction | 16 (100.0%) | 0 (0.0%) |
| Installation, Maintenance & Repair | 0 (0.0%) | 0 (0.0%) |
| Total (Category) | 16 (100.0%) | 0 (0.0%) |
| Total (Overall) | 47 (61.8%) | 29 (38.2%) |
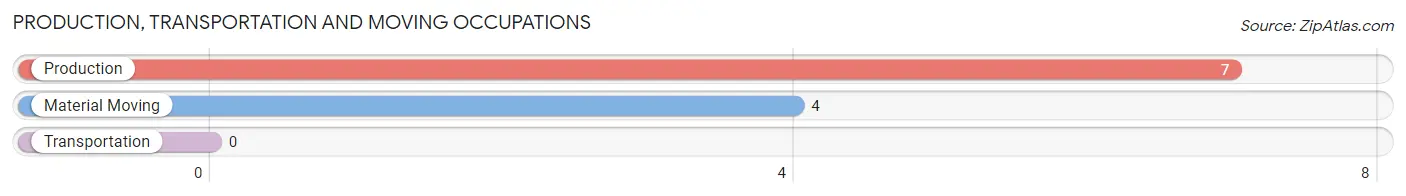
Production, Transportation and Moving Occupations
The most common Production, Transportation and Moving occupations in Fairview are Production (7 | 9.2%), and Material Moving (4 | 5.3%).
Production, Transportation and Moving Occupations by Sex
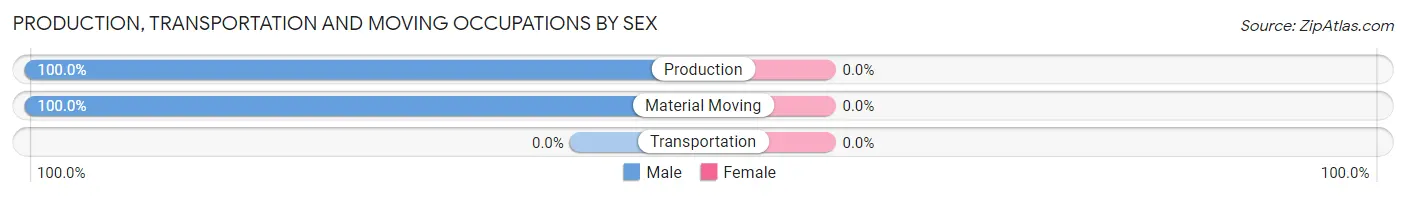
| Occupation | Male | Female |
| Production | 7 (100.0%) | 0 (0.0%) |
| Transportation | 0 (0.0%) | 0 (0.0%) |
| Material Moving | 4 (100.0%) | 0 (0.0%) |
| Total (Category) | 11 (100.0%) | 0 (0.0%) |
| Total (Overall) | 47 (61.8%) | 29 (38.2%) |
Employment Industries by Sex in Fairview
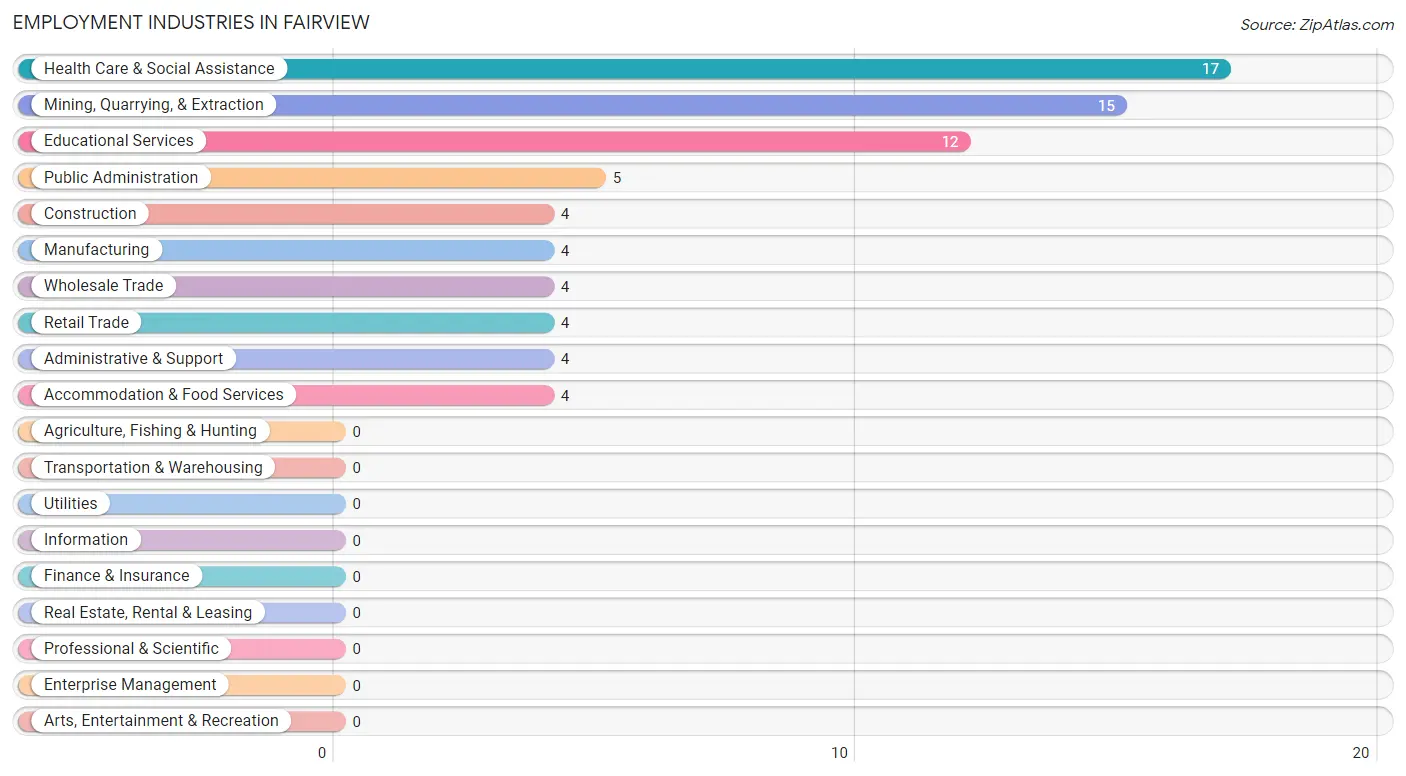
Employment Industries in Fairview
The major employment industries in Fairview include Health Care & Social Assistance (17 | 22.4%), Mining, Quarrying, & Extraction (15 | 19.7%), Educational Services (12 | 15.8%), Public Administration (5 | 6.6%), and Construction (4 | 5.3%).
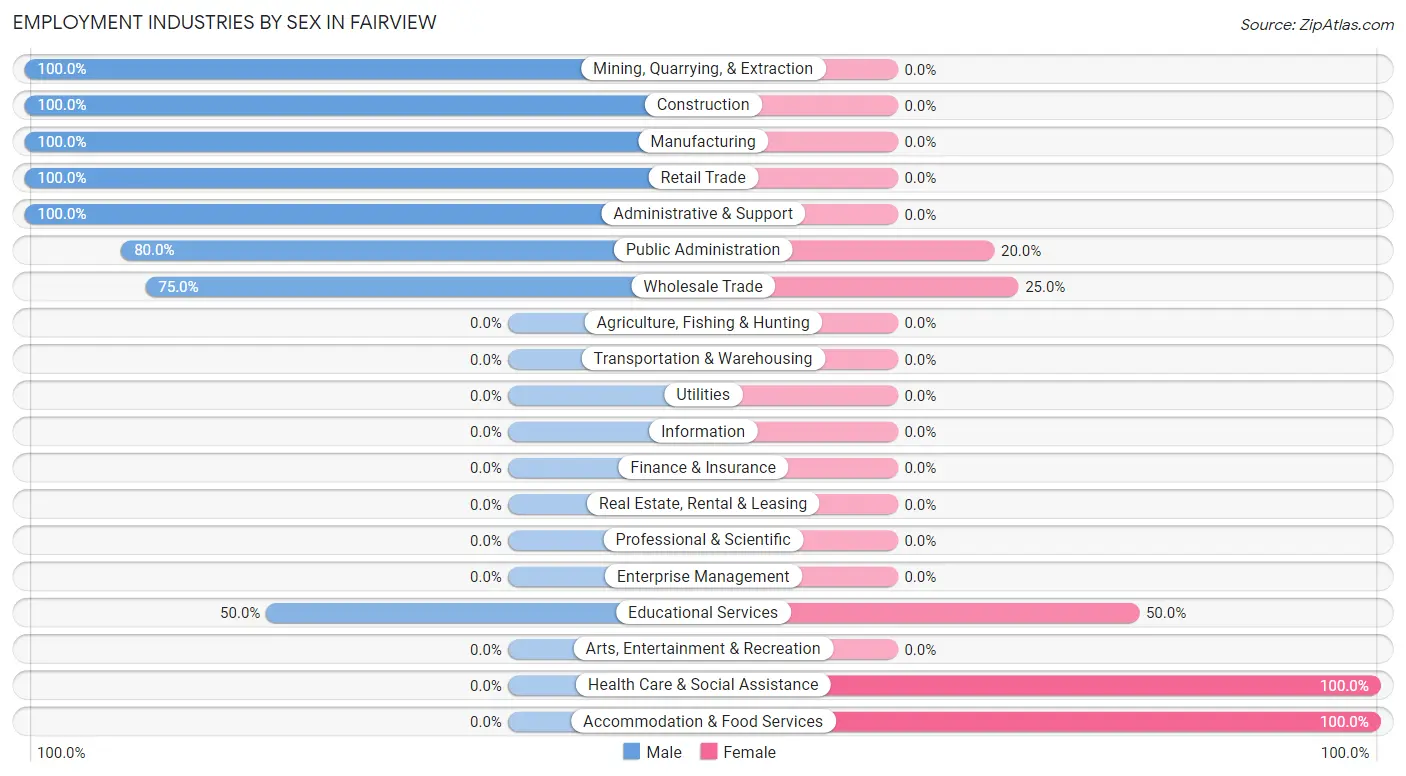
Employment Industries by Sex in Fairview
The Fairview industries that see more men than women are Mining, Quarrying, & Extraction (100.0%), Construction (100.0%), and Manufacturing (100.0%), whereas the industries that tend to have a higher number of women are Health Care & Social Assistance (100.0%), Accommodation & Food Services (100.0%), and Educational Services (50.0%).
| Industry | Male | Female |
| Agriculture, Fishing & Hunting | 0 (0.0%) | 0 (0.0%) |
| Mining, Quarrying, & Extraction | 15 (100.0%) | 0 (0.0%) |
| Construction | 4 (100.0%) | 0 (0.0%) |
| Manufacturing | 4 (100.0%) | 0 (0.0%) |
| Wholesale Trade | 3 (75.0%) | 1 (25.0%) |
| Retail Trade | 4 (100.0%) | 0 (0.0%) |
| Transportation & Warehousing | 0 (0.0%) | 0 (0.0%) |
| Utilities | 0 (0.0%) | 0 (0.0%) |
| Information | 0 (0.0%) | 0 (0.0%) |
| Finance & Insurance | 0 (0.0%) | 0 (0.0%) |
| Real Estate, Rental & Leasing | 0 (0.0%) | 0 (0.0%) |
| Professional & Scientific | 0 (0.0%) | 0 (0.0%) |
| Enterprise Management | 0 (0.0%) | 0 (0.0%) |
| Administrative & Support | 4 (100.0%) | 0 (0.0%) |
| Educational Services | 6 (50.0%) | 6 (50.0%) |
| Health Care & Social Assistance | 0 (0.0%) | 17 (100.0%) |
| Arts, Entertainment & Recreation | 0 (0.0%) | 0 (0.0%) |
| Accommodation & Food Services | 0 (0.0%) | 4 (100.0%) |
| Public Administration | 4 (80.0%) | 1 (20.0%) |
| Total | 47 (61.8%) | 29 (38.2%) |
Education in Fairview
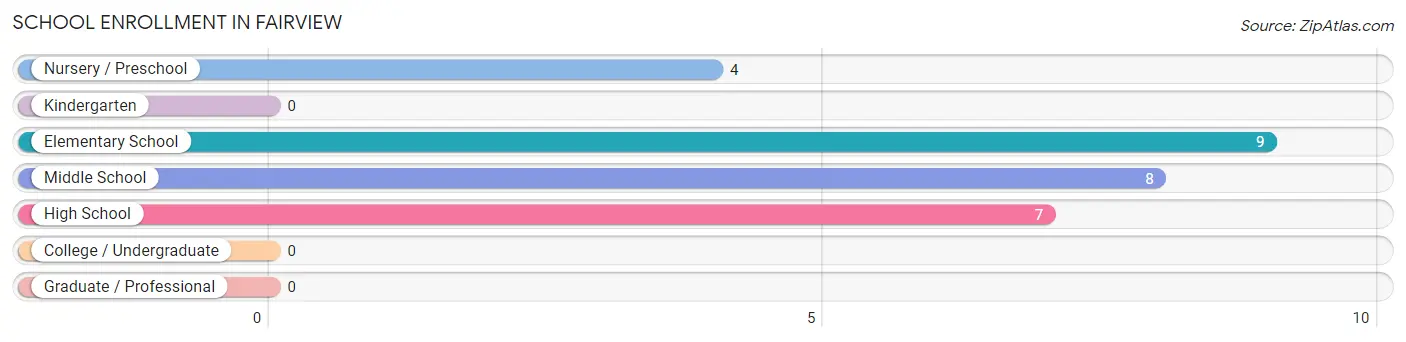
School Enrollment in Fairview
The most common levels of schooling among the 28 students in Fairview are elementary school (9 | 32.1%), middle school (8 | 28.6%), and high school (7 | 25.0%).
| School Level | # Students | % Students |
| Nursery / Preschool | 4 | 14.3% |
| Kindergarten | 0 | 0.0% |
| Elementary School | 9 | 32.1% |
| Middle School | 8 | 28.6% |
| High School | 7 | 25.0% |
| College / Undergraduate | 0 | 0.0% |
| Graduate / Professional | 0 | 0.0% |
| Total | 28 | 100.0% |
School Enrollment by Age by Funding Source in Fairview
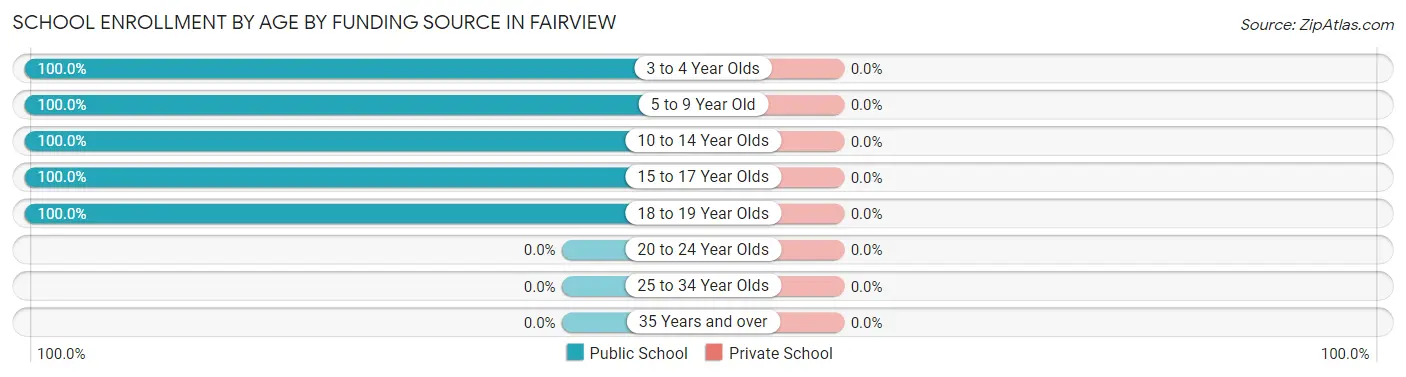
| Age Bracket | Public School | Private School |
| 3 to 4 Year Olds | 4 (100.0%) | 0 (0.0%) |
| 5 to 9 Year Old | 9 (100.0%) | 0 (0.0%) |
| 10 to 14 Year Olds | 8 (100.0%) | 0 (0.0%) |
| 15 to 17 Year Olds | 1 (100.0%) | 0 (0.0%) |
| 18 to 19 Year Olds | 6 (100.0%) | 0 (0.0%) |
| 20 to 24 Year Olds | 0 (0.0%) | 0 (0.0%) |
| 25 to 34 Year Olds | 0 (0.0%) | 0 (0.0%) |
| 35 Years and over | 0 (0.0%) | 0 (0.0%) |
| Total | 28 (100.0%) | 0 (0.0%) |
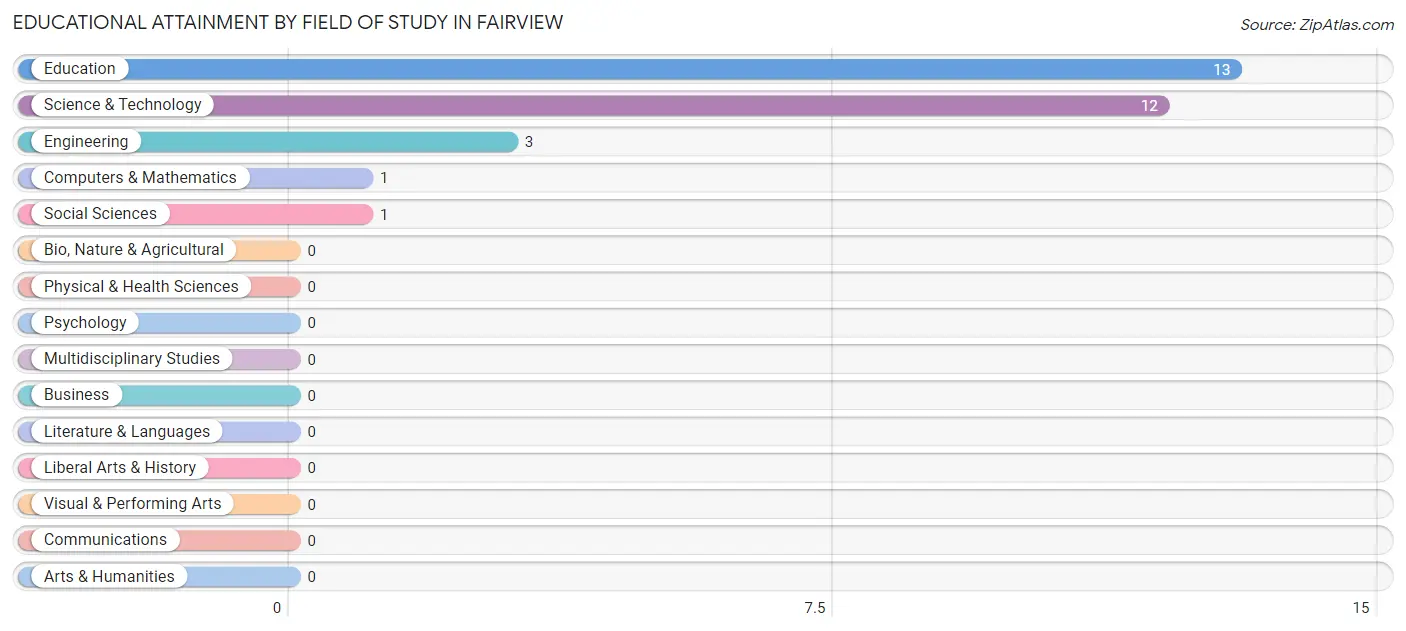
Educational Attainment by Field of Study in Fairview
Education (13 | 43.3%), science & technology (12 | 40.0%), engineering (3 | 10.0%), computers & mathematics (1 | 3.3%), and social sciences (1 | 3.3%) are the most common fields of study among 30 individuals in Fairview who have obtained a bachelor's degree or higher.
| Field of Study | # Graduates | % Graduates |
| Computers & Mathematics | 1 | 3.3% |
| Bio, Nature & Agricultural | 0 | 0.0% |
| Physical & Health Sciences | 0 | 0.0% |
| Psychology | 0 | 0.0% |
| Social Sciences | 1 | 3.3% |
| Engineering | 3 | 10.0% |
| Multidisciplinary Studies | 0 | 0.0% |
| Science & Technology | 12 | 40.0% |
| Business | 0 | 0.0% |
| Education | 13 | 43.3% |
| Literature & Languages | 0 | 0.0% |
| Liberal Arts & History | 0 | 0.0% |
| Visual & Performing Arts | 0 | 0.0% |
| Communications | 0 | 0.0% |
| Arts & Humanities | 0 | 0.0% |
| Total | 30 | 100.0% |
Transportation & Commute in Fairview
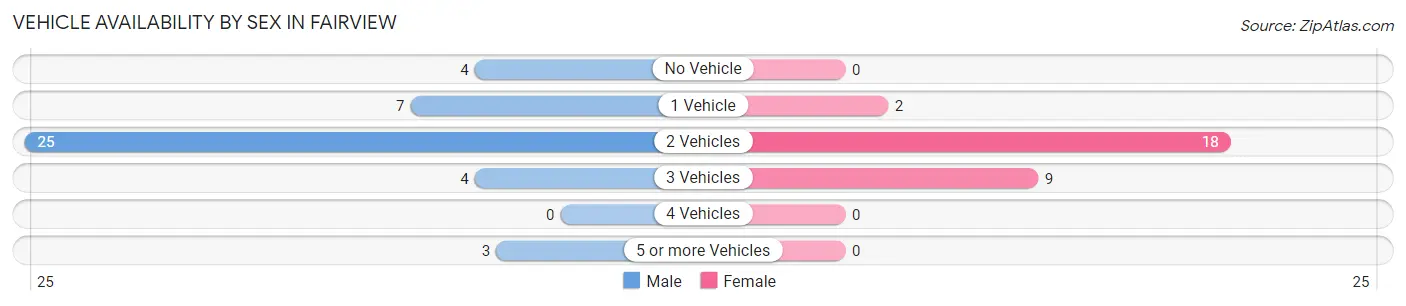
Vehicle Availability by Sex in Fairview
The most prevalent vehicle ownership categories in Fairview are males with 2 vehicles (25, accounting for 58.1%) and females with 2 vehicles (18, making up 86.2%).
| Vehicles Available | Male | Female |
| No Vehicle | 4 (9.3%) | 0 (0.0%) |
| 1 Vehicle | 7 (16.3%) | 2 (6.9%) |
| 2 Vehicles | 25 (58.1%) | 18 (62.1%) |
| 3 Vehicles | 4 (9.3%) | 9 (31.0%) |
| 4 Vehicles | 0 (0.0%) | 0 (0.0%) |
| 5 or more Vehicles | 3 (7.0%) | 0 (0.0%) |
| Total | 43 (100.0%) | 29 (100.0%) |
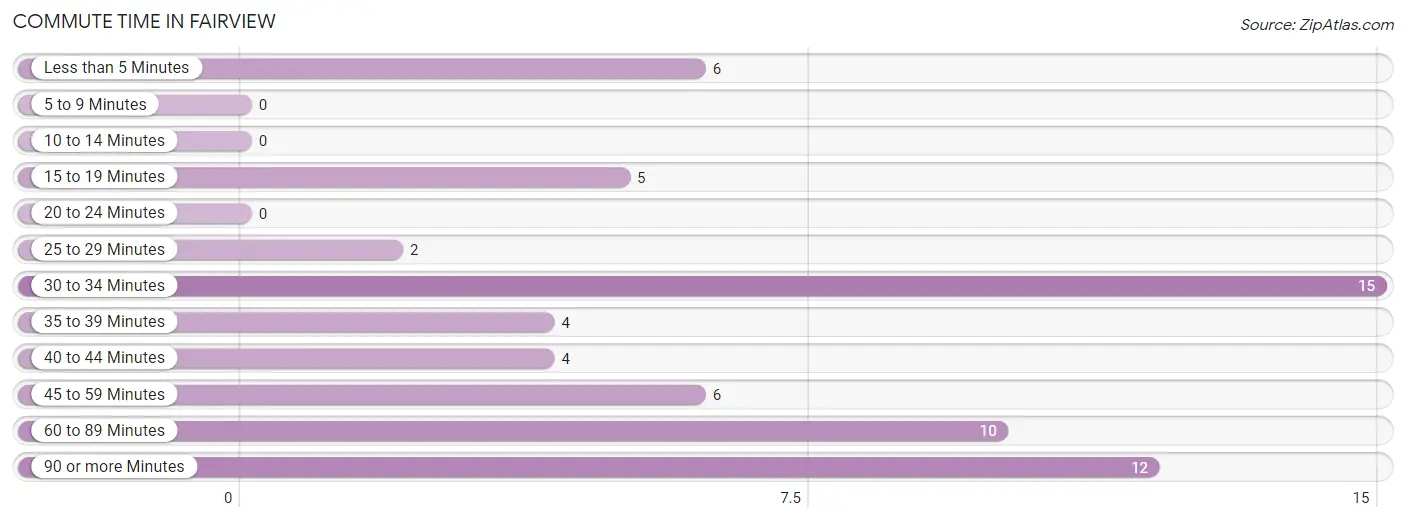
Commute Time in Fairview
The most frequently occuring commute durations in Fairview are 30 to 34 minutes (15 commuters, 23.4%), 90 or more minutes (12 commuters, 18.8%), and 60 to 89 minutes (10 commuters, 15.6%).
| Commute Time | # Commuters | % Commuters |
| Less than 5 Minutes | 6 | 9.4% |
| 5 to 9 Minutes | 0 | 0.0% |
| 10 to 14 Minutes | 0 | 0.0% |
| 15 to 19 Minutes | 5 | 7.8% |
| 20 to 24 Minutes | 0 | 0.0% |
| 25 to 29 Minutes | 2 | 3.1% |
| 30 to 34 Minutes | 15 | 23.4% |
| 35 to 39 Minutes | 4 | 6.2% |
| 40 to 44 Minutes | 4 | 6.2% |
| 45 to 59 Minutes | 6 | 9.4% |
| 60 to 89 Minutes | 10 | 15.6% |
| 90 or more Minutes | 12 | 18.8% |
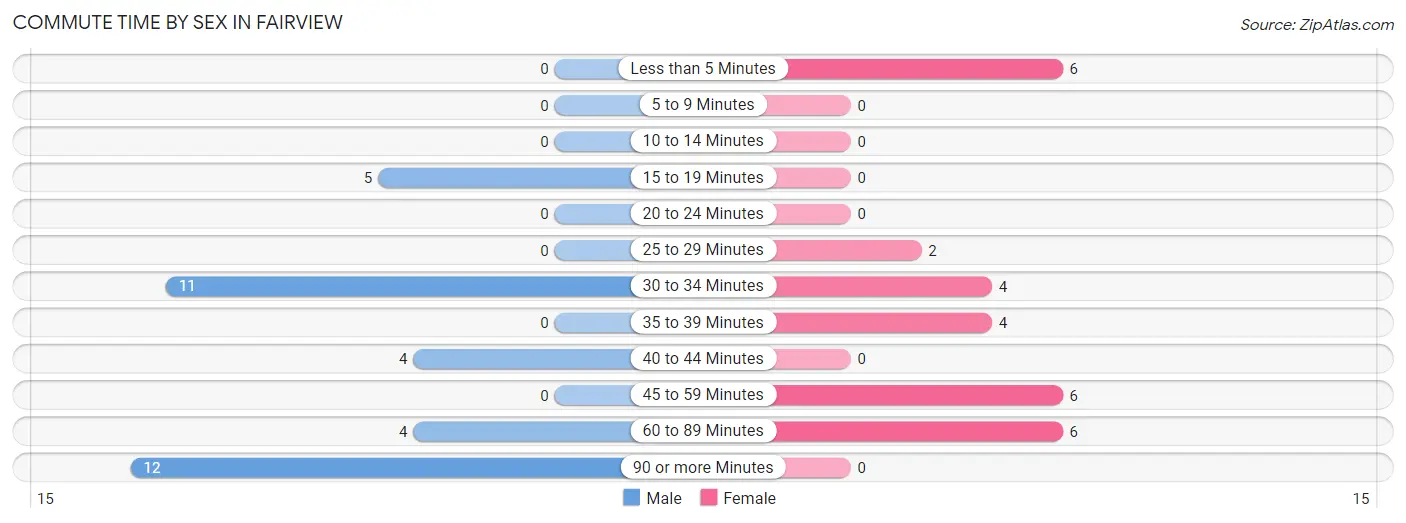
Commute Time by Sex in Fairview
The most common commute times in Fairview are 90 or more minutes (12 commuters, 33.3%) for males and less than 5 minutes (6 commuters, 21.4%) for females.
| Commute Time | Male | Female |
| Less than 5 Minutes | 0 (0.0%) | 6 (21.4%) |
| 5 to 9 Minutes | 0 (0.0%) | 0 (0.0%) |
| 10 to 14 Minutes | 0 (0.0%) | 0 (0.0%) |
| 15 to 19 Minutes | 5 (13.9%) | 0 (0.0%) |
| 20 to 24 Minutes | 0 (0.0%) | 0 (0.0%) |
| 25 to 29 Minutes | 0 (0.0%) | 2 (7.1%) |
| 30 to 34 Minutes | 11 (30.6%) | 4 (14.3%) |
| 35 to 39 Minutes | 0 (0.0%) | 4 (14.3%) |
| 40 to 44 Minutes | 4 (11.1%) | 0 (0.0%) |
| 45 to 59 Minutes | 0 (0.0%) | 6 (21.4%) |
| 60 to 89 Minutes | 4 (11.1%) | 6 (21.4%) |
| 90 or more Minutes | 12 (33.3%) | 0 (0.0%) |
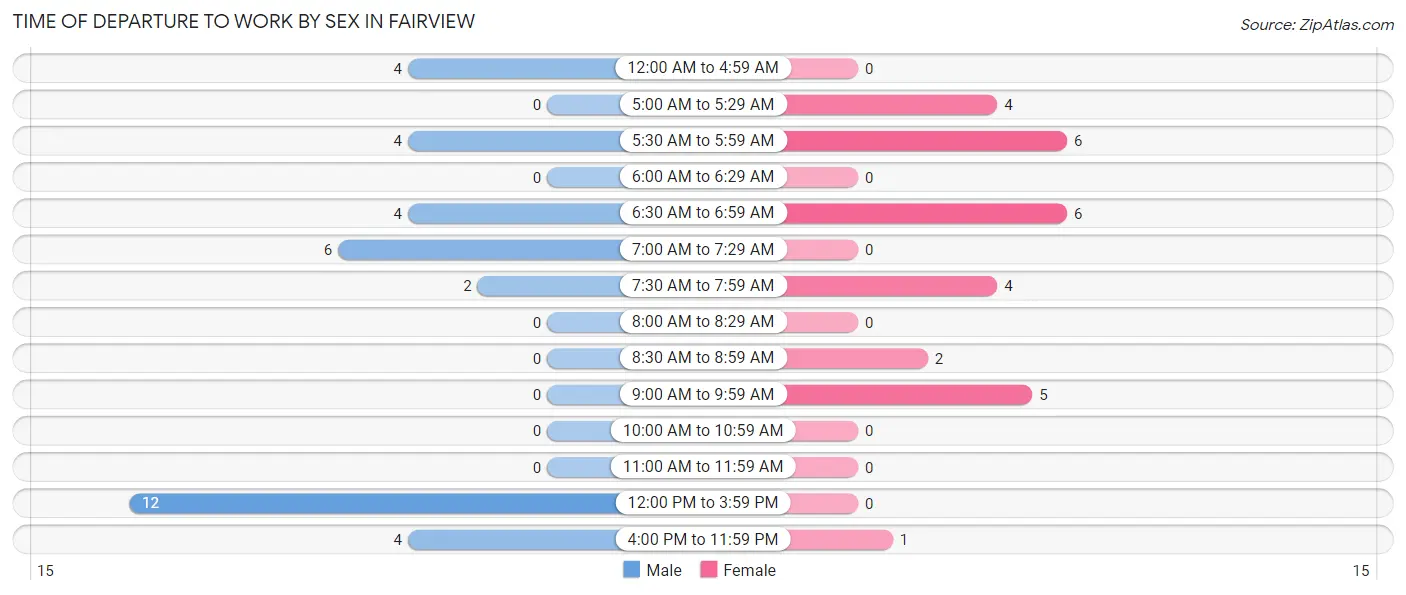
Time of Departure to Work by Sex in Fairview
The most frequent times of departure to work in Fairview are 12:00 PM to 3:59 PM (12, 33.3%) for males and 5:30 AM to 5:59 AM (6, 21.4%) for females.
| Time of Departure | Male | Female |
| 12:00 AM to 4:59 AM | 4 (11.1%) | 0 (0.0%) |
| 5:00 AM to 5:29 AM | 0 (0.0%) | 4 (14.3%) |
| 5:30 AM to 5:59 AM | 4 (11.1%) | 6 (21.4%) |
| 6:00 AM to 6:29 AM | 0 (0.0%) | 0 (0.0%) |
| 6:30 AM to 6:59 AM | 4 (11.1%) | 6 (21.4%) |
| 7:00 AM to 7:29 AM | 6 (16.7%) | 0 (0.0%) |
| 7:30 AM to 7:59 AM | 2 (5.6%) | 4 (14.3%) |
| 8:00 AM to 8:29 AM | 0 (0.0%) | 0 (0.0%) |
| 8:30 AM to 8:59 AM | 0 (0.0%) | 2 (7.1%) |
| 9:00 AM to 9:59 AM | 0 (0.0%) | 5 (17.9%) |
| 10:00 AM to 10:59 AM | 0 (0.0%) | 0 (0.0%) |
| 11:00 AM to 11:59 AM | 0 (0.0%) | 0 (0.0%) |
| 12:00 PM to 3:59 PM | 12 (33.3%) | 0 (0.0%) |
| 4:00 PM to 11:59 PM | 4 (11.1%) | 1 (3.6%) |
| Total | 36 (100.0%) | 28 (100.0%) |
Housing Occupancy in Fairview
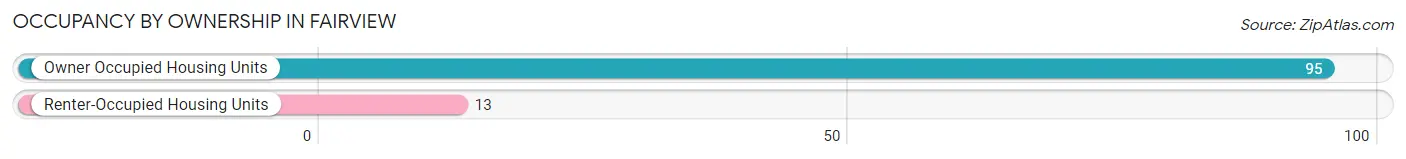
Occupancy by Ownership in Fairview
Of the total 108 dwellings in Fairview, owner-occupied units account for 95 (88.0%), while renter-occupied units make up 13 (12.0%).
| Occupancy | # Housing Units | % Housing Units |
| Owner Occupied Housing Units | 95 | 88.0% |
| Renter-Occupied Housing Units | 13 | 12.0% |
| Total Occupied Housing Units | 108 | 100.0% |
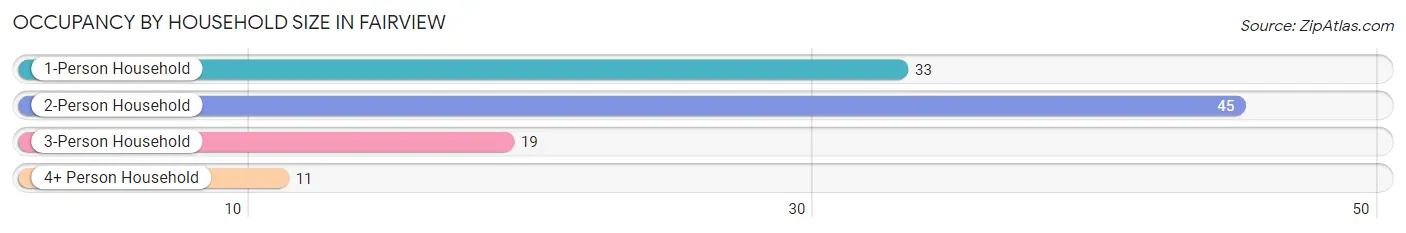
Occupancy by Household Size in Fairview
| Household Size | # Housing Units | % Housing Units |
| 1-Person Household | 33 | 30.6% |
| 2-Person Household | 45 | 41.7% |
| 3-Person Household | 19 | 17.6% |
| 4+ Person Household | 11 | 10.2% |
| Total Housing Units | 108 | 100.0% |
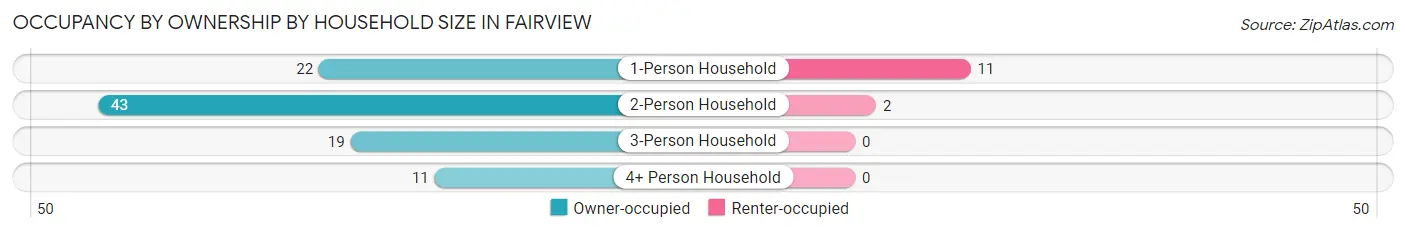
Occupancy by Ownership by Household Size in Fairview
| Household Size | Owner-occupied | Renter-occupied |
| 1-Person Household | 22 (66.7%) | 11 (33.3%) |
| 2-Person Household | 43 (95.6%) | 2 (4.4%) |
| 3-Person Household | 19 (100.0%) | 0 (0.0%) |
| 4+ Person Household | 11 (100.0%) | 0 (0.0%) |
| Total Housing Units | 95 (88.0%) | 13 (12.0%) |
Occupancy by Educational Attainment in Fairview
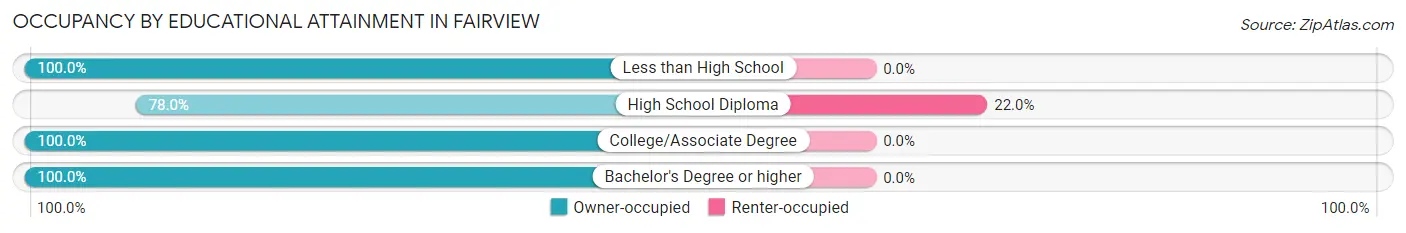
| Household Size | Owner-occupied | Renter-occupied |
| Less than High School | 5 (100.0%) | 0 (0.0%) |
| High School Diploma | 46 (78.0%) | 13 (22.0%) |
| College/Associate Degree | 24 (100.0%) | 0 (0.0%) |
| Bachelor's Degree or higher | 20 (100.0%) | 0 (0.0%) |
Occupancy by Age of Householder in Fairview
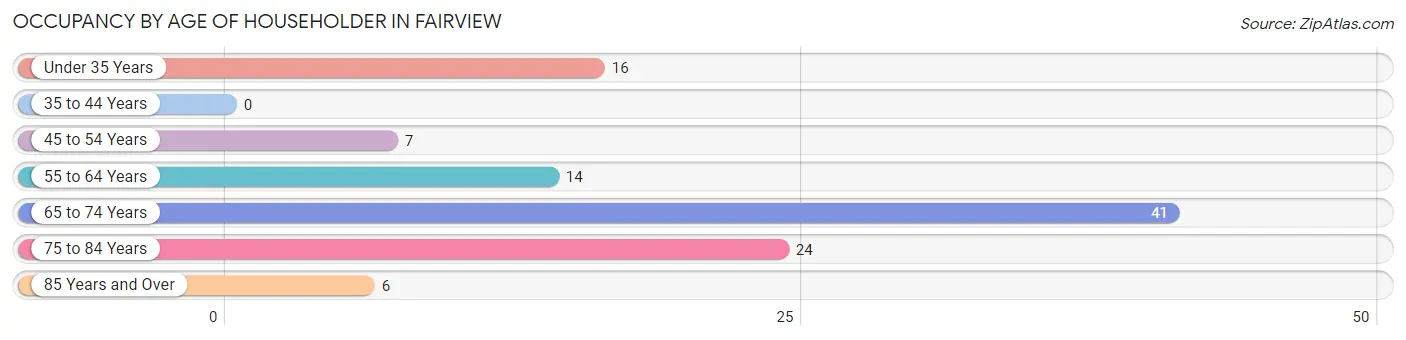
| Age Bracket | # Households | % Households |
| Under 35 Years | 16 | 14.8% |
| 35 to 44 Years | 0 | 0.0% |
| 45 to 54 Years | 7 | 6.5% |
| 55 to 64 Years | 14 | 13.0% |
| 65 to 74 Years | 41 | 38.0% |
| 75 to 84 Years | 24 | 22.2% |
| 85 Years and Over | 6 | 5.6% |
| Total | 108 | 100.0% |
Housing Finances in Fairview
Median Income by Occupancy in Fairview
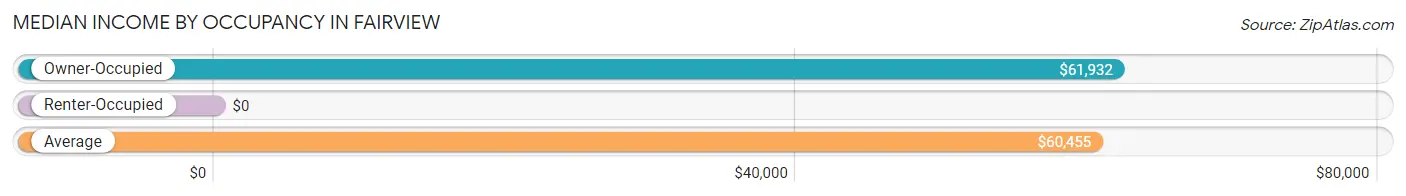
| Occupancy Type | # Households | Median Income |
| Owner-Occupied | 95 (88.0%) | $61,932 |
| Renter-Occupied | 13 (12.0%) | $0 |
| Average | 108 (100.0%) | $60,455 |
Occupancy by Householder Income Bracket in Fairview
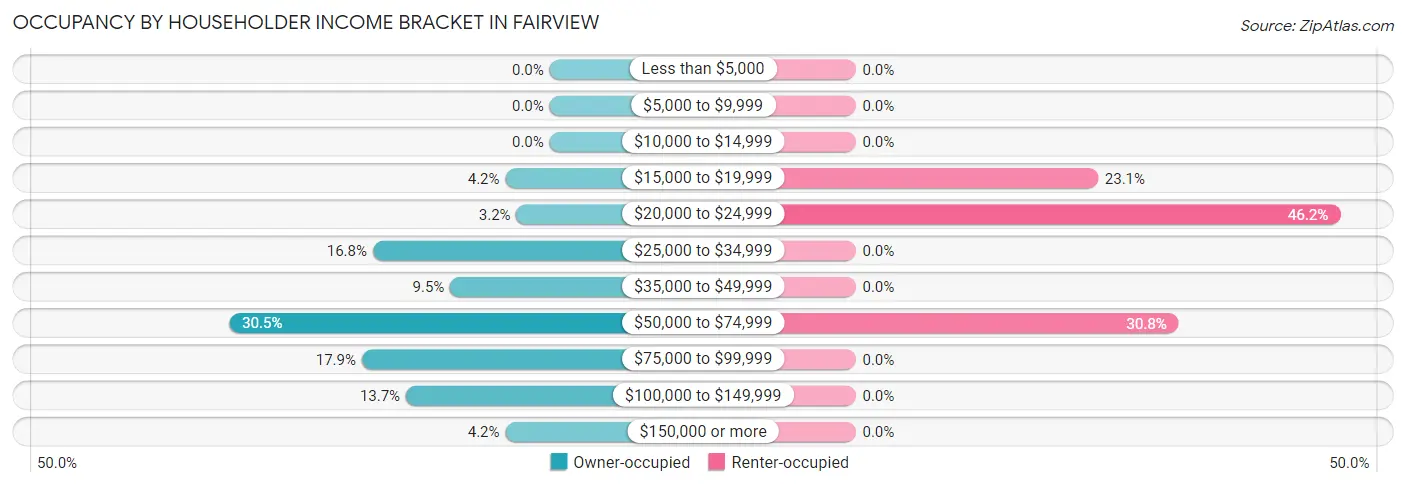
| Income Bracket | Owner-occupied | Renter-occupied |
| Less than $5,000 | 0 (0.0%) | 0 (0.0%) |
| $5,000 to $9,999 | 0 (0.0%) | 0 (0.0%) |
| $10,000 to $14,999 | 0 (0.0%) | 0 (0.0%) |
| $15,000 to $19,999 | 4 (4.2%) | 3 (23.1%) |
| $20,000 to $24,999 | 3 (3.2%) | 6 (46.2%) |
| $25,000 to $34,999 | 16 (16.8%) | 0 (0.0%) |
| $35,000 to $49,999 | 9 (9.5%) | 0 (0.0%) |
| $50,000 to $74,999 | 29 (30.5%) | 4 (30.8%) |
| $75,000 to $99,999 | 17 (17.9%) | 0 (0.0%) |
| $100,000 to $149,999 | 13 (13.7%) | 0 (0.0%) |
| $150,000 or more | 4 (4.2%) | 0 (0.0%) |
| Total | 95 (100.0%) | 13 (100.0%) |
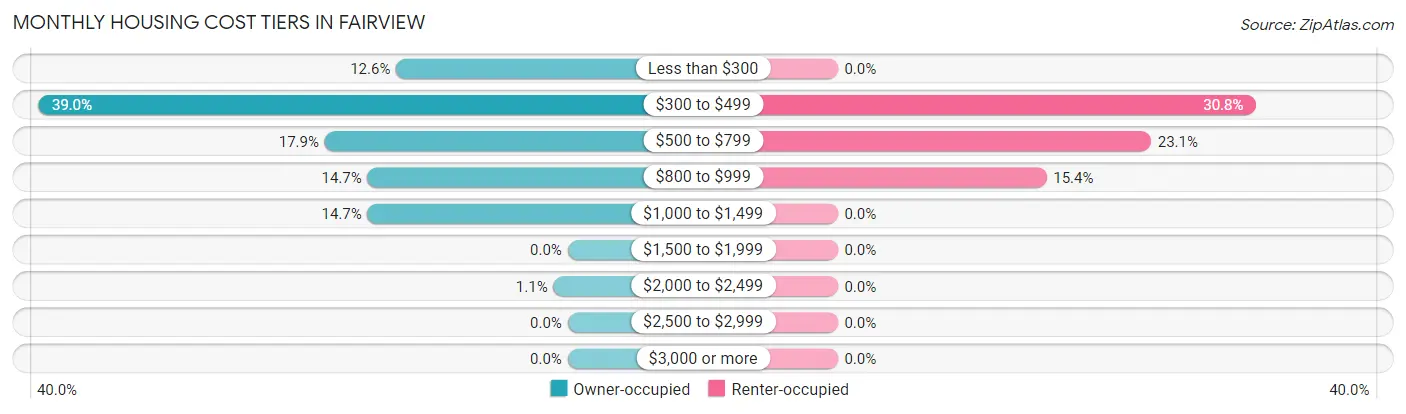
Monthly Housing Cost Tiers in Fairview
| Monthly Cost | Owner-occupied | Renter-occupied |
| Less than $300 | 12 (12.6%) | 0 (0.0%) |
| $300 to $499 | 37 (39.0%) | 4 (30.8%) |
| $500 to $799 | 17 (17.9%) | 3 (23.1%) |
| $800 to $999 | 14 (14.7%) | 2 (15.4%) |
| $1,000 to $1,499 | 14 (14.7%) | 0 (0.0%) |
| $1,500 to $1,999 | 0 (0.0%) | 0 (0.0%) |
| $2,000 to $2,499 | 1 (1.1%) | 0 (0.0%) |
| $2,500 to $2,999 | 0 (0.0%) | 0 (0.0%) |
| $3,000 or more | 0 (0.0%) | 0 (0.0%) |
| Total | 95 (100.0%) | 13 (100.0%) |
Physical Housing Characteristics in Fairview
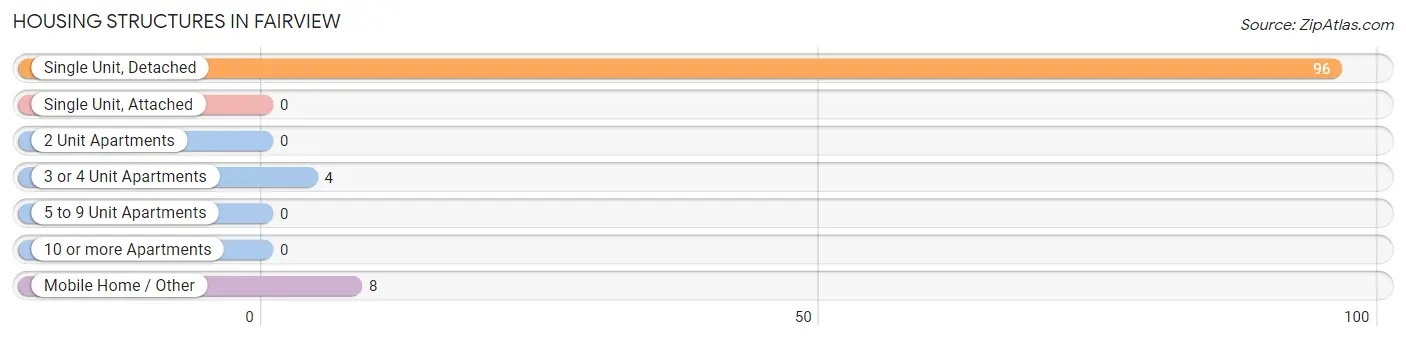
Housing Structures in Fairview
| Structure Type | # Housing Units | % Housing Units |
| Single Unit, Detached | 96 | 88.9% |
| Single Unit, Attached | 0 | 0.0% |
| 2 Unit Apartments | 0 | 0.0% |
| 3 or 4 Unit Apartments | 4 | 3.7% |
| 5 to 9 Unit Apartments | 0 | 0.0% |
| 10 or more Apartments | 0 | 0.0% |
| Mobile Home / Other | 8 | 7.4% |
| Total | 108 | 100.0% |
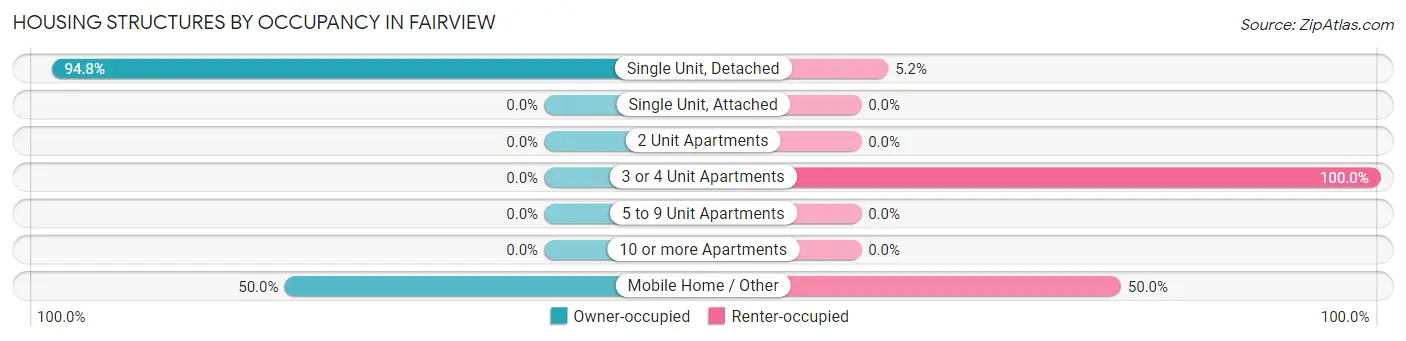
Housing Structures by Occupancy in Fairview
| Structure Type | Owner-occupied | Renter-occupied |
| Single Unit, Detached | 91 (94.8%) | 5 (5.2%) |
| Single Unit, Attached | 0 (0.0%) | 0 (0.0%) |
| 2 Unit Apartments | 0 (0.0%) | 0 (0.0%) |
| 3 or 4 Unit Apartments | 0 (0.0%) | 4 (100.0%) |
| 5 to 9 Unit Apartments | 0 (0.0%) | 0 (0.0%) |
| 10 or more Apartments | 0 (0.0%) | 0 (0.0%) |
| Mobile Home / Other | 4 (50.0%) | 4 (50.0%) |
| Total | 95 (88.0%) | 13 (12.0%) |
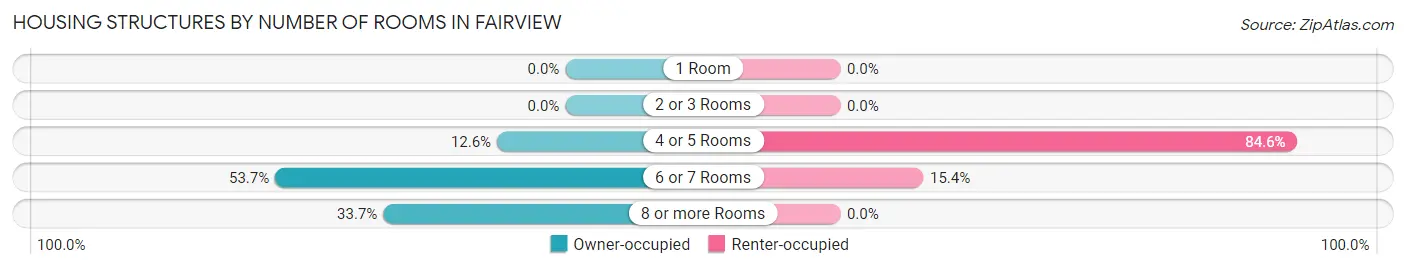
Housing Structures by Number of Rooms in Fairview
| Number of Rooms | Owner-occupied | Renter-occupied |
| 1 Room | 0 (0.0%) | 0 (0.0%) |
| 2 or 3 Rooms | 0 (0.0%) | 0 (0.0%) |
| 4 or 5 Rooms | 12 (12.6%) | 11 (84.6%) |
| 6 or 7 Rooms | 51 (53.7%) | 2 (15.4%) |
| 8 or more Rooms | 32 (33.7%) | 0 (0.0%) |
| Total | 95 (100.0%) | 13 (100.0%) |
Housing Structure by Heating Type in Fairview
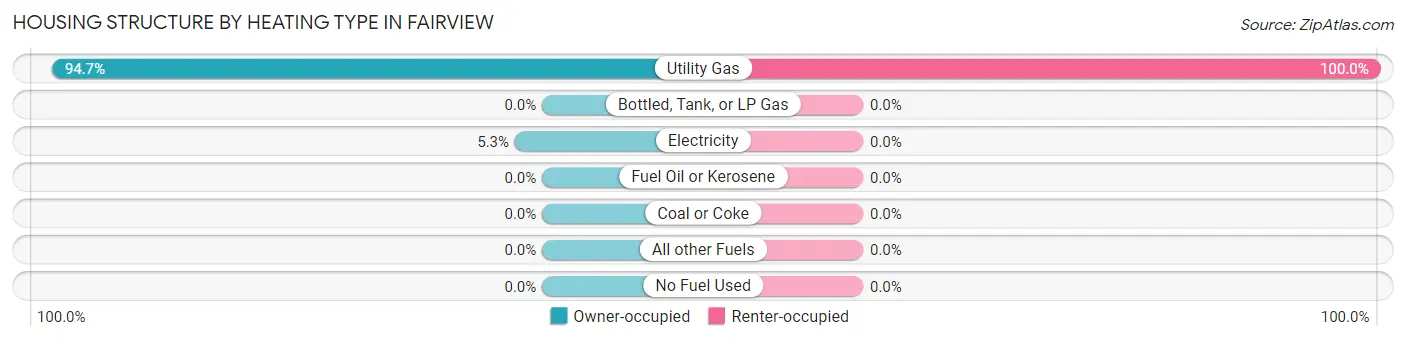
| Heating Type | Owner-occupied | Renter-occupied |
| Utility Gas | 90 (94.7%) | 13 (100.0%) |
| Bottled, Tank, or LP Gas | 0 (0.0%) | 0 (0.0%) |
| Electricity | 5 (5.3%) | 0 (0.0%) |
| Fuel Oil or Kerosene | 0 (0.0%) | 0 (0.0%) |
| Coal or Coke | 0 (0.0%) | 0 (0.0%) |
| All other Fuels | 0 (0.0%) | 0 (0.0%) |
| No Fuel Used | 0 (0.0%) | 0 (0.0%) |
| Total | 95 (100.0%) | 13 (100.0%) |
Household Vehicle Usage in Fairview
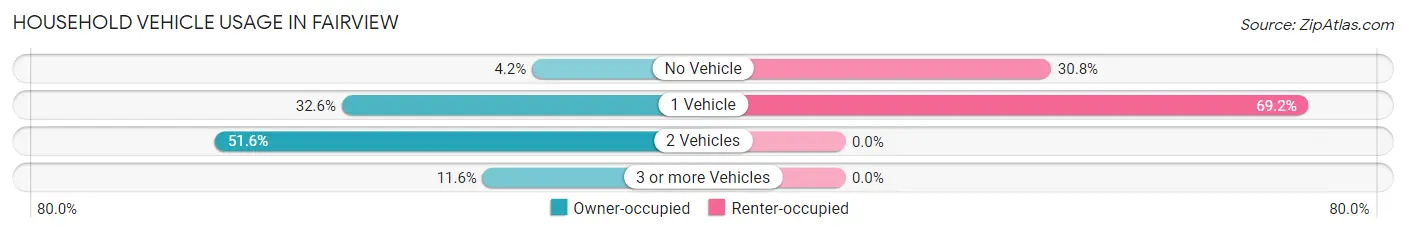
| Vehicles per Household | Owner-occupied | Renter-occupied |
| No Vehicle | 4 (4.2%) | 4 (30.8%) |
| 1 Vehicle | 31 (32.6%) | 9 (69.2%) |
| 2 Vehicles | 49 (51.6%) | 0 (0.0%) |
| 3 or more Vehicles | 11 (11.6%) | 0 (0.0%) |
| Total | 95 (100.0%) | 13 (100.0%) |
Real Estate & Mortgages in Fairview
Real Estate and Mortgage Overview in Fairview
| Characteristic | Without Mortgage | With Mortgage |
| Housing Units | 57 | 38 |
| Median Property Value | $99,500 | $102,100 |
| Median Household Income | $61,563 | $0 |
| Monthly Housing Costs | $397 | $0 |
| Real Estate Taxes | $613 | $0 |
Property Value by Mortgage Status in Fairview
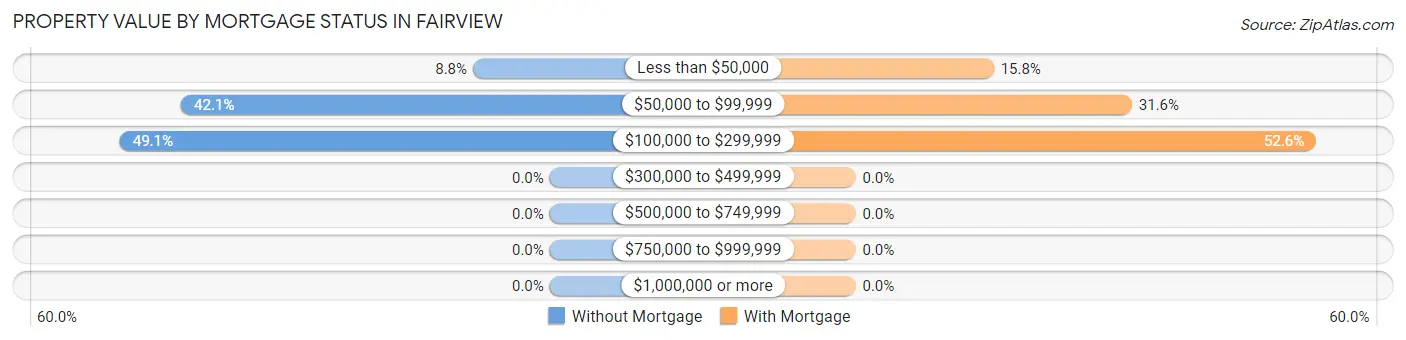
| Property Value | Without Mortgage | With Mortgage |
| Less than $50,000 | 5 (8.8%) | 6 (15.8%) |
| $50,000 to $99,999 | 24 (42.1%) | 12 (31.6%) |
| $100,000 to $299,999 | 28 (49.1%) | 20 (52.6%) |
| $300,000 to $499,999 | 0 (0.0%) | 0 (0.0%) |
| $500,000 to $749,999 | 0 (0.0%) | 0 (0.0%) |
| $750,000 to $999,999 | 0 (0.0%) | 0 (0.0%) |
| $1,000,000 or more | 0 (0.0%) | 0 (0.0%) |
| Total | 57 (100.0%) | 38 (100.0%) |
Household Income by Mortgage Status in Fairview
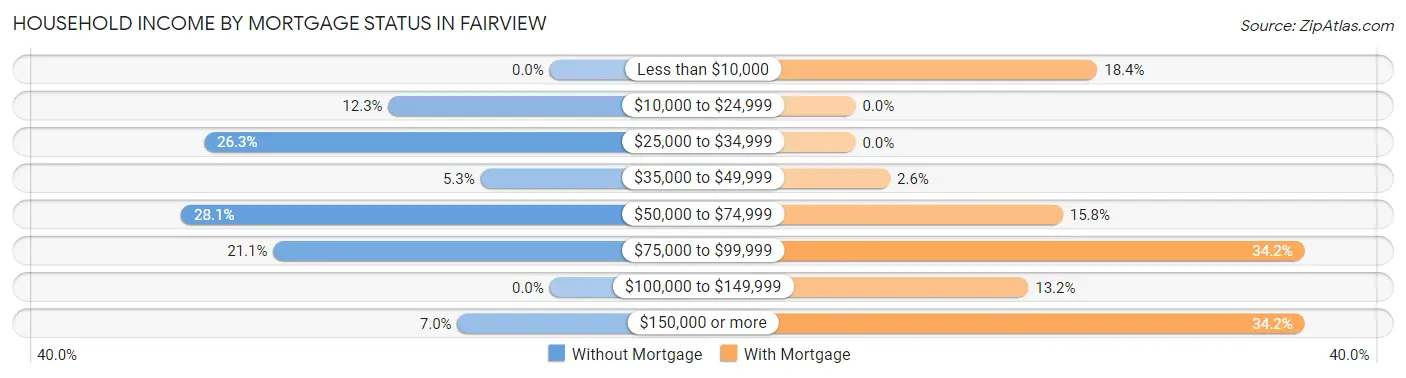
| Household Income | Without Mortgage | With Mortgage |
| Less than $10,000 | 0 (0.0%) | 7 (18.4%) |
| $10,000 to $24,999 | 7 (12.3%) | 0 (0.0%) |
| $25,000 to $34,999 | 15 (26.3%) | 0 (0.0%) |
| $35,000 to $49,999 | 3 (5.3%) | 1 (2.6%) |
| $50,000 to $74,999 | 16 (28.1%) | 6 (15.8%) |
| $75,000 to $99,999 | 12 (21.0%) | 13 (34.2%) |
| $100,000 to $149,999 | 0 (0.0%) | 5 (13.2%) |
| $150,000 or more | 4 (7.0%) | 13 (34.2%) |
| Total | 57 (100.0%) | 38 (100.0%) |
Property Value to Household Income Ratio in Fairview
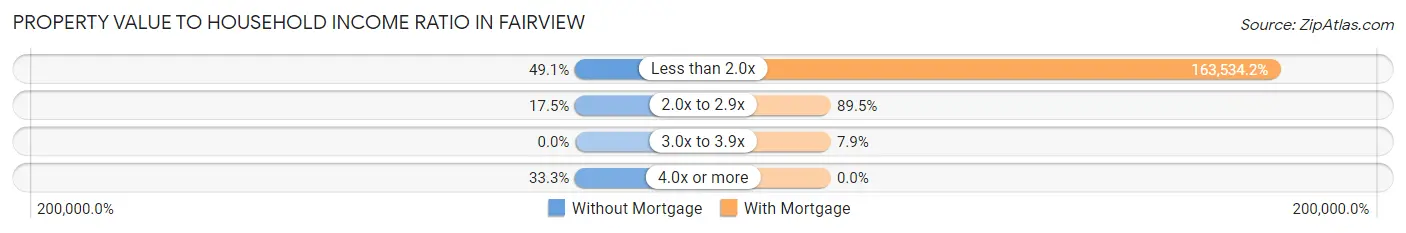
| Value-to-Income Ratio | Without Mortgage | With Mortgage |
| Less than 2.0x | 28 (49.1%) | 62,143 (163,534.2%) |
| 2.0x to 2.9x | 10 (17.5%) | 34 (89.5%) |
| 3.0x to 3.9x | 0 (0.0%) | 3 (7.9%) |
| 4.0x or more | 19 (33.3%) | 0 (0.0%) |
| Total | 57 (100.0%) | 38 (100.0%) |
Real Estate Taxes by Mortgage Status in Fairview
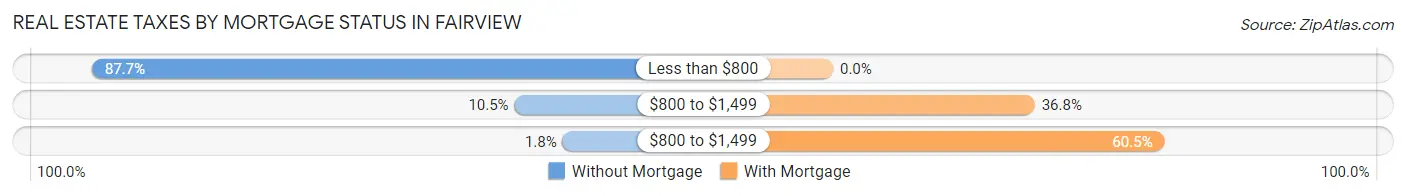
| Property Taxes | Without Mortgage | With Mortgage |
| Less than $800 | 50 (87.7%) | 0 (0.0%) |
| $800 to $1,499 | 6 (10.5%) | 14 (36.8%) |
| $800 to $1,499 | 1 (1.8%) | 23 (60.5%) |
| Total | 57 (100.0%) | 38 (100.0%) |
Health & Disability in Fairview
Health Insurance Coverage by Age in Fairview
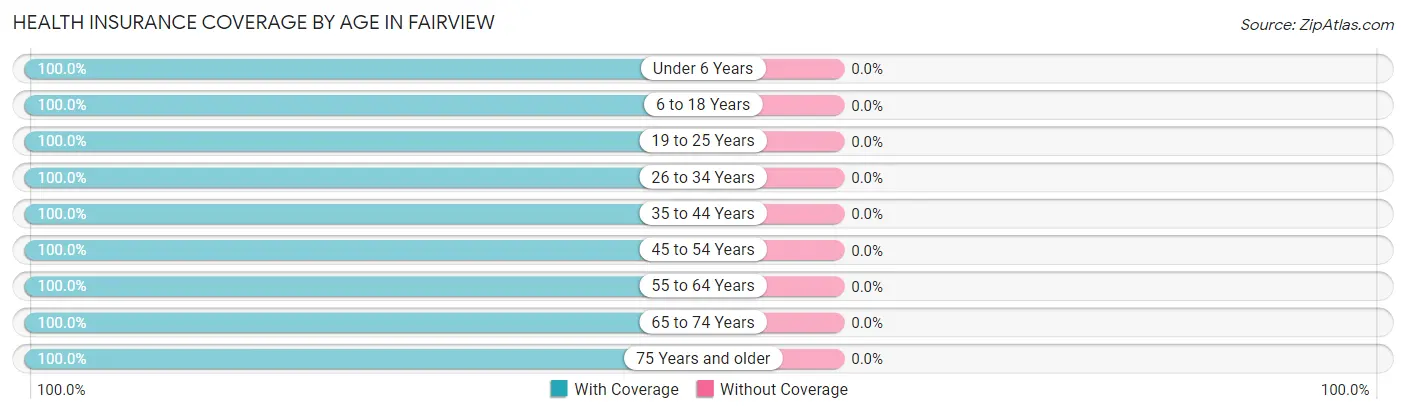
| Age Bracket | With Coverage | Without Coverage |
| Under 6 Years | 10 (100.0%) | 0 (0.0%) |
| 6 to 18 Years | 24 (100.0%) | 0 (0.0%) |
| 19 to 25 Years | 23 (100.0%) | 0 (0.0%) |
| 26 to 34 Years | 21 (100.0%) | 0 (0.0%) |
| 35 to 44 Years | 9 (100.0%) | 0 (0.0%) |
| 45 to 54 Years | 19 (100.0%) | 0 (0.0%) |
| 55 to 64 Years | 21 (100.0%) | 0 (0.0%) |
| 65 to 74 Years | 72 (100.0%) | 0 (0.0%) |
| 75 Years and older | 48 (100.0%) | 0 (0.0%) |
| Total | 247 (100.0%) | 0 (0.0%) |
Health Insurance Coverage by Citizenship Status in Fairview
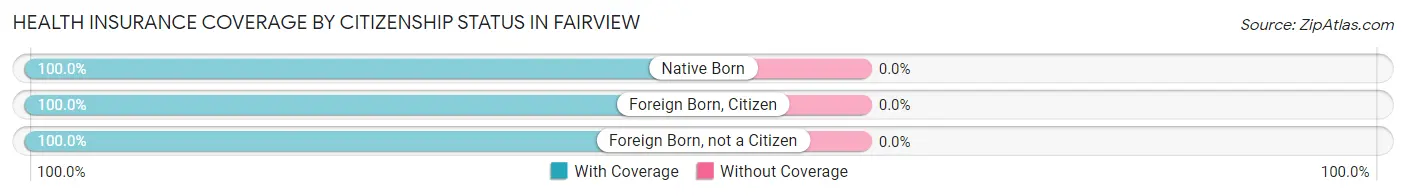
| Citizenship Status | With Coverage | Without Coverage |
| Native Born | 10 (100.0%) | 0 (0.0%) |
| Foreign Born, Citizen | 24 (100.0%) | 0 (0.0%) |
| Foreign Born, not a Citizen | 23 (100.0%) | 0 (0.0%) |
Health Insurance Coverage by Household Income in Fairview
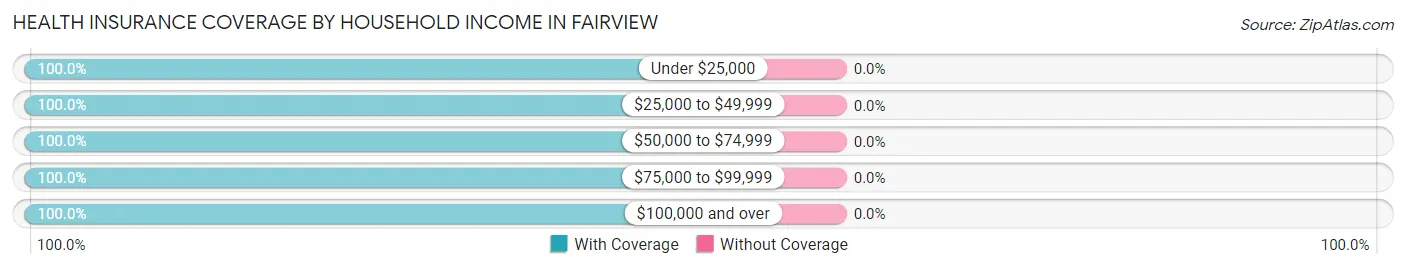
| Household Income | With Coverage | Without Coverage |
| Under $25,000 | 18 (100.0%) | 0 (0.0%) |
| $25,000 to $49,999 | 53 (100.0%) | 0 (0.0%) |
| $50,000 to $74,999 | 80 (100.0%) | 0 (0.0%) |
| $75,000 to $99,999 | 40 (100.0%) | 0 (0.0%) |
| $100,000 and over | 56 (100.0%) | 0 (0.0%) |
Public vs Private Health Insurance Coverage by Age in Fairview
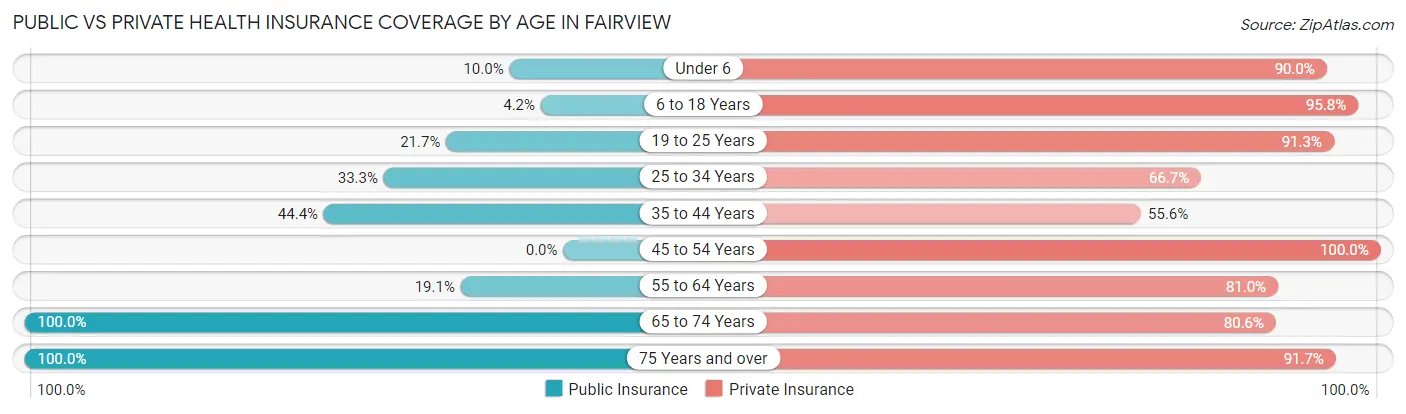
| Age Bracket | Public Insurance | Private Insurance |
| Under 6 | 1 (10.0%) | 9 (90.0%) |
| 6 to 18 Years | 1 (4.2%) | 23 (95.8%) |
| 19 to 25 Years | 5 (21.7%) | 21 (91.3%) |
| 25 to 34 Years | 7 (33.3%) | 14 (66.7%) |
| 35 to 44 Years | 4 (44.4%) | 5 (55.6%) |
| 45 to 54 Years | 0 (0.0%) | 19 (100.0%) |
| 55 to 64 Years | 4 (19.1%) | 17 (80.9%) |
| 65 to 74 Years | 72 (100.0%) | 58 (80.6%) |
| 75 Years and over | 48 (100.0%) | 44 (91.7%) |
| Total | 142 (57.5%) | 210 (85.0%) |
Disability Status by Sex by Age in Fairview
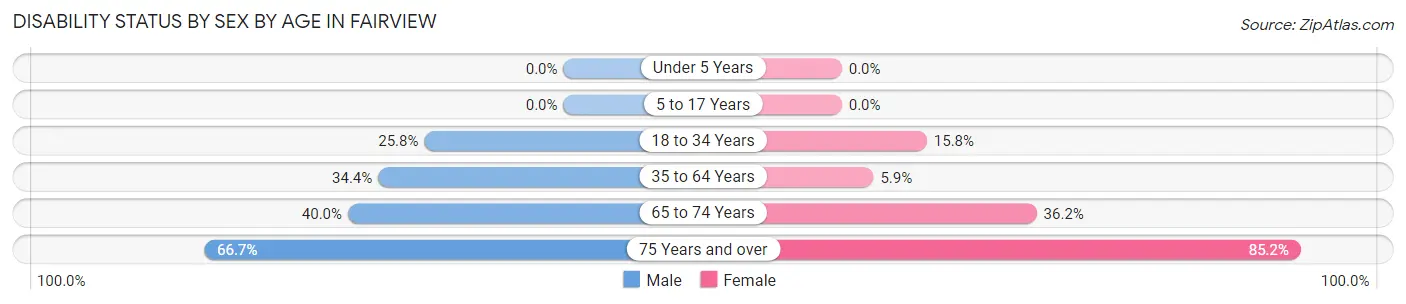
| Age Bracket | Male | Female |
| Under 5 Years | 0 (0.0%) | 0 (0.0%) |
| 5 to 17 Years | 0 (0.0%) | 0 (0.0%) |
| 18 to 34 Years | 8 (25.8%) | 3 (15.8%) |
| 35 to 64 Years | 11 (34.4%) | 1 (5.9%) |
| 65 to 74 Years | 10 (40.0%) | 17 (36.2%) |
| 75 Years and over | 14 (66.7%) | 23 (85.2%) |
Disability Class by Sex by Age in Fairview
Disability Class: Hearing Difficulty
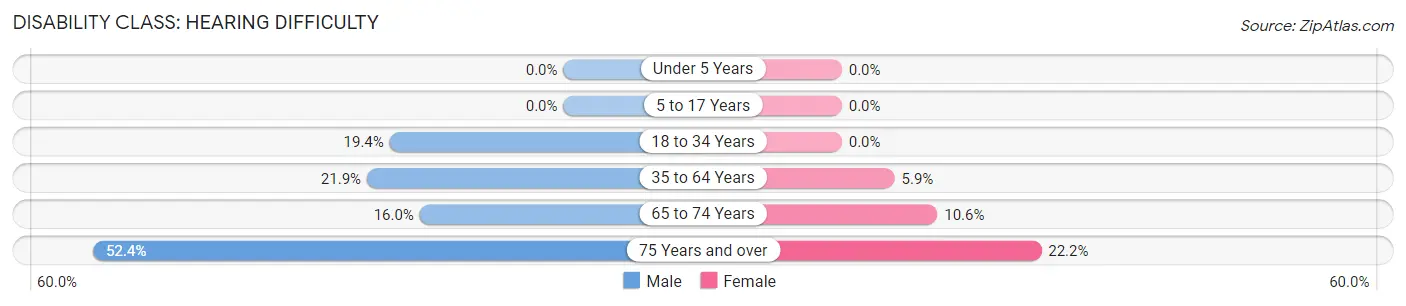
| Age Bracket | Male | Female |
| Under 5 Years | 0 (0.0%) | 0 (0.0%) |
| 5 to 17 Years | 0 (0.0%) | 0 (0.0%) |
| 18 to 34 Years | 6 (19.4%) | 0 (0.0%) |
| 35 to 64 Years | 7 (21.9%) | 1 (5.9%) |
| 65 to 74 Years | 4 (16.0%) | 5 (10.6%) |
| 75 Years and over | 11 (52.4%) | 6 (22.2%) |
Disability Class: Vision Difficulty
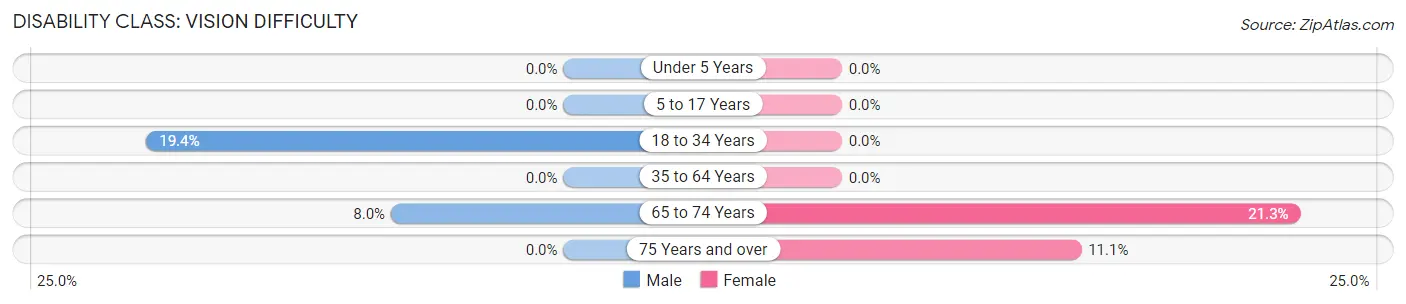
| Age Bracket | Male | Female |
| Under 5 Years | 0 (0.0%) | 0 (0.0%) |
| 5 to 17 Years | 0 (0.0%) | 0 (0.0%) |
| 18 to 34 Years | 6 (19.4%) | 0 (0.0%) |
| 35 to 64 Years | 0 (0.0%) | 0 (0.0%) |
| 65 to 74 Years | 2 (8.0%) | 10 (21.3%) |
| 75 Years and over | 0 (0.0%) | 3 (11.1%) |
Disability Class: Cognitive Difficulty
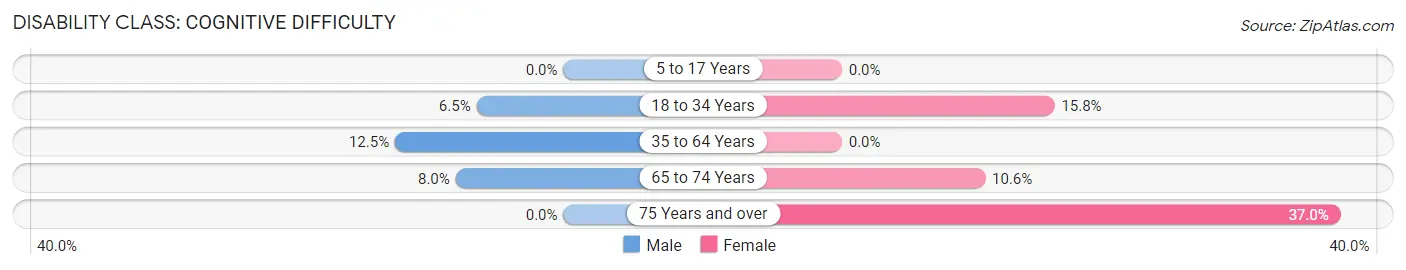
| Age Bracket | Male | Female |
| 5 to 17 Years | 0 (0.0%) | 0 (0.0%) |
| 18 to 34 Years | 2 (6.5%) | 3 (15.8%) |
| 35 to 64 Years | 4 (12.5%) | 0 (0.0%) |
| 65 to 74 Years | 2 (8.0%) | 5 (10.6%) |
| 75 Years and over | 0 (0.0%) | 10 (37.0%) |
Disability Class: Ambulatory Difficulty
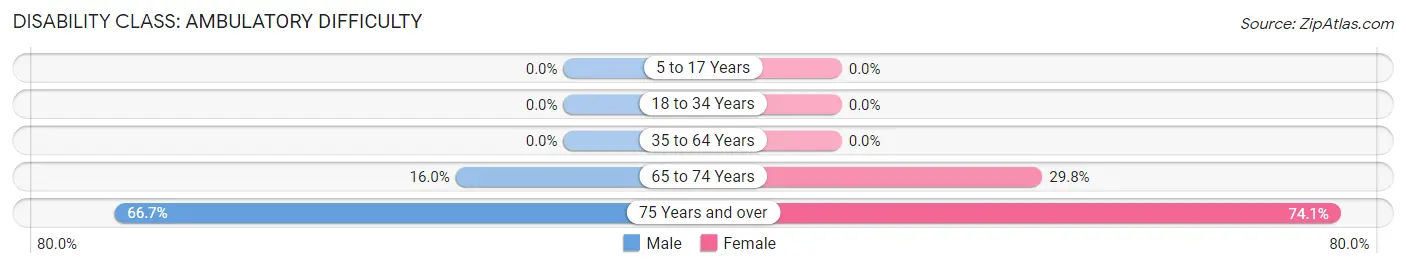
| Age Bracket | Male | Female |
| 5 to 17 Years | 0 (0.0%) | 0 (0.0%) |
| 18 to 34 Years | 0 (0.0%) | 0 (0.0%) |
| 35 to 64 Years | 0 (0.0%) | 0 (0.0%) |
| 65 to 74 Years | 4 (16.0%) | 14 (29.8%) |
| 75 Years and over | 14 (66.7%) | 20 (74.1%) |
Disability Class: Self-Care Difficulty
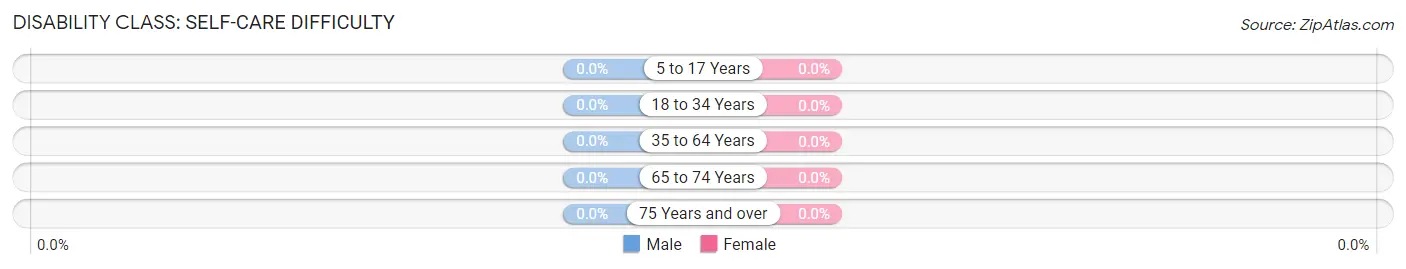
| Age Bracket | Male | Female |
| 5 to 17 Years | 0 (0.0%) | 0 (0.0%) |
| 18 to 34 Years | 0 (0.0%) | 0 (0.0%) |
| 35 to 64 Years | 0 (0.0%) | 0 (0.0%) |
| 65 to 74 Years | 0 (0.0%) | 0 (0.0%) |
| 75 Years and over | 0 (0.0%) | 0 (0.0%) |
Technology Access in Fairview
Computing Device Access in Fairview
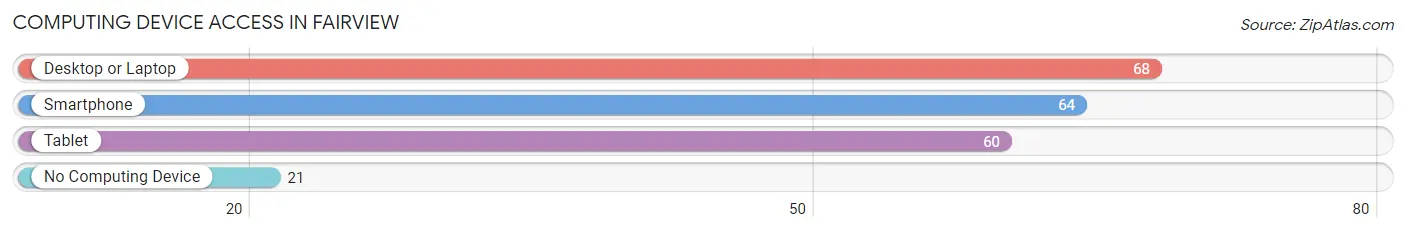
| Device Type | # Households | % Households |
| Desktop or Laptop | 68 | 63.0% |
| Smartphone | 64 | 59.3% |
| Tablet | 60 | 55.6% |
| No Computing Device | 21 | 19.4% |
| Total | 108 | 100.0% |
Internet Access in Fairview
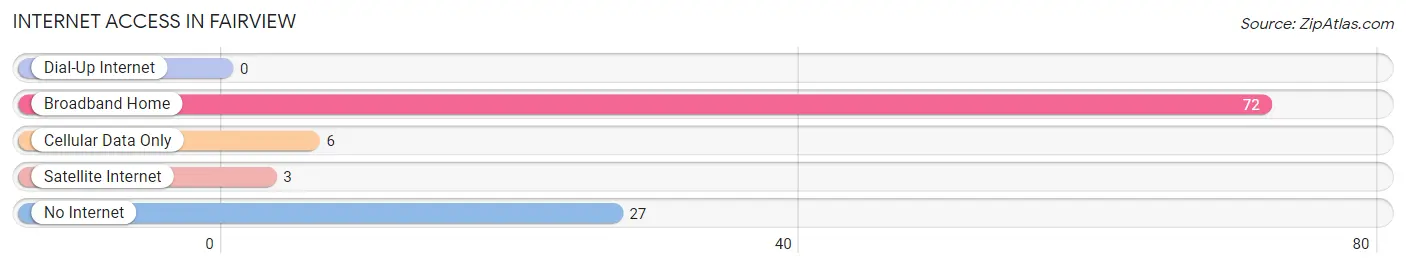
| Internet Type | # Households | % Households |
| Dial-Up Internet | 0 | 0.0% |
| Broadband Home | 72 | 66.7% |
| Cellular Data Only | 6 | 5.6% |
| Satellite Internet | 3 | 2.8% |
| No Internet | 27 | 25.0% |
| Total | 108 | 100.0% |
Fairview Summary
History
The town of Fairview, West Virginia is located in Marion County and is part of the Fairmont Metropolitan Statistical Area. The town was founded in 1872 and was originally known as Fairview Station. The town was named after the nearby Fairview Church, which was built in 1871. The town was incorporated in 1891 and has a population of approximately 1,000 people.
The town of Fairview has a rich history that dates back to the early 1800s. The area was first settled by the Native Americans, who were attracted to the area due to its abundance of natural resources. The first settlers in the area were of German descent and they established a small farming community. The town was officially established in 1872 and was named after the nearby Fairview Church.
The town of Fairview has been an important part of the local economy since its founding. The town was home to several coal mines, which provided employment for many of the town’s residents. The town also had a thriving lumber industry, which provided lumber for the construction of homes and businesses in the area.
The town of Fairview has also been an important part of the local culture. The town has a long history of music and art, and is home to several festivals and events throughout the year. The town is also home to several historic sites, including the Fairview Church, which was built in 1871.
Geography
The town of Fairview is located in Marion County, West Virginia. The town is situated in the Appalachian Mountains and is surrounded by rolling hills and forests. The town is located near the Monongahela River, which provides a source of water for the town. The town is located approximately 30 miles from the city of Fairmont, West Virginia.
The town of Fairview has a total area of 0.7 square miles, all of which is land. The town has an elevation of 1,068 feet above sea level. The town is located in a humid continental climate zone, which is characterized by hot summers and cold winters.
Economy
The town of Fairview has a diverse economy that is based on a variety of industries. The town is home to several coal mines, which provide employment for many of the town’s residents. The town also has a thriving lumber industry, which provides lumber for the construction of homes and businesses in the area.
The town of Fairview is also home to several small businesses, including restaurants, shops, and other services. The town is also home to several manufacturing companies, which produce a variety of products. The town is also home to several agricultural businesses, which produce a variety of crops and livestock.
Demographics
The town of Fairview has a population of approximately 1,000 people. The town has a median age of 44.7 years, with 51.2% of the population being male and 48.8% being female. The town has a median household income of $37,941 and a poverty rate of 16.3%. The town is predominantly white, with 94.2% of the population being white and 5.8% being of other races. The town also has a large Hispanic population, with 8.3% of the population being Hispanic or Latino.
Common Questions
What is the Total Population of Fairview?
Total Population of Fairview is 247.
What is the Total Male Population of Fairview?
Total Male Population of Fairview is 122.
What is the Total Female Population of Fairview?
Total Female Population of Fairview is 125.
What is the Ratio of Males per 100 Females in Fairview?
There are 97.60 Males per 100 Females in Fairview.
What is the Ratio of Females per 100 Males in Fairview?
There are 102.46 Females per 100 Males in Fairview.
What is the Median Population Age in Fairview?
Median Population Age in Fairview is 63.5 Years.
What is the Average Family Size in Fairview
Average Family Size in Fairview is 3.0 People.
What is the Average Household Size in Fairview
Average Household Size in Fairview is 2.3 People.
What is Per Capita Income in Fairview?
Per Capita income in Fairview is $27,987.
What is the Median Family Income in Fairview?
Median Family Income in Fairview is $71,250.
What is the Median Household income in Fairview?
Median Household Income in Fairview is $60,455.
What is Income or Wage Gap in Fairview?
Income or Wage Gap in Fairview is 41.8%.
Women in Fairview earn 58.2 cents for every dollar earned by a man.
What is Inequality or Gini Index in Fairview?
Inequality or Gini Index in Fairview is 0.30.
How Large is the Labor Force in Fairview?
There are 79 People in the Labor Forcein in Fairview.
What is the Percentage of People in the Labor Force in Fairview?
35.9% of People are in the Labor Force in Fairview.
What is the Unemployment Rate in Fairview?
Unemployment Rate in Fairview is 3.8%.