Matoaka, WV
Matoaka Map
Matoaka Overview
118
TOTAL POPULATION
67
MALE POPULATION
51
FEMALE POPULATION
131.37
MALES / 100 FEMALES
76.12
FEMALES / 100 MALES
35.9
MEDIAN AGE
3.4
AVG FAMILY SIZE
3.0
AVG HOUSEHOLD SIZE
$13,794
PER CAPITA INCOME
$41,250
AVG FAMILY INCOME
$40,625
AVG HOUSEHOLD INCOME
58.6%
WAGE / INCOME GAP [ % ]
41.4¢/ $1
WAGE / INCOME GAP [ $ ]
0.28
INEQUALITY / GINI INDEX
25
LABOR FORCE [ PEOPLE ]
30.9%
PERCENT IN LABOR FORCE
12.0%
UNEMPLOYMENT RATE
Matoaka Zip Codes
Matoaka Area Codes
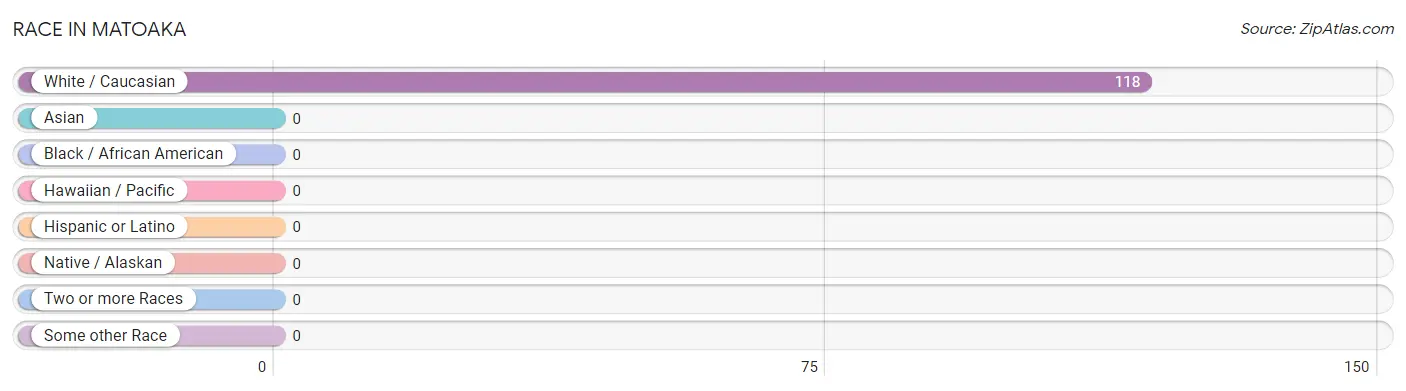
Race in Matoaka
The most populous races in Matoaka are , and White / Caucasian (118 | 100.0%).
| Race | # Population | % Population |
| Asian | 0 | 0.0% |
| Black / African American | 0 | 0.0% |
| Hawaiian / Pacific | 0 | 0.0% |
| Hispanic or Latino | 0 | 0.0% |
| Native / Alaskan | 0 | 0.0% |
| White / Caucasian | 118 | 100.0% |
| Two or more Races | 0 | 0.0% |
| Some other Race | 0 | 0.0% |
| Total | 118 | 100.0% |
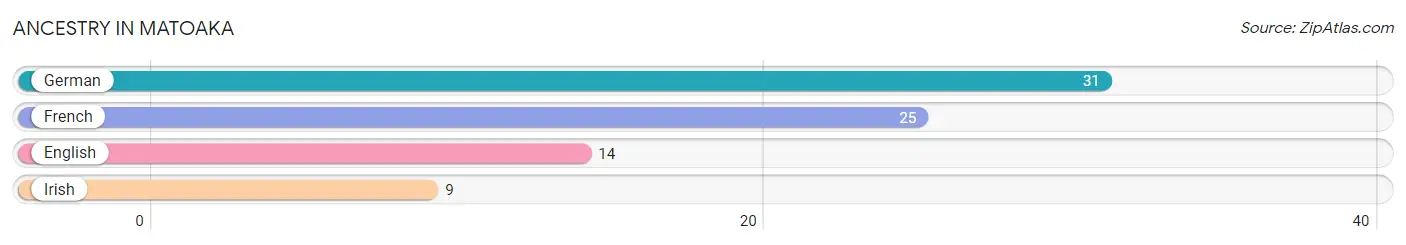
Ancestry in Matoaka
The most populous ancestries reported in Matoaka are German (31 | 26.3%), French (25 | 21.2%), English (14 | 11.9%), and Irish (9 | 7.6%), together accounting for 67.0% of all Matoaka residents.
| Ancestry | # Population | % Population |
| English | 14 | 11.9% |
| French | 25 | 21.2% |
| German | 31 | 26.3% |
| Irish | 9 | 7.6% | View All 4 Rows |
Immigrants in Matoaka

| Immigration Origin | # Population | % Population | View All 0 Rows |
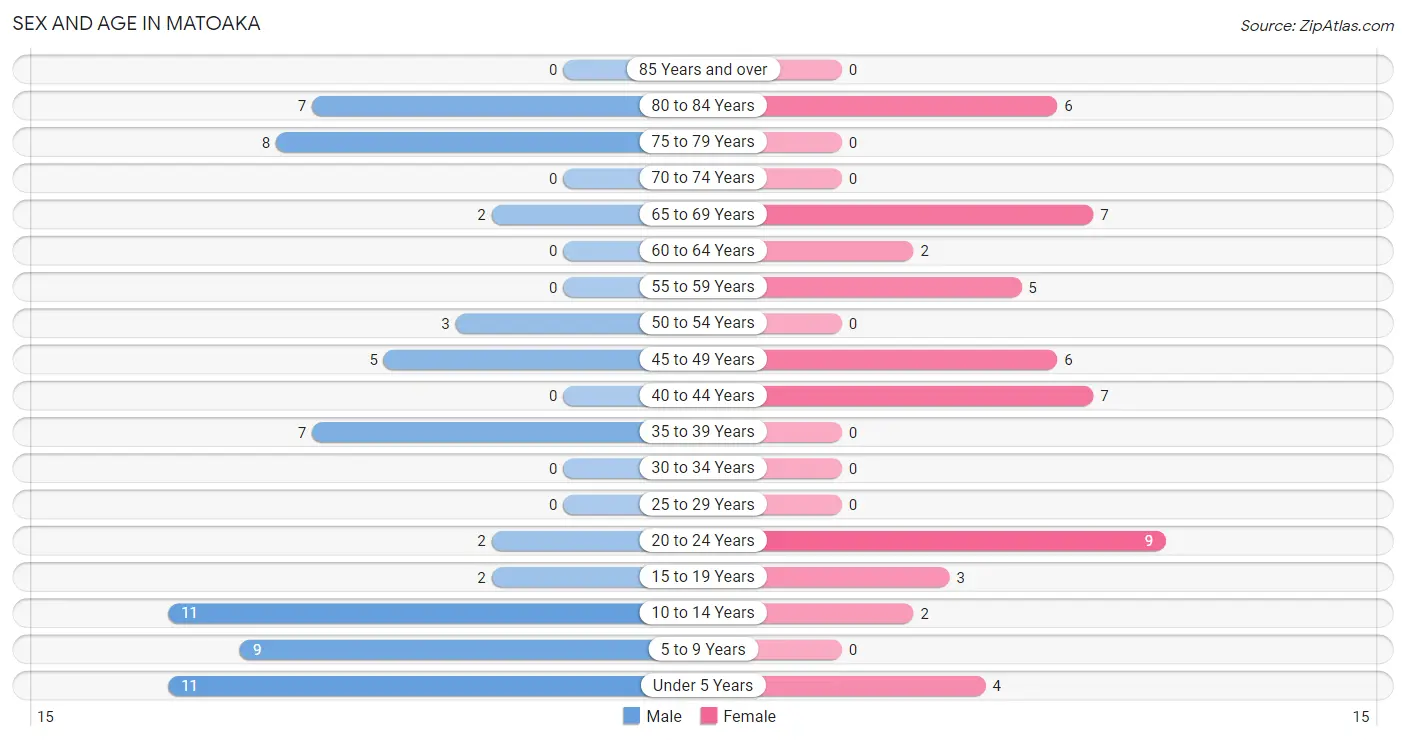
Sex and Age in Matoaka
Sex and Age in Matoaka
The most populous age groups in Matoaka are Under 5 Years (11 | 16.4%) for men and 20 to 24 Years (9 | 17.6%) for women.
| Age Bracket | Male | Female |
| Under 5 Years | 11 (16.4%) | 4 (7.8%) |
| 5 to 9 Years | 9 (13.4%) | 0 (0.0%) |
| 10 to 14 Years | 11 (16.4%) | 2 (3.9%) |
| 15 to 19 Years | 2 (3.0%) | 3 (5.9%) |
| 20 to 24 Years | 2 (3.0%) | 9 (17.6%) |
| 25 to 29 Years | 0 (0.0%) | 0 (0.0%) |
| 30 to 34 Years | 0 (0.0%) | 0 (0.0%) |
| 35 to 39 Years | 7 (10.4%) | 0 (0.0%) |
| 40 to 44 Years | 0 (0.0%) | 7 (13.7%) |
| 45 to 49 Years | 5 (7.5%) | 6 (11.8%) |
| 50 to 54 Years | 3 (4.5%) | 0 (0.0%) |
| 55 to 59 Years | 0 (0.0%) | 5 (9.8%) |
| 60 to 64 Years | 0 (0.0%) | 2 (3.9%) |
| 65 to 69 Years | 2 (3.0%) | 7 (13.7%) |
| 70 to 74 Years | 0 (0.0%) | 0 (0.0%) |
| 75 to 79 Years | 8 (11.9%) | 0 (0.0%) |
| 80 to 84 Years | 7 (10.4%) | 6 (11.8%) |
| 85 Years and over | 0 (0.0%) | 0 (0.0%) |
| Total | 67 (100.0%) | 51 (100.0%) |
Families and Households in Matoaka
Median Family Size in Matoaka
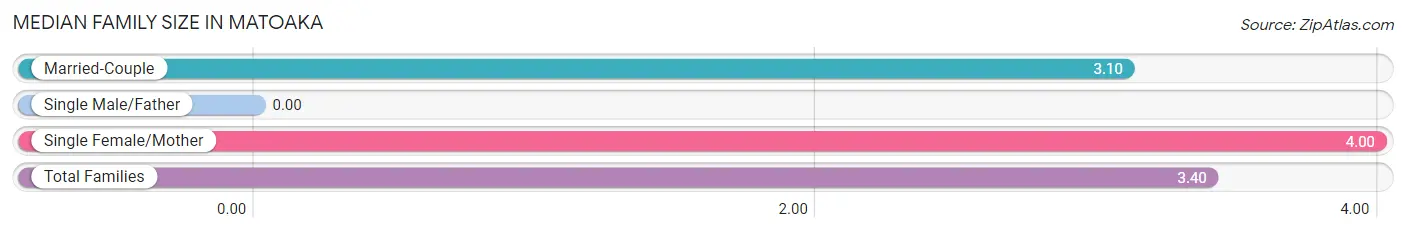
| Family Type | # Families | Family Size |
| Married-Couple | 20 (66.7%) | 3.10 |
| Single Male/Father | 0 (0.0%) | - |
| Single Female/Mother | 10 (33.3%) | 4.00 |
| Total Families | 30 (100.0%) | 3.40 |
Median Household Size in Matoaka
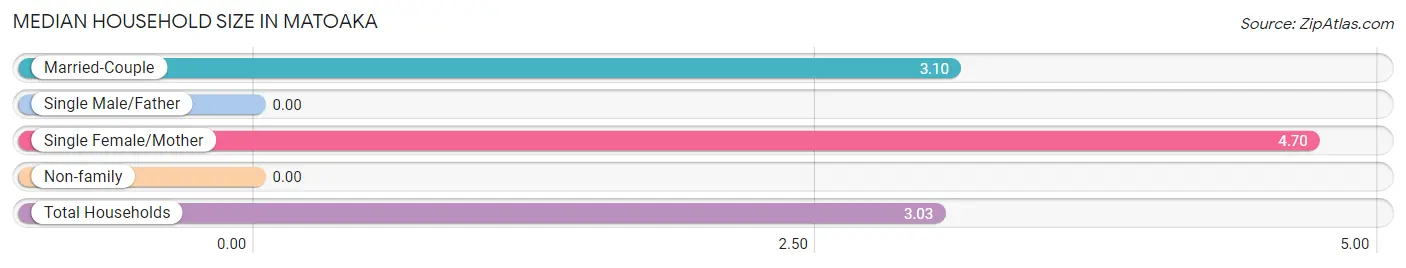
| Household Type | # Households | Household Size |
| Married-Couple | 20 (51.3%) | 3.10 |
| Single Male/Father | 0 (0.0%) | - |
| Single Female/Mother | 10 (25.6%) | 4.70 |
| Non-family | 9 (23.1%) | - |
| Total Households | 39 (100.0%) | 3.03 |
Household Size by Marriage Status in Matoaka
Out of a total of 39 households in Matoaka, 30 (76.9%) are family households, while 9 (23.1%) are nonfamily households. The most numerous type of family households are 2-person households, comprising 23, and the most common type of nonfamily households are 1-person households, comprising 9.
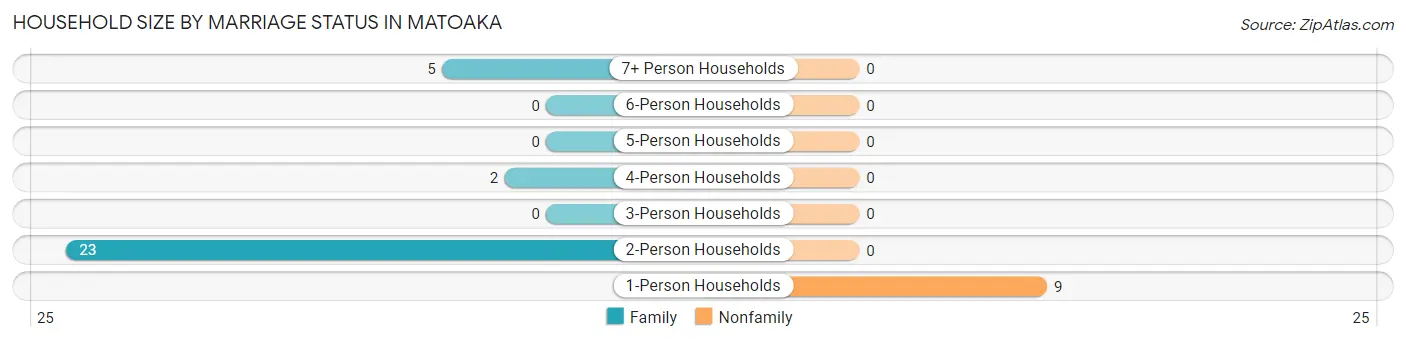
| Household Size | Family Households | Nonfamily Households |
| 1-Person Households | - | 9 (23.1%) |
| 2-Person Households | 23 (59.0%) | 0 (0.0%) |
| 3-Person Households | 0 (0.0%) | 0 (0.0%) |
| 4-Person Households | 2 (5.1%) | 0 (0.0%) |
| 5-Person Households | 0 (0.0%) | 0 (0.0%) |
| 6-Person Households | 0 (0.0%) | 0 (0.0%) |
| 7+ Person Households | 5 (12.8%) | 0 (0.0%) |
| Total | 30 (76.9%) | 9 (23.1%) |
Female Fertility in Matoaka
Fertility by Age in Matoaka
Average fertility rate in Matoaka is 120.0 births per 1,000 women. Women in the age bracket of 20 to 34 years have the highest fertility rate with 333.0 births per 1,000 women. Women in the age bracket of 20 to 34 years acount for 100.0% of all women with births.
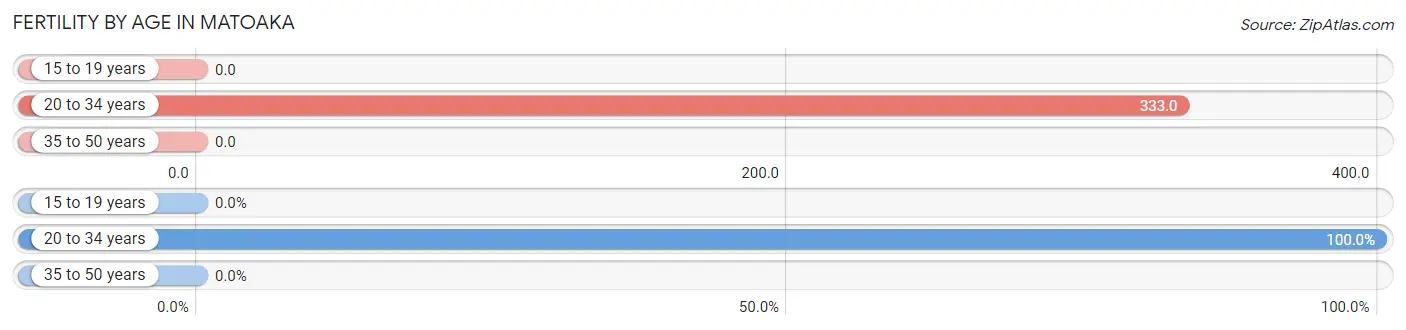
| Age Bracket | Women with Births | Births / 1,000 Women |
| 15 to 19 years | 0 (0.0%) | 0.0 |
| 20 to 34 years | 3 (100.0%) | 333.0 |
| 35 to 50 years | 0 (0.0%) | 0.0 |
| Total | 3 (100.0%) | 120.0 |
Fertility by Age by Marriage Status in Matoaka
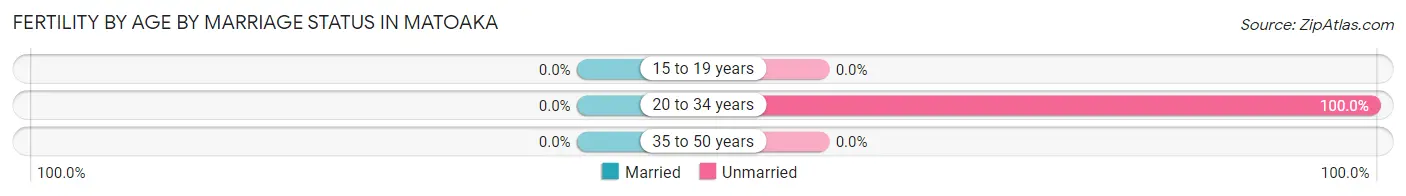
| Age Bracket | Married | Unmarried |
| 15 to 19 years | 0 (0.0%) | 0 (0.0%) |
| 20 to 34 years | 0 (0.0%) | 3 (100.0%) |
| 35 to 50 years | 0 (0.0%) | 0 (0.0%) |
| Total | 0 (0.0%) | 3 (100.0%) |
Fertility by Education in Matoaka
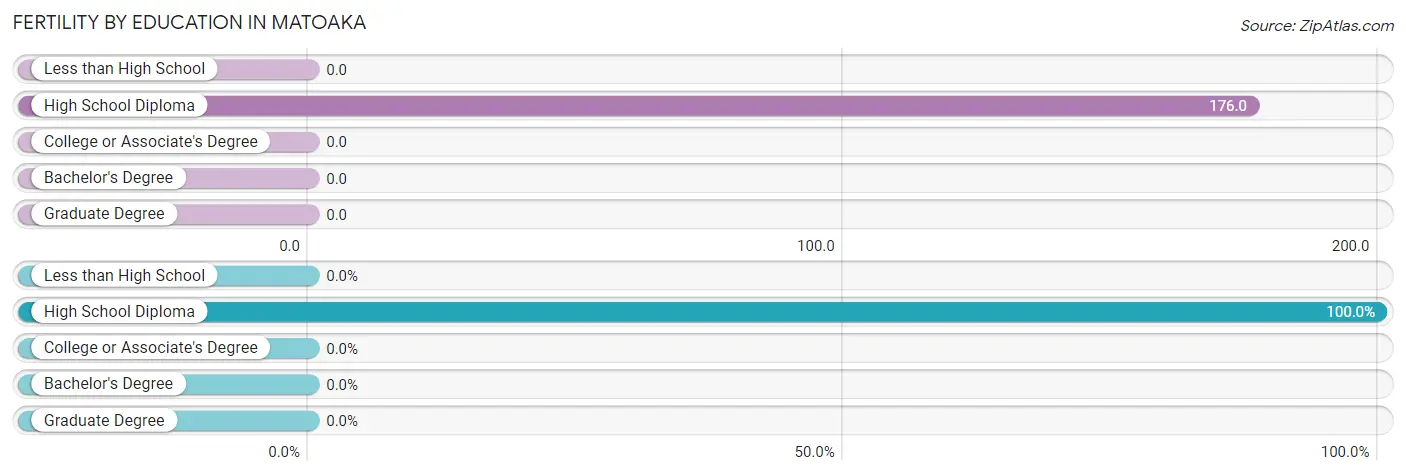
| Educational Attainment | Women with Births | Births / 1,000 Women |
| Less than High School | 0 (0.0%) | 0.0 |
| High School Diploma | 3 (100.0%) | 176.0 |
| College or Associate's Degree | 0 (0.0%) | 0.0 |
| Bachelor's Degree | 0 (0.0%) | 0.0 |
| Graduate Degree | 0 (0.0%) | 0.0 |
| Total | 3 (100.0%) | 120.0 |
Fertility by Education by Marriage Status in Matoaka
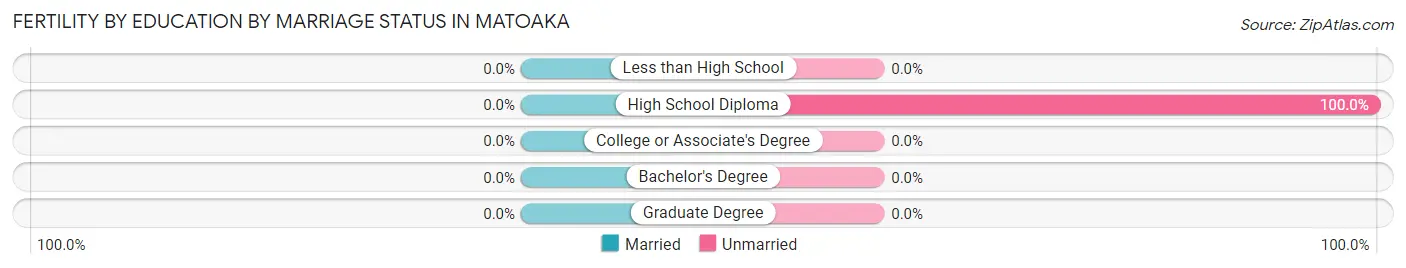
| Educational Attainment | Married | Unmarried |
| Less than High School | 0 (0.0%) | 0 (0.0%) |
| High School Diploma | 0 (0.0%) | 3 (100.0%) |
| College or Associate's Degree | 0 (0.0%) | 0 (0.0%) |
| Bachelor's Degree | 0 (0.0%) | 0 (0.0%) |
| Graduate Degree | 0 (0.0%) | 0 (0.0%) |
| Total | 0 (0.0%) | 3 (100.0%) |
Income in Matoaka
Income Overview in Matoaka
Per Capita Income in Matoaka is $13,794, while median incomes of families and households are $41,250 and $40,625 respectively.
| Characteristic | Number | Measure |
| Per Capita Income | 118 | $13,794 |
| Median Family Income | 30 | $41,250 |
| Mean Family Income | 30 | $38,650 |
| Median Household Income | 39 | $40,625 |
| Mean Household Income | 39 | $38,977 |
| Income Deficit | 30 | $0 |
| Wage / Income Gap (%) | 118 | 58.62% |
| Wage / Income Gap ($) | 118 | 41.38¢ per $1 |
| Gini / Inequality Index | 118 | 0.28 |
Earnings by Sex in Matoaka
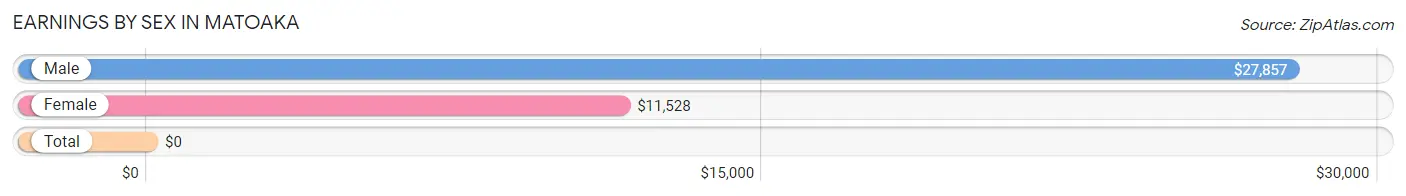
| Sex | Number | Average Earnings |
| Male | 12 (41.4%) | $27,857 |
| Female | 17 (58.6%) | $11,528 |
| Total | 29 (100.0%) | $0 |
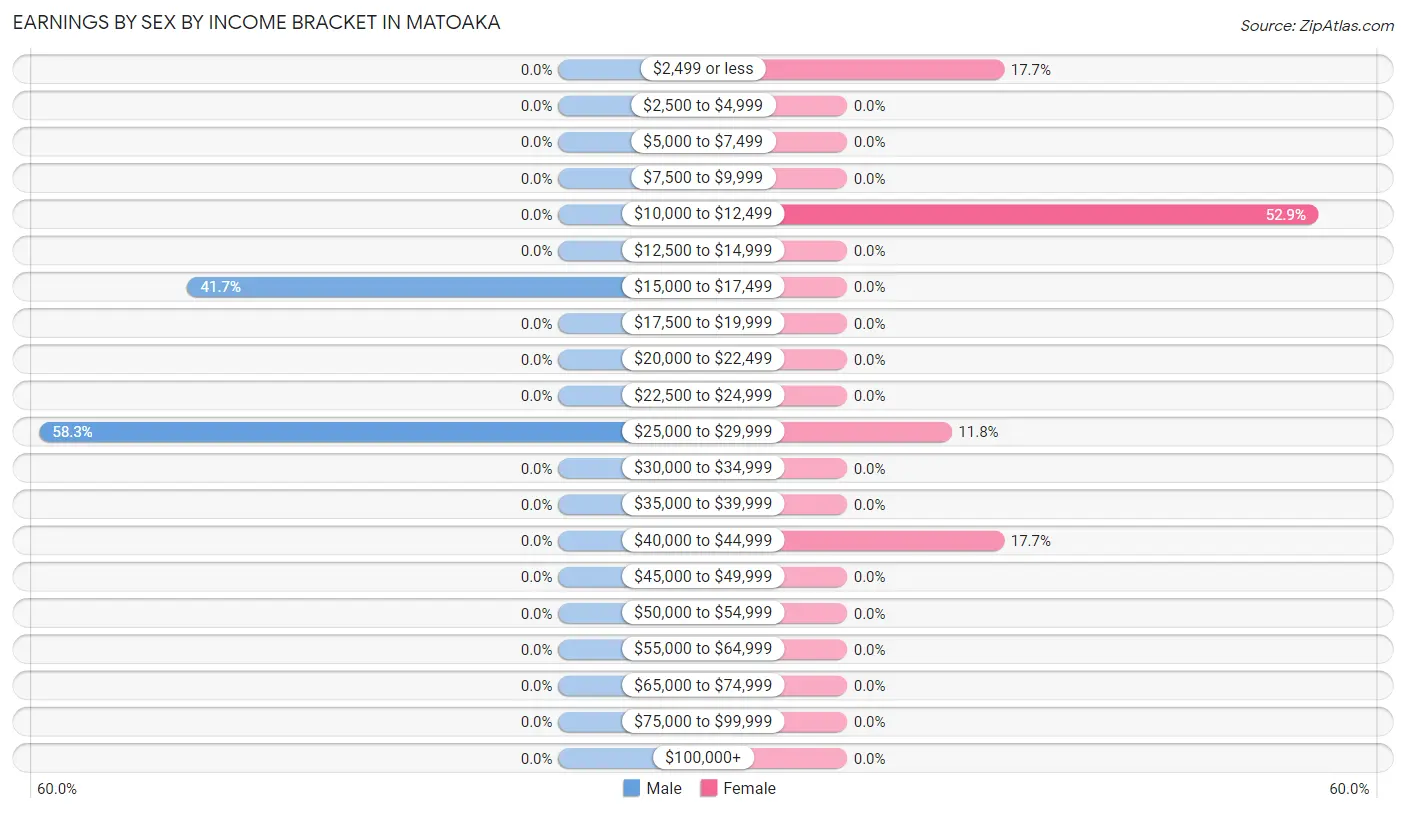
Earnings by Sex by Income Bracket in Matoaka
The most common earnings brackets in Matoaka are $25,000 to $29,999 for men (7 | 58.3%) and $10,000 to $12,499 for women (9 | 52.9%).
| Income | Male | Female |
| $2,499 or less | 0 (0.0%) | 3 (17.6%) |
| $2,500 to $4,999 | 0 (0.0%) | 0 (0.0%) |
| $5,000 to $7,499 | 0 (0.0%) | 0 (0.0%) |
| $7,500 to $9,999 | 0 (0.0%) | 0 (0.0%) |
| $10,000 to $12,499 | 0 (0.0%) | 9 (52.9%) |
| $12,500 to $14,999 | 0 (0.0%) | 0 (0.0%) |
| $15,000 to $17,499 | 5 (41.7%) | 0 (0.0%) |
| $17,500 to $19,999 | 0 (0.0%) | 0 (0.0%) |
| $20,000 to $22,499 | 0 (0.0%) | 0 (0.0%) |
| $22,500 to $24,999 | 0 (0.0%) | 0 (0.0%) |
| $25,000 to $29,999 | 7 (58.3%) | 2 (11.8%) |
| $30,000 to $34,999 | 0 (0.0%) | 0 (0.0%) |
| $35,000 to $39,999 | 0 (0.0%) | 0 (0.0%) |
| $40,000 to $44,999 | 0 (0.0%) | 3 (17.6%) |
| $45,000 to $49,999 | 0 (0.0%) | 0 (0.0%) |
| $50,000 to $54,999 | 0 (0.0%) | 0 (0.0%) |
| $55,000 to $64,999 | 0 (0.0%) | 0 (0.0%) |
| $65,000 to $74,999 | 0 (0.0%) | 0 (0.0%) |
| $75,000 to $99,999 | 0 (0.0%) | 0 (0.0%) |
| $100,000+ | 0 (0.0%) | 0 (0.0%) |
| Total | 12 (100.0%) | 17 (100.0%) |
Earnings by Sex by Educational Attainment in Matoaka
| Educational Attainment | Male Income | Female Income |
| Less than High School | - | - |
| High School Diploma | - | - |
| College or Associate's Degree | - | - |
| Bachelor's Degree | - | - |
| Graduate Degree | - | - |
| Total | - | - |
Family Income in Matoaka
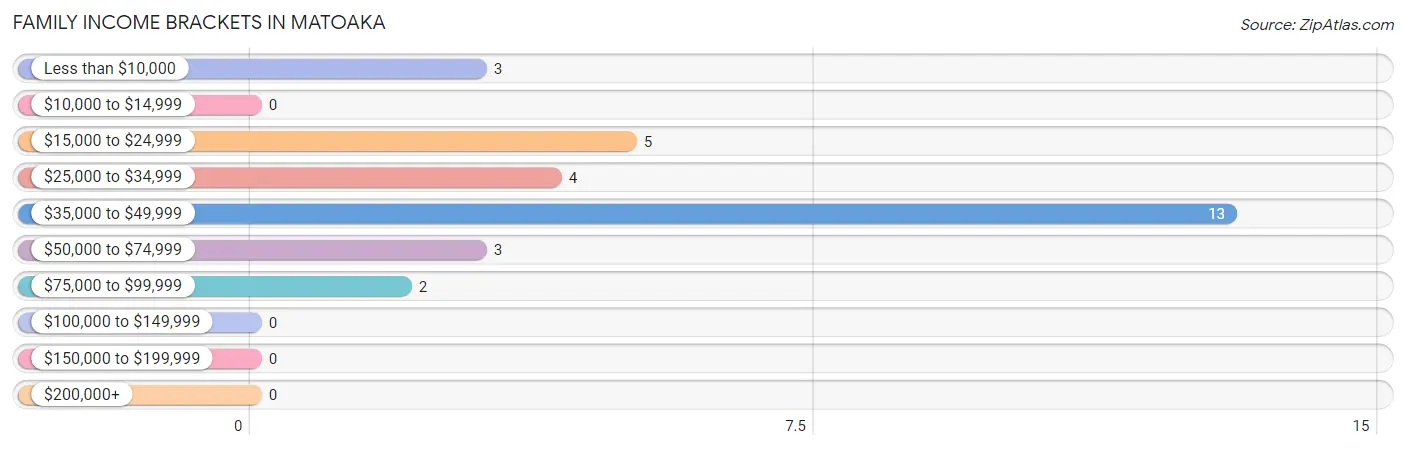
Family Income Brackets in Matoaka
According to the Matoaka family income data, there are 13 families falling into the $35,000 to $49,999 income range, which is the most common income bracket and makes up 43.3% of all families.
| Income Bracket | # Families | % Families |
| Less than $10,000 | 3 | 10.0% |
| $10,000 to $14,999 | 0 | 0.0% |
| $15,000 to $24,999 | 5 | 16.7% |
| $25,000 to $34,999 | 4 | 13.3% |
| $35,000 to $49,999 | 13 | 43.3% |
| $50,000 to $74,999 | 3 | 10.0% |
| $75,000 to $99,999 | 2 | 6.7% |
| $100,000 to $149,999 | 0 | 0.0% |
| $150,000 to $199,999 | 0 | 0.0% |
| $200,000+ | 0 | 0.0% |
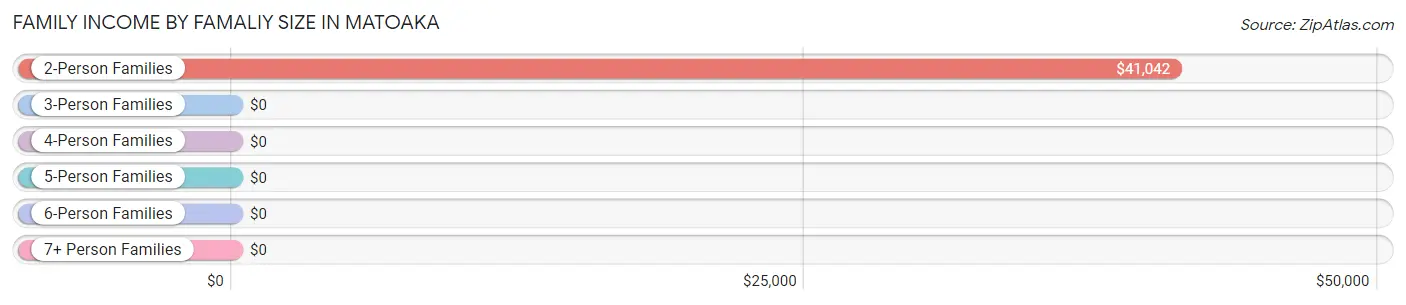
Family Income by Famaliy Size in Matoaka
2-person families (23 | 76.7%) account for the highest median family income in Matoaka with $41,042 per family, while 2-person families (23 | 76.7%) have the highest median income of $20,521 per family member.
| Income Bracket | # Families | Median Income |
| 2-Person Families | 23 (76.7%) | $41,042 |
| 3-Person Families | 0 (0.0%) | $0 |
| 4-Person Families | 2 (6.7%) | $0 |
| 5-Person Families | 3 (10.0%) | $0 |
| 6-Person Families | 0 (0.0%) | $0 |
| 7+ Person Families | 2 (6.7%) | $0 |
| Total | 30 (100.0%) | $41,250 |
Family Income by Number of Earners in Matoaka
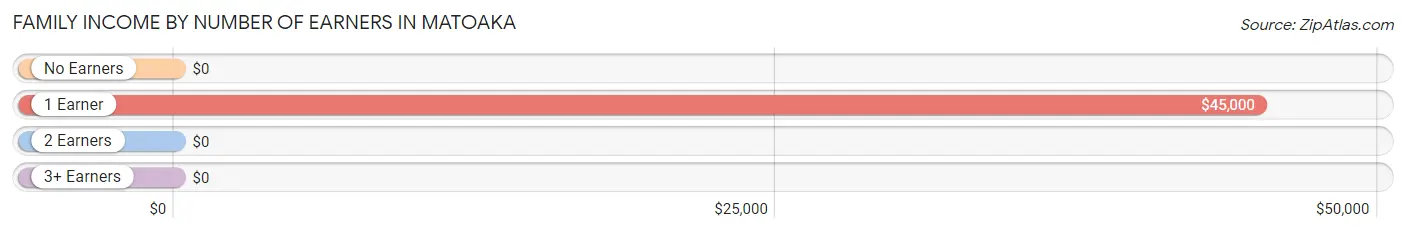
| Number of Earners | # Families | Median Income |
| No Earners | 10 (33.3%) | $0 |
| 1 Earner | 20 (66.7%) | $45,000 |
| 2 Earners | 0 (0.0%) | $0 |
| 3+ Earners | 0 (0.0%) | $0 |
| Total | 30 (100.0%) | $41,250 |
Household Income in Matoaka
Household Income Brackets in Matoaka
With 14 households falling in the category, the $15,000 to $24,999 income range is the most frequent in Matoaka, accounting for 35.9% of all households.
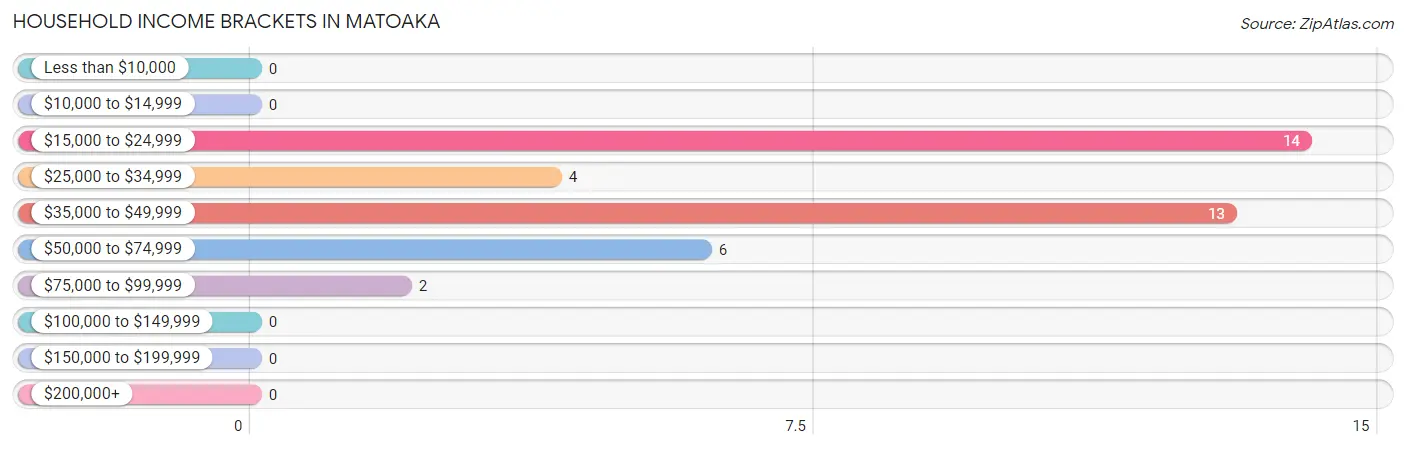
| Income Bracket | # Households | % Households |
| Less than $10,000 | 0 | 0.0% |
| $10,000 to $14,999 | 0 | 0.0% |
| $15,000 to $24,999 | 14 | 35.9% |
| $25,000 to $34,999 | 4 | 10.3% |
| $35,000 to $49,999 | 13 | 33.3% |
| $50,000 to $74,999 | 6 | 15.4% |
| $75,000 to $99,999 | 2 | 5.1% |
| $100,000 to $149,999 | 0 | 0.0% |
| $150,000 to $199,999 | 0 | 0.0% |
| $200,000+ | 0 | 0.0% |
Household Income by Householder Age in Matoaka
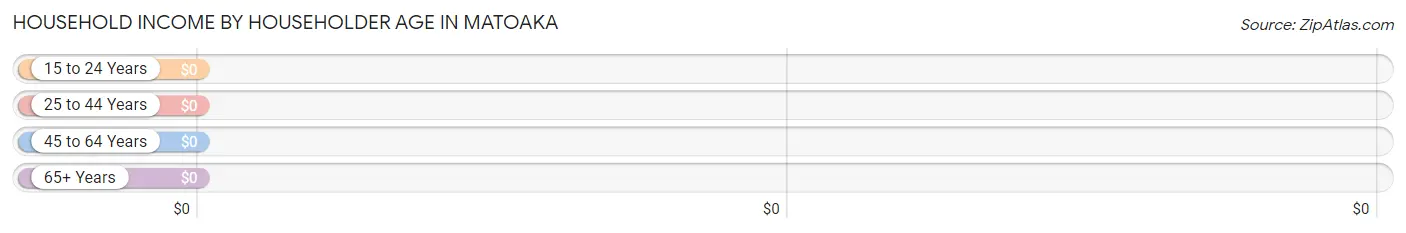
| Income Bracket | # Households | Median Income |
| 15 to 24 Years | 0 (0.0%) | $0 |
| 25 to 44 Years | 5 (12.8%) | $0 |
| 45 to 64 Years | 15 (38.5%) | $0 |
| 65+ Years | 19 (48.7%) | $0 |
| Total | 39 (100.0%) | $40,625 |
Poverty in Matoaka
Income Below Poverty by Sex and Age in Matoaka
With 25.4% poverty level for males and 11.8% for females among the residents of Matoaka, under 5 year old males and 45 to 54 year old females are the most vulnerable to poverty, with 8 males (72.7%) and 3 females (50.0%) in their respective age groups living below the poverty level.
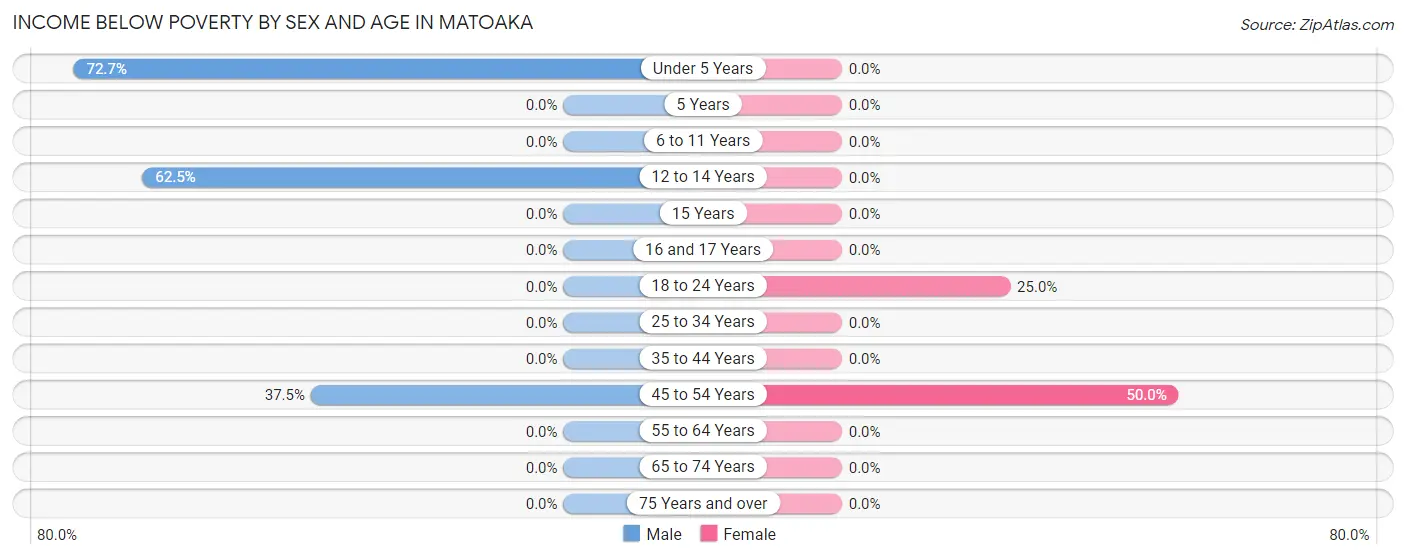
| Age Bracket | Male | Female |
| Under 5 Years | 8 (72.7%) | 0 (0.0%) |
| 5 Years | 0 (0.0%) | 0 (0.0%) |
| 6 to 11 Years | 0 (0.0%) | 0 (0.0%) |
| 12 to 14 Years | 5 (62.5%) | 0 (0.0%) |
| 15 Years | 0 (0.0%) | 0 (0.0%) |
| 16 and 17 Years | 0 (0.0%) | 0 (0.0%) |
| 18 to 24 Years | 0 (0.0%) | 3 (25.0%) |
| 25 to 34 Years | 0 (0.0%) | 0 (0.0%) |
| 35 to 44 Years | 0 (0.0%) | 0 (0.0%) |
| 45 to 54 Years | 3 (37.5%) | 3 (50.0%) |
| 55 to 64 Years | 0 (0.0%) | 0 (0.0%) |
| 65 to 74 Years | 0 (0.0%) | 0 (0.0%) |
| 75 Years and over | 0 (0.0%) | 0 (0.0%) |
| Total | 16 (25.4%) | 6 (11.8%) |
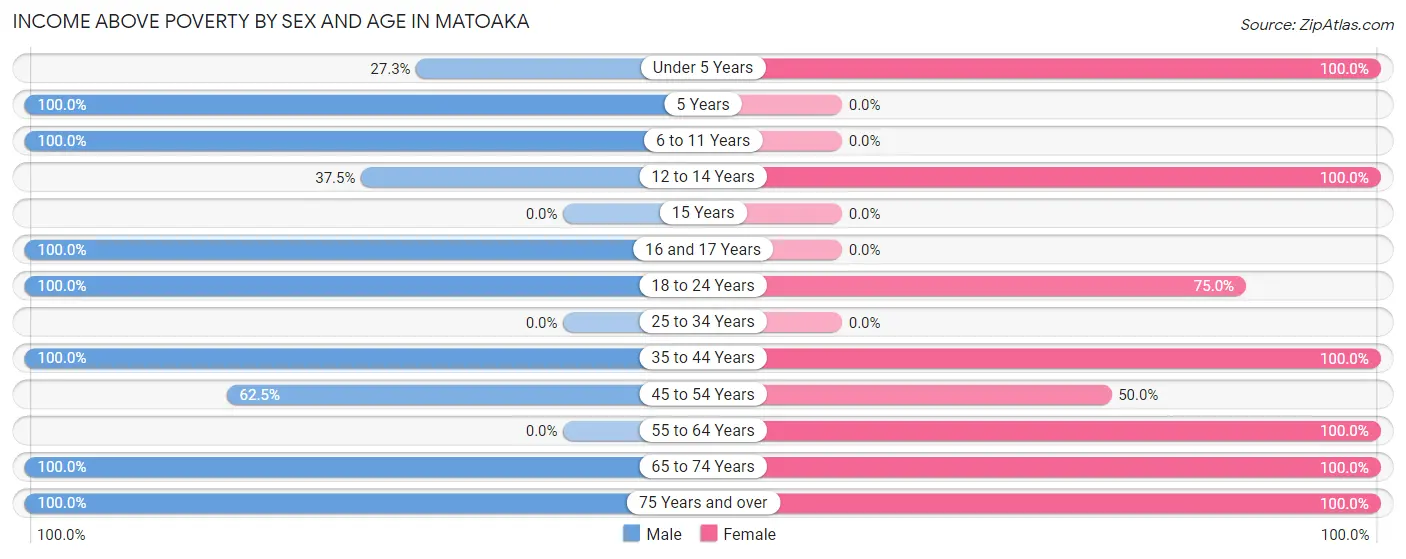
Income Above Poverty by Sex and Age in Matoaka
According to the poverty statistics in Matoaka, males aged 5 years and females aged under 5 years are the age groups that are most secure financially, with 100.0% of males and 100.0% of females in these age groups living above the poverty line.
| Age Bracket | Male | Female |
| Under 5 Years | 3 (27.3%) | 4 (100.0%) |
| 5 Years | 3 (100.0%) | 0 (0.0%) |
| 6 to 11 Years | 5 (100.0%) | 0 (0.0%) |
| 12 to 14 Years | 3 (37.5%) | 2 (100.0%) |
| 15 Years | 0 (0.0%) | 0 (0.0%) |
| 16 and 17 Years | 2 (100.0%) | 0 (0.0%) |
| 18 to 24 Years | 2 (100.0%) | 9 (75.0%) |
| 25 to 34 Years | 0 (0.0%) | 0 (0.0%) |
| 35 to 44 Years | 7 (100.0%) | 7 (100.0%) |
| 45 to 54 Years | 5 (62.5%) | 3 (50.0%) |
| 55 to 64 Years | 0 (0.0%) | 7 (100.0%) |
| 65 to 74 Years | 2 (100.0%) | 7 (100.0%) |
| 75 Years and over | 15 (100.0%) | 6 (100.0%) |
| Total | 47 (74.6%) | 45 (88.2%) |
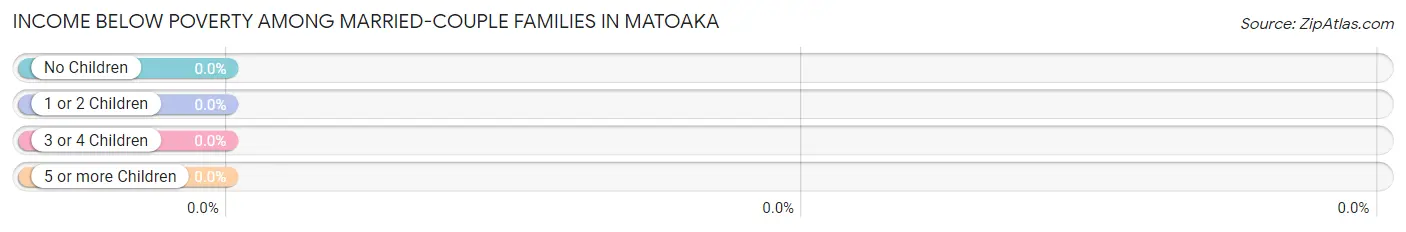
Income Below Poverty Among Married-Couple Families in Matoaka
| Children | Above Poverty | Below Poverty |
| No Children | 18 (100.0%) | 0 (0.0%) |
| 1 or 2 Children | 0 (0.0%) | 0 (0.0%) |
| 3 or 4 Children | 0 (0.0%) | 0 (0.0%) |
| 5 or more Children | 2 (100.0%) | 0 (0.0%) |
| Total | 20 (100.0%) | 0 (0.0%) |
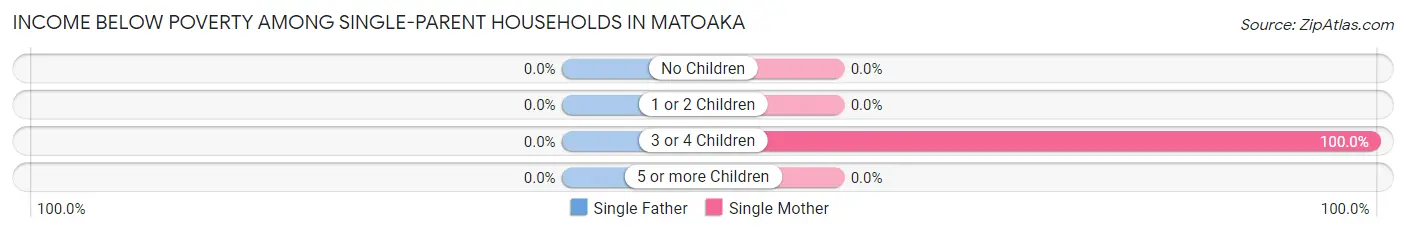
Income Below Poverty Among Single-Parent Households in Matoaka
| Children | Single Father | Single Mother |
| No Children | 0 (0.0%) | 0 (0.0%) |
| 1 or 2 Children | 0 (0.0%) | 0 (0.0%) |
| 3 or 4 Children | 0 (0.0%) | 3 (100.0%) |
| 5 or more Children | 0 (0.0%) | 0 (0.0%) |
| Total | 0 (0.0%) | 3 (30.0%) |
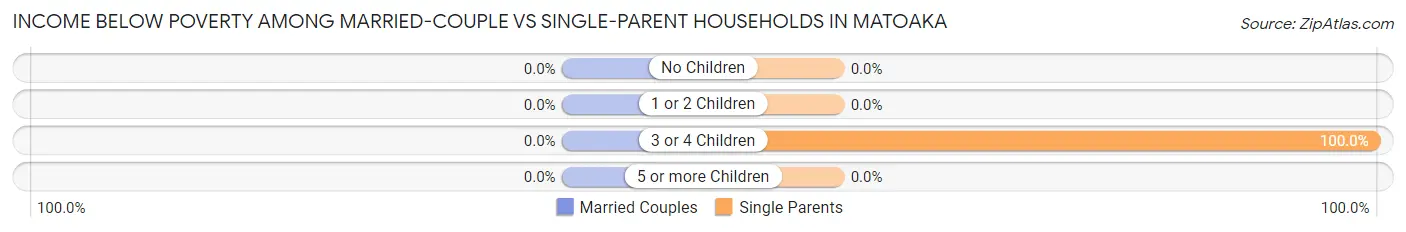
Income Below Poverty Among Married-Couple vs Single-Parent Households in Matoaka
| Children | Married-Couple Families | Single-Parent Households |
| No Children | 0 (0.0%) | 0 (0.0%) |
| 1 or 2 Children | 0 (0.0%) | 0 (0.0%) |
| 3 or 4 Children | 0 (0.0%) | 3 (100.0%) |
| 5 or more Children | 0 (0.0%) | 0 (0.0%) |
| Total | 0 (0.0%) | 3 (30.0%) |
Employment Characteristics in Matoaka
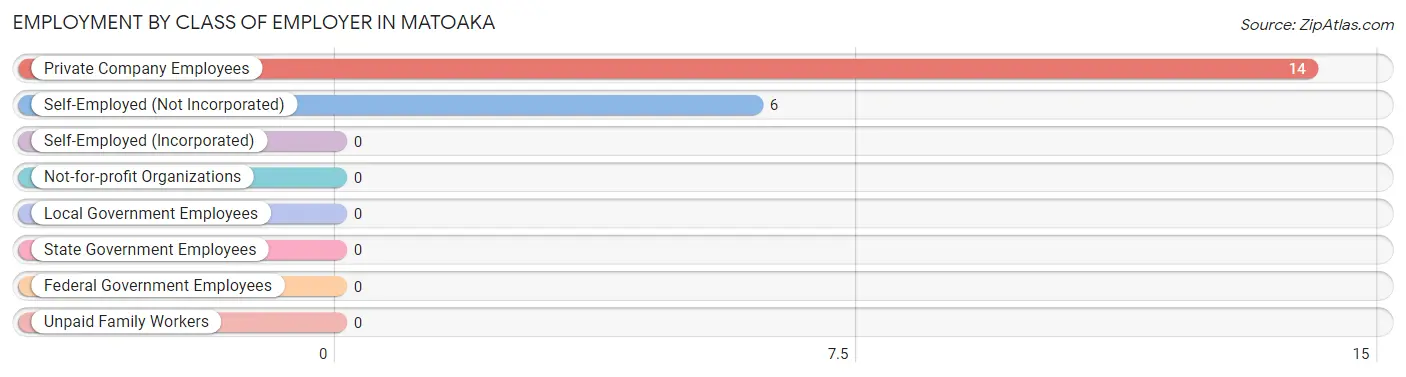
Employment by Class of Employer in Matoaka
Among the 20 employed individuals in Matoaka, private company employees (14 | 70.0%), and self-employed (not incorporated) (6 | 30.0%) make up the most common classes of employment.
| Employer Class | # Employees | % Employees |
| Private Company Employees | 14 | 70.0% |
| Self-Employed (Incorporated) | 0 | 0.0% |
| Self-Employed (Not Incorporated) | 6 | 30.0% |
| Not-for-profit Organizations | 0 | 0.0% |
| Local Government Employees | 0 | 0.0% |
| State Government Employees | 0 | 0.0% |
| Federal Government Employees | 0 | 0.0% |
| Unpaid Family Workers | 0 | 0.0% |
| Total | 20 | 100.0% |
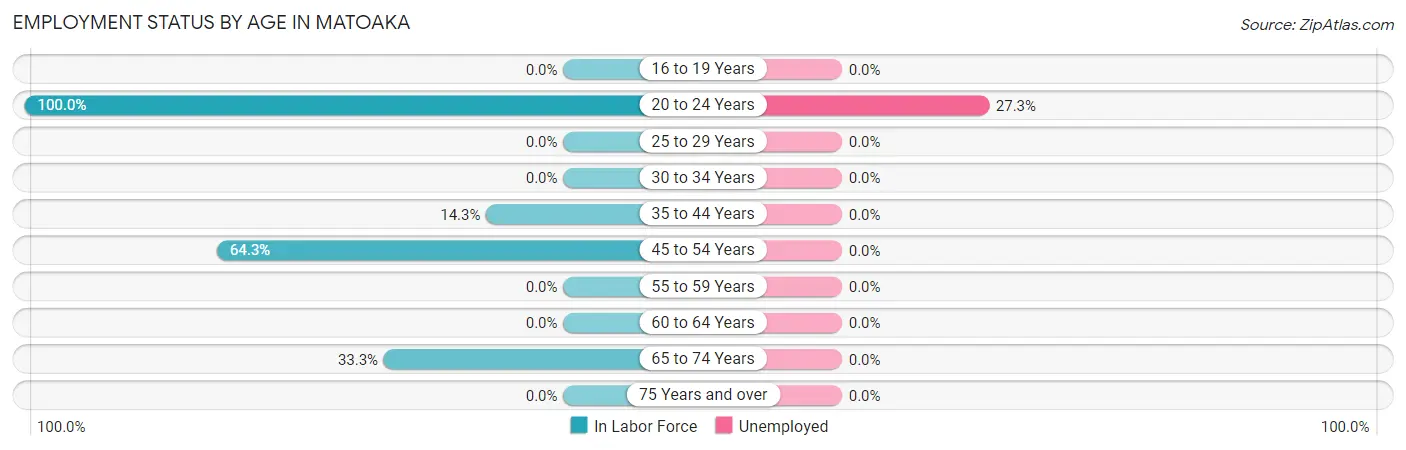
Employment Status by Age in Matoaka
According to the labor force statistics for Matoaka, out of the total population over 16 years of age (81), 30.9% or 25 individuals are in the labor force, with 12.0% or 3 of them unemployed. The age group with the highest labor force participation rate is 20 to 24 years, with 100.0% or 11 individuals in the labor force. Within the labor force, the 20 to 24 years age range has the highest percentage of unemployed individuals, with 27.3% or 3 of them being unemployed.
| Age Bracket | In Labor Force | Unemployed |
| 16 to 19 Years | 0 (0.0%) | 0 (0.0%) |
| 20 to 24 Years | 11 (100.0%) | 3 (27.3%) |
| 25 to 29 Years | 0 (0.0%) | 0 (0.0%) |
| 30 to 34 Years | 0 (0.0%) | 0 (0.0%) |
| 35 to 44 Years | 2 (14.3%) | 0 (0.0%) |
| 45 to 54 Years | 9 (64.3%) | 0 (0.0%) |
| 55 to 59 Years | 0 (0.0%) | 0 (0.0%) |
| 60 to 64 Years | 0 (0.0%) | 0 (0.0%) |
| 65 to 74 Years | 3 (33.3%) | 0 (0.0%) |
| 75 Years and over | 0 (0.0%) | 0 (0.0%) |
| Total | 25 (30.9%) | 3 (12.0%) |
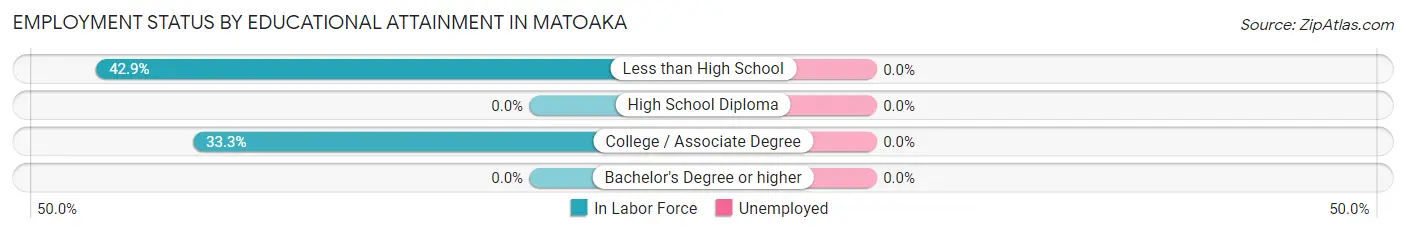
Employment Status by Educational Attainment in Matoaka
| Educational Attainment | In Labor Force | Unemployed |
| Less than High School | 9 (42.9%) | 0 (0.0%) |
| High School Diploma | 0 (0.0%) | 0 (0.0%) |
| College / Associate Degree | 2 (33.3%) | 0 (0.0%) |
| Bachelor's Degree or higher | 0 (0.0%) | 0 (0.0%) |
| Total | 11 (31.4%) | 0 (0.0%) |
Employment Occupations by Sex in Matoaka
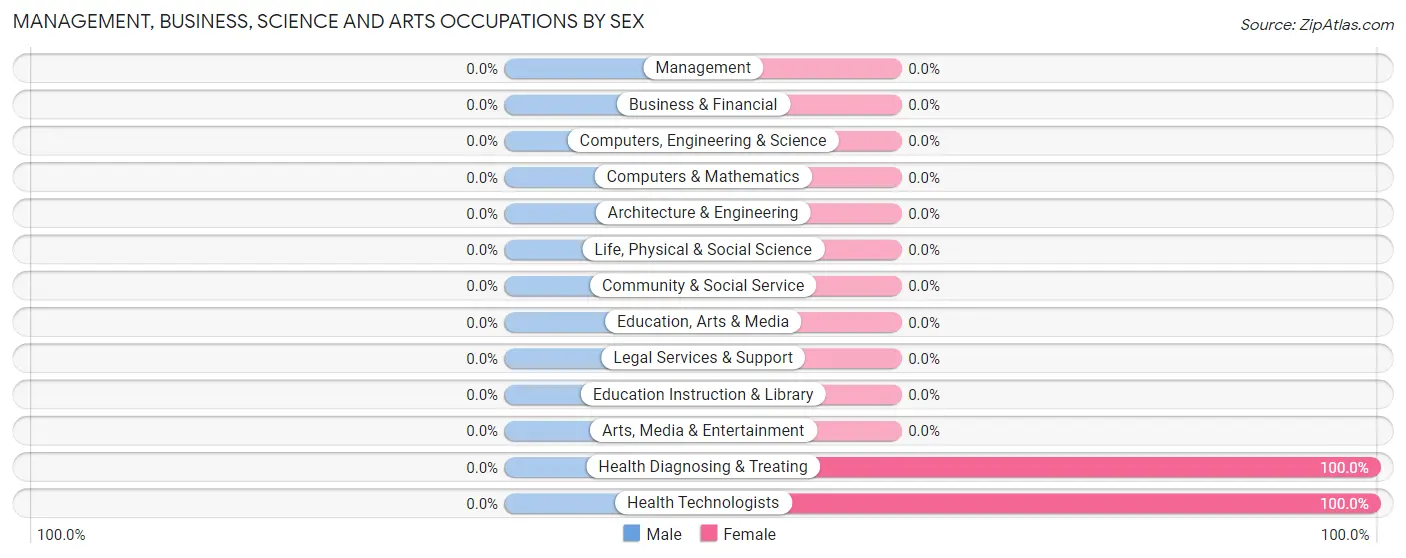
Management, Business, Science and Arts Occupations
The most common Management, Business, Science and Arts occupations in Matoaka are Health Diagnosing & Treating (2 | 9.1%), and Health Technologists (2 | 9.1%).
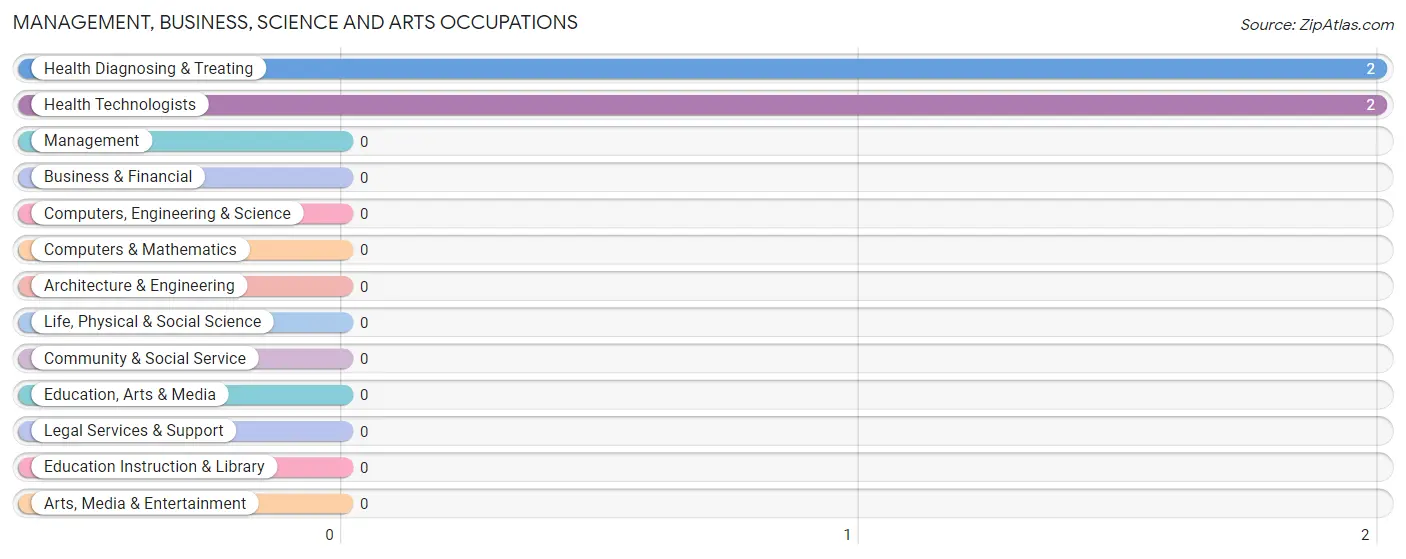
Management, Business, Science and Arts Occupations by Sex
| Occupation | Male | Female |
| Management | 0 (0.0%) | 0 (0.0%) |
| Business & Financial | 0 (0.0%) | 0 (0.0%) |
| Computers, Engineering & Science | 0 (0.0%) | 0 (0.0%) |
| Computers & Mathematics | 0 (0.0%) | 0 (0.0%) |
| Architecture & Engineering | 0 (0.0%) | 0 (0.0%) |
| Life, Physical & Social Science | 0 (0.0%) | 0 (0.0%) |
| Community & Social Service | 0 (0.0%) | 0 (0.0%) |
| Education, Arts & Media | 0 (0.0%) | 0 (0.0%) |
| Legal Services & Support | 0 (0.0%) | 0 (0.0%) |
| Education Instruction & Library | 0 (0.0%) | 0 (0.0%) |
| Arts, Media & Entertainment | 0 (0.0%) | 0 (0.0%) |
| Health Diagnosing & Treating | 0 (0.0%) | 2 (100.0%) |
| Health Technologists | 0 (0.0%) | 2 (100.0%) |
| Total (Category) | 0 (0.0%) | 2 (100.0%) |
| Total (Overall) | 5 (22.7%) | 17 (77.3%) |
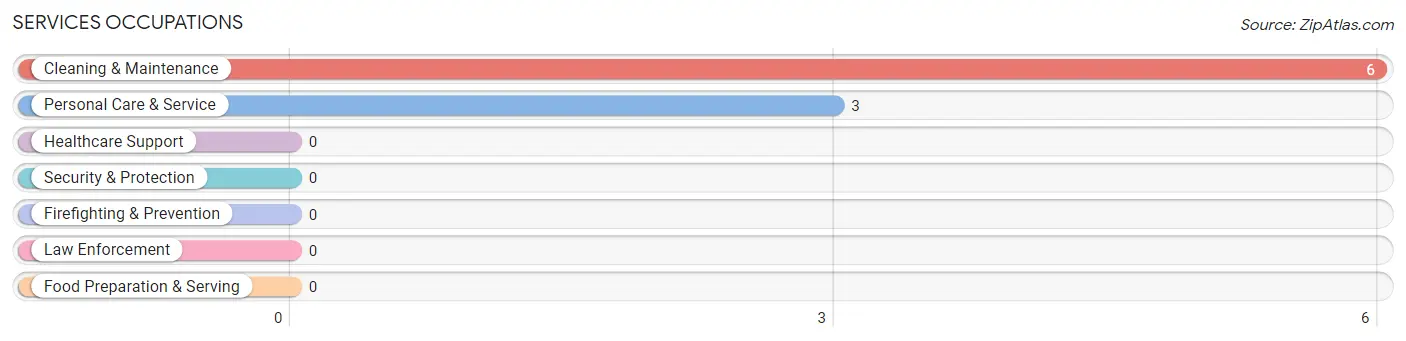
Services Occupations
The most common Services occupations in Matoaka are Cleaning & Maintenance (6 | 27.3%), and Personal Care & Service (3 | 13.6%).
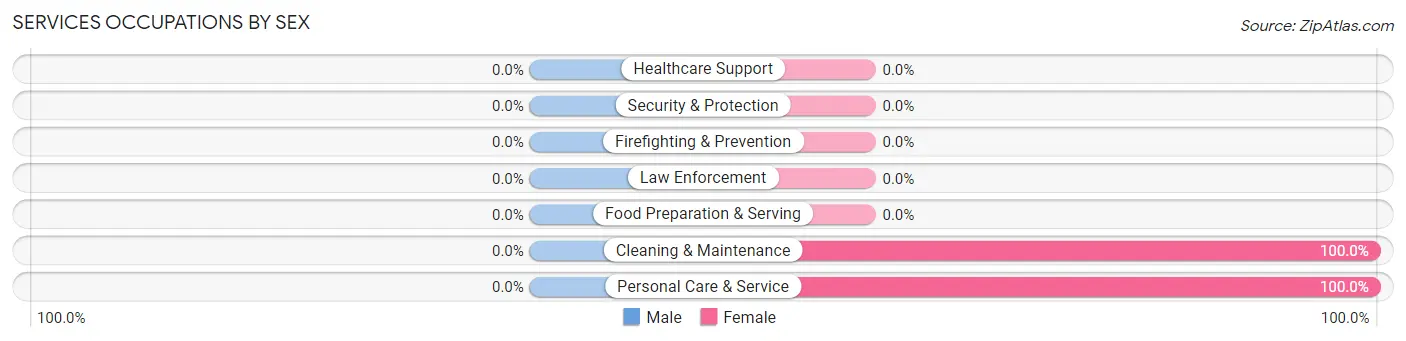
Services Occupations by Sex
| Occupation | Male | Female |
| Healthcare Support | 0 (0.0%) | 0 (0.0%) |
| Security & Protection | 0 (0.0%) | 0 (0.0%) |
| Firefighting & Prevention | 0 (0.0%) | 0 (0.0%) |
| Law Enforcement | 0 (0.0%) | 0 (0.0%) |
| Food Preparation & Serving | 0 (0.0%) | 0 (0.0%) |
| Cleaning & Maintenance | 0 (0.0%) | 6 (100.0%) |
| Personal Care & Service | 0 (0.0%) | 3 (100.0%) |
| Total (Category) | 0 (0.0%) | 9 (100.0%) |
| Total (Overall) | 5 (22.7%) | 17 (77.3%) |
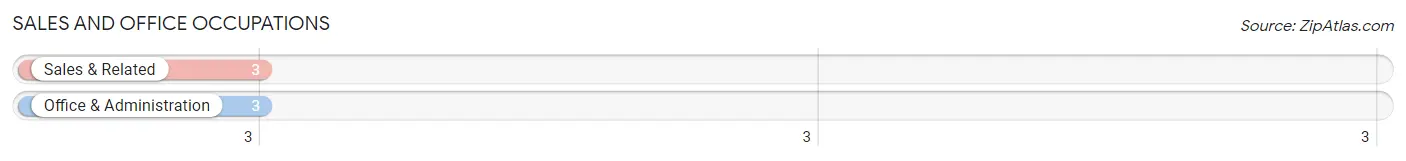
Sales and Office Occupations
The most common Sales and Office occupations in Matoaka are Sales & Related (3 | 13.6%), and Office & Administration (3 | 13.6%).
Sales and Office Occupations by Sex
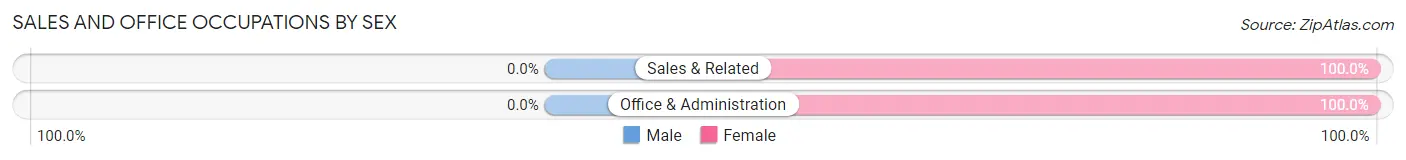
| Occupation | Male | Female |
| Sales & Related | 0 (0.0%) | 3 (100.0%) |
| Office & Administration | 0 (0.0%) | 3 (100.0%) |
| Total (Category) | 0 (0.0%) | 6 (100.0%) |
| Total (Overall) | 5 (22.7%) | 17 (77.3%) |
Natural Resources, Construction and Maintenance Occupations
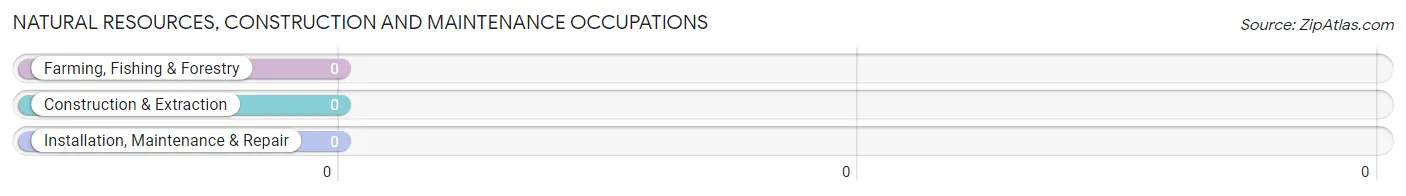
Natural Resources, Construction and Maintenance Occupations by Sex
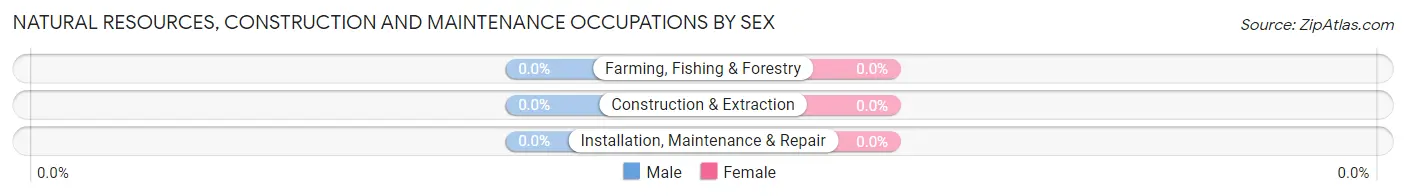
| Occupation | Male | Female |
| Farming, Fishing & Forestry | 0 (0.0%) | 0 (0.0%) |
| Construction & Extraction | 0 (0.0%) | 0 (0.0%) |
| Installation, Maintenance & Repair | 0 (0.0%) | 0 (0.0%) |
| Total (Category) | 0 (0.0%) | 0 (0.0%) |
| Total (Overall) | 5 (22.7%) | 17 (77.3%) |
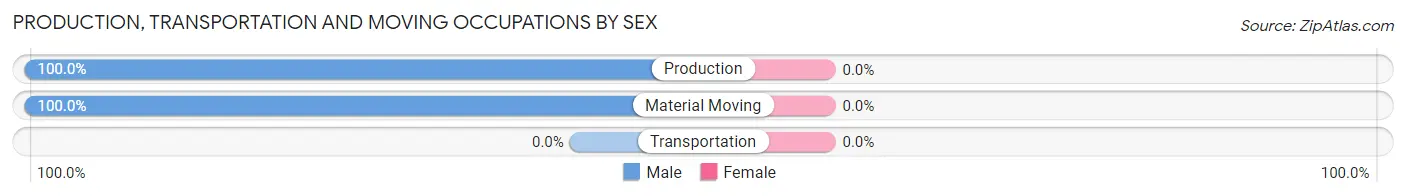
Production, Transportation and Moving Occupations
The most common Production, Transportation and Moving occupations in Matoaka are Material Moving (3 | 13.6%), and Production (2 | 9.1%).
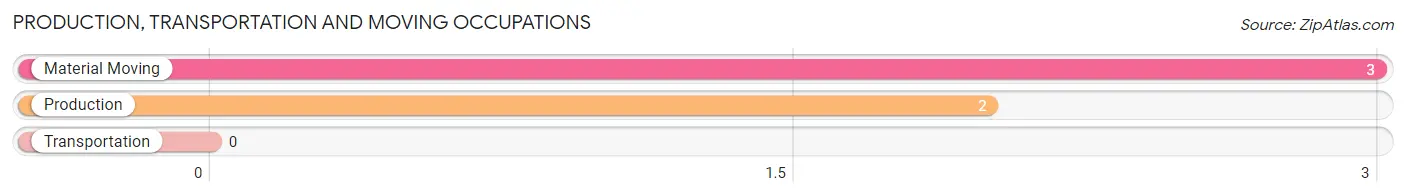
Production, Transportation and Moving Occupations by Sex
| Occupation | Male | Female |
| Production | 2 (100.0%) | 0 (0.0%) |
| Transportation | 0 (0.0%) | 0 (0.0%) |
| Material Moving | 3 (100.0%) | 0 (0.0%) |
| Total (Category) | 5 (100.0%) | 0 (0.0%) |
| Total (Overall) | 5 (22.7%) | 17 (77.3%) |
Employment Industries by Sex in Matoaka
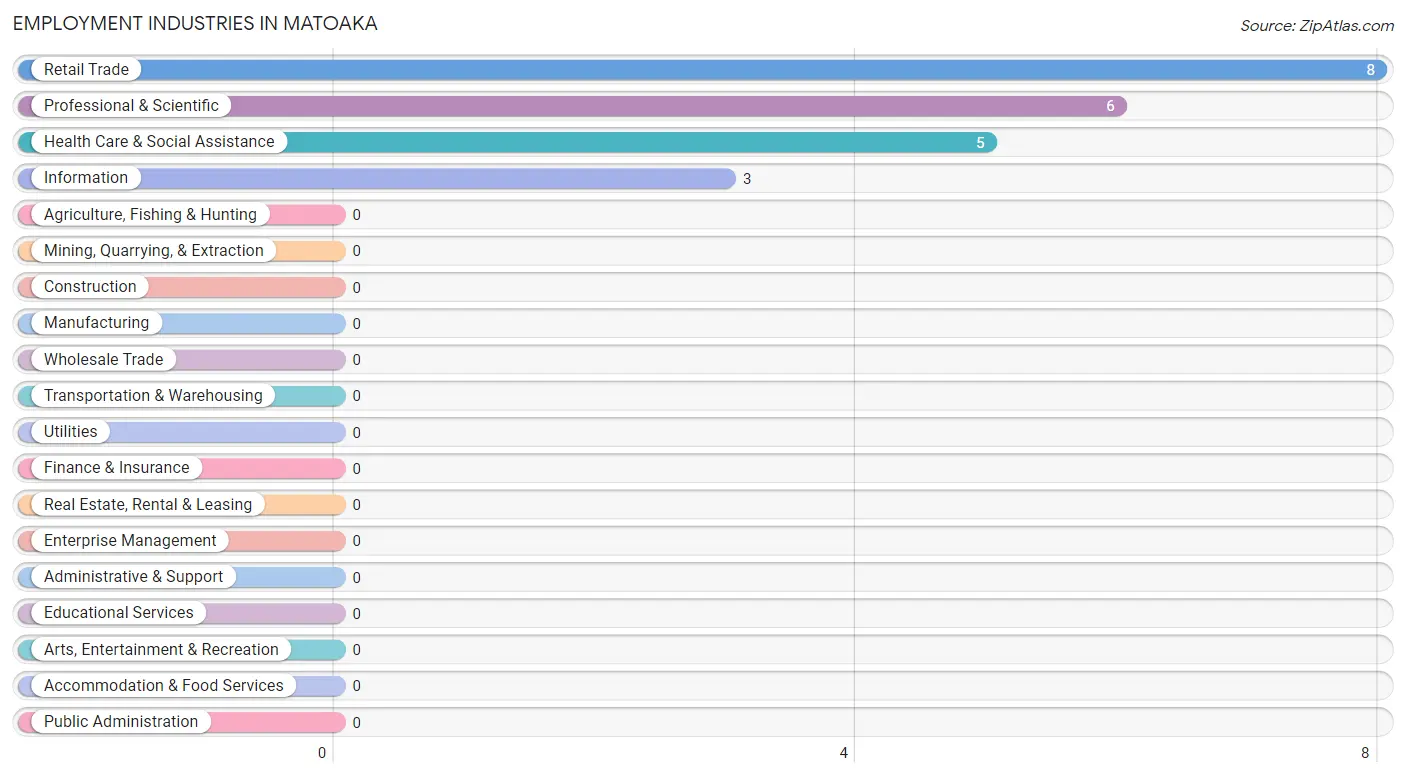
Employment Industries in Matoaka
The major employment industries in Matoaka include Retail Trade (8 | 36.4%), Professional & Scientific (6 | 27.3%), Health Care & Social Assistance (5 | 22.7%), and Information (3 | 13.6%).
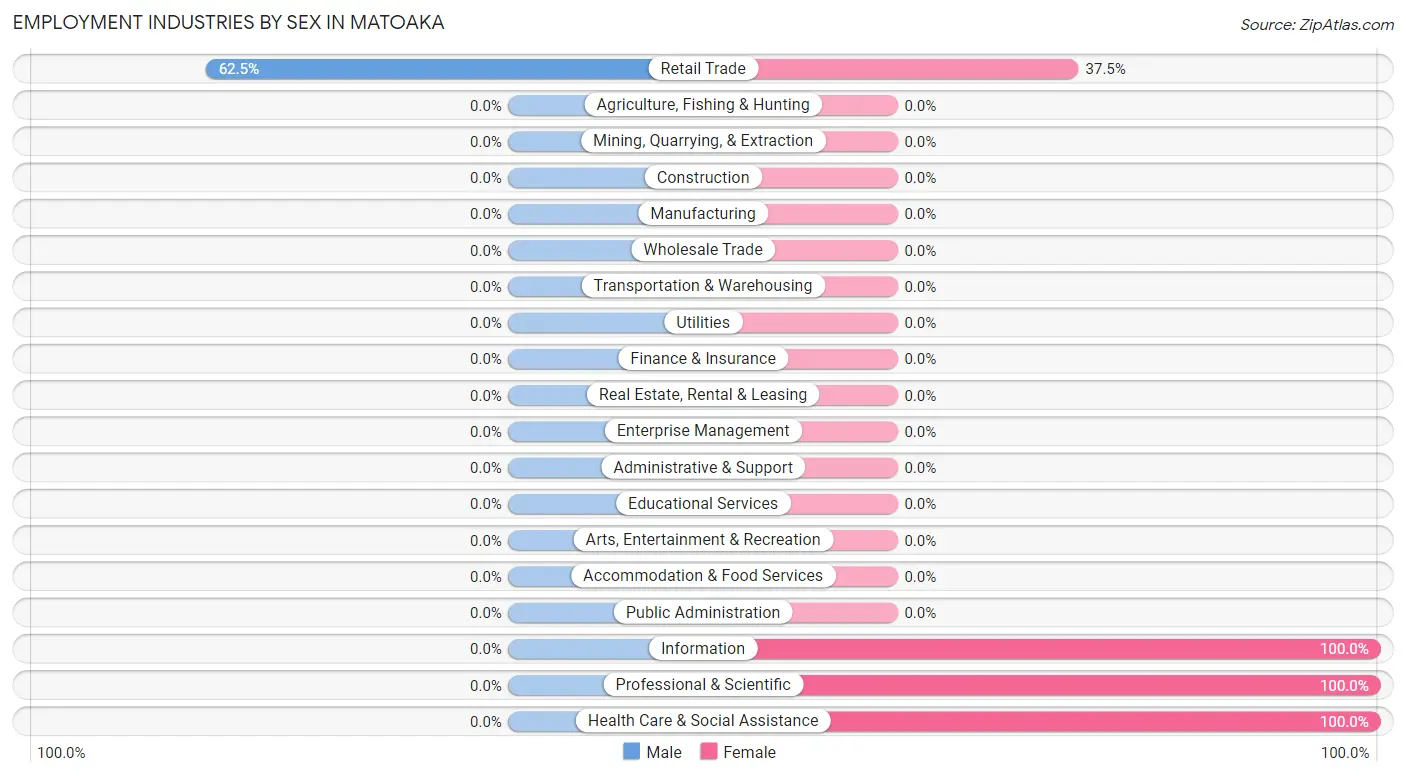
Employment Industries by Sex in Matoaka
| Industry | Male | Female |
| Agriculture, Fishing & Hunting | 0 (0.0%) | 0 (0.0%) |
| Mining, Quarrying, & Extraction | 0 (0.0%) | 0 (0.0%) |
| Construction | 0 (0.0%) | 0 (0.0%) |
| Manufacturing | 0 (0.0%) | 0 (0.0%) |
| Wholesale Trade | 0 (0.0%) | 0 (0.0%) |
| Retail Trade | 5 (62.5%) | 3 (37.5%) |
| Transportation & Warehousing | 0 (0.0%) | 0 (0.0%) |
| Utilities | 0 (0.0%) | 0 (0.0%) |
| Information | 0 (0.0%) | 3 (100.0%) |
| Finance & Insurance | 0 (0.0%) | 0 (0.0%) |
| Real Estate, Rental & Leasing | 0 (0.0%) | 0 (0.0%) |
| Professional & Scientific | 0 (0.0%) | 6 (100.0%) |
| Enterprise Management | 0 (0.0%) | 0 (0.0%) |
| Administrative & Support | 0 (0.0%) | 0 (0.0%) |
| Educational Services | 0 (0.0%) | 0 (0.0%) |
| Health Care & Social Assistance | 0 (0.0%) | 5 (100.0%) |
| Arts, Entertainment & Recreation | 0 (0.0%) | 0 (0.0%) |
| Accommodation & Food Services | 0 (0.0%) | 0 (0.0%) |
| Public Administration | 0 (0.0%) | 0 (0.0%) |
| Total | 5 (22.7%) | 17 (77.3%) |
Education in Matoaka
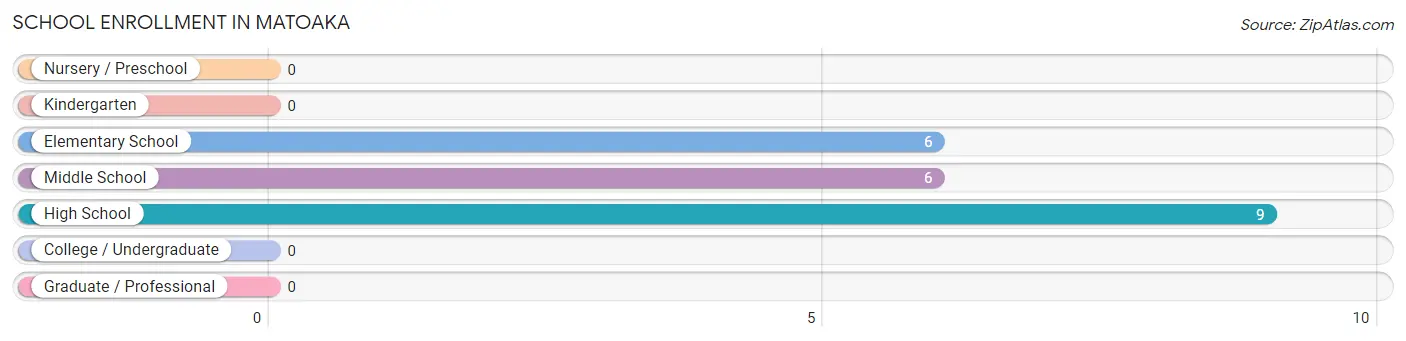
School Enrollment in Matoaka
The most common levels of schooling among the 21 students in Matoaka are high school (9 | 42.9%), elementary school (6 | 28.6%), and middle school (6 | 28.6%).
| School Level | # Students | % Students |
| Nursery / Preschool | 0 | 0.0% |
| Kindergarten | 0 | 0.0% |
| Elementary School | 6 | 28.6% |
| Middle School | 6 | 28.6% |
| High School | 9 | 42.9% |
| College / Undergraduate | 0 | 0.0% |
| Graduate / Professional | 0 | 0.0% |
| Total | 21 | 100.0% |
School Enrollment by Age by Funding Source in Matoaka
Out of a total of 21 students who are enrolled in schools in Matoaka, 12 (57.1%) attend a private institution, while the remaining 9 (42.9%) are enrolled in public schools. The age group of 15 to 17 year olds has the highest likelihood of being enrolled in private schools, with 2 (100.0% in the age bracket) enrolled. Conversely, the age group of 5 to 9 year old has the lowest likelihood of being enrolled in a private school, with 4 (66.7% in the age bracket) attending a public institution.
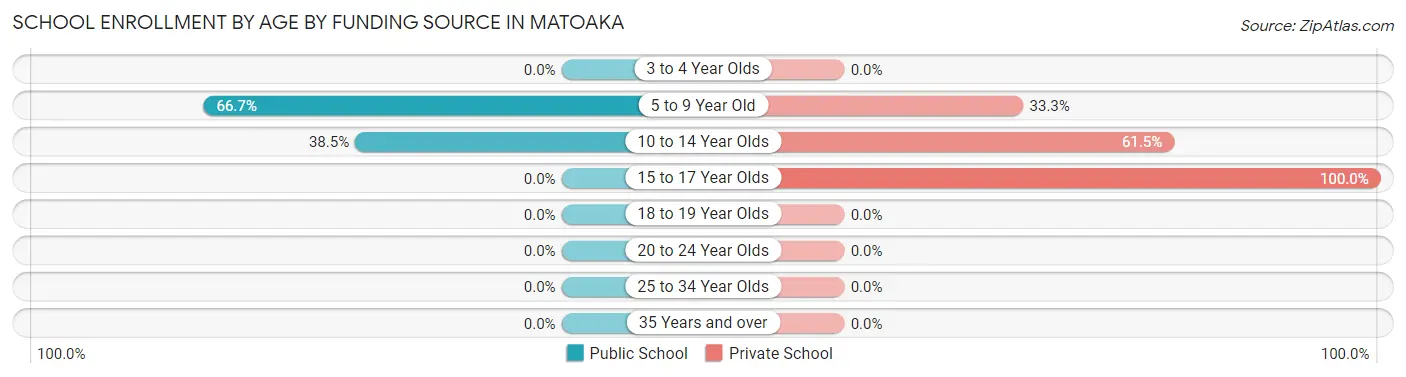
| Age Bracket | Public School | Private School |
| 3 to 4 Year Olds | 0 (0.0%) | 0 (0.0%) |
| 5 to 9 Year Old | 4 (66.7%) | 2 (33.3%) |
| 10 to 14 Year Olds | 5 (38.5%) | 8 (61.5%) |
| 15 to 17 Year Olds | 0 (0.0%) | 2 (100.0%) |
| 18 to 19 Year Olds | 0 (0.0%) | 0 (0.0%) |
| 20 to 24 Year Olds | 0 (0.0%) | 0 (0.0%) |
| 25 to 34 Year Olds | 0 (0.0%) | 0 (0.0%) |
| 35 Years and over | 0 (0.0%) | 0 (0.0%) |
| Total | 9 (42.9%) | 12 (57.1%) |
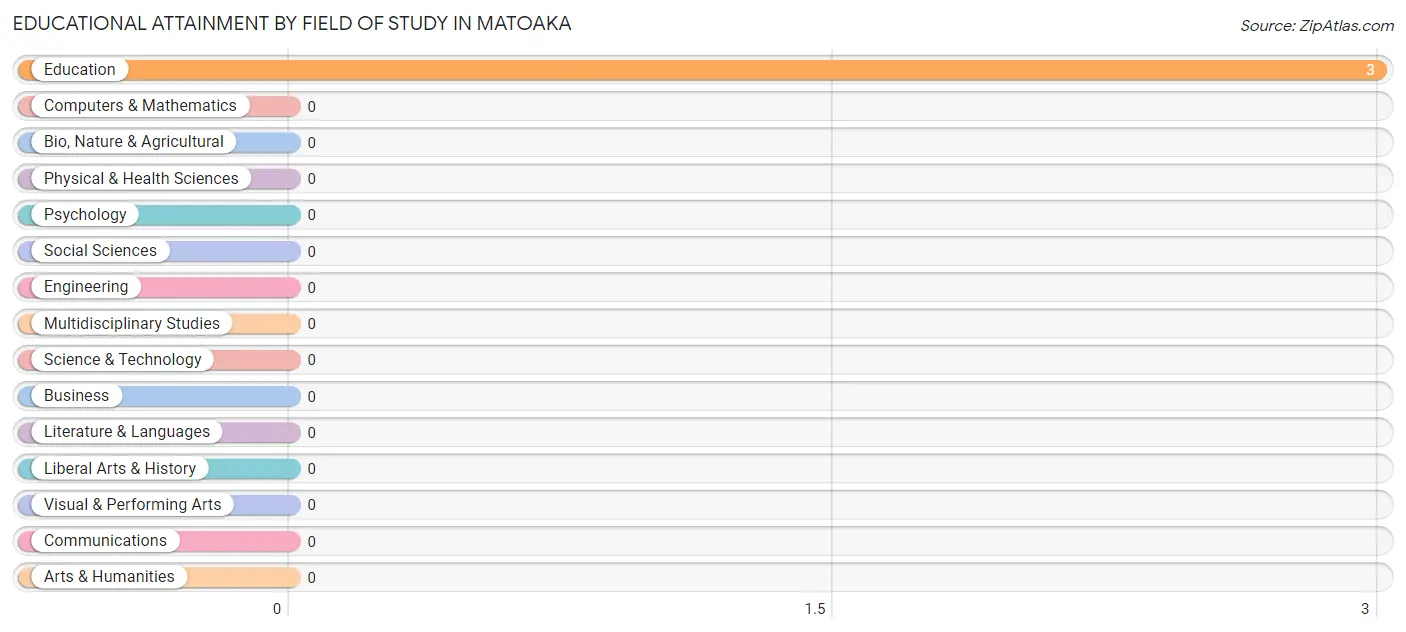
Educational Attainment by Field of Study in Matoaka
, and education (3 | 100.0%) are the most common fields of study among 3 individuals in Matoaka who have obtained a bachelor's degree or higher.
| Field of Study | # Graduates | % Graduates |
| Computers & Mathematics | 0 | 0.0% |
| Bio, Nature & Agricultural | 0 | 0.0% |
| Physical & Health Sciences | 0 | 0.0% |
| Psychology | 0 | 0.0% |
| Social Sciences | 0 | 0.0% |
| Engineering | 0 | 0.0% |
| Multidisciplinary Studies | 0 | 0.0% |
| Science & Technology | 0 | 0.0% |
| Business | 0 | 0.0% |
| Education | 3 | 100.0% |
| Literature & Languages | 0 | 0.0% |
| Liberal Arts & History | 0 | 0.0% |
| Visual & Performing Arts | 0 | 0.0% |
| Communications | 0 | 0.0% |
| Arts & Humanities | 0 | 0.0% |
| Total | 3 | 100.0% |
Transportation & Commute in Matoaka
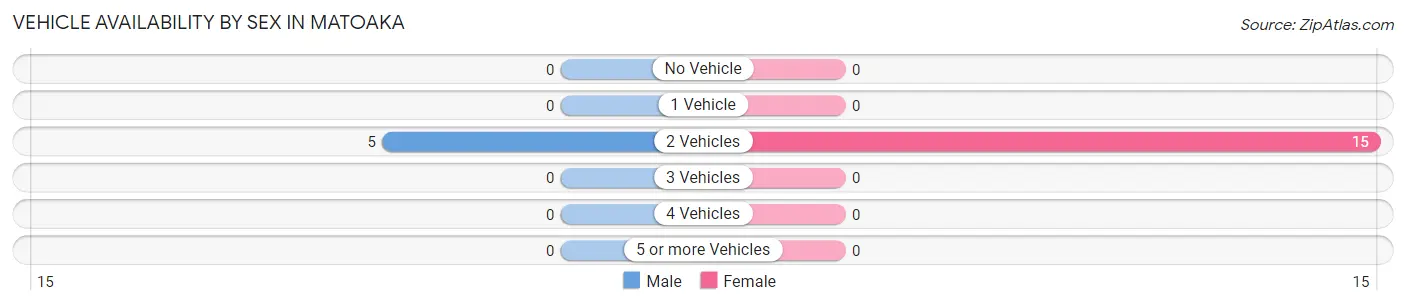
Vehicle Availability by Sex in Matoaka
The most prevalent vehicle ownership categories in Matoaka are males with 2 vehicles (5, accounting for 100.0%) and females with 2 vehicles (15, making up 33.3%).
| Vehicles Available | Male | Female |
| No Vehicle | 0 (0.0%) | 0 (0.0%) |
| 1 Vehicle | 0 (0.0%) | 0 (0.0%) |
| 2 Vehicles | 5 (100.0%) | 15 (100.0%) |
| 3 Vehicles | 0 (0.0%) | 0 (0.0%) |
| 4 Vehicles | 0 (0.0%) | 0 (0.0%) |
| 5 or more Vehicles | 0 (0.0%) | 0 (0.0%) |
| Total | 5 (100.0%) | 15 (100.0%) |
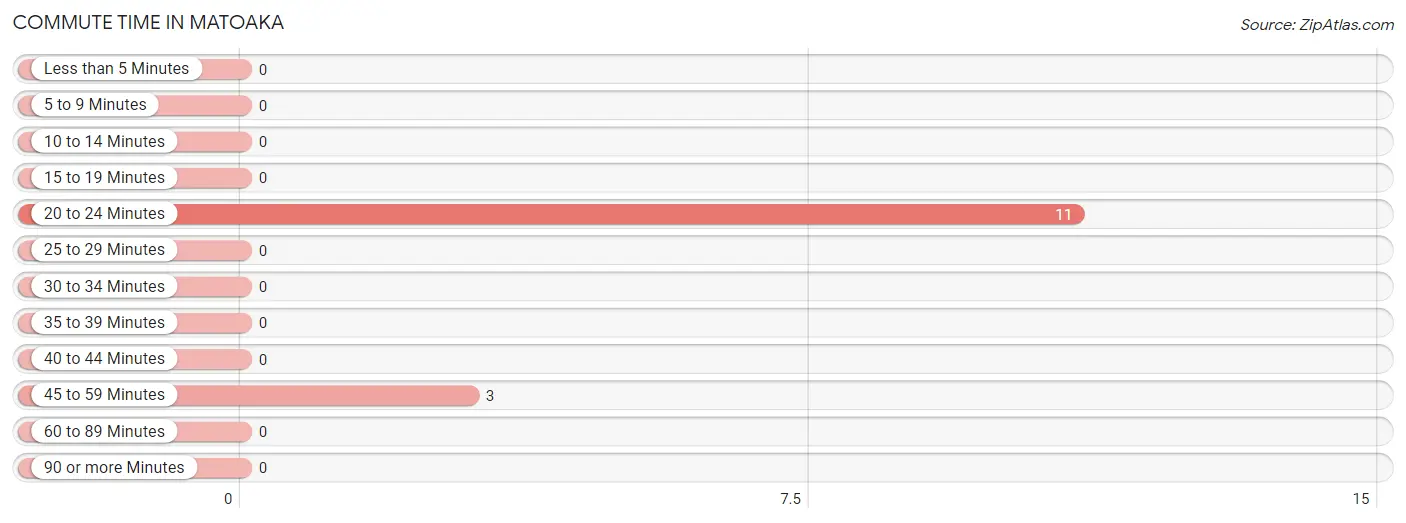
Commute Time in Matoaka
The most frequently occuring commute durations in Matoaka are 20 to 24 minutes (11 commuters, 78.6%), 45 to 59 minutes (3 commuters, 21.4%), and less than 5 minutes (0 commuters, 0.0%).
| Commute Time | # Commuters | % Commuters |
| Less than 5 Minutes | 0 | 0.0% |
| 5 to 9 Minutes | 0 | 0.0% |
| 10 to 14 Minutes | 0 | 0.0% |
| 15 to 19 Minutes | 0 | 0.0% |
| 20 to 24 Minutes | 11 | 78.6% |
| 25 to 29 Minutes | 0 | 0.0% |
| 30 to 34 Minutes | 0 | 0.0% |
| 35 to 39 Minutes | 0 | 0.0% |
| 40 to 44 Minutes | 0 | 0.0% |
| 45 to 59 Minutes | 3 | 21.4% |
| 60 to 89 Minutes | 0 | 0.0% |
| 90 or more Minutes | 0 | 0.0% |
Commute Time by Sex in Matoaka
The most common commute times in Matoaka are 20 to 24 minutes (5 commuters, 100.0%) for males and 20 to 24 minutes (6 commuters, 66.7%) for females.
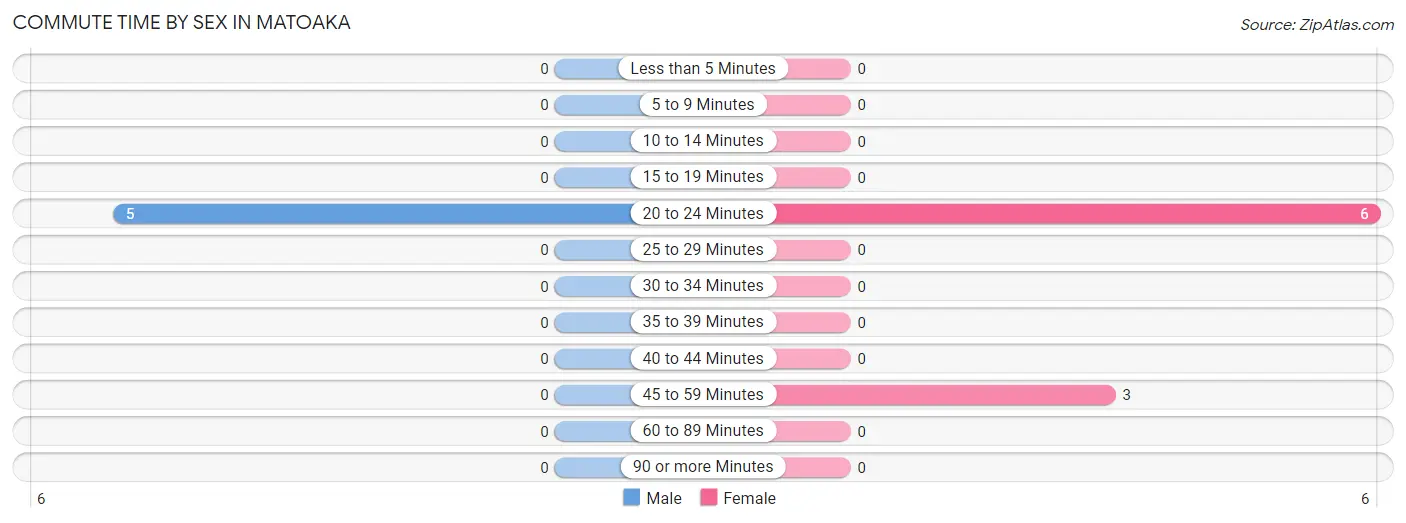
| Commute Time | Male | Female |
| Less than 5 Minutes | 0 (0.0%) | 0 (0.0%) |
| 5 to 9 Minutes | 0 (0.0%) | 0 (0.0%) |
| 10 to 14 Minutes | 0 (0.0%) | 0 (0.0%) |
| 15 to 19 Minutes | 0 (0.0%) | 0 (0.0%) |
| 20 to 24 Minutes | 5 (100.0%) | 6 (66.7%) |
| 25 to 29 Minutes | 0 (0.0%) | 0 (0.0%) |
| 30 to 34 Minutes | 0 (0.0%) | 0 (0.0%) |
| 35 to 39 Minutes | 0 (0.0%) | 0 (0.0%) |
| 40 to 44 Minutes | 0 (0.0%) | 0 (0.0%) |
| 45 to 59 Minutes | 0 (0.0%) | 3 (33.3%) |
| 60 to 89 Minutes | 0 (0.0%) | 0 (0.0%) |
| 90 or more Minutes | 0 (0.0%) | 0 (0.0%) |
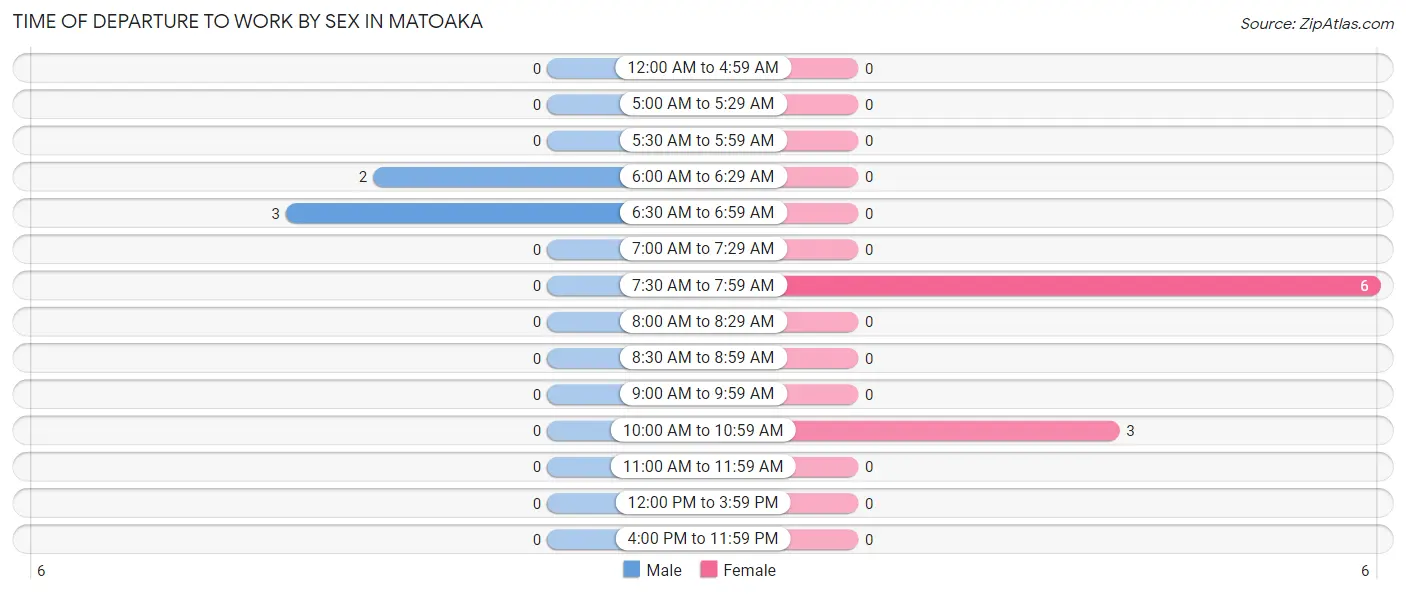
Time of Departure to Work by Sex in Matoaka
The most frequent times of departure to work in Matoaka are 6:30 AM to 6:59 AM (3, 60.0%) for males and 7:30 AM to 7:59 AM (6, 66.7%) for females.
| Time of Departure | Male | Female |
| 12:00 AM to 4:59 AM | 0 (0.0%) | 0 (0.0%) |
| 5:00 AM to 5:29 AM | 0 (0.0%) | 0 (0.0%) |
| 5:30 AM to 5:59 AM | 0 (0.0%) | 0 (0.0%) |
| 6:00 AM to 6:29 AM | 2 (40.0%) | 0 (0.0%) |
| 6:30 AM to 6:59 AM | 3 (60.0%) | 0 (0.0%) |
| 7:00 AM to 7:29 AM | 0 (0.0%) | 0 (0.0%) |
| 7:30 AM to 7:59 AM | 0 (0.0%) | 6 (66.7%) |
| 8:00 AM to 8:29 AM | 0 (0.0%) | 0 (0.0%) |
| 8:30 AM to 8:59 AM | 0 (0.0%) | 0 (0.0%) |
| 9:00 AM to 9:59 AM | 0 (0.0%) | 0 (0.0%) |
| 10:00 AM to 10:59 AM | 0 (0.0%) | 3 (33.3%) |
| 11:00 AM to 11:59 AM | 0 (0.0%) | 0 (0.0%) |
| 12:00 PM to 3:59 PM | 0 (0.0%) | 0 (0.0%) |
| 4:00 PM to 11:59 PM | 0 (0.0%) | 0 (0.0%) |
| Total | 5 (100.0%) | 9 (100.0%) |
Housing Occupancy in Matoaka
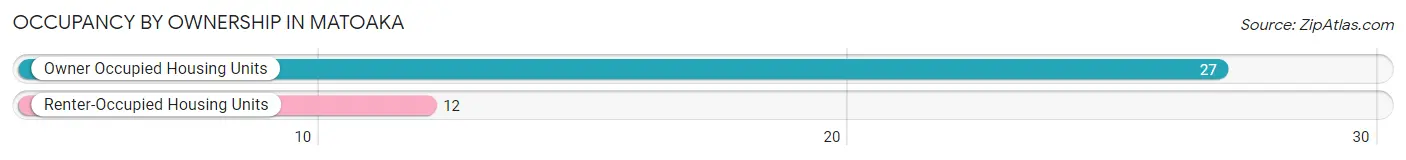
Occupancy by Ownership in Matoaka
Of the total 39 dwellings in Matoaka, owner-occupied units account for 27 (69.2%), while renter-occupied units make up 12 (30.8%).
| Occupancy | # Housing Units | % Housing Units |
| Owner Occupied Housing Units | 27 | 69.2% |
| Renter-Occupied Housing Units | 12 | 30.8% |
| Total Occupied Housing Units | 39 | 100.0% |
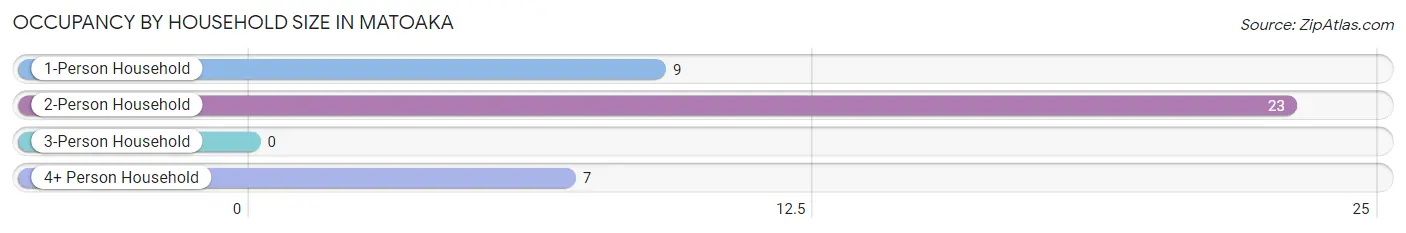
Occupancy by Household Size in Matoaka
| Household Size | # Housing Units | % Housing Units |
| 1-Person Household | 9 | 23.1% |
| 2-Person Household | 23 | 59.0% |
| 3-Person Household | 0 | 0.0% |
| 4+ Person Household | 7 | 17.9% |
| Total Housing Units | 39 | 100.0% |
Occupancy by Ownership by Household Size in Matoaka
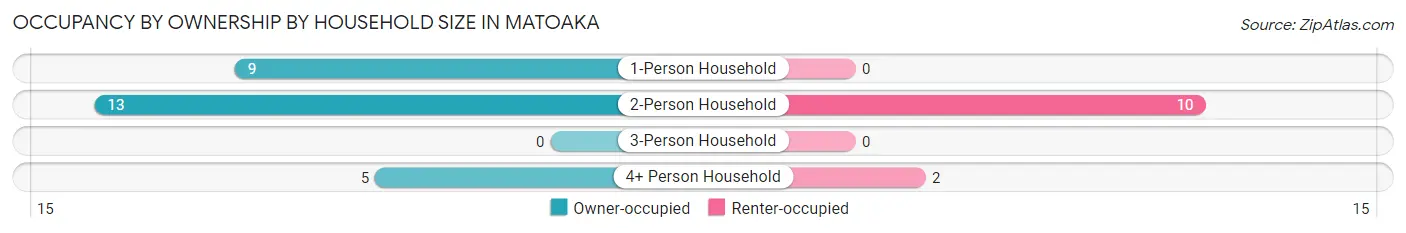
| Household Size | Owner-occupied | Renter-occupied |
| 1-Person Household | 9 (100.0%) | 0 (0.0%) |
| 2-Person Household | 13 (56.5%) | 10 (43.5%) |
| 3-Person Household | 0 (0.0%) | 0 (0.0%) |
| 4+ Person Household | 5 (71.4%) | 2 (28.6%) |
| Total Housing Units | 27 (69.2%) | 12 (30.8%) |
Occupancy by Educational Attainment in Matoaka
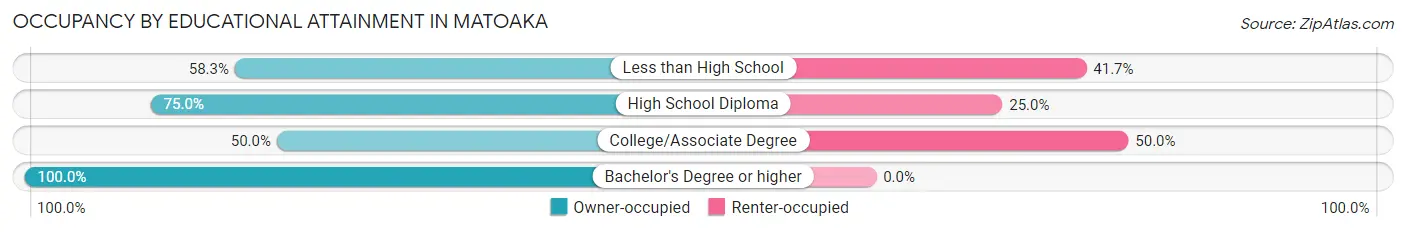
| Household Size | Owner-occupied | Renter-occupied |
| Less than High School | 7 (58.3%) | 5 (41.7%) |
| High School Diploma | 15 (75.0%) | 5 (25.0%) |
| College/Associate Degree | 2 (50.0%) | 2 (50.0%) |
| Bachelor's Degree or higher | 3 (100.0%) | 0 (0.0%) |
Occupancy by Age of Householder in Matoaka
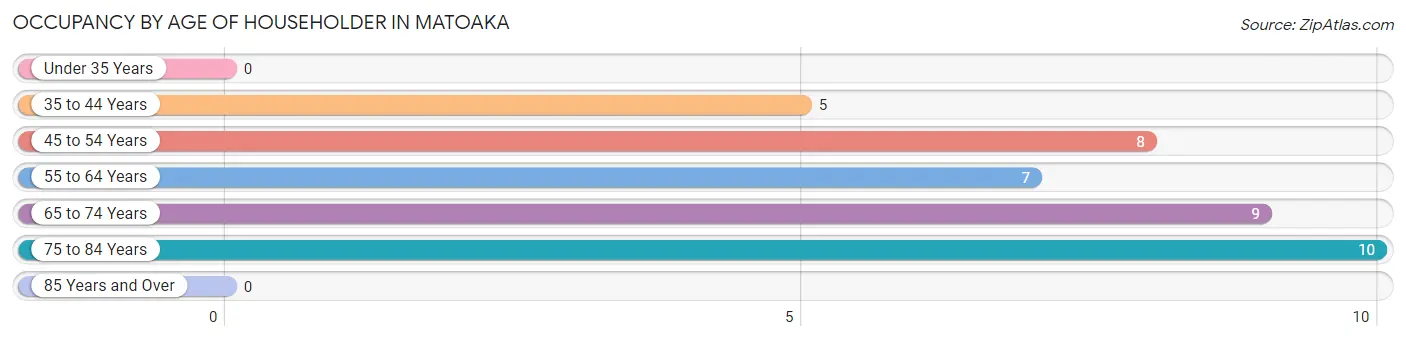
| Age Bracket | # Households | % Households |
| Under 35 Years | 0 | 0.0% |
| 35 to 44 Years | 5 | 12.8% |
| 45 to 54 Years | 8 | 20.5% |
| 55 to 64 Years | 7 | 17.9% |
| 65 to 74 Years | 9 | 23.1% |
| 75 to 84 Years | 10 | 25.6% |
| 85 Years and Over | 0 | 0.0% |
| Total | 39 | 100.0% |
Housing Finances in Matoaka
Median Income by Occupancy in Matoaka
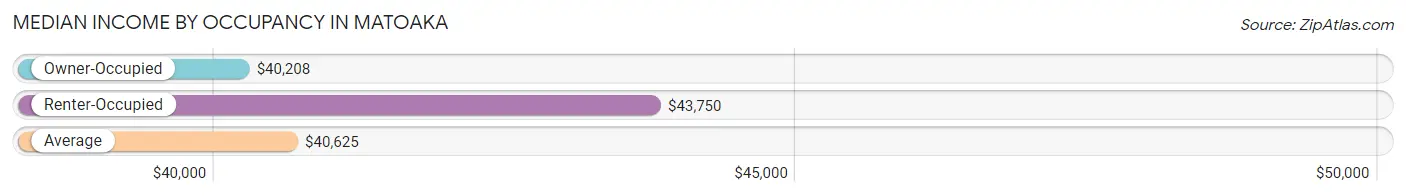
| Occupancy Type | # Households | Median Income |
| Owner-Occupied | 27 (69.2%) | $40,208 |
| Renter-Occupied | 12 (30.8%) | $43,750 |
| Average | 39 (100.0%) | $40,625 |
Occupancy by Householder Income Bracket in Matoaka
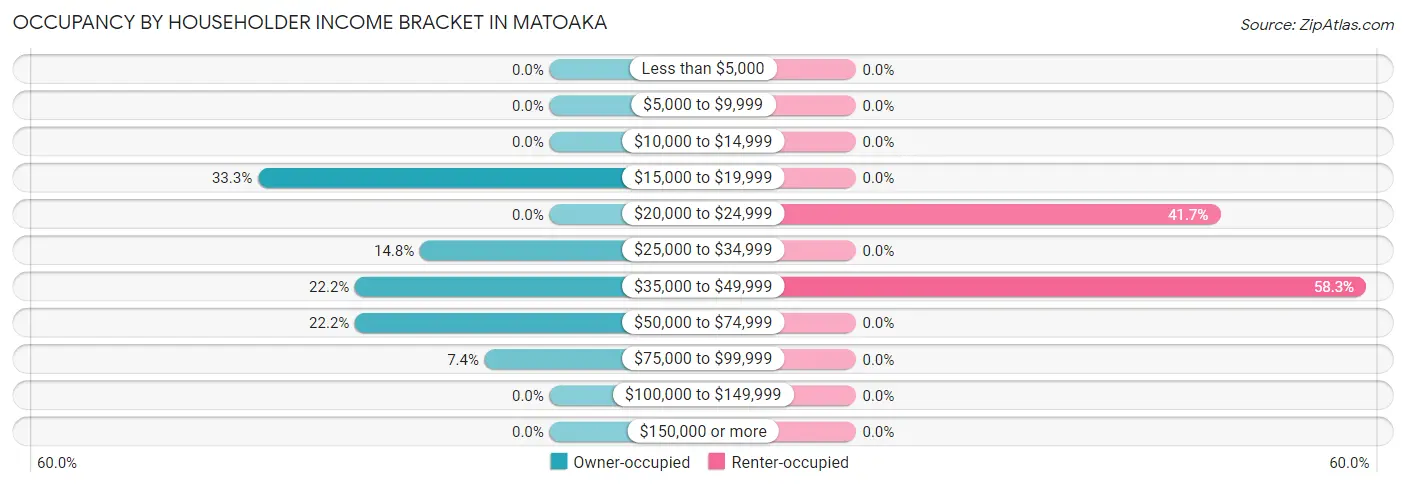
| Income Bracket | Owner-occupied | Renter-occupied |
| Less than $5,000 | 0 (0.0%) | 0 (0.0%) |
| $5,000 to $9,999 | 0 (0.0%) | 0 (0.0%) |
| $10,000 to $14,999 | 0 (0.0%) | 0 (0.0%) |
| $15,000 to $19,999 | 9 (33.3%) | 0 (0.0%) |
| $20,000 to $24,999 | 0 (0.0%) | 5 (41.7%) |
| $25,000 to $34,999 | 4 (14.8%) | 0 (0.0%) |
| $35,000 to $49,999 | 6 (22.2%) | 7 (58.3%) |
| $50,000 to $74,999 | 6 (22.2%) | 0 (0.0%) |
| $75,000 to $99,999 | 2 (7.4%) | 0 (0.0%) |
| $100,000 to $149,999 | 0 (0.0%) | 0 (0.0%) |
| $150,000 or more | 0 (0.0%) | 0 (0.0%) |
| Total | 27 (100.0%) | 12 (100.0%) |
Monthly Housing Cost Tiers in Matoaka
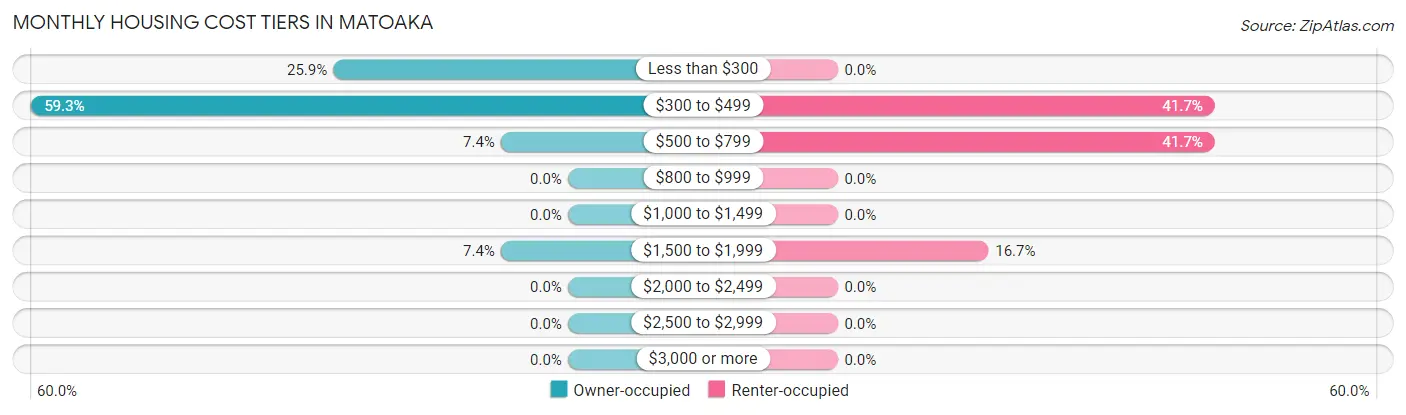
| Monthly Cost | Owner-occupied | Renter-occupied |
| Less than $300 | 7 (25.9%) | 0 (0.0%) |
| $300 to $499 | 16 (59.3%) | 5 (41.7%) |
| $500 to $799 | 2 (7.4%) | 5 (41.7%) |
| $800 to $999 | 0 (0.0%) | 0 (0.0%) |
| $1,000 to $1,499 | 0 (0.0%) | 0 (0.0%) |
| $1,500 to $1,999 | 2 (7.4%) | 2 (16.7%) |
| $2,000 to $2,499 | 0 (0.0%) | 0 (0.0%) |
| $2,500 to $2,999 | 0 (0.0%) | 0 (0.0%) |
| $3,000 or more | 0 (0.0%) | 0 (0.0%) |
| Total | 27 (100.0%) | 12 (100.0%) |
Physical Housing Characteristics in Matoaka
Housing Structures in Matoaka
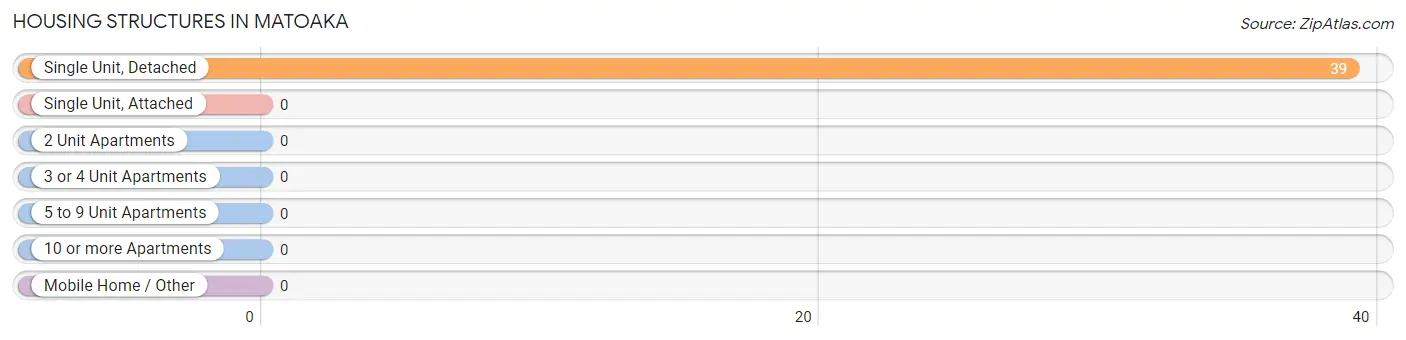
| Structure Type | # Housing Units | % Housing Units |
| Single Unit, Detached | 39 | 100.0% |
| Single Unit, Attached | 0 | 0.0% |
| 2 Unit Apartments | 0 | 0.0% |
| 3 or 4 Unit Apartments | 0 | 0.0% |
| 5 to 9 Unit Apartments | 0 | 0.0% |
| 10 or more Apartments | 0 | 0.0% |
| Mobile Home / Other | 0 | 0.0% |
| Total | 39 | 100.0% |
Housing Structures by Occupancy in Matoaka
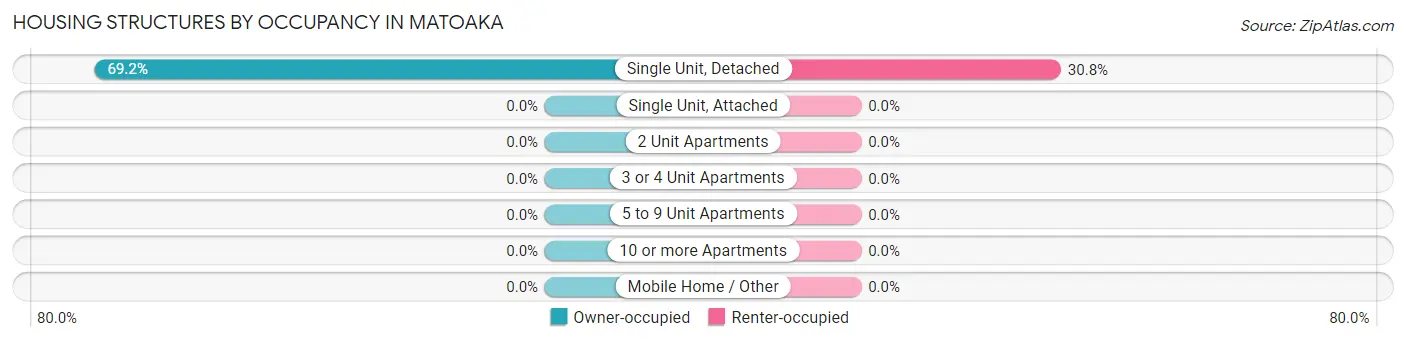
| Structure Type | Owner-occupied | Renter-occupied |
| Single Unit, Detached | 27 (69.2%) | 12 (30.8%) |
| Single Unit, Attached | 0 (0.0%) | 0 (0.0%) |
| 2 Unit Apartments | 0 (0.0%) | 0 (0.0%) |
| 3 or 4 Unit Apartments | 0 (0.0%) | 0 (0.0%) |
| 5 to 9 Unit Apartments | 0 (0.0%) | 0 (0.0%) |
| 10 or more Apartments | 0 (0.0%) | 0 (0.0%) |
| Mobile Home / Other | 0 (0.0%) | 0 (0.0%) |
| Total | 27 (69.2%) | 12 (30.8%) |
Housing Structures by Number of Rooms in Matoaka
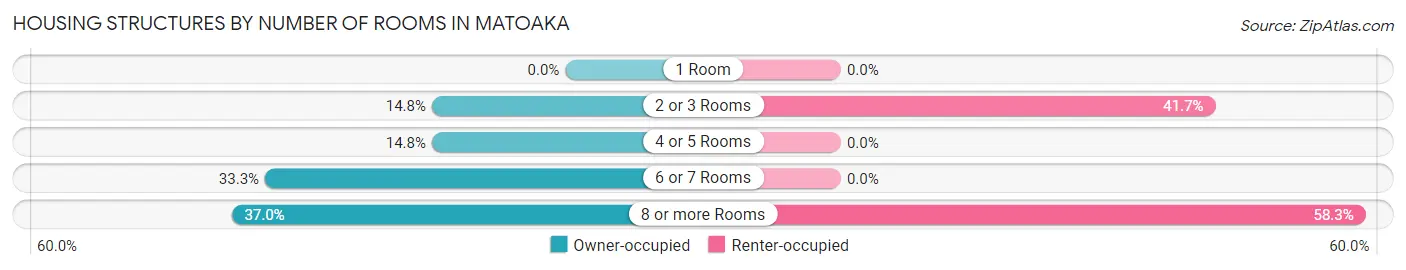
| Number of Rooms | Owner-occupied | Renter-occupied |
| 1 Room | 0 (0.0%) | 0 (0.0%) |
| 2 or 3 Rooms | 4 (14.8%) | 5 (41.7%) |
| 4 or 5 Rooms | 4 (14.8%) | 0 (0.0%) |
| 6 or 7 Rooms | 9 (33.3%) | 0 (0.0%) |
| 8 or more Rooms | 10 (37.0%) | 7 (58.3%) |
| Total | 27 (100.0%) | 12 (100.0%) |
Housing Structure by Heating Type in Matoaka
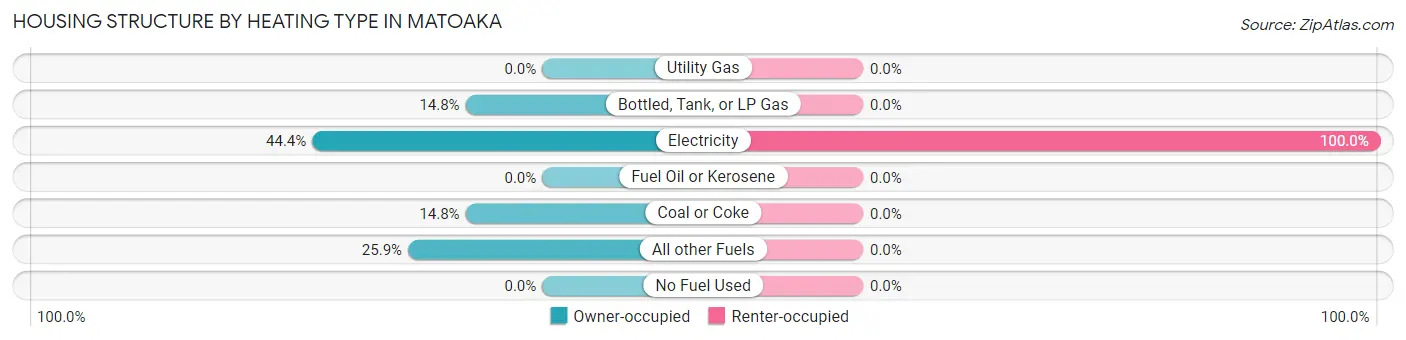
| Heating Type | Owner-occupied | Renter-occupied |
| Utility Gas | 0 (0.0%) | 0 (0.0%) |
| Bottled, Tank, or LP Gas | 4 (14.8%) | 0 (0.0%) |
| Electricity | 12 (44.4%) | 12 (100.0%) |
| Fuel Oil or Kerosene | 0 (0.0%) | 0 (0.0%) |
| Coal or Coke | 4 (14.8%) | 0 (0.0%) |
| All other Fuels | 7 (25.9%) | 0 (0.0%) |
| No Fuel Used | 0 (0.0%) | 0 (0.0%) |
| Total | 27 (100.0%) | 12 (100.0%) |
Household Vehicle Usage in Matoaka
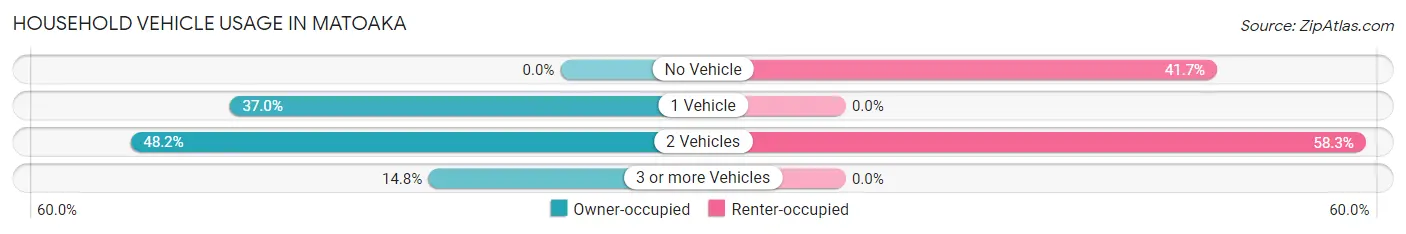
| Vehicles per Household | Owner-occupied | Renter-occupied |
| No Vehicle | 0 (0.0%) | 5 (41.7%) |
| 1 Vehicle | 10 (37.0%) | 0 (0.0%) |
| 2 Vehicles | 13 (48.1%) | 7 (58.3%) |
| 3 or more Vehicles | 4 (14.8%) | 0 (0.0%) |
| Total | 27 (100.0%) | 12 (100.0%) |
Real Estate & Mortgages in Matoaka
Real Estate and Mortgage Overview in Matoaka
| Characteristic | Without Mortgage | With Mortgage |
| Housing Units | 23 | 4 |
| Median Property Value | $55,000 | $0 |
| Median Household Income | $40,208 | $0 |
| Monthly Housing Costs | $317 | $0 |
| Real Estate Taxes | $199 | $0 |
Property Value by Mortgage Status in Matoaka
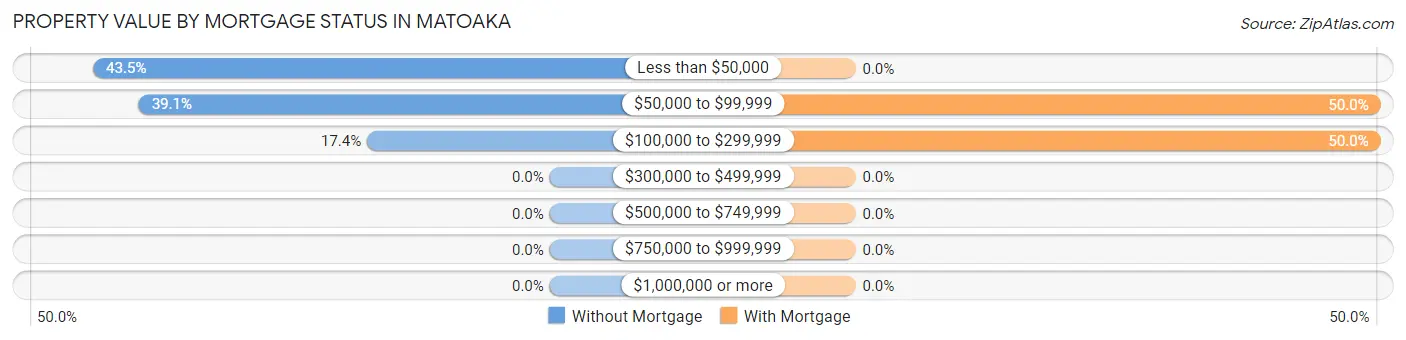
| Property Value | Without Mortgage | With Mortgage |
| Less than $50,000 | 10 (43.5%) | 0 (0.0%) |
| $50,000 to $99,999 | 9 (39.1%) | 2 (50.0%) |
| $100,000 to $299,999 | 4 (17.4%) | 2 (50.0%) |
| $300,000 to $499,999 | 0 (0.0%) | 0 (0.0%) |
| $500,000 to $749,999 | 0 (0.0%) | 0 (0.0%) |
| $750,000 to $999,999 | 0 (0.0%) | 0 (0.0%) |
| $1,000,000 or more | 0 (0.0%) | 0 (0.0%) |
| Total | 23 (100.0%) | 4 (100.0%) |
Household Income by Mortgage Status in Matoaka
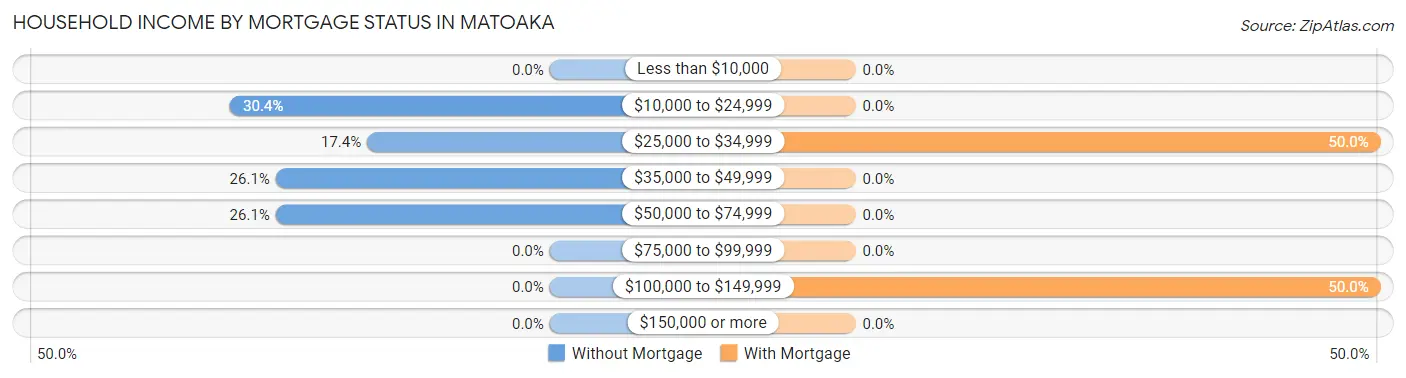
| Household Income | Without Mortgage | With Mortgage |
| Less than $10,000 | 0 (0.0%) | 0 (0.0%) |
| $10,000 to $24,999 | 7 (30.4%) | 0 (0.0%) |
| $25,000 to $34,999 | 4 (17.4%) | 2 (50.0%) |
| $35,000 to $49,999 | 6 (26.1%) | 0 (0.0%) |
| $50,000 to $74,999 | 6 (26.1%) | 0 (0.0%) |
| $75,000 to $99,999 | 0 (0.0%) | 0 (0.0%) |
| $100,000 to $149,999 | 0 (0.0%) | 2 (50.0%) |
| $150,000 or more | 0 (0.0%) | 0 (0.0%) |
| Total | 23 (100.0%) | 4 (100.0%) |
Property Value to Household Income Ratio in Matoaka
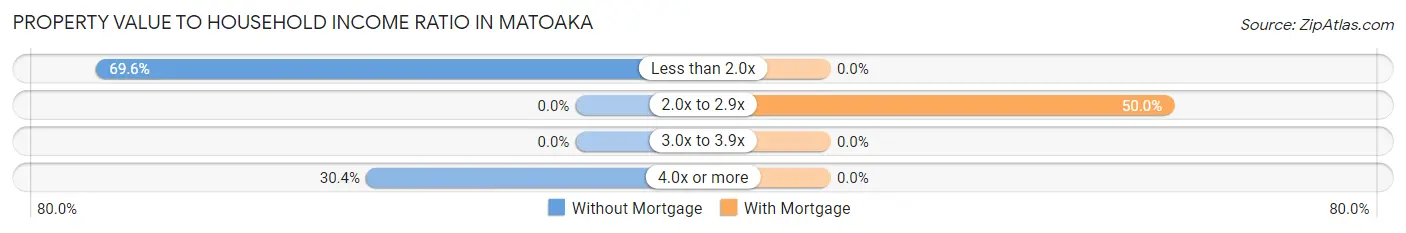
| Value-to-Income Ratio | Without Mortgage | With Mortgage |
| Less than 2.0x | 16 (69.6%) | 0 (0.0%) |
| 2.0x to 2.9x | 0 (0.0%) | 2 (50.0%) |
| 3.0x to 3.9x | 0 (0.0%) | 0 (0.0%) |
| 4.0x or more | 7 (30.4%) | 0 (0.0%) |
| Total | 23 (100.0%) | 4 (100.0%) |
Real Estate Taxes by Mortgage Status in Matoaka
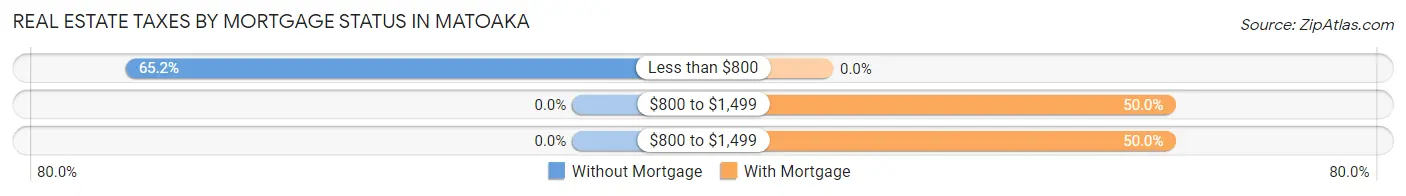
| Property Taxes | Without Mortgage | With Mortgage |
| Less than $800 | 15 (65.2%) | 0 (0.0%) |
| $800 to $1,499 | 0 (0.0%) | 2 (50.0%) |
| $800 to $1,499 | 0 (0.0%) | 2 (50.0%) |
| Total | 23 (100.0%) | 4 (100.0%) |
Health & Disability in Matoaka
Health Insurance Coverage by Age in Matoaka
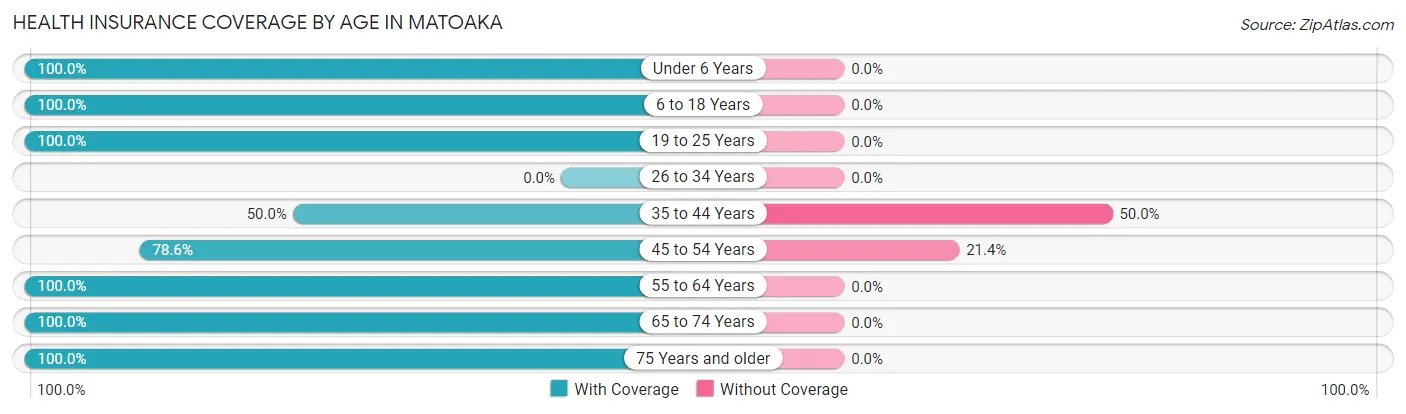
| Age Bracket | With Coverage | Without Coverage |
| Under 6 Years | 18 (100.0%) | 0 (0.0%) |
| 6 to 18 Years | 24 (100.0%) | 0 (0.0%) |
| 19 to 25 Years | 11 (100.0%) | 0 (0.0%) |
| 26 to 34 Years | 0 (0.0%) | 0 (0.0%) |
| 35 to 44 Years | 7 (50.0%) | 7 (50.0%) |
| 45 to 54 Years | 11 (78.6%) | 3 (21.4%) |
| 55 to 64 Years | 7 (100.0%) | 0 (0.0%) |
| 65 to 74 Years | 9 (100.0%) | 0 (0.0%) |
| 75 Years and older | 21 (100.0%) | 0 (0.0%) |
| Total | 108 (91.5%) | 10 (8.5%) |
Health Insurance Coverage by Citizenship Status in Matoaka
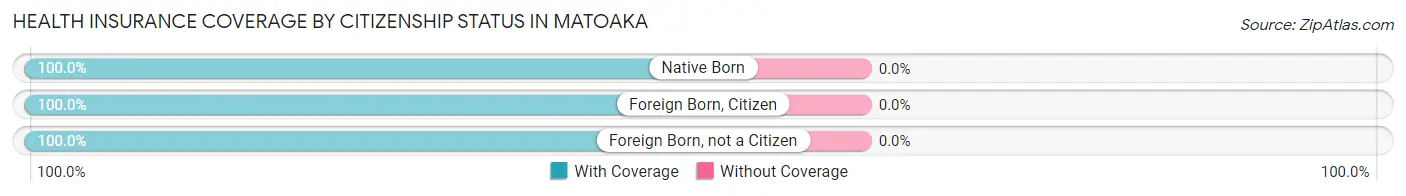
| Citizenship Status | With Coverage | Without Coverage |
| Native Born | 18 (100.0%) | 0 (0.0%) |
| Foreign Born, Citizen | 24 (100.0%) | 0 (0.0%) |
| Foreign Born, not a Citizen | 11 (100.0%) | 0 (0.0%) |
Health Insurance Coverage by Household Income in Matoaka
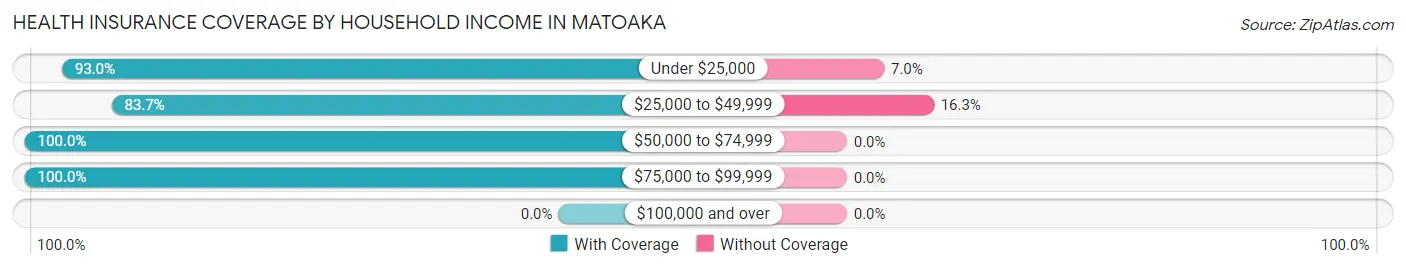
| Household Income | With Coverage | Without Coverage |
| Under $25,000 | 40 (93.0%) | 3 (7.0%) |
| $25,000 to $49,999 | 36 (83.7%) | 7 (16.3%) |
| $50,000 to $74,999 | 9 (100.0%) | 0 (0.0%) |
| $75,000 to $99,999 | 23 (100.0%) | 0 (0.0%) |
| $100,000 and over | 0 (0.0%) | 0 (0.0%) |
Public vs Private Health Insurance Coverage by Age in Matoaka
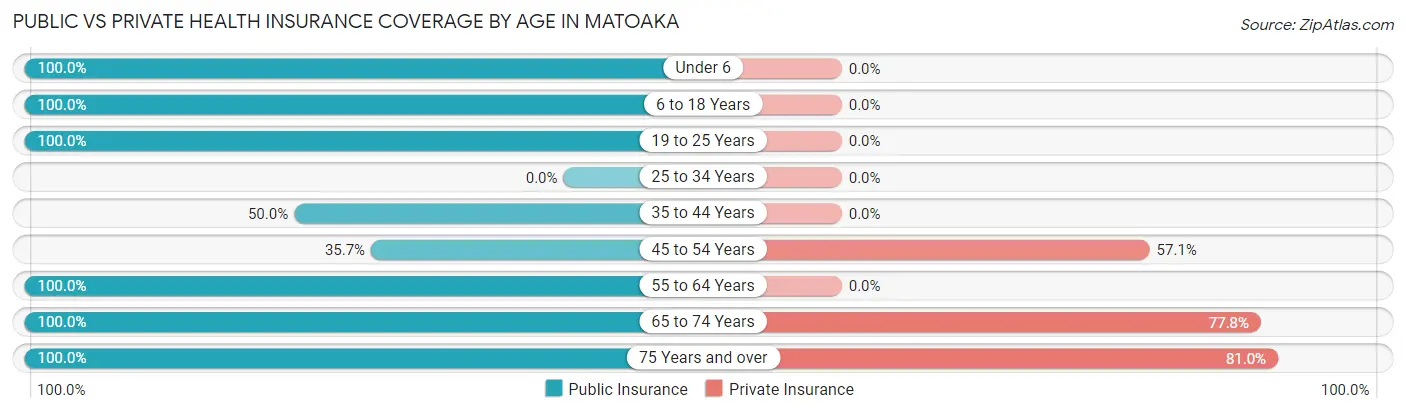
| Age Bracket | Public Insurance | Private Insurance |
| Under 6 | 18 (100.0%) | 0 (0.0%) |
| 6 to 18 Years | 24 (100.0%) | 0 (0.0%) |
| 19 to 25 Years | 11 (100.0%) | 0 (0.0%) |
| 25 to 34 Years | 0 (0.0%) | 0 (0.0%) |
| 35 to 44 Years | 7 (50.0%) | 0 (0.0%) |
| 45 to 54 Years | 5 (35.7%) | 8 (57.1%) |
| 55 to 64 Years | 7 (100.0%) | 0 (0.0%) |
| 65 to 74 Years | 9 (100.0%) | 7 (77.8%) |
| 75 Years and over | 21 (100.0%) | 17 (80.9%) |
| Total | 102 (86.4%) | 32 (27.1%) |
Disability Status by Sex by Age in Matoaka
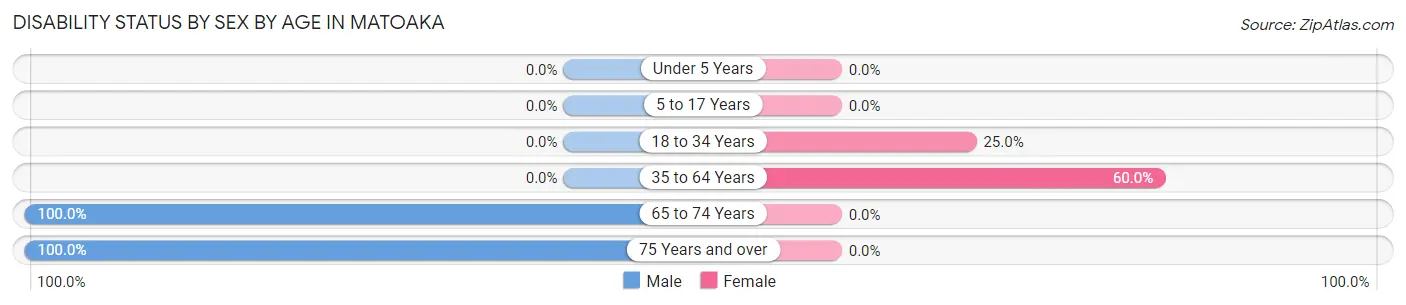
| Age Bracket | Male | Female |
| Under 5 Years | 0 (0.0%) | 0 (0.0%) |
| 5 to 17 Years | 0 (0.0%) | 0 (0.0%) |
| 18 to 34 Years | 0 (0.0%) | 3 (25.0%) |
| 35 to 64 Years | 0 (0.0%) | 12 (60.0%) |
| 65 to 74 Years | 2 (100.0%) | 0 (0.0%) |
| 75 Years and over | 15 (100.0%) | 0 (0.0%) |
Disability Class by Sex by Age in Matoaka
Disability Class: Hearing Difficulty
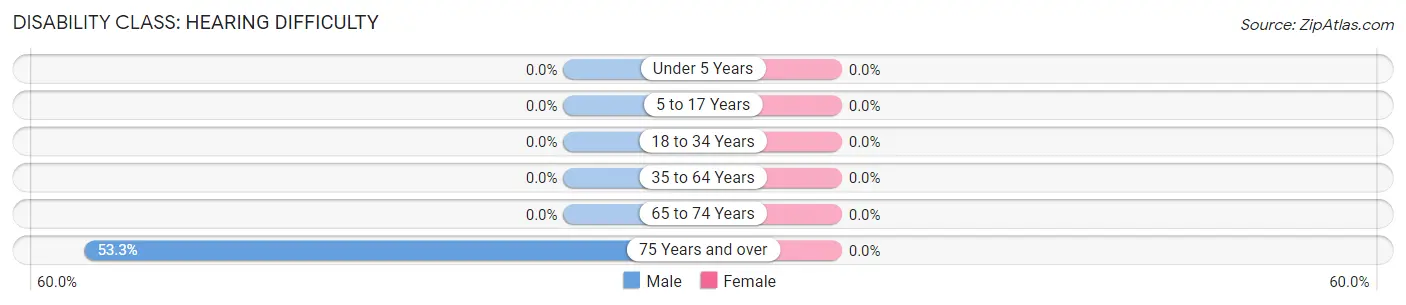
| Age Bracket | Male | Female |
| Under 5 Years | 0 (0.0%) | 0 (0.0%) |
| 5 to 17 Years | 0 (0.0%) | 0 (0.0%) |
| 18 to 34 Years | 0 (0.0%) | 0 (0.0%) |
| 35 to 64 Years | 0 (0.0%) | 0 (0.0%) |
| 65 to 74 Years | 0 (0.0%) | 0 (0.0%) |
| 75 Years and over | 8 (53.3%) | 0 (0.0%) |
Disability Class: Vision Difficulty
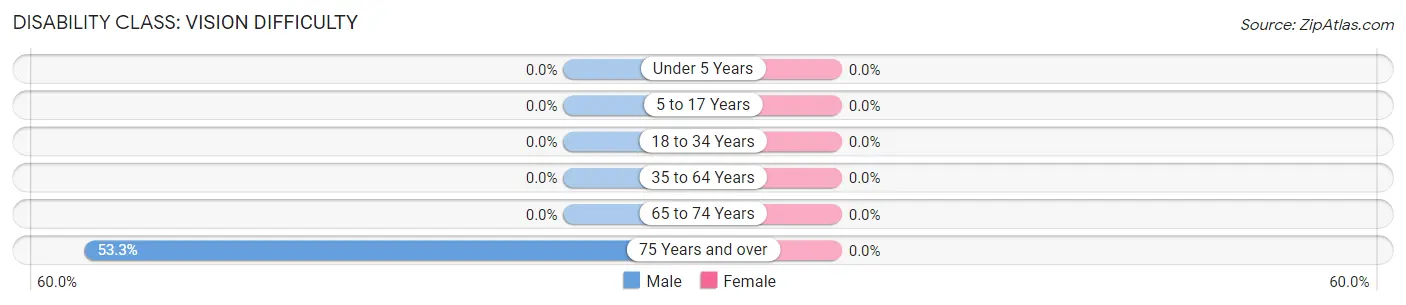
| Age Bracket | Male | Female |
| Under 5 Years | 0 (0.0%) | 0 (0.0%) |
| 5 to 17 Years | 0 (0.0%) | 0 (0.0%) |
| 18 to 34 Years | 0 (0.0%) | 0 (0.0%) |
| 35 to 64 Years | 0 (0.0%) | 0 (0.0%) |
| 65 to 74 Years | 0 (0.0%) | 0 (0.0%) |
| 75 Years and over | 8 (53.3%) | 0 (0.0%) |
Disability Class: Cognitive Difficulty
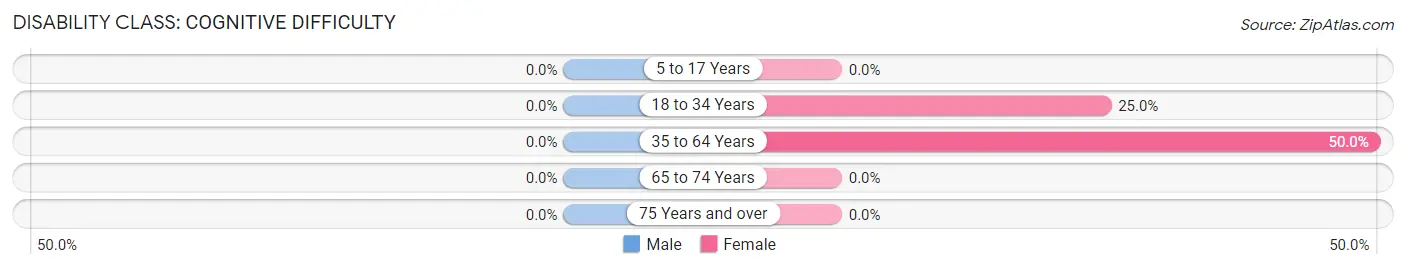
| Age Bracket | Male | Female |
| 5 to 17 Years | 0 (0.0%) | 0 (0.0%) |
| 18 to 34 Years | 0 (0.0%) | 3 (25.0%) |
| 35 to 64 Years | 0 (0.0%) | 10 (50.0%) |
| 65 to 74 Years | 0 (0.0%) | 0 (0.0%) |
| 75 Years and over | 0 (0.0%) | 0 (0.0%) |
Disability Class: Ambulatory Difficulty
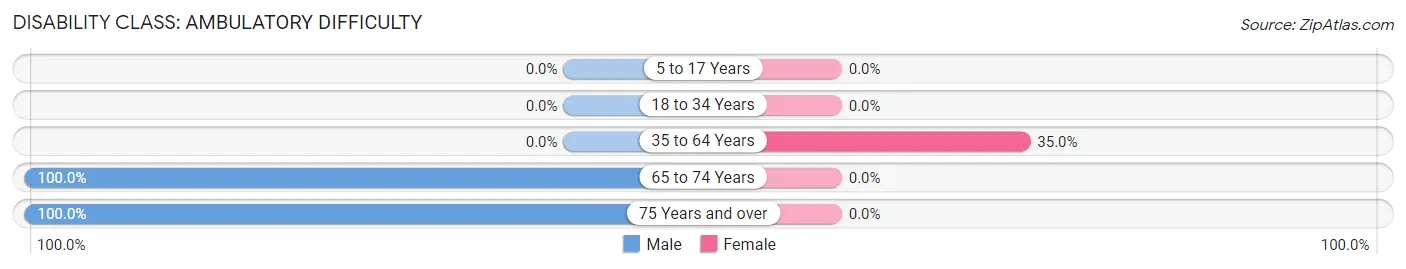
| Age Bracket | Male | Female |
| 5 to 17 Years | 0 (0.0%) | 0 (0.0%) |
| 18 to 34 Years | 0 (0.0%) | 0 (0.0%) |
| 35 to 64 Years | 0 (0.0%) | 7 (35.0%) |
| 65 to 74 Years | 2 (100.0%) | 0 (0.0%) |
| 75 Years and over | 15 (100.0%) | 0 (0.0%) |
Disability Class: Self-Care Difficulty
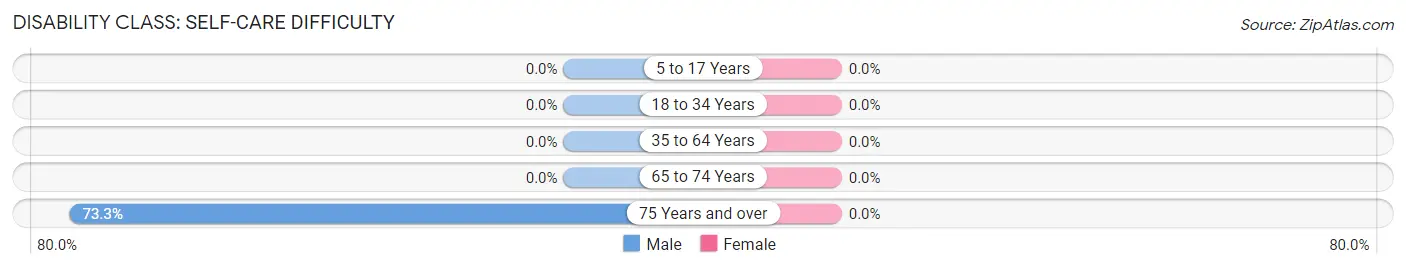
| Age Bracket | Male | Female |
| 5 to 17 Years | 0 (0.0%) | 0 (0.0%) |
| 18 to 34 Years | 0 (0.0%) | 0 (0.0%) |
| 35 to 64 Years | 0 (0.0%) | 0 (0.0%) |
| 65 to 74 Years | 0 (0.0%) | 0 (0.0%) |
| 75 Years and over | 11 (73.3%) | 0 (0.0%) |
Technology Access in Matoaka
Computing Device Access in Matoaka
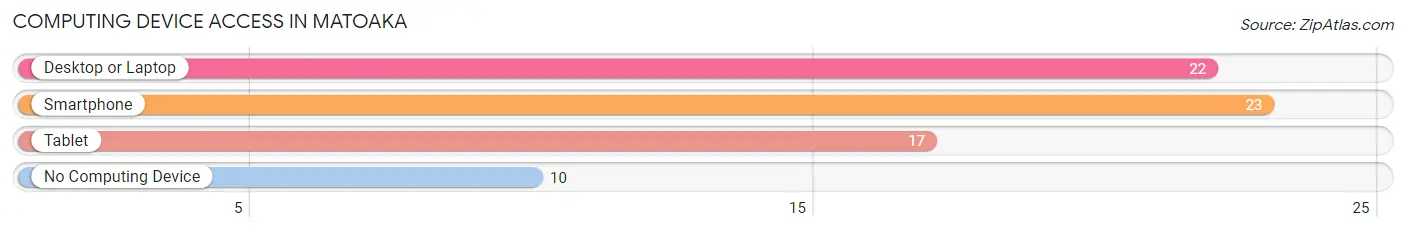
| Device Type | # Households | % Households |
| Desktop or Laptop | 22 | 56.4% |
| Smartphone | 23 | 59.0% |
| Tablet | 17 | 43.6% |
| No Computing Device | 10 | 25.6% |
| Total | 39 | 100.0% |
Internet Access in Matoaka
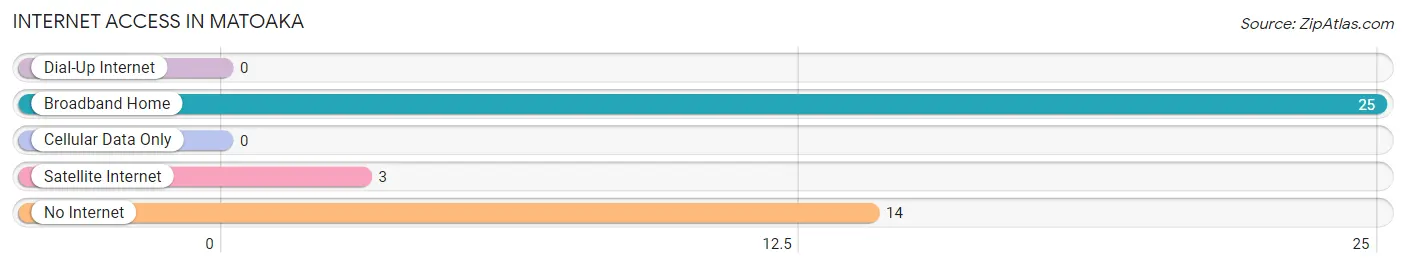
| Internet Type | # Households | % Households |
| Dial-Up Internet | 0 | 0.0% |
| Broadband Home | 25 | 64.1% |
| Cellular Data Only | 0 | 0.0% |
| Satellite Internet | 3 | 7.7% |
| No Internet | 14 | 35.9% |
| Total | 39 | 100.0% |
Matoaka Summary
Matoaka is a small town located in Mercer County, West Virginia. It is situated in the Appalachian Mountains and is part of the Bluefield, WV-VA Metropolitan Statistical Area. The town has a population of approximately 1,000 people and is known for its rural charm and friendly atmosphere.
Geography
Matoaka is located in the Appalachian Mountains of West Virginia. The town is situated in the Bluestone River Valley, which is part of the larger New River Valley. The town is located at an elevation of 1,890 feet above sea level. The town is surrounded by the Bluestone National Wildlife Refuge, which is home to a variety of wildlife, including deer, bear, and wild turkey. The town is also located near the Bluestone Lake, which is a popular destination for fishing and boating.
The climate in Matoaka is humid subtropical, with hot summers and mild winters. The average annual temperature is around 57 degrees Fahrenheit. The average annual precipitation is around 43 inches.
History
Matoaka was founded in 1891 by the Chesapeake and Ohio Railway. The town was named after the daughter of Chief Powhatan, the leader of the Powhatan Confederacy. The town was originally a coal mining town, and the coal industry was the main source of employment for the town’s residents.
In the early 20th century, the town experienced a period of growth and prosperity. The town was home to several businesses, including a hotel, a bank, a movie theater, and a variety of stores. The town also had a thriving music scene, with several local bands performing in the area.
In the late 20th century, the coal industry began to decline, and the town’s economy suffered. The town’s population began to decline, and many of the businesses closed. In recent years, the town has experienced a resurgence, with new businesses opening and the population increasing.
Economy
The economy of Matoaka is largely based on tourism and agriculture. The town is home to several tourist attractions, including the Bluestone National Wildlife Refuge, the Bluestone Lake, and the Bluestone River. The town is also home to several farms, which produce a variety of crops, including corn, soybeans, and hay.
The town is also home to several small businesses, including restaurants, retail stores, and service providers. The town is also home to several manufacturing companies, which produce a variety of products, including furniture, clothing, and automotive parts.
Demographics
As of the 2010 census, the population of Matoaka was 1,000. The racial makeup of the town was 97.2% White, 0.7% African American, 0.2% Native American, 0.2% Asian, 0.2% from other races, and 1.7% from two or more races. The median household income was $30,000, and the median family income was $35,000. The per capita income was $17,000.
Conclusion
Matoaka is a small town located in Mercer County, West Virginia. It is situated in the Appalachian Mountains and is part of the Bluefield, WV-VA Metropolitan Statistical Area. The town has a population of approximately 1,000 people and is known for its rural charm and friendly atmosphere. The economy of Matoaka is largely based on tourism and agriculture, and the town is home to several tourist attractions, farms, and small businesses. The racial makeup of the town is predominantly White, with a small percentage of African American, Native American, and Asian residents. The median household income is $30,000, and the median family income is $35,000.
Common Questions
What is the Total Population of Matoaka?
Total Population of Matoaka is 118.
What is the Total Male Population of Matoaka?
Total Male Population of Matoaka is 67.
What is the Total Female Population of Matoaka?
Total Female Population of Matoaka is 51.
What is the Ratio of Males per 100 Females in Matoaka?
There are 131.37 Males per 100 Females in Matoaka.
What is the Ratio of Females per 100 Males in Matoaka?
There are 76.12 Females per 100 Males in Matoaka.
What is the Median Population Age in Matoaka?
Median Population Age in Matoaka is 35.9 Years.
What is the Average Family Size in Matoaka
Average Family Size in Matoaka is 3.4 People.
What is the Average Household Size in Matoaka
Average Household Size in Matoaka is 3.0 People.
What is Per Capita Income in Matoaka?
Per Capita income in Matoaka is $13,794.
What is the Median Family Income in Matoaka?
Median Family Income in Matoaka is $41,250.
What is the Median Household income in Matoaka?
Median Household Income in Matoaka is $40,625.
What is Income or Wage Gap in Matoaka?
Income or Wage Gap in Matoaka is 58.6%.
Women in Matoaka earn 41.4 cents for every dollar earned by a man.
What is Inequality or Gini Index in Matoaka?
Inequality or Gini Index in Matoaka is 0.28.
How Large is the Labor Force in Matoaka?
There are 25 People in the Labor Forcein in Matoaka.
What is the Percentage of People in the Labor Force in Matoaka?
30.9% of People are in the Labor Force in Matoaka.
What is the Unemployment Rate in Matoaka?
Unemployment Rate in Matoaka is 12.0%.