Jane Lew, WV
Jane Lew Map
Jane Lew Overview
616
TOTAL POPULATION
354
MALE POPULATION
262
FEMALE POPULATION
135.11
MALES / 100 FEMALES
74.01
FEMALES / 100 MALES
50.8
MEDIAN AGE
3.0
AVG FAMILY SIZE
2.5
AVG HOUSEHOLD SIZE
$27,852
PER CAPITA INCOME
$52,021
AVG FAMILY INCOME
$50,583
AVG HOUSEHOLD INCOME
0.44
INEQUALITY / GINI INDEX
246
LABOR FORCE [ PEOPLE ]
47.8%
PERCENT IN LABOR FORCE
1.2%
UNEMPLOYMENT RATE
Jane Lew Zip Codes
Jane Lew Area Codes
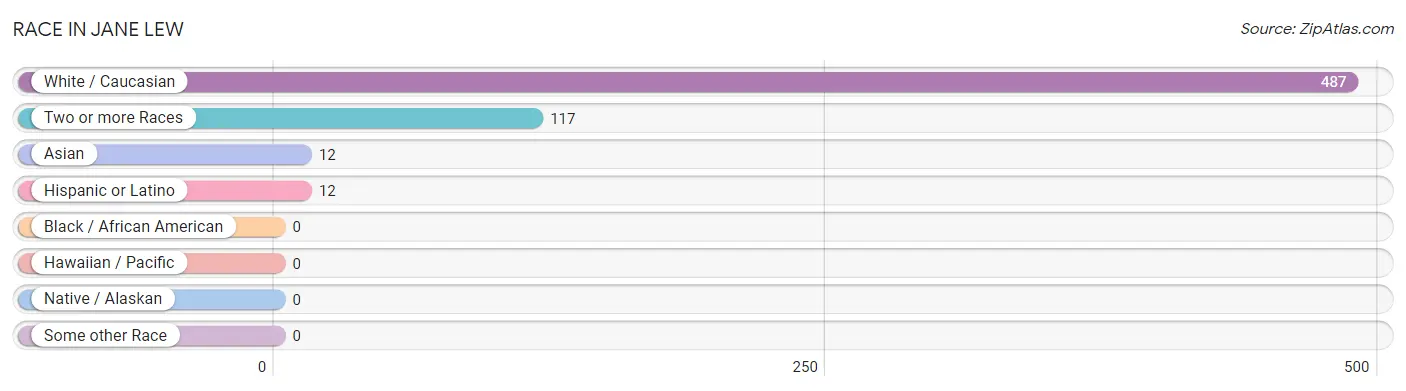
Race in Jane Lew
The most populous races in Jane Lew are White / Caucasian (487 | 79.1%), Two or more Races (117 | 19.0%), and Asian (12 | 1.9%).
| Race | # Population | % Population |
| Asian | 12 | 1.9% |
| Black / African American | 0 | 0.0% |
| Hawaiian / Pacific | 0 | 0.0% |
| Hispanic or Latino | 12 | 1.9% |
| Native / Alaskan | 0 | 0.0% |
| White / Caucasian | 487 | 79.1% |
| Two or more Races | 117 | 19.0% |
| Some other Race | 0 | 0.0% |
| Total | 616 | 100.0% |
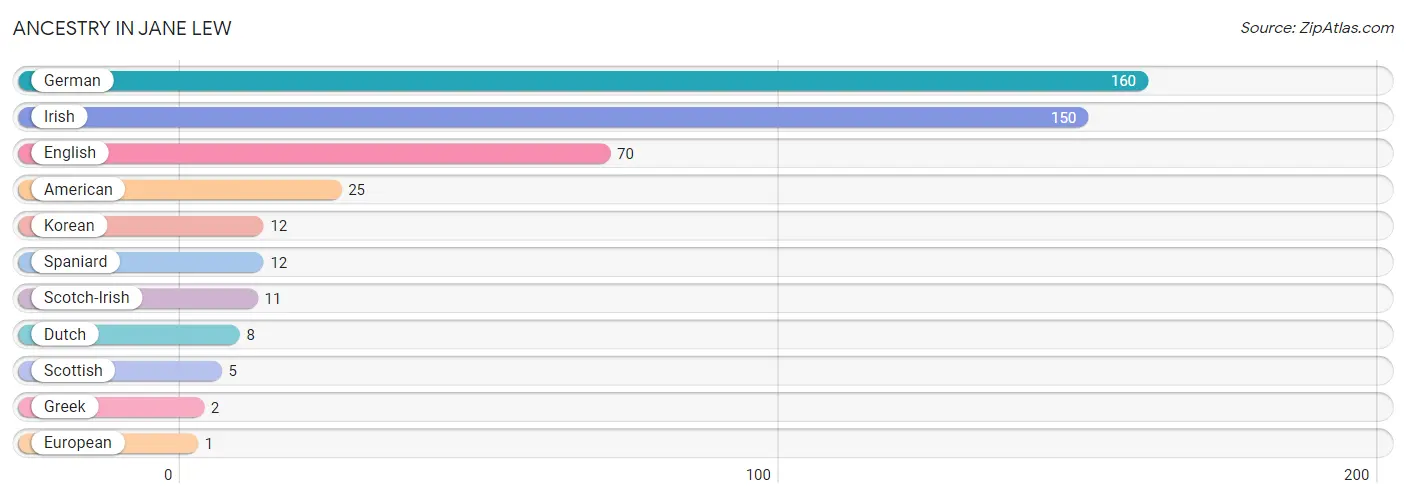
Ancestry in Jane Lew
The most populous ancestries reported in Jane Lew are German (160 | 26.0%), Irish (150 | 24.3%), English (70 | 11.4%), American (25 | 4.1%), and Korean (12 | 1.9%), together accounting for 67.7% of all Jane Lew residents.
| Ancestry | # Population | % Population |
| American | 25 | 4.1% |
| Dutch | 8 | 1.3% |
| English | 70 | 11.4% |
| European | 1 | 0.2% |
| German | 160 | 26.0% |
| Greek | 2 | 0.3% |
| Irish | 150 | 24.3% |
| Korean | 12 | 1.9% |
| Scotch-Irish | 11 | 1.8% |
| Scottish | 5 | 0.8% |
| Spaniard | 12 | 1.9% | View All 11 Rows |
Immigrants in Jane Lew

| Immigration Origin | # Population | % Population | View All 0 Rows |
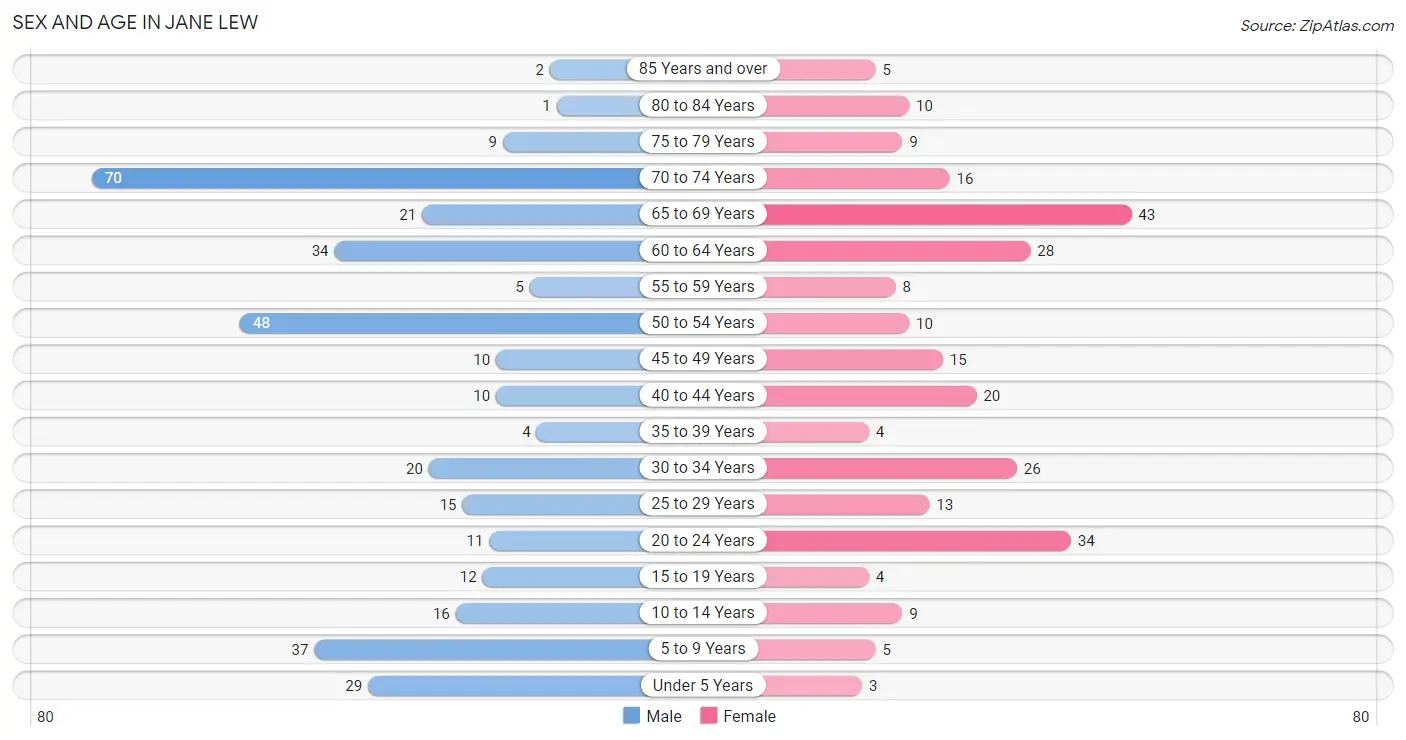
Sex and Age in Jane Lew
Sex and Age in Jane Lew
The most populous age groups in Jane Lew are 70 to 74 Years (70 | 19.8%) for men and 65 to 69 Years (43 | 16.4%) for women.
| Age Bracket | Male | Female |
| Under 5 Years | 29 (8.2%) | 3 (1.1%) |
| 5 to 9 Years | 37 (10.4%) | 5 (1.9%) |
| 10 to 14 Years | 16 (4.5%) | 9 (3.4%) |
| 15 to 19 Years | 12 (3.4%) | 4 (1.5%) |
| 20 to 24 Years | 11 (3.1%) | 34 (13.0%) |
| 25 to 29 Years | 15 (4.2%) | 13 (5.0%) |
| 30 to 34 Years | 20 (5.7%) | 26 (9.9%) |
| 35 to 39 Years | 4 (1.1%) | 4 (1.5%) |
| 40 to 44 Years | 10 (2.8%) | 20 (7.6%) |
| 45 to 49 Years | 10 (2.8%) | 15 (5.7%) |
| 50 to 54 Years | 48 (13.6%) | 10 (3.8%) |
| 55 to 59 Years | 5 (1.4%) | 8 (3.0%) |
| 60 to 64 Years | 34 (9.6%) | 28 (10.7%) |
| 65 to 69 Years | 21 (5.9%) | 43 (16.4%) |
| 70 to 74 Years | 70 (19.8%) | 16 (6.1%) |
| 75 to 79 Years | 9 (2.5%) | 9 (3.4%) |
| 80 to 84 Years | 1 (0.3%) | 10 (3.8%) |
| 85 Years and over | 2 (0.6%) | 5 (1.9%) |
| Total | 354 (100.0%) | 262 (100.0%) |
Families and Households in Jane Lew
Median Family Size in Jane Lew
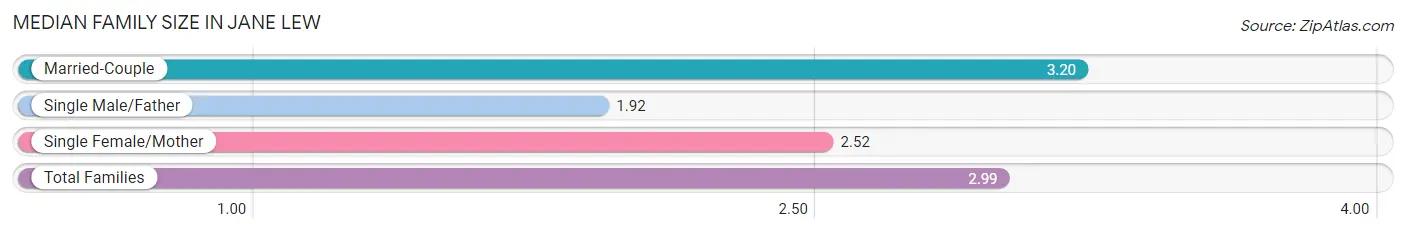
The median family size in Jane Lew is 2.99 persons per family, with married-couple families (130 | 76.5%) accounting for the largest median family size of 3.2 persons per family. On the other hand, single male/father families (13 | 7.6%) represent the smallest median family size with 1.92 persons per family.
| Family Type | # Families | Family Size |
| Married-Couple | 130 (76.5%) | 3.20 |
| Single Male/Father | 13 (7.6%) | 1.92 |
| Single Female/Mother | 27 (15.9%) | 2.52 |
| Total Families | 170 (100.0%) | 2.99 |
Median Household Size in Jane Lew
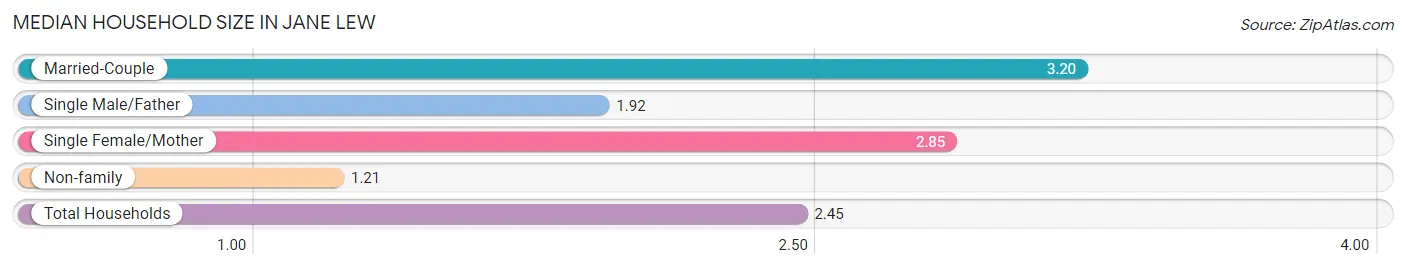
The median household size in Jane Lew is 2.45 persons per household, with married-couple households (130 | 51.8%) accounting for the largest median household size of 3.2 persons per household. non-family households (81 | 32.3%) represent the smallest median household size with 1.21 persons per household.
| Household Type | # Households | Household Size |
| Married-Couple | 130 (51.8%) | 3.20 |
| Single Male/Father | 13 (5.2%) | 1.92 |
| Single Female/Mother | 27 (10.8%) | 2.85 |
| Non-family | 81 (32.3%) | 1.21 |
| Total Households | 251 (100.0%) | 2.45 |
Household Size by Marriage Status in Jane Lew
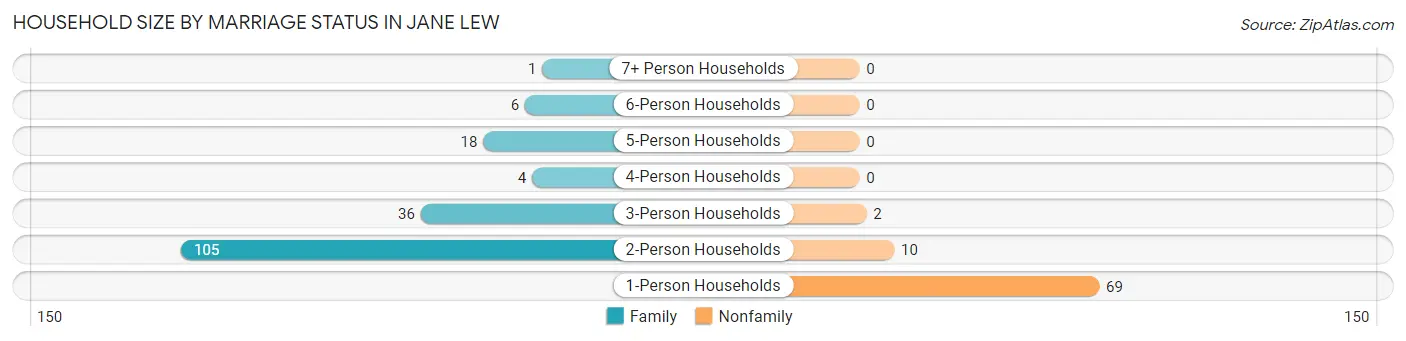
Out of a total of 251 households in Jane Lew, 170 (67.7%) are family households, while 81 (32.3%) are nonfamily households. The most numerous type of family households are 2-person households, comprising 105, and the most common type of nonfamily households are 1-person households, comprising 69.
| Household Size | Family Households | Nonfamily Households |
| 1-Person Households | - | 69 (27.5%) |
| 2-Person Households | 105 (41.8%) | 10 (4.0%) |
| 3-Person Households | 36 (14.3%) | 2 (0.8%) |
| 4-Person Households | 4 (1.6%) | 0 (0.0%) |
| 5-Person Households | 18 (7.2%) | 0 (0.0%) |
| 6-Person Households | 6 (2.4%) | 0 (0.0%) |
| 7+ Person Households | 1 (0.4%) | 0 (0.0%) |
| Total | 170 (67.7%) | 81 (32.3%) |
Female Fertility in Jane Lew
Fertility by Age in Jane Lew
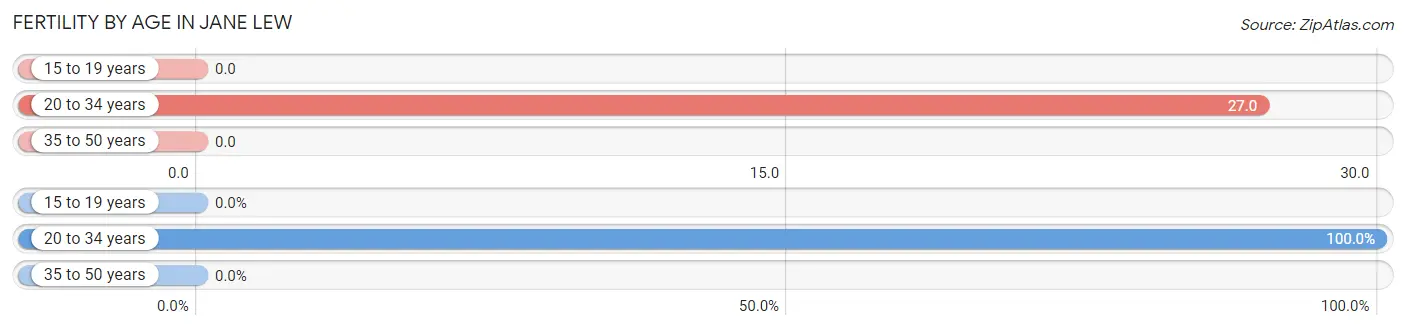
Average fertility rate in Jane Lew is 17.0 births per 1,000 women. Women in the age bracket of 20 to 34 years have the highest fertility rate with 27.0 births per 1,000 women. Women in the age bracket of 20 to 34 years acount for 100.0% of all women with births.
| Age Bracket | Women with Births | Births / 1,000 Women |
| 15 to 19 years | 0 (0.0%) | 0.0 |
| 20 to 34 years | 2 (100.0%) | 27.0 |
| 35 to 50 years | 0 (0.0%) | 0.0 |
| Total | 2 (100.0%) | 17.0 |
Fertility by Age by Marriage Status in Jane Lew
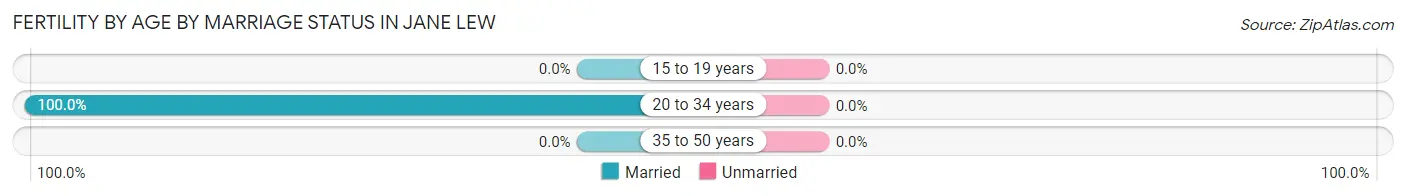
| Age Bracket | Married | Unmarried |
| 15 to 19 years | 0 (0.0%) | 0 (0.0%) |
| 20 to 34 years | 2 (100.0%) | 0 (0.0%) |
| 35 to 50 years | 0 (0.0%) | 0 (0.0%) |
| Total | 2 (100.0%) | 0 (0.0%) |
Fertility by Education in Jane Lew
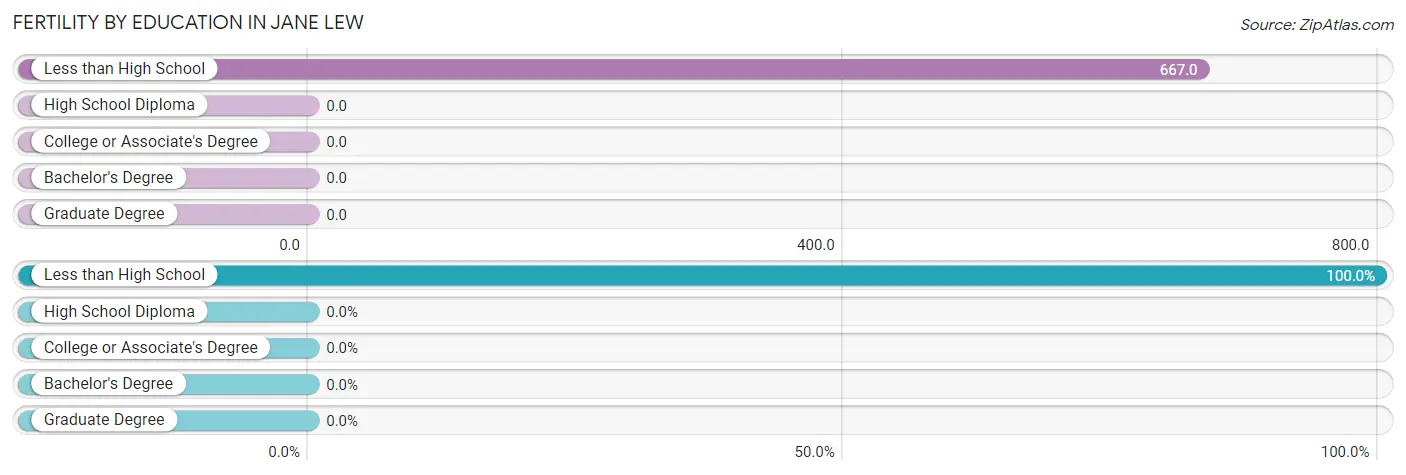
| Educational Attainment | Women with Births | Births / 1,000 Women |
| Less than High School | 2 (100.0%) | 667.0 |
| High School Diploma | 0 (0.0%) | 0.0 |
| College or Associate's Degree | 0 (0.0%) | 0.0 |
| Bachelor's Degree | 0 (0.0%) | 0.0 |
| Graduate Degree | 0 (0.0%) | 0.0 |
| Total | 2 (100.0%) | 17.0 |
Fertility by Education by Marriage Status in Jane Lew
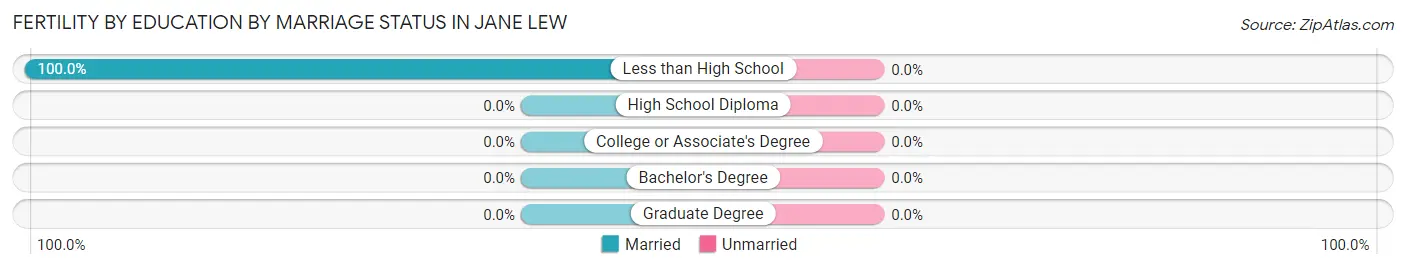
| Educational Attainment | Married | Unmarried |
| Less than High School | 2 (100.0%) | 0 (0.0%) |
| High School Diploma | 0 (0.0%) | 0 (0.0%) |
| College or Associate's Degree | 0 (0.0%) | 0 (0.0%) |
| Bachelor's Degree | 0 (0.0%) | 0 (0.0%) |
| Graduate Degree | 0 (0.0%) | 0 (0.0%) |
| Total | 2 (100.0%) | 0 (0.0%) |
Income in Jane Lew
Income Overview in Jane Lew
Per Capita Income in Jane Lew is $27,852, while median incomes of families and households are $52,021 and $50,583 respectively.
| Characteristic | Number | Measure |
| Per Capita Income | 616 | $27,852 |
| Median Family Income | 170 | $52,021 |
| Mean Family Income | 170 | $80,276 |
| Median Household Income | 251 | $50,583 |
| Mean Household Income | 251 | $65,470 |
| Income Deficit | 170 | $0 |
| Wage / Income Gap (%) | 616 | 0.00% |
| Wage / Income Gap ($) | 616 | 100.00¢ per $1 |
| Gini / Inequality Index | 616 | 0.44 |
Earnings by Sex in Jane Lew
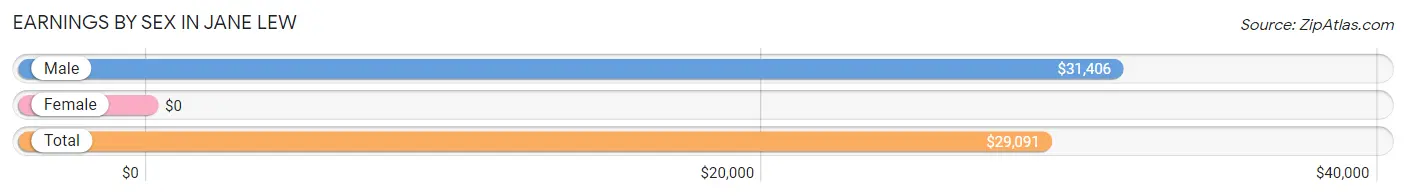
| Sex | Number | Average Earnings |
| Male | 141 (55.5%) | $31,406 |
| Female | 113 (44.5%) | $0 |
| Total | 254 (100.0%) | $29,091 |
Earnings by Sex by Income Bracket in Jane Lew
The most common earnings brackets in Jane Lew are $75,000 to $99,999 for men (22 | 15.6%) and $100,000+ for women (17 | 15.0%).
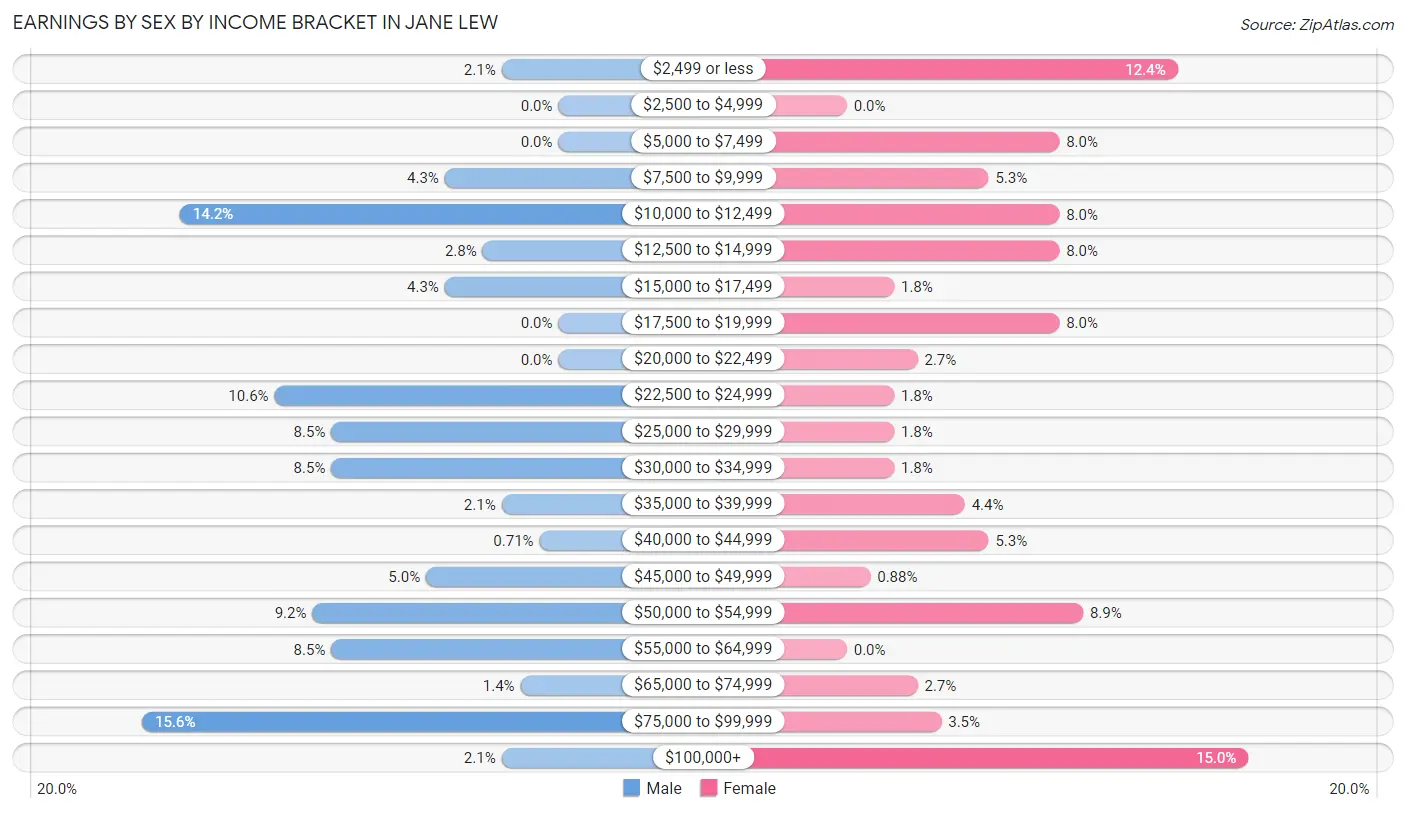
| Income | Male | Female |
| $2,499 or less | 3 (2.1%) | 14 (12.4%) |
| $2,500 to $4,999 | 0 (0.0%) | 0 (0.0%) |
| $5,000 to $7,499 | 0 (0.0%) | 9 (8.0%) |
| $7,500 to $9,999 | 6 (4.3%) | 6 (5.3%) |
| $10,000 to $12,499 | 20 (14.2%) | 9 (8.0%) |
| $12,500 to $14,999 | 4 (2.8%) | 9 (8.0%) |
| $15,000 to $17,499 | 6 (4.3%) | 2 (1.8%) |
| $17,500 to $19,999 | 0 (0.0%) | 9 (8.0%) |
| $20,000 to $22,499 | 0 (0.0%) | 3 (2.6%) |
| $22,500 to $24,999 | 15 (10.6%) | 2 (1.8%) |
| $25,000 to $29,999 | 12 (8.5%) | 2 (1.8%) |
| $30,000 to $34,999 | 12 (8.5%) | 2 (1.8%) |
| $35,000 to $39,999 | 3 (2.1%) | 5 (4.4%) |
| $40,000 to $44,999 | 1 (0.7%) | 6 (5.3%) |
| $45,000 to $49,999 | 7 (5.0%) | 1 (0.9%) |
| $50,000 to $54,999 | 13 (9.2%) | 10 (8.8%) |
| $55,000 to $64,999 | 12 (8.5%) | 0 (0.0%) |
| $65,000 to $74,999 | 2 (1.4%) | 3 (2.6%) |
| $75,000 to $99,999 | 22 (15.6%) | 4 (3.5%) |
| $100,000+ | 3 (2.1%) | 17 (15.0%) |
| Total | 141 (100.0%) | 113 (100.0%) |
Earnings by Sex by Educational Attainment in Jane Lew
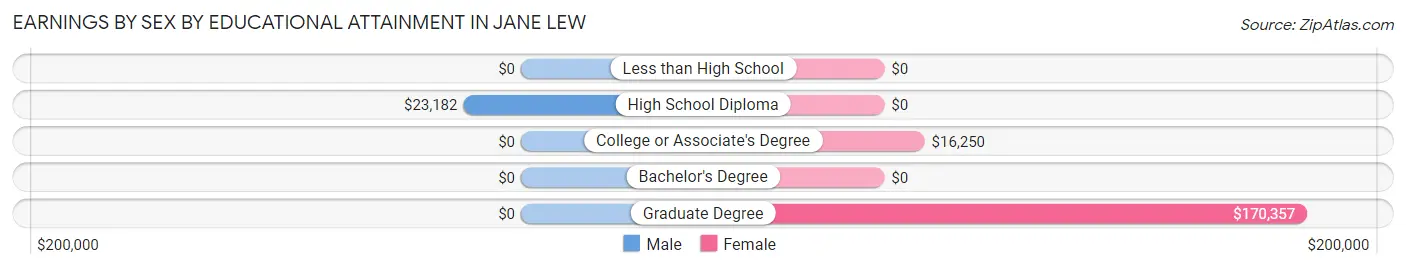
| Educational Attainment | Male Income | Female Income |
| Less than High School | - | - |
| High School Diploma | $23,182 | $0 |
| College or Associate's Degree | - | - |
| Bachelor's Degree | - | - |
| Graduate Degree | - | - |
| Total | $31,250 | $0 |
Family Income in Jane Lew
Family Income Brackets in Jane Lew
According to the Jane Lew family income data, there are 58 families falling into the $50,000 to $74,999 income range, which is the most common income bracket and makes up 34.1% of all families.
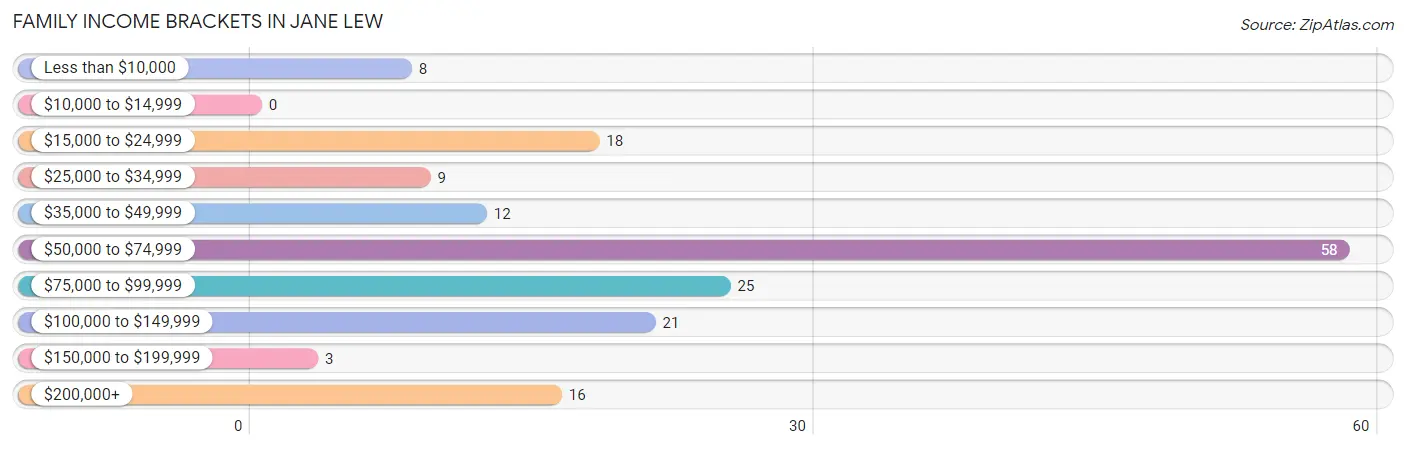
| Income Bracket | # Families | % Families |
| Less than $10,000 | 8 | 4.7% |
| $10,000 to $14,999 | 0 | 0.0% |
| $15,000 to $24,999 | 18 | 10.6% |
| $25,000 to $34,999 | 9 | 5.3% |
| $35,000 to $49,999 | 12 | 7.1% |
| $50,000 to $74,999 | 58 | 34.1% |
| $75,000 to $99,999 | 25 | 14.7% |
| $100,000 to $149,999 | 21 | 12.4% |
| $150,000 to $199,999 | 3 | 1.8% |
| $200,000+ | 16 | 9.4% |
Family Income by Famaliy Size in Jane Lew
2-person families (112 | 65.9%) account for the highest median family income in Jane Lew with $51,889 per family, while 2-person families (112 | 65.9%) have the highest median income of $25,944 per family member.
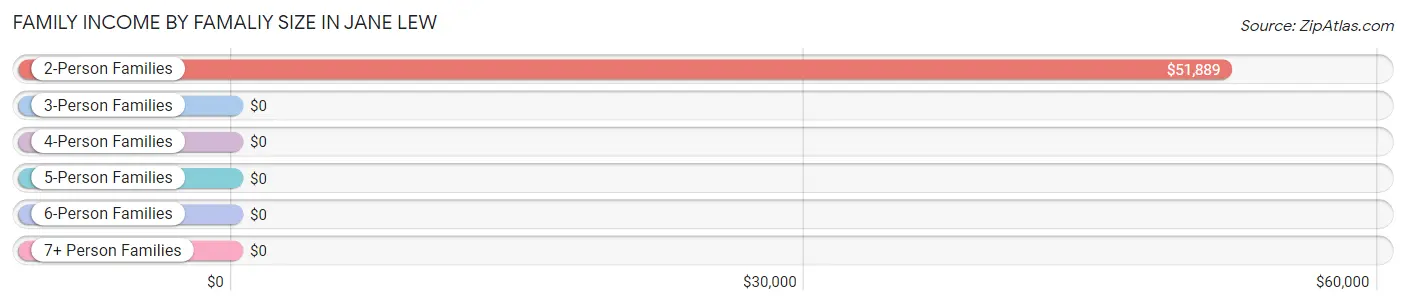
| Income Bracket | # Families | Median Income |
| 2-Person Families | 112 (65.9%) | $51,889 |
| 3-Person Families | 31 (18.2%) | $0 |
| 4-Person Families | 4 (2.4%) | $0 |
| 5-Person Families | 16 (9.4%) | $0 |
| 6-Person Families | 6 (3.5%) | $0 |
| 7+ Person Families | 1 (0.6%) | $0 |
| Total | 170 (100.0%) | $52,021 |
Family Income by Number of Earners in Jane Lew
The median family income in Jane Lew is $52,021, with families comprising 3+ earners (8) having the highest median family income of $134,500, while families with no earners (72) have the lowest median family income of $51,220, accounting for 4.7% and 42.3% of families, respectively.
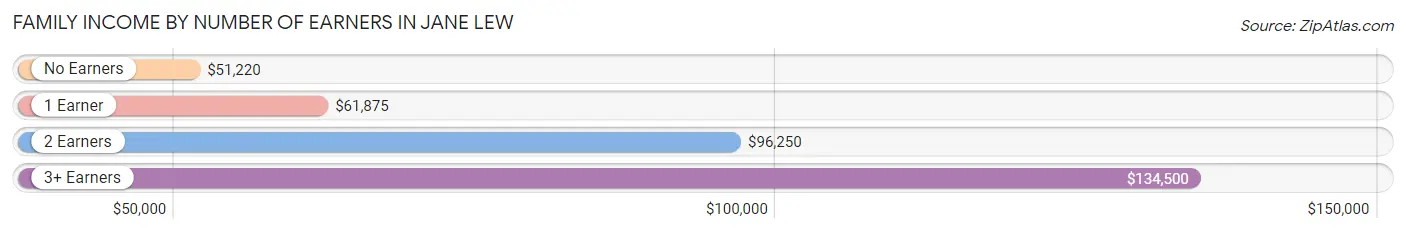
| Number of Earners | # Families | Median Income |
| No Earners | 72 (42.3%) | $51,220 |
| 1 Earner | 31 (18.2%) | $61,875 |
| 2 Earners | 59 (34.7%) | $96,250 |
| 3+ Earners | 8 (4.7%) | $134,500 |
| Total | 170 (100.0%) | $52,021 |
Household Income in Jane Lew
Household Income Brackets in Jane Lew
With 65 households falling in the category, the $50,000 to $74,999 income range is the most frequent in Jane Lew, accounting for 25.9% of all households. In contrast, only 3 households (1.2%) fall into the $150,000 to $199,999 income bracket, making it the least populous group.
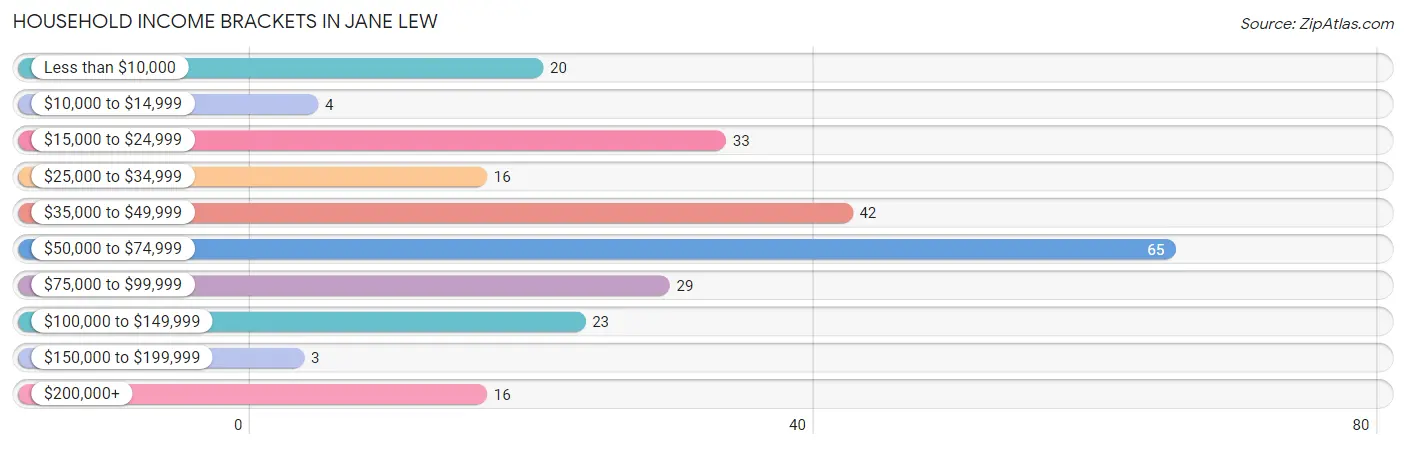
| Income Bracket | # Households | % Households |
| Less than $10,000 | 20 | 8.0% |
| $10,000 to $14,999 | 4 | 1.6% |
| $15,000 to $24,999 | 33 | 13.1% |
| $25,000 to $34,999 | 16 | 6.4% |
| $35,000 to $49,999 | 42 | 16.7% |
| $50,000 to $74,999 | 65 | 25.9% |
| $75,000 to $99,999 | 29 | 11.6% |
| $100,000 to $149,999 | 23 | 9.2% |
| $150,000 to $199,999 | 3 | 1.2% |
| $200,000+ | 16 | 6.4% |
Household Income by Householder Age in Jane Lew
The median household income in Jane Lew is $50,583, with the highest median household income of $51,139 found in the 65+ years age bracket for the primary householder. A total of 119 households (47.4%) fall into this category. Meanwhile, the 15 to 24 years age bracket for the primary householder has the lowest median household income of $0, with 2 households (0.8%) in this group.
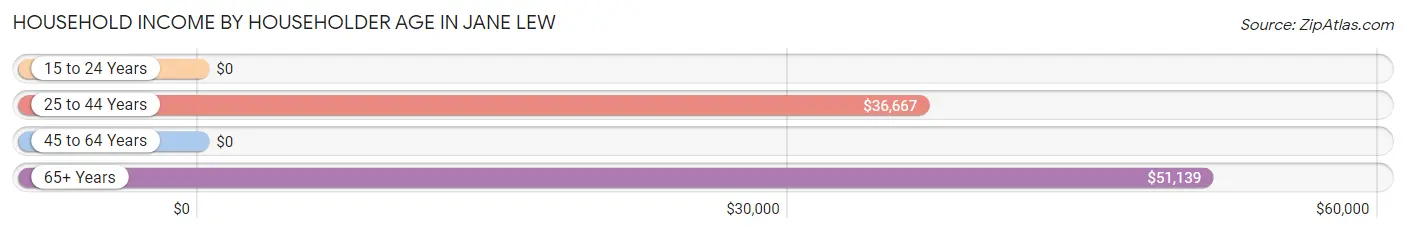
| Income Bracket | # Households | Median Income |
| 15 to 24 Years | 2 (0.8%) | $0 |
| 25 to 44 Years | 42 (16.7%) | $36,667 |
| 45 to 64 Years | 88 (35.1%) | $0 |
| 65+ Years | 119 (47.4%) | $51,139 |
| Total | 251 (100.0%) | $50,583 |
Poverty in Jane Lew
Income Below Poverty by Sex and Age in Jane Lew
With 25.4% poverty level for males and 17.5% for females among the residents of Jane Lew, 6 to 11 year old males and 6 to 11 year old females are the most vulnerable to poverty, with 37 males (84.1%) and 6 females (100.0%) in their respective age groups living below the poverty level.
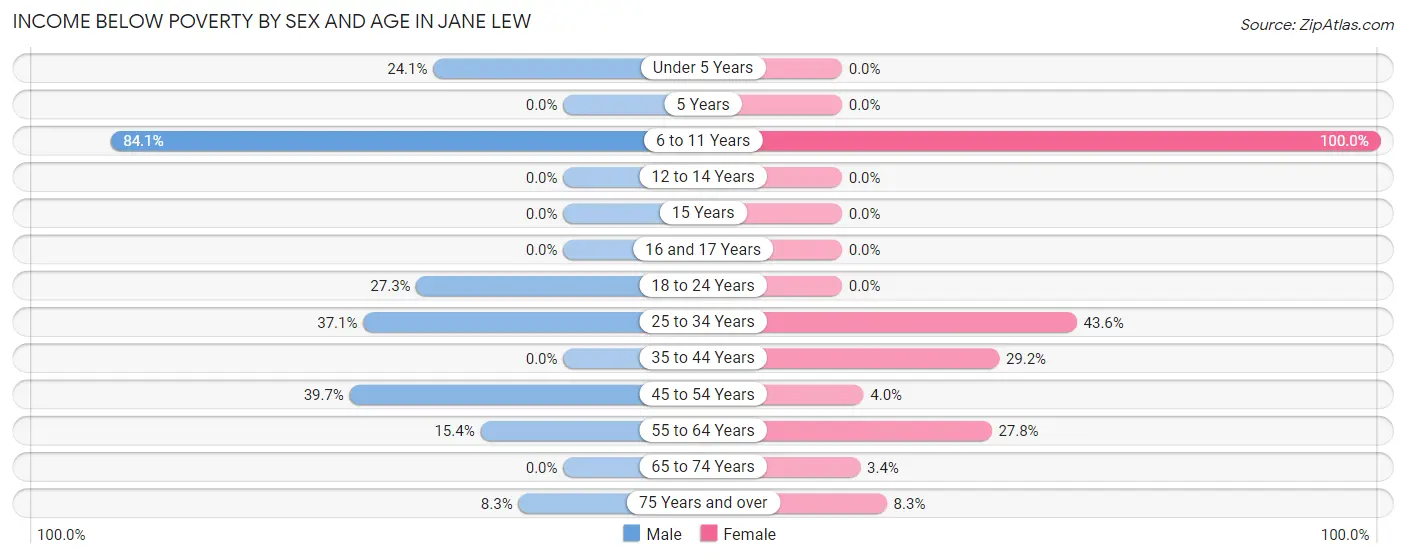
| Age Bracket | Male | Female |
| Under 5 Years | 7 (24.1%) | 0 (0.0%) |
| 5 Years | 0 (0.0%) | 0 (0.0%) |
| 6 to 11 Years | 37 (84.1%) | 6 (100.0%) |
| 12 to 14 Years | 0 (0.0%) | 0 (0.0%) |
| 15 Years | 0 (0.0%) | 0 (0.0%) |
| 16 and 17 Years | 0 (0.0%) | 0 (0.0%) |
| 18 to 24 Years | 3 (27.3%) | 0 (0.0%) |
| 25 to 34 Years | 13 (37.1%) | 17 (43.6%) |
| 35 to 44 Years | 0 (0.0%) | 7 (29.2%) |
| 45 to 54 Years | 23 (39.7%) | 1 (4.0%) |
| 55 to 64 Years | 6 (15.4%) | 10 (27.8%) |
| 65 to 74 Years | 0 (0.0%) | 2 (3.4%) |
| 75 Years and over | 1 (8.3%) | 2 (8.3%) |
| Total | 90 (25.4%) | 45 (17.5%) |
Income Above Poverty by Sex and Age in Jane Lew
According to the poverty statistics in Jane Lew, males aged 5 years and females aged under 5 years are the age groups that are most secure financially, with 100.0% of males and 100.0% of females in these age groups living above the poverty line.
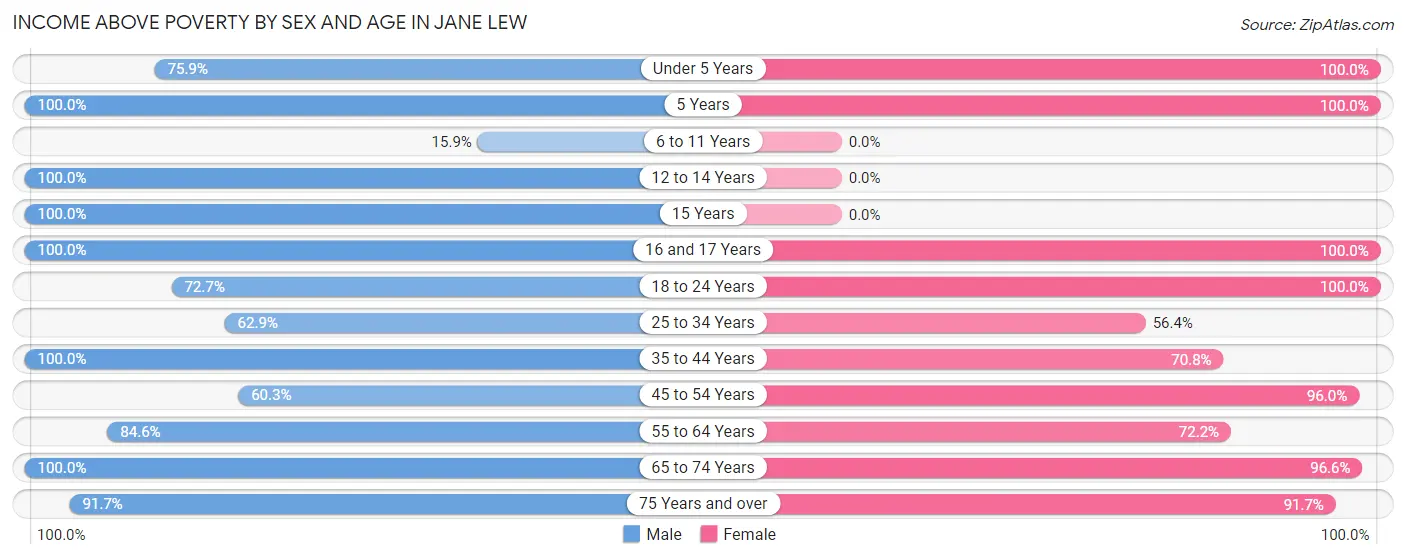
| Age Bracket | Male | Female |
| Under 5 Years | 22 (75.9%) | 3 (100.0%) |
| 5 Years | 5 (100.0%) | 3 (100.0%) |
| 6 to 11 Years | 7 (15.9%) | 0 (0.0%) |
| 12 to 14 Years | 4 (100.0%) | 0 (0.0%) |
| 15 Years | 2 (100.0%) | 0 (0.0%) |
| 16 and 17 Years | 10 (100.0%) | 1 (100.0%) |
| 18 to 24 Years | 8 (72.7%) | 37 (100.0%) |
| 25 to 34 Years | 22 (62.9%) | 22 (56.4%) |
| 35 to 44 Years | 14 (100.0%) | 17 (70.8%) |
| 45 to 54 Years | 35 (60.3%) | 24 (96.0%) |
| 55 to 64 Years | 33 (84.6%) | 26 (72.2%) |
| 65 to 74 Years | 91 (100.0%) | 57 (96.6%) |
| 75 Years and over | 11 (91.7%) | 22 (91.7%) |
| Total | 264 (74.6%) | 212 (82.5%) |
Income Below Poverty Among Married-Couple Families in Jane Lew
The poverty statistics for married-couple families in Jane Lew show that 13.1% or 17 of the total 130 families live below the poverty line. Families with 3 or 4 children have the highest poverty rate of 71.4%, comprising of 10 families. On the other hand, families with no children have the lowest poverty rate of 1.1%, which includes 1 families.
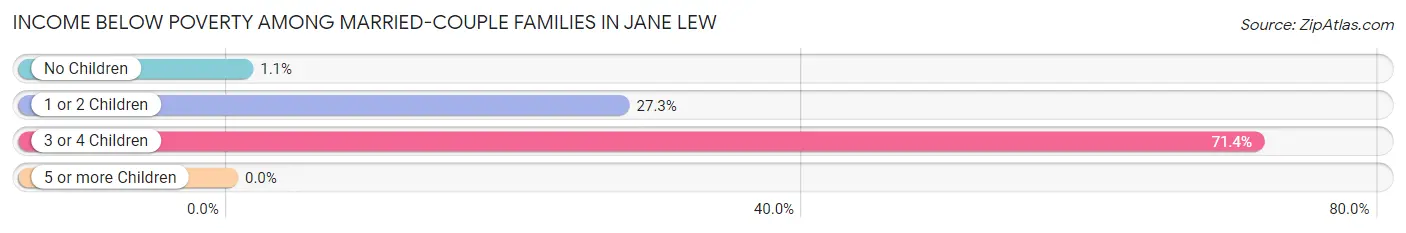
| Children | Above Poverty | Below Poverty |
| No Children | 93 (98.9%) | 1 (1.1%) |
| 1 or 2 Children | 16 (72.7%) | 6 (27.3%) |
| 3 or 4 Children | 4 (28.6%) | 10 (71.4%) |
| 5 or more Children | 0 (0.0%) | 0 (0.0%) |
| Total | 113 (86.9%) | 17 (13.1%) |
Income Below Poverty Among Single-Parent Households in Jane Lew
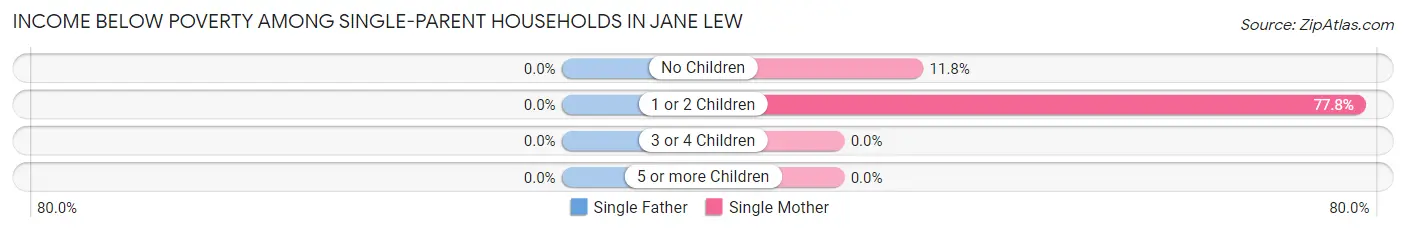
| Children | Single Father | Single Mother |
| No Children | 0 (0.0%) | 2 (11.8%) |
| 1 or 2 Children | 0 (0.0%) | 7 (77.8%) |
| 3 or 4 Children | 0 (0.0%) | 0 (0.0%) |
| 5 or more Children | 0 (0.0%) | 0 (0.0%) |
| Total | 0 (0.0%) | 9 (33.3%) |
Income Below Poverty Among Married-Couple vs Single-Parent Households in Jane Lew
The poverty data for Jane Lew shows that 17 of the married-couple family households (13.1%) and 9 of the single-parent households (22.5%) are living below the poverty level. Within the married-couple family households, those with 3 or 4 children have the highest poverty rate, with 10 households (71.4%) falling below the poverty line. Among the single-parent households, those with 1 or 2 children have the highest poverty rate, with 7 household (41.2%) living below poverty.
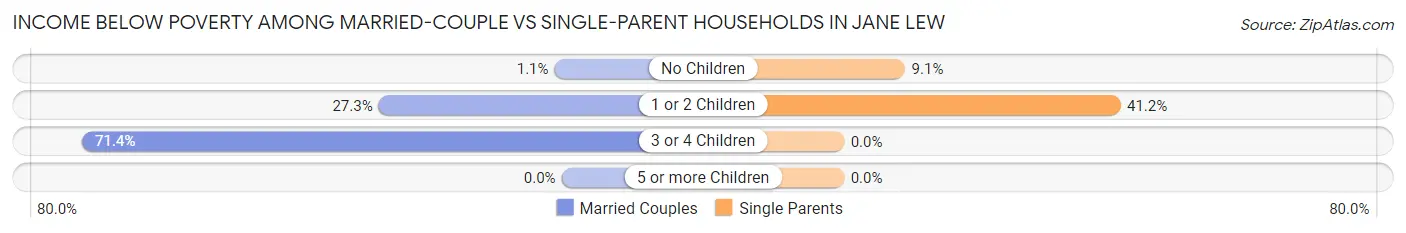
| Children | Married-Couple Families | Single-Parent Households |
| No Children | 1 (1.1%) | 2 (9.1%) |
| 1 or 2 Children | 6 (27.3%) | 7 (41.2%) |
| 3 or 4 Children | 10 (71.4%) | 0 (0.0%) |
| 5 or more Children | 0 (0.0%) | 0 (0.0%) |
| Total | 17 (13.1%) | 9 (22.5%) |
Employment Characteristics in Jane Lew
Employment by Class of Employer in Jane Lew
Among the 232 employed individuals in Jane Lew, private company employees (157 | 67.7%), federal government employees (28 | 12.1%), and self-employed (not incorporated) (14 | 6.0%) make up the most common classes of employment.
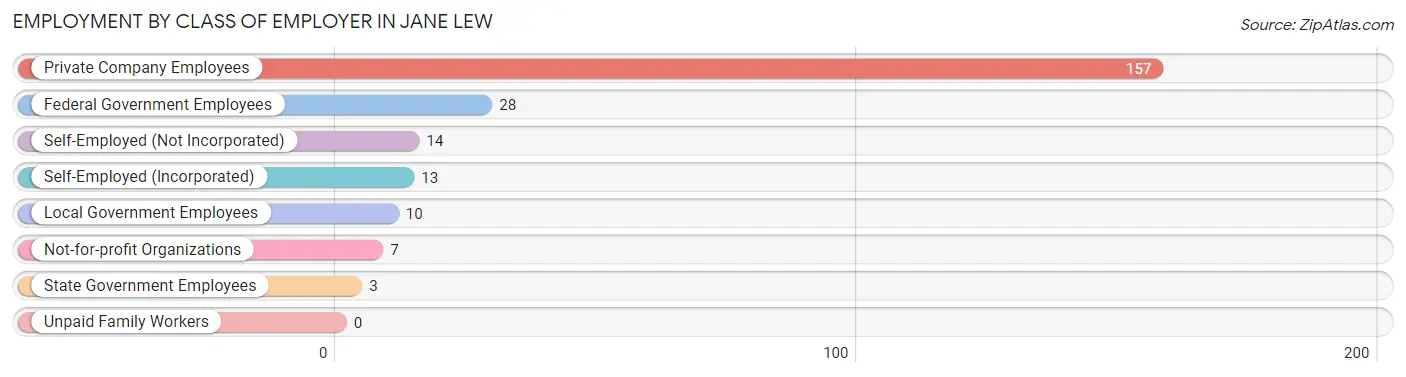
| Employer Class | # Employees | % Employees |
| Private Company Employees | 157 | 67.7% |
| Self-Employed (Incorporated) | 13 | 5.6% |
| Self-Employed (Not Incorporated) | 14 | 6.0% |
| Not-for-profit Organizations | 7 | 3.0% |
| Local Government Employees | 10 | 4.3% |
| State Government Employees | 3 | 1.3% |
| Federal Government Employees | 28 | 12.1% |
| Unpaid Family Workers | 0 | 0.0% |
| Total | 232 | 100.0% |
Employment Status by Age in Jane Lew
According to the labor force statistics for Jane Lew, out of the total population over 16 years of age (515), 47.8% or 246 individuals are in the labor force, with 1.2% or 3 of them unemployed. The age group with the highest labor force participation rate is 30 to 34 years, with 100.0% or 46 individuals in the labor force. Within the labor force, the 65 to 74 years age range has the highest percentage of unemployed individuals, with 8.6% or 3 of them being unemployed.
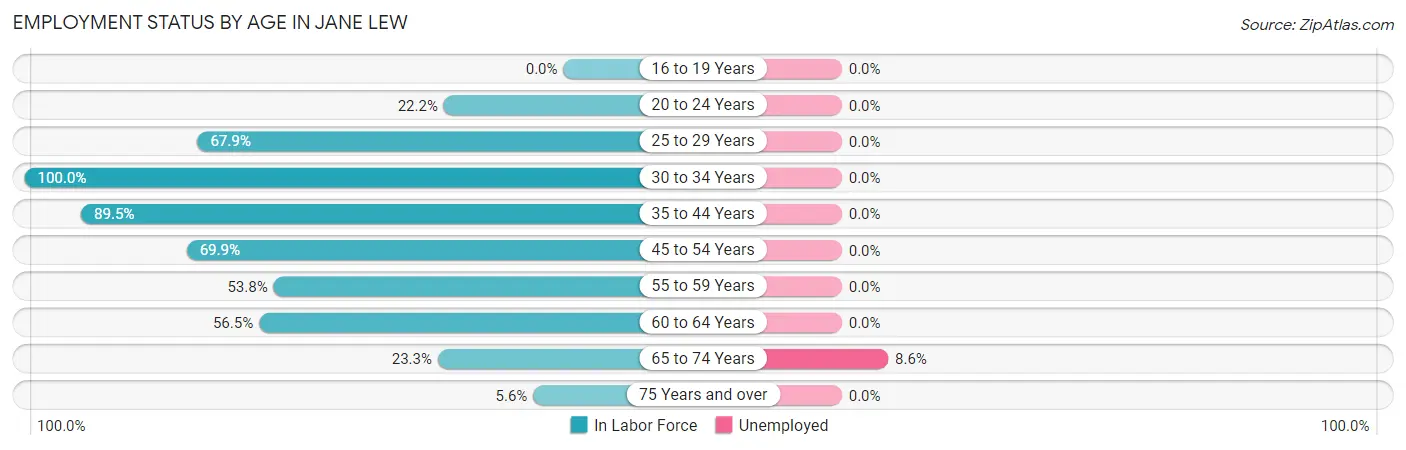
| Age Bracket | In Labor Force | Unemployed |
| 16 to 19 Years | 0 (0.0%) | 0 (0.0%) |
| 20 to 24 Years | 10 (22.2%) | 0 (0.0%) |
| 25 to 29 Years | 19 (67.9%) | 0 (0.0%) |
| 30 to 34 Years | 46 (100.0%) | 0 (0.0%) |
| 35 to 44 Years | 34 (89.5%) | 0 (0.0%) |
| 45 to 54 Years | 58 (69.9%) | 0 (0.0%) |
| 55 to 59 Years | 7 (53.8%) | 0 (0.0%) |
| 60 to 64 Years | 35 (56.5%) | 0 (0.0%) |
| 65 to 74 Years | 35 (23.3%) | 3 (8.6%) |
| 75 Years and over | 2 (5.6%) | 0 (0.0%) |
| Total | 246 (47.8%) | 3 (1.2%) |
Employment Status by Educational Attainment in Jane Lew
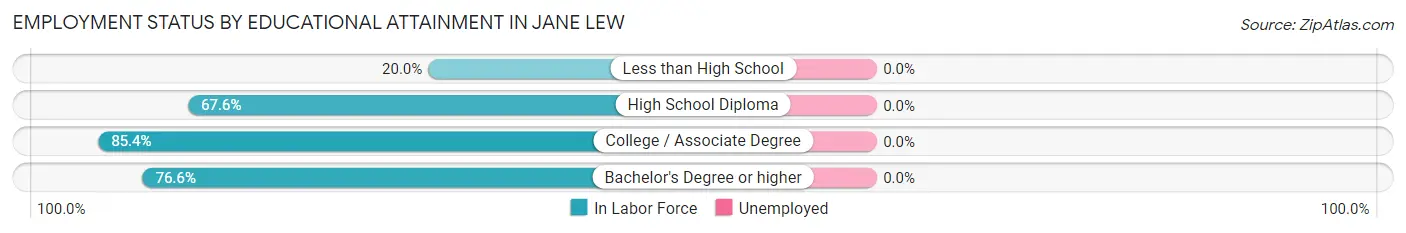
| Educational Attainment | In Labor Force | Unemployed |
| Less than High School | 1 (20.0%) | 0 (0.0%) |
| High School Diploma | 92 (67.6%) | 0 (0.0%) |
| College / Associate Degree | 70 (85.4%) | 0 (0.0%) |
| Bachelor's Degree or higher | 36 (76.6%) | 0 (0.0%) |
| Total | 199 (73.7%) | 0 (0.0%) |
Employment Occupations by Sex in Jane Lew
Management, Business, Science and Arts Occupations
The most common Management, Business, Science and Arts occupations in Jane Lew are Management (20 | 8.2%), Community & Social Service (18 | 7.4%), Health Diagnosing & Treating (18 | 7.4%), Health Technologists (16 | 6.6%), and Business & Financial (14 | 5.8%).
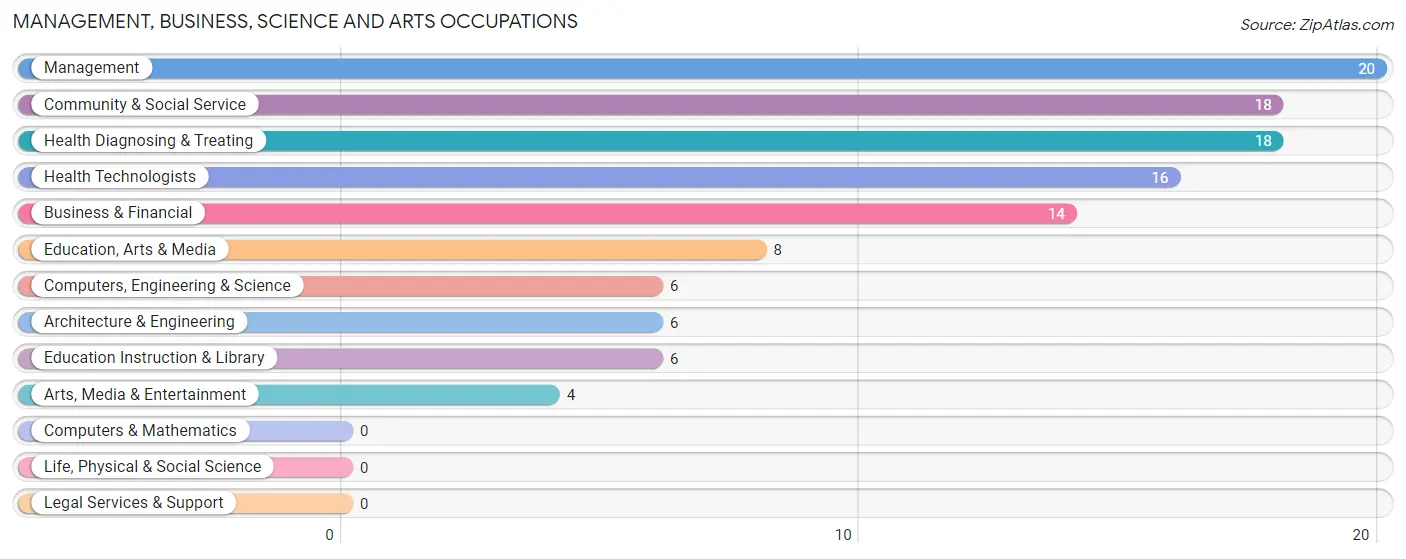
Management, Business, Science and Arts Occupations by Sex
Within the Management, Business, Science and Arts occupations in Jane Lew, the most male-oriented occupations are Computers, Engineering & Science (100.0%), Architecture & Engineering (100.0%), and Education Instruction & Library (66.7%), while the most female-oriented occupations are Education, Arts & Media (100.0%), Arts, Media & Entertainment (100.0%), and Health Diagnosing & Treating (94.4%).
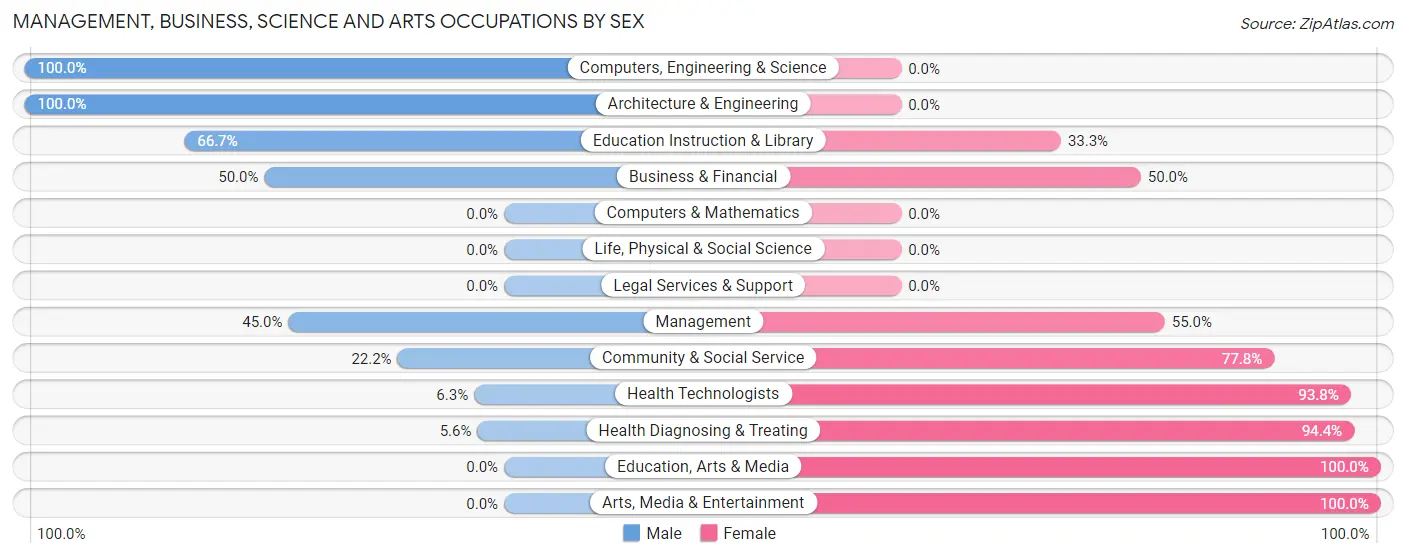
| Occupation | Male | Female |
| Management | 9 (45.0%) | 11 (55.0%) |
| Business & Financial | 7 (50.0%) | 7 (50.0%) |
| Computers, Engineering & Science | 6 (100.0%) | 0 (0.0%) |
| Computers & Mathematics | 0 (0.0%) | 0 (0.0%) |
| Architecture & Engineering | 6 (100.0%) | 0 (0.0%) |
| Life, Physical & Social Science | 0 (0.0%) | 0 (0.0%) |
| Community & Social Service | 4 (22.2%) | 14 (77.8%) |
| Education, Arts & Media | 0 (0.0%) | 8 (100.0%) |
| Legal Services & Support | 0 (0.0%) | 0 (0.0%) |
| Education Instruction & Library | 4 (66.7%) | 2 (33.3%) |
| Arts, Media & Entertainment | 0 (0.0%) | 4 (100.0%) |
| Health Diagnosing & Treating | 1 (5.6%) | 17 (94.4%) |
| Health Technologists | 1 (6.2%) | 15 (93.8%) |
| Total (Category) | 27 (35.5%) | 49 (64.5%) |
| Total (Overall) | 138 (56.8%) | 105 (43.2%) |
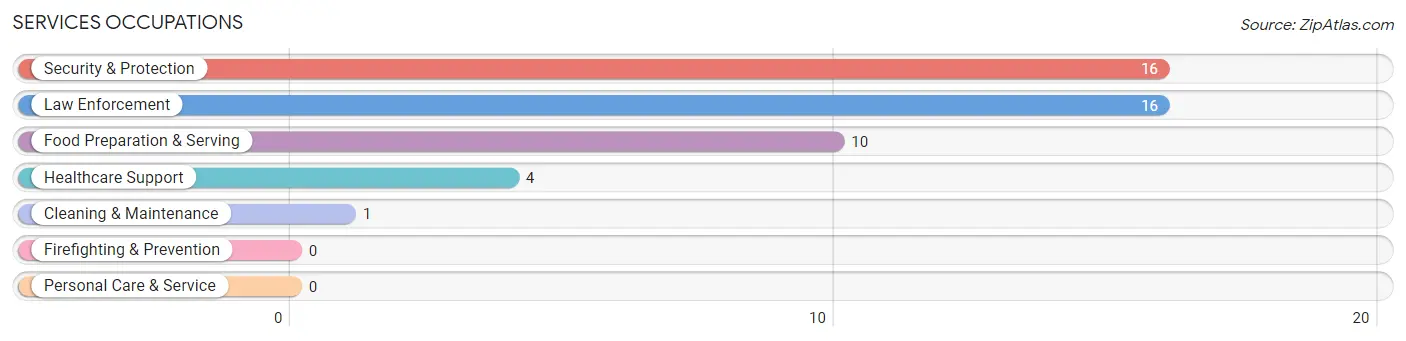
Services Occupations
The most common Services occupations in Jane Lew are Security & Protection (16 | 6.6%), Law Enforcement (16 | 6.6%), Food Preparation & Serving (10 | 4.1%), Healthcare Support (4 | 1.7%), and Cleaning & Maintenance (1 | 0.4%).
Services Occupations by Sex
Within the Services occupations in Jane Lew, the most male-oriented occupations are Security & Protection (100.0%), Law Enforcement (100.0%), and Cleaning & Maintenance (100.0%), while the most female-oriented occupations are Food Preparation & Serving (70.0%), and Healthcare Support (25.0%).
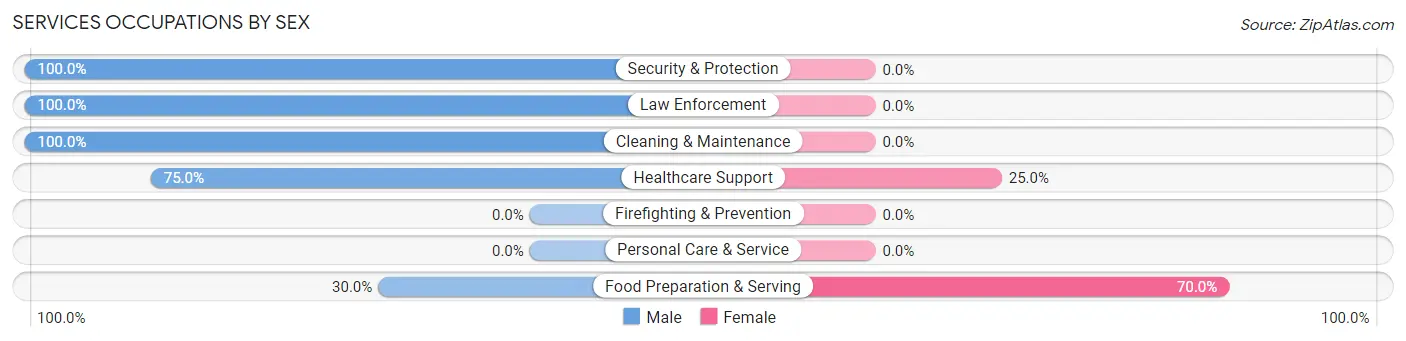
| Occupation | Male | Female |
| Healthcare Support | 3 (75.0%) | 1 (25.0%) |
| Security & Protection | 16 (100.0%) | 0 (0.0%) |
| Firefighting & Prevention | 0 (0.0%) | 0 (0.0%) |
| Law Enforcement | 16 (100.0%) | 0 (0.0%) |
| Food Preparation & Serving | 3 (30.0%) | 7 (70.0%) |
| Cleaning & Maintenance | 1 (100.0%) | 0 (0.0%) |
| Personal Care & Service | 0 (0.0%) | 0 (0.0%) |
| Total (Category) | 23 (74.2%) | 8 (25.8%) |
| Total (Overall) | 138 (56.8%) | 105 (43.2%) |
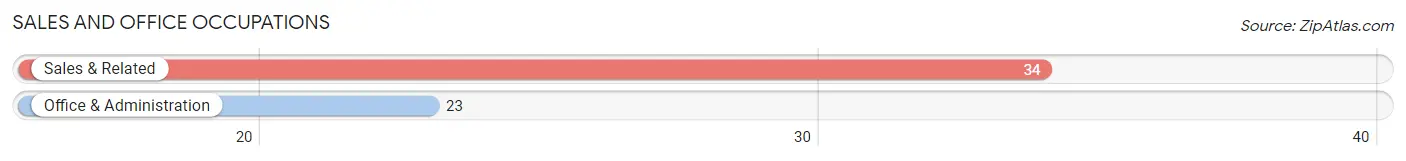
Sales and Office Occupations
The most common Sales and Office occupations in Jane Lew are Sales & Related (34 | 14.0%), and Office & Administration (23 | 9.5%).
Sales and Office Occupations by Sex
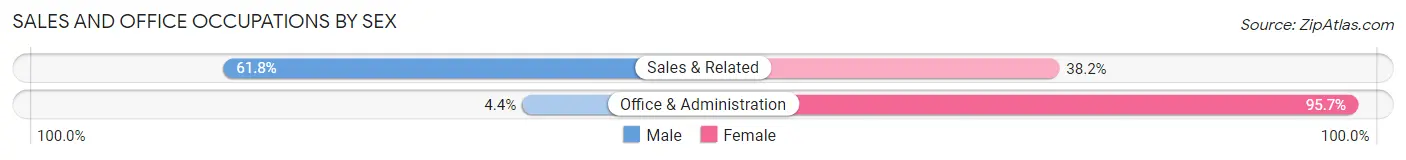
| Occupation | Male | Female |
| Sales & Related | 21 (61.8%) | 13 (38.2%) |
| Office & Administration | 1 (4.3%) | 22 (95.7%) |
| Total (Category) | 22 (38.6%) | 35 (61.4%) |
| Total (Overall) | 138 (56.8%) | 105 (43.2%) |
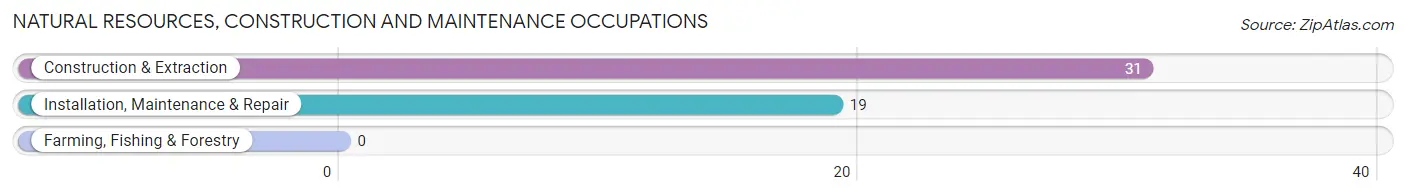
Natural Resources, Construction and Maintenance Occupations
The most common Natural Resources, Construction and Maintenance occupations in Jane Lew are Construction & Extraction (31 | 12.8%), and Installation, Maintenance & Repair (19 | 7.8%).
Natural Resources, Construction and Maintenance Occupations by Sex
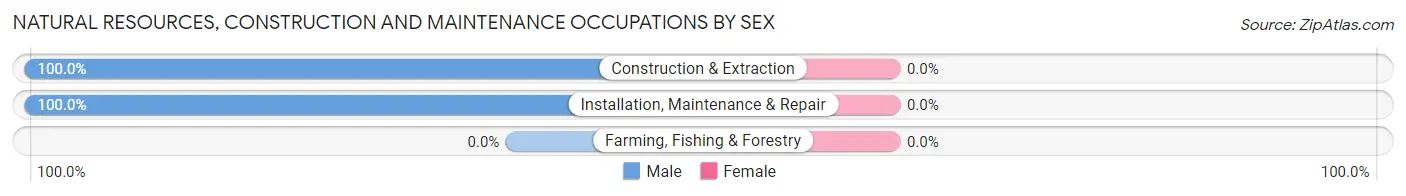
| Occupation | Male | Female |
| Farming, Fishing & Forestry | 0 (0.0%) | 0 (0.0%) |
| Construction & Extraction | 31 (100.0%) | 0 (0.0%) |
| Installation, Maintenance & Repair | 19 (100.0%) | 0 (0.0%) |
| Total (Category) | 50 (100.0%) | 0 (0.0%) |
| Total (Overall) | 138 (56.8%) | 105 (43.2%) |
Production, Transportation and Moving Occupations
The most common Production, Transportation and Moving occupations in Jane Lew are Production (11 | 4.5%), Transportation (11 | 4.5%), and Material Moving (7 | 2.9%).
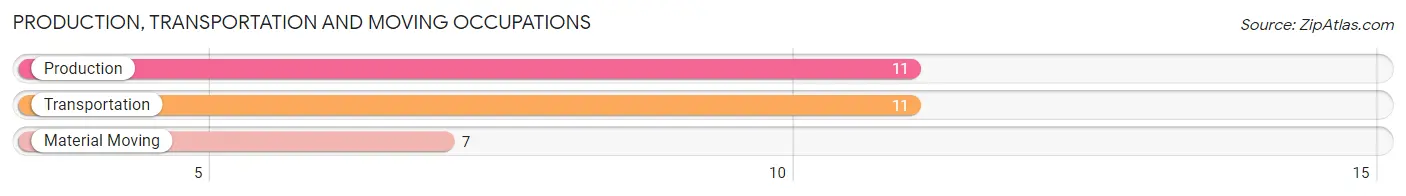
Production, Transportation and Moving Occupations by Sex
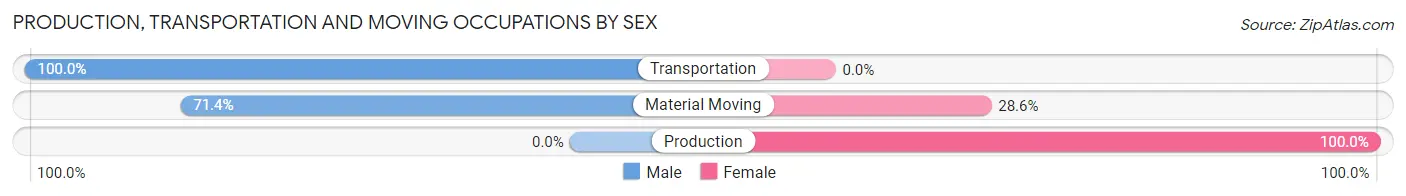
| Occupation | Male | Female |
| Production | 0 (0.0%) | 11 (100.0%) |
| Transportation | 11 (100.0%) | 0 (0.0%) |
| Material Moving | 5 (71.4%) | 2 (28.6%) |
| Total (Category) | 16 (55.2%) | 13 (44.8%) |
| Total (Overall) | 138 (56.8%) | 105 (43.2%) |
Employment Industries by Sex in Jane Lew
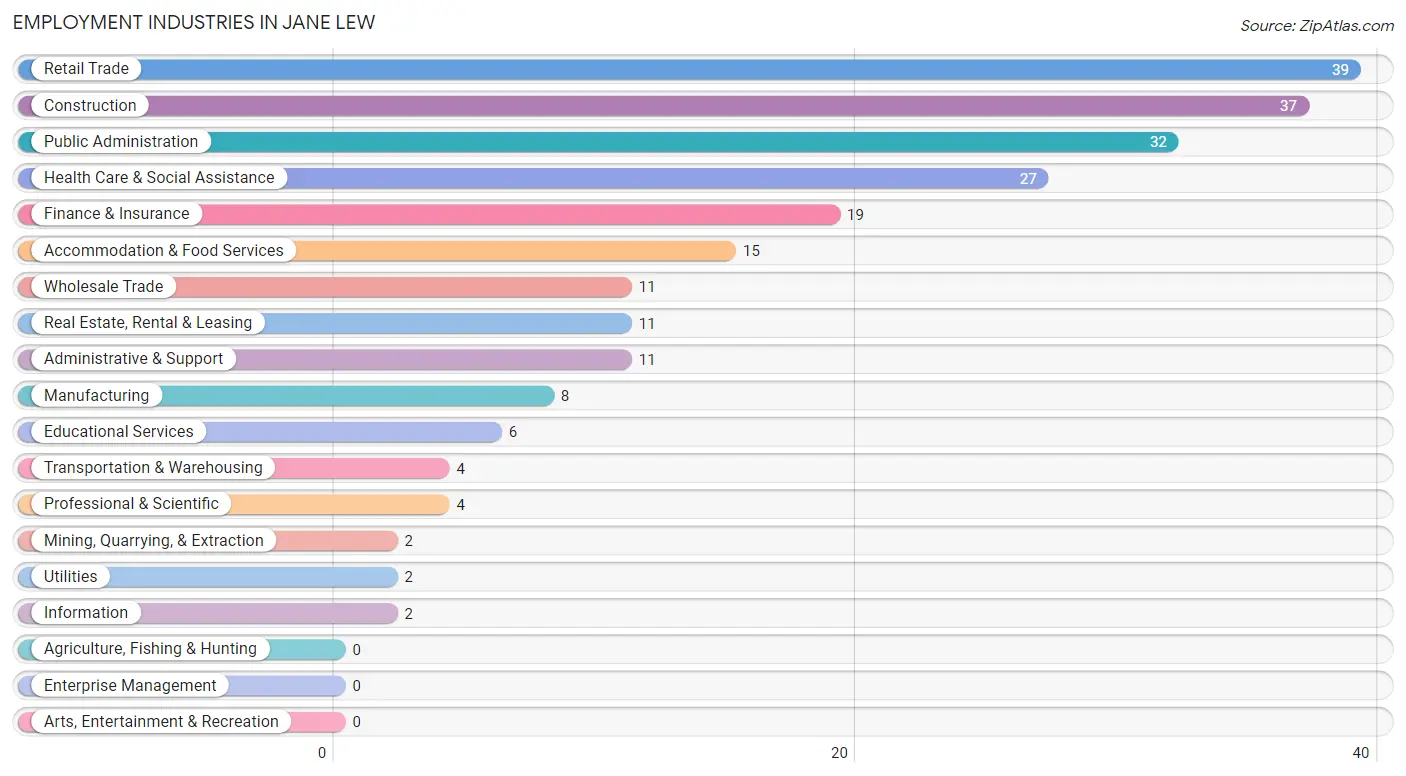
Employment Industries in Jane Lew
The major employment industries in Jane Lew include Retail Trade (39 | 16.1%), Construction (37 | 15.2%), Public Administration (32 | 13.2%), Health Care & Social Assistance (27 | 11.1%), and Finance & Insurance (19 | 7.8%).
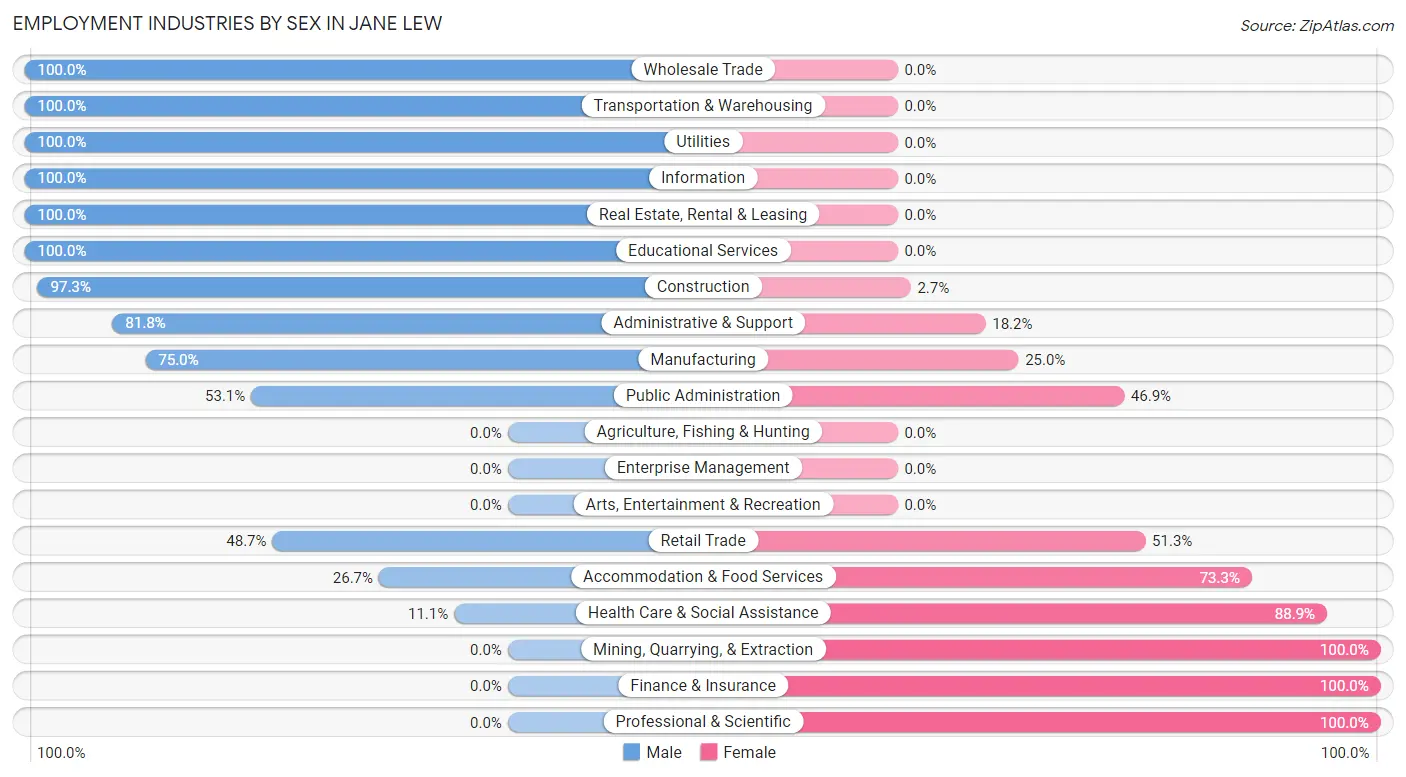
Employment Industries by Sex in Jane Lew
The Jane Lew industries that see more men than women are Wholesale Trade (100.0%), Transportation & Warehousing (100.0%), and Utilities (100.0%), whereas the industries that tend to have a higher number of women are Mining, Quarrying, & Extraction (100.0%), Finance & Insurance (100.0%), and Professional & Scientific (100.0%).
| Industry | Male | Female |
| Agriculture, Fishing & Hunting | 0 (0.0%) | 0 (0.0%) |
| Mining, Quarrying, & Extraction | 0 (0.0%) | 2 (100.0%) |
| Construction | 36 (97.3%) | 1 (2.7%) |
| Manufacturing | 6 (75.0%) | 2 (25.0%) |
| Wholesale Trade | 11 (100.0%) | 0 (0.0%) |
| Retail Trade | 19 (48.7%) | 20 (51.3%) |
| Transportation & Warehousing | 4 (100.0%) | 0 (0.0%) |
| Utilities | 2 (100.0%) | 0 (0.0%) |
| Information | 2 (100.0%) | 0 (0.0%) |
| Finance & Insurance | 0 (0.0%) | 19 (100.0%) |
| Real Estate, Rental & Leasing | 11 (100.0%) | 0 (0.0%) |
| Professional & Scientific | 0 (0.0%) | 4 (100.0%) |
| Enterprise Management | 0 (0.0%) | 0 (0.0%) |
| Administrative & Support | 9 (81.8%) | 2 (18.2%) |
| Educational Services | 6 (100.0%) | 0 (0.0%) |
| Health Care & Social Assistance | 3 (11.1%) | 24 (88.9%) |
| Arts, Entertainment & Recreation | 0 (0.0%) | 0 (0.0%) |
| Accommodation & Food Services | 4 (26.7%) | 11 (73.3%) |
| Public Administration | 17 (53.1%) | 15 (46.9%) |
| Total | 138 (56.8%) | 105 (43.2%) |
Education in Jane Lew
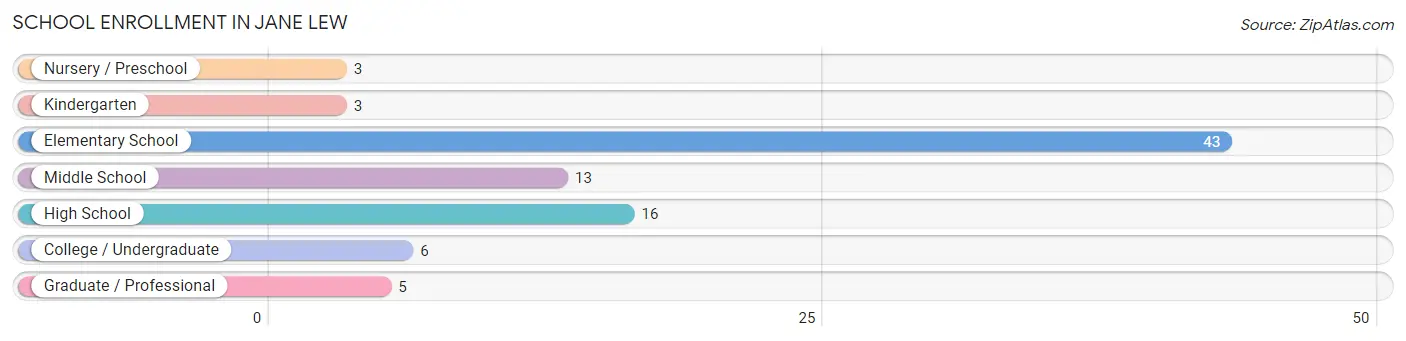
School Enrollment in Jane Lew
The most common levels of schooling among the 89 students in Jane Lew are elementary school (43 | 48.3%), high school (16 | 18.0%), and middle school (13 | 14.6%).
| School Level | # Students | % Students |
| Nursery / Preschool | 3 | 3.4% |
| Kindergarten | 3 | 3.4% |
| Elementary School | 43 | 48.3% |
| Middle School | 13 | 14.6% |
| High School | 16 | 18.0% |
| College / Undergraduate | 6 | 6.7% |
| Graduate / Professional | 5 | 5.6% |
| Total | 89 | 100.0% |
School Enrollment by Age by Funding Source in Jane Lew
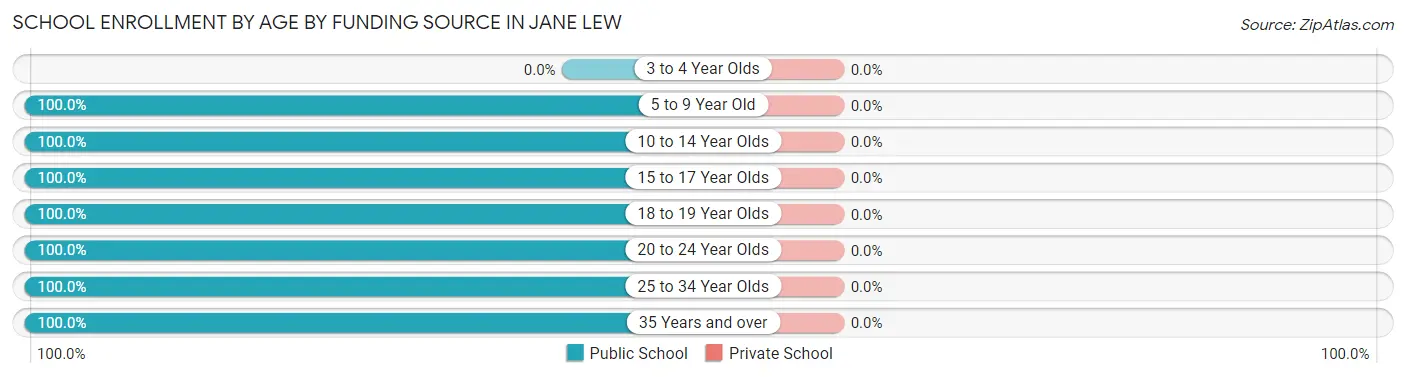
| Age Bracket | Public School | Private School |
| 3 to 4 Year Olds | 0 (0.0%) | 0 (0.0%) |
| 5 to 9 Year Old | 37 (100.0%) | 0 (0.0%) |
| 10 to 14 Year Olds | 25 (100.0%) | 0 (0.0%) |
| 15 to 17 Year Olds | 13 (100.0%) | 0 (0.0%) |
| 18 to 19 Year Olds | 3 (100.0%) | 0 (0.0%) |
| 20 to 24 Year Olds | 3 (100.0%) | 0 (0.0%) |
| 25 to 34 Year Olds | 1 (100.0%) | 0 (0.0%) |
| 35 Years and over | 7 (100.0%) | 0 (0.0%) |
| Total | 89 (100.0%) | 0 (0.0%) |
Educational Attainment by Field of Study in Jane Lew
Business (21 | 21.2%), education (16 | 16.2%), science & technology (15 | 15.1%), psychology (11 | 11.1%), and social sciences (11 | 11.1%) are the most common fields of study among 99 individuals in Jane Lew who have obtained a bachelor's degree or higher.
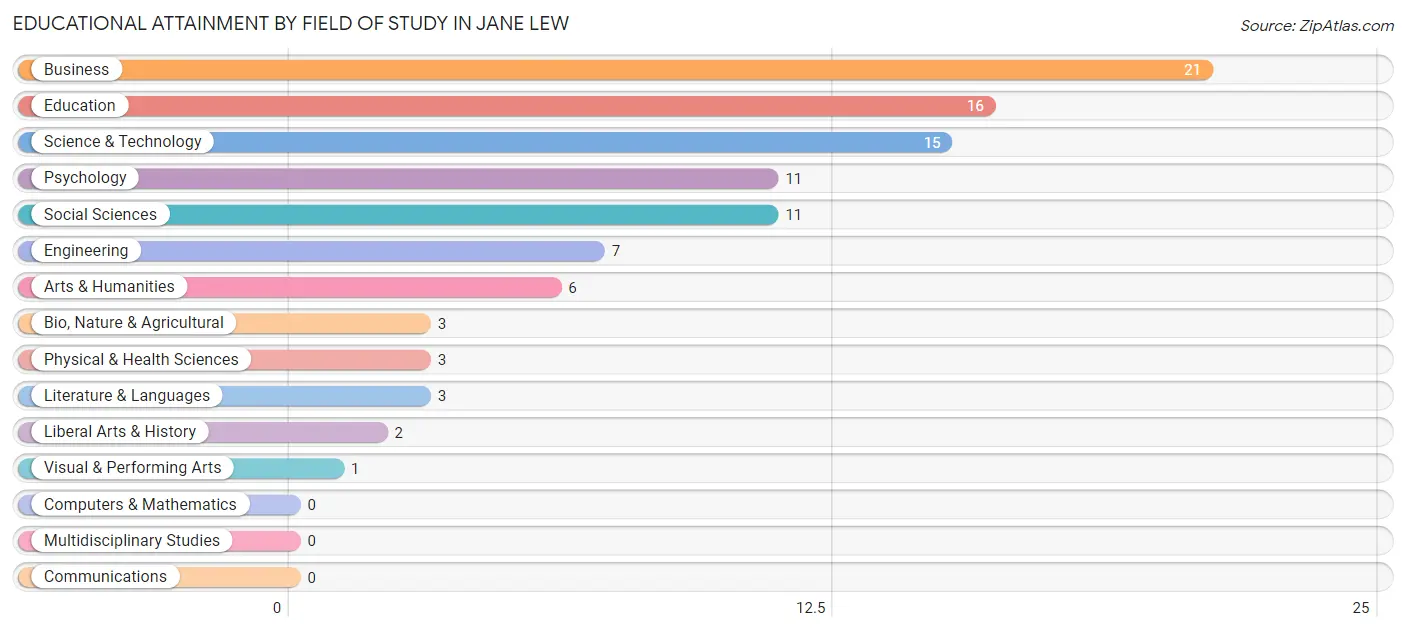
| Field of Study | # Graduates | % Graduates |
| Computers & Mathematics | 0 | 0.0% |
| Bio, Nature & Agricultural | 3 | 3.0% |
| Physical & Health Sciences | 3 | 3.0% |
| Psychology | 11 | 11.1% |
| Social Sciences | 11 | 11.1% |
| Engineering | 7 | 7.1% |
| Multidisciplinary Studies | 0 | 0.0% |
| Science & Technology | 15 | 15.1% |
| Business | 21 | 21.2% |
| Education | 16 | 16.2% |
| Literature & Languages | 3 | 3.0% |
| Liberal Arts & History | 2 | 2.0% |
| Visual & Performing Arts | 1 | 1.0% |
| Communications | 0 | 0.0% |
| Arts & Humanities | 6 | 6.1% |
| Total | 99 | 100.0% |
Transportation & Commute in Jane Lew
Vehicle Availability by Sex in Jane Lew
The most prevalent vehicle ownership categories in Jane Lew are males with 2 vehicles (53, accounting for 41.7%) and females with 2 vehicles (51, making up 50.5%).
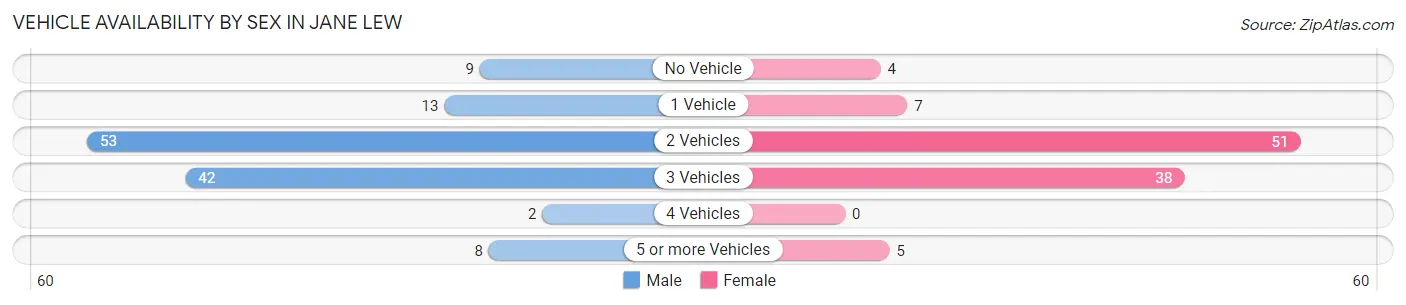
| Vehicles Available | Male | Female |
| No Vehicle | 9 (7.1%) | 4 (3.8%) |
| 1 Vehicle | 13 (10.2%) | 7 (6.7%) |
| 2 Vehicles | 53 (41.7%) | 51 (48.6%) |
| 3 Vehicles | 42 (33.1%) | 38 (36.2%) |
| 4 Vehicles | 2 (1.6%) | 0 (0.0%) |
| 5 or more Vehicles | 8 (6.3%) | 5 (4.8%) |
| Total | 127 (100.0%) | 105 (100.0%) |
Commute Time in Jane Lew
The most frequently occuring commute durations in Jane Lew are 20 to 24 minutes (30 commuters, 14.7%), 10 to 14 minutes (29 commuters, 14.2%), and 35 to 39 minutes (25 commuters, 12.2%).
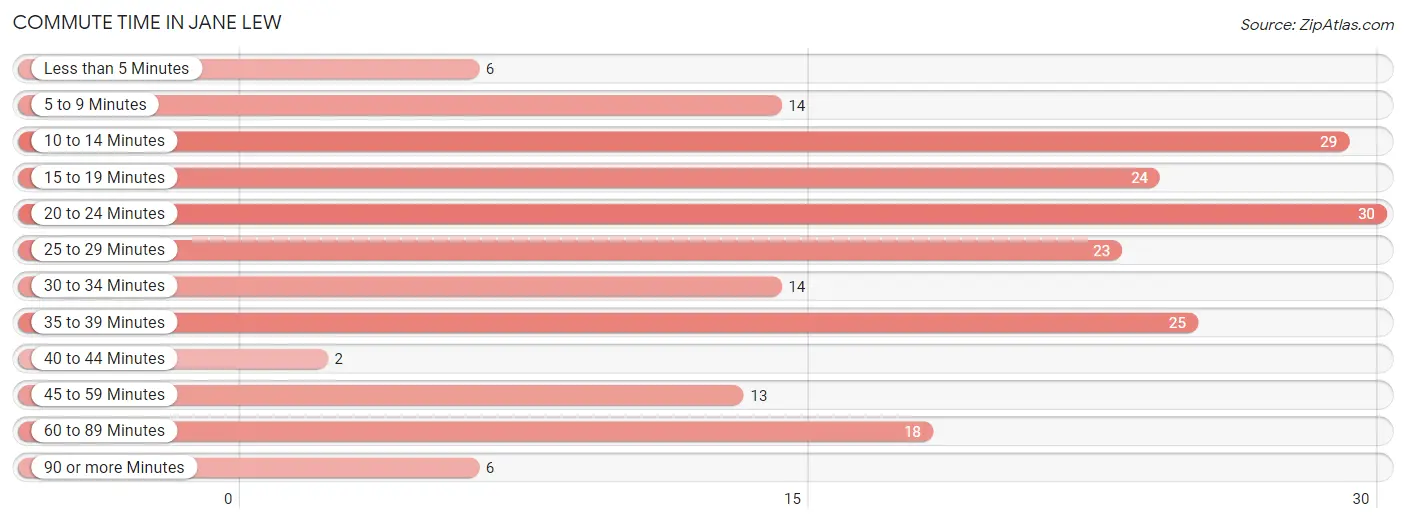
| Commute Time | # Commuters | % Commuters |
| Less than 5 Minutes | 6 | 2.9% |
| 5 to 9 Minutes | 14 | 6.9% |
| 10 to 14 Minutes | 29 | 14.2% |
| 15 to 19 Minutes | 24 | 11.8% |
| 20 to 24 Minutes | 30 | 14.7% |
| 25 to 29 Minutes | 23 | 11.3% |
| 30 to 34 Minutes | 14 | 6.9% |
| 35 to 39 Minutes | 25 | 12.2% |
| 40 to 44 Minutes | 2 | 1.0% |
| 45 to 59 Minutes | 13 | 6.4% |
| 60 to 89 Minutes | 18 | 8.8% |
| 90 or more Minutes | 6 | 2.9% |
Commute Time by Sex in Jane Lew
The most common commute times in Jane Lew are 10 to 14 minutes (25 commuters, 20.8%) for males and 25 to 29 minutes (21 commuters, 25.0%) for females.
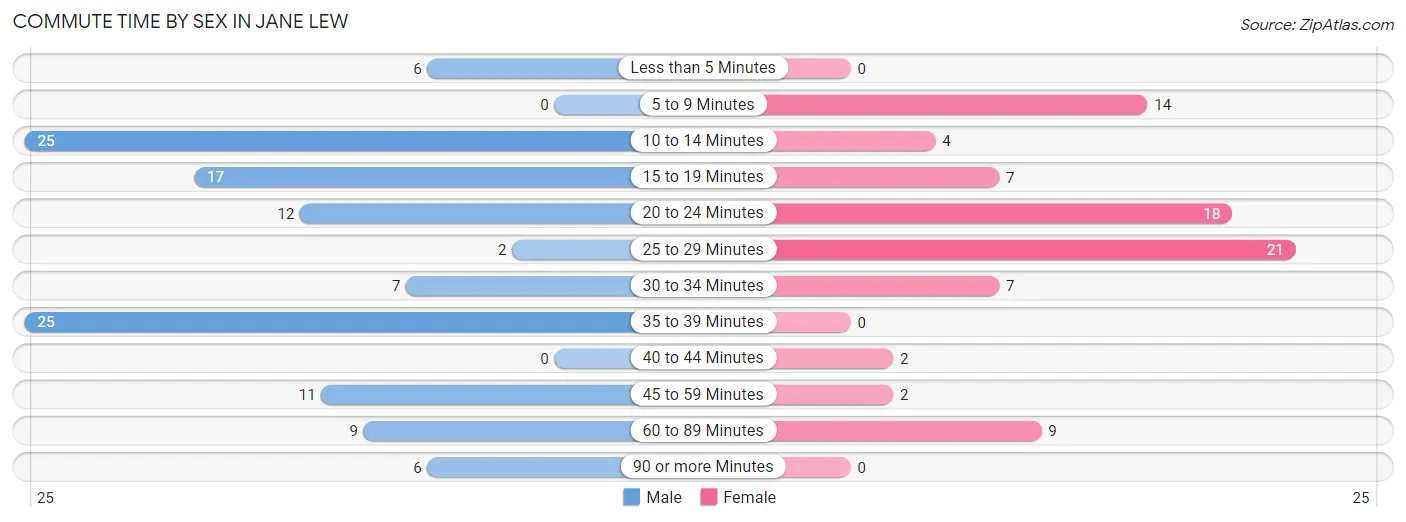
| Commute Time | Male | Female |
| Less than 5 Minutes | 6 (5.0%) | 0 (0.0%) |
| 5 to 9 Minutes | 0 (0.0%) | 14 (16.7%) |
| 10 to 14 Minutes | 25 (20.8%) | 4 (4.8%) |
| 15 to 19 Minutes | 17 (14.2%) | 7 (8.3%) |
| 20 to 24 Minutes | 12 (10.0%) | 18 (21.4%) |
| 25 to 29 Minutes | 2 (1.7%) | 21 (25.0%) |
| 30 to 34 Minutes | 7 (5.8%) | 7 (8.3%) |
| 35 to 39 Minutes | 25 (20.8%) | 0 (0.0%) |
| 40 to 44 Minutes | 0 (0.0%) | 2 (2.4%) |
| 45 to 59 Minutes | 11 (9.2%) | 2 (2.4%) |
| 60 to 89 Minutes | 9 (7.5%) | 9 (10.7%) |
| 90 or more Minutes | 6 (5.0%) | 0 (0.0%) |
Time of Departure to Work by Sex in Jane Lew
The most frequent times of departure to work in Jane Lew are 6:00 AM to 6:29 AM (31, 25.8%) for males and 7:30 AM to 7:59 AM (28, 33.3%) for females.
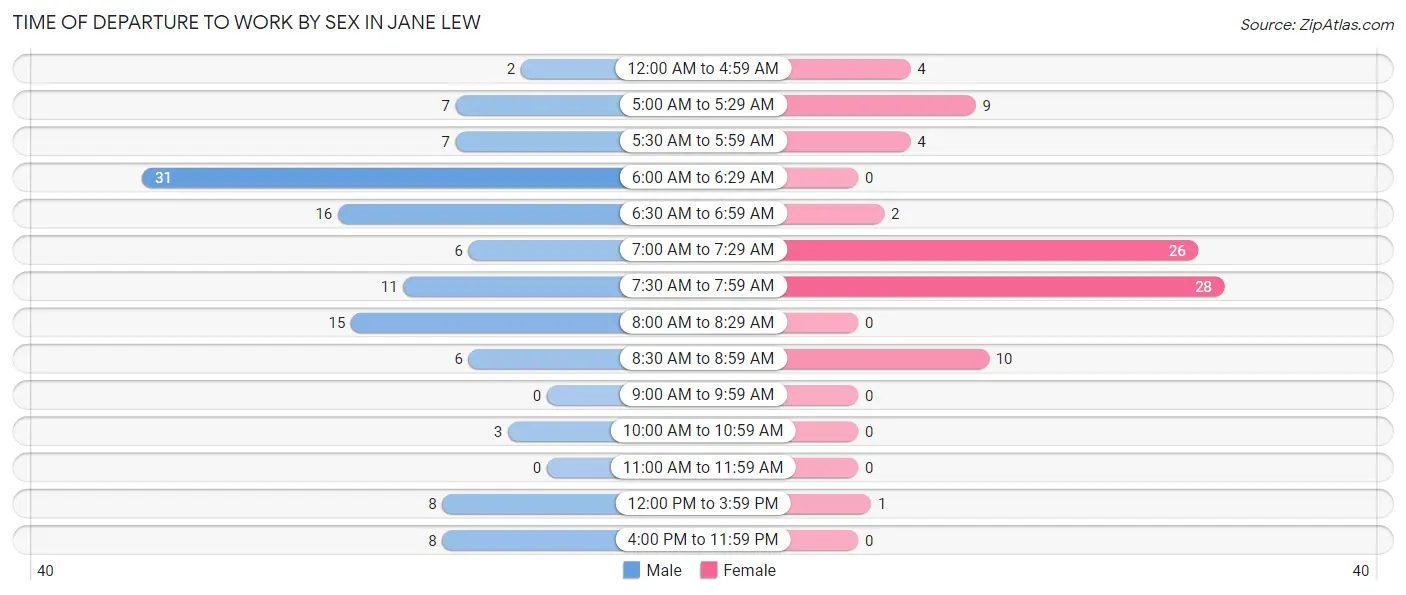
| Time of Departure | Male | Female |
| 12:00 AM to 4:59 AM | 2 (1.7%) | 4 (4.8%) |
| 5:00 AM to 5:29 AM | 7 (5.8%) | 9 (10.7%) |
| 5:30 AM to 5:59 AM | 7 (5.8%) | 4 (4.8%) |
| 6:00 AM to 6:29 AM | 31 (25.8%) | 0 (0.0%) |
| 6:30 AM to 6:59 AM | 16 (13.3%) | 2 (2.4%) |
| 7:00 AM to 7:29 AM | 6 (5.0%) | 26 (30.9%) |
| 7:30 AM to 7:59 AM | 11 (9.2%) | 28 (33.3%) |
| 8:00 AM to 8:29 AM | 15 (12.5%) | 0 (0.0%) |
| 8:30 AM to 8:59 AM | 6 (5.0%) | 10 (11.9%) |
| 9:00 AM to 9:59 AM | 0 (0.0%) | 0 (0.0%) |
| 10:00 AM to 10:59 AM | 3 (2.5%) | 0 (0.0%) |
| 11:00 AM to 11:59 AM | 0 (0.0%) | 0 (0.0%) |
| 12:00 PM to 3:59 PM | 8 (6.7%) | 1 (1.2%) |
| 4:00 PM to 11:59 PM | 8 (6.7%) | 0 (0.0%) |
| Total | 120 (100.0%) | 84 (100.0%) |
Housing Occupancy in Jane Lew
Occupancy by Ownership in Jane Lew
Of the total 251 dwellings in Jane Lew, owner-occupied units account for 181 (72.1%), while renter-occupied units make up 70 (27.9%).
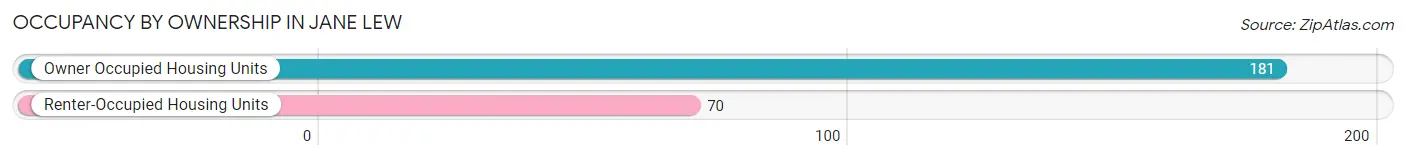
| Occupancy | # Housing Units | % Housing Units |
| Owner Occupied Housing Units | 181 | 72.1% |
| Renter-Occupied Housing Units | 70 | 27.9% |
| Total Occupied Housing Units | 251 | 100.0% |
Occupancy by Household Size in Jane Lew
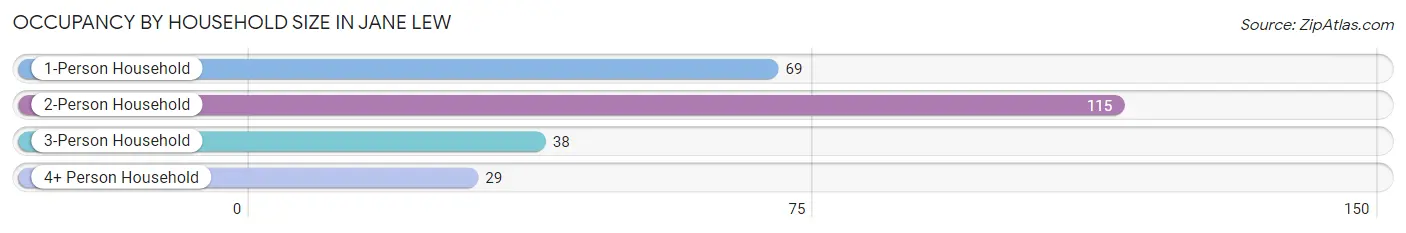
| Household Size | # Housing Units | % Housing Units |
| 1-Person Household | 69 | 27.5% |
| 2-Person Household | 115 | 45.8% |
| 3-Person Household | 38 | 15.1% |
| 4+ Person Household | 29 | 11.6% |
| Total Housing Units | 251 | 100.0% |
Occupancy by Ownership by Household Size in Jane Lew
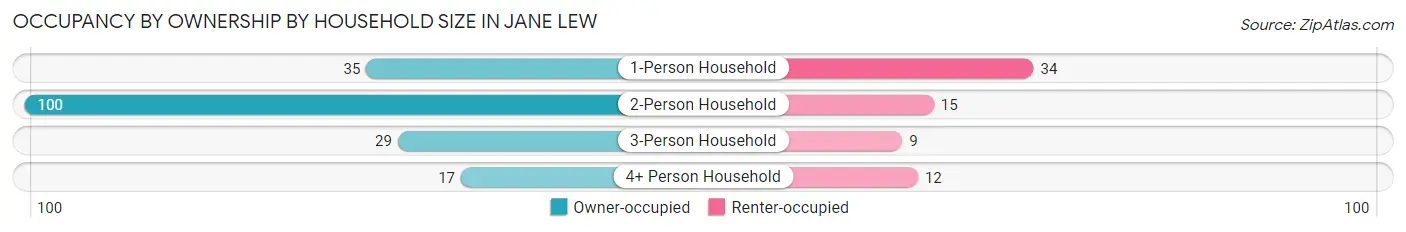
| Household Size | Owner-occupied | Renter-occupied |
| 1-Person Household | 35 (50.7%) | 34 (49.3%) |
| 2-Person Household | 100 (87.0%) | 15 (13.0%) |
| 3-Person Household | 29 (76.3%) | 9 (23.7%) |
| 4+ Person Household | 17 (58.6%) | 12 (41.4%) |
| Total Housing Units | 181 (72.1%) | 70 (27.9%) |
Occupancy by Educational Attainment in Jane Lew
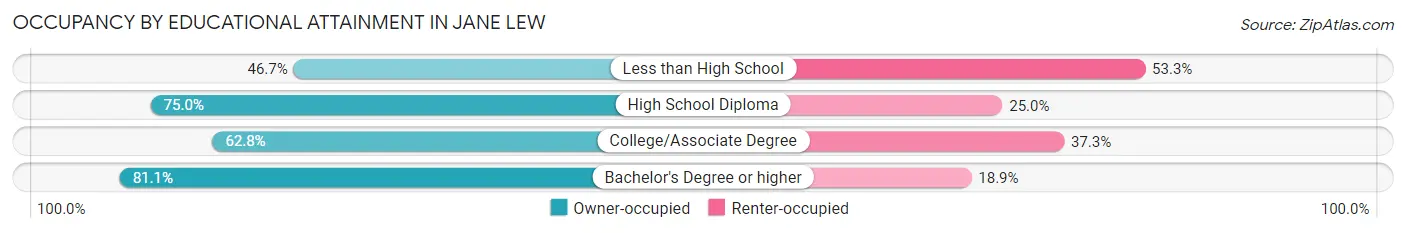
| Household Size | Owner-occupied | Renter-occupied |
| Less than High School | 7 (46.7%) | 8 (53.3%) |
| High School Diploma | 99 (75.0%) | 33 (25.0%) |
| College/Associate Degree | 32 (62.7%) | 19 (37.2%) |
| Bachelor's Degree or higher | 43 (81.1%) | 10 (18.9%) |
Occupancy by Age of Householder in Jane Lew
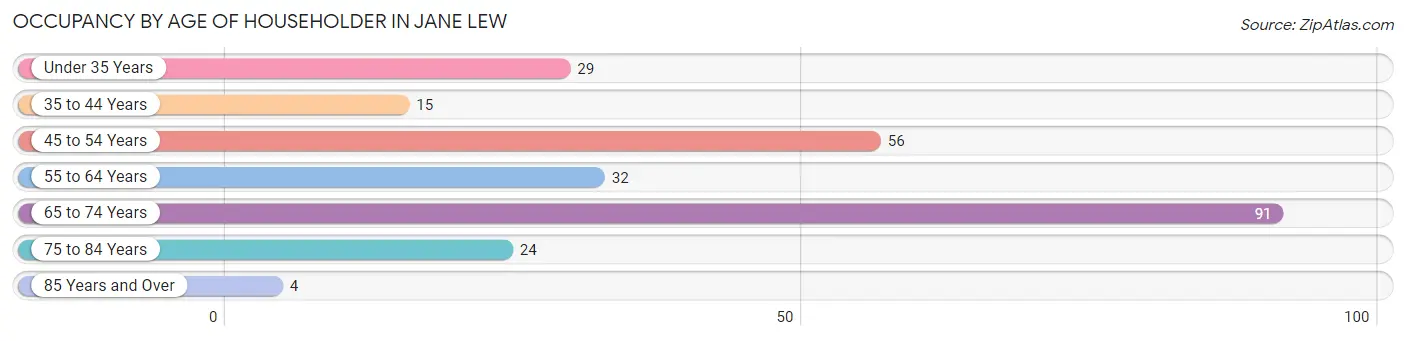
| Age Bracket | # Households | % Households |
| Under 35 Years | 29 | 11.6% |
| 35 to 44 Years | 15 | 6.0% |
| 45 to 54 Years | 56 | 22.3% |
| 55 to 64 Years | 32 | 12.8% |
| 65 to 74 Years | 91 | 36.2% |
| 75 to 84 Years | 24 | 9.6% |
| 85 Years and Over | 4 | 1.6% |
| Total | 251 | 100.0% |
Housing Finances in Jane Lew
Median Income by Occupancy in Jane Lew
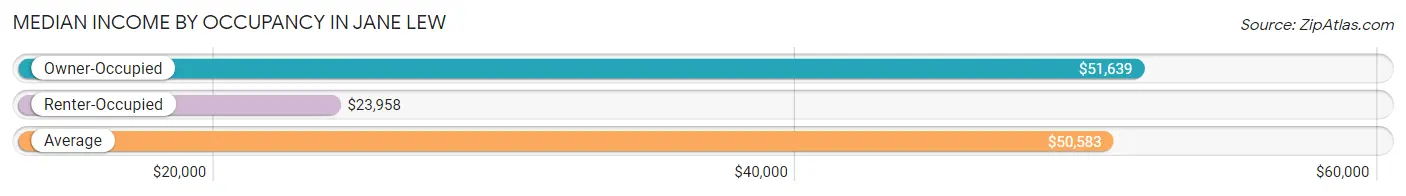
| Occupancy Type | # Households | Median Income |
| Owner-Occupied | 181 (72.1%) | $51,639 |
| Renter-Occupied | 70 (27.9%) | $23,958 |
| Average | 251 (100.0%) | $50,583 |
Occupancy by Householder Income Bracket in Jane Lew
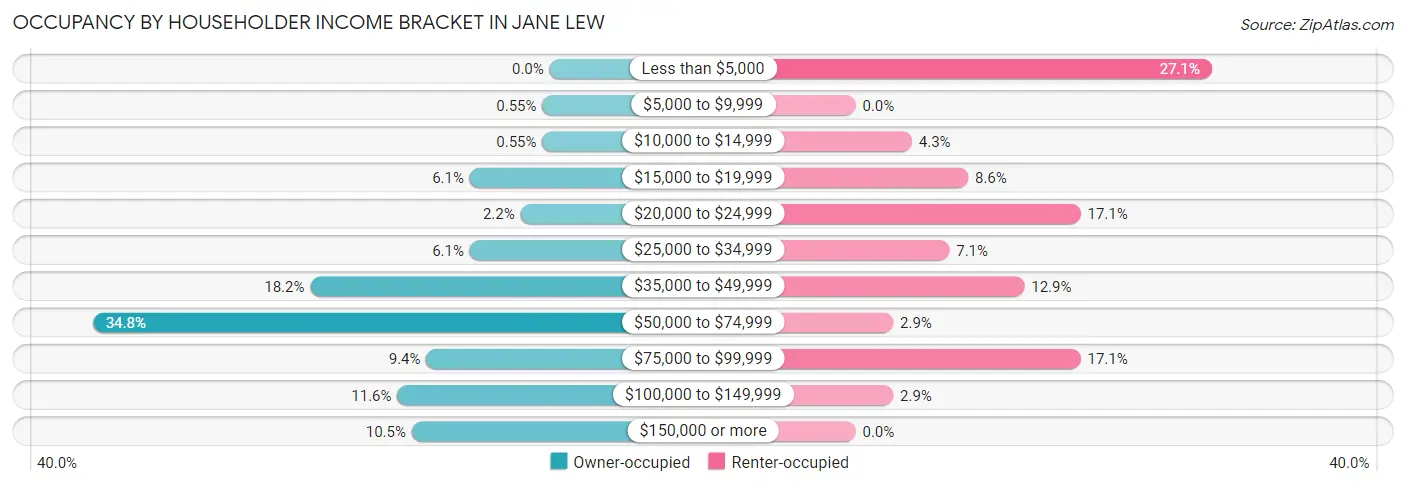
| Income Bracket | Owner-occupied | Renter-occupied |
| Less than $5,000 | 0 (0.0%) | 19 (27.1%) |
| $5,000 to $9,999 | 1 (0.5%) | 0 (0.0%) |
| $10,000 to $14,999 | 1 (0.5%) | 3 (4.3%) |
| $15,000 to $19,999 | 11 (6.1%) | 6 (8.6%) |
| $20,000 to $24,999 | 4 (2.2%) | 12 (17.1%) |
| $25,000 to $34,999 | 11 (6.1%) | 5 (7.1%) |
| $35,000 to $49,999 | 33 (18.2%) | 9 (12.9%) |
| $50,000 to $74,999 | 63 (34.8%) | 2 (2.9%) |
| $75,000 to $99,999 | 17 (9.4%) | 12 (17.1%) |
| $100,000 to $149,999 | 21 (11.6%) | 2 (2.9%) |
| $150,000 or more | 19 (10.5%) | 0 (0.0%) |
| Total | 181 (100.0%) | 70 (100.0%) |
Monthly Housing Cost Tiers in Jane Lew
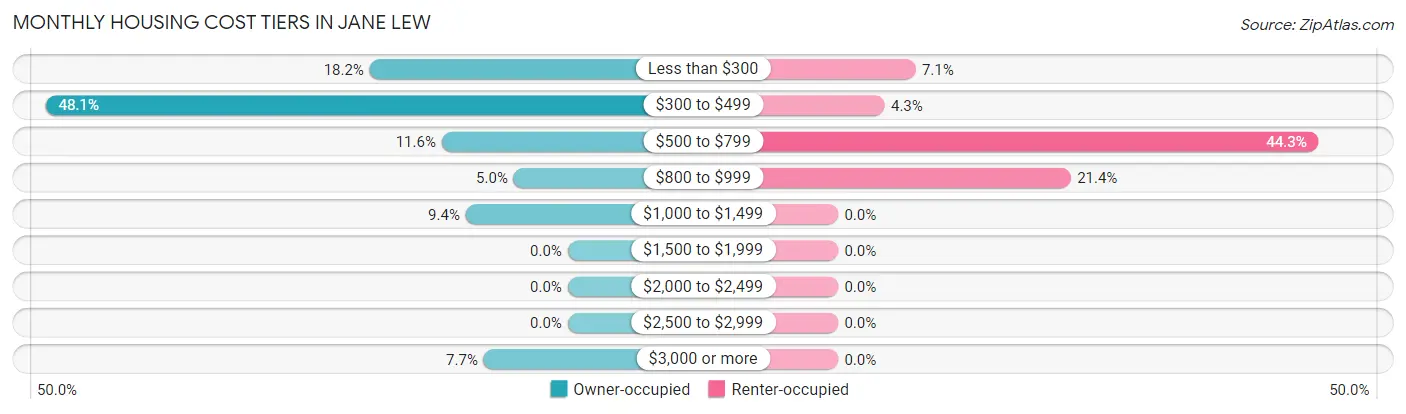
| Monthly Cost | Owner-occupied | Renter-occupied |
| Less than $300 | 33 (18.2%) | 5 (7.1%) |
| $300 to $499 | 87 (48.1%) | 3 (4.3%) |
| $500 to $799 | 21 (11.6%) | 31 (44.3%) |
| $800 to $999 | 9 (5.0%) | 15 (21.4%) |
| $1,000 to $1,499 | 17 (9.4%) | 0 (0.0%) |
| $1,500 to $1,999 | 0 (0.0%) | 0 (0.0%) |
| $2,000 to $2,499 | 0 (0.0%) | 0 (0.0%) |
| $2,500 to $2,999 | 0 (0.0%) | 0 (0.0%) |
| $3,000 or more | 14 (7.7%) | 0 (0.0%) |
| Total | 181 (100.0%) | 70 (100.0%) |
Physical Housing Characteristics in Jane Lew
Housing Structures in Jane Lew
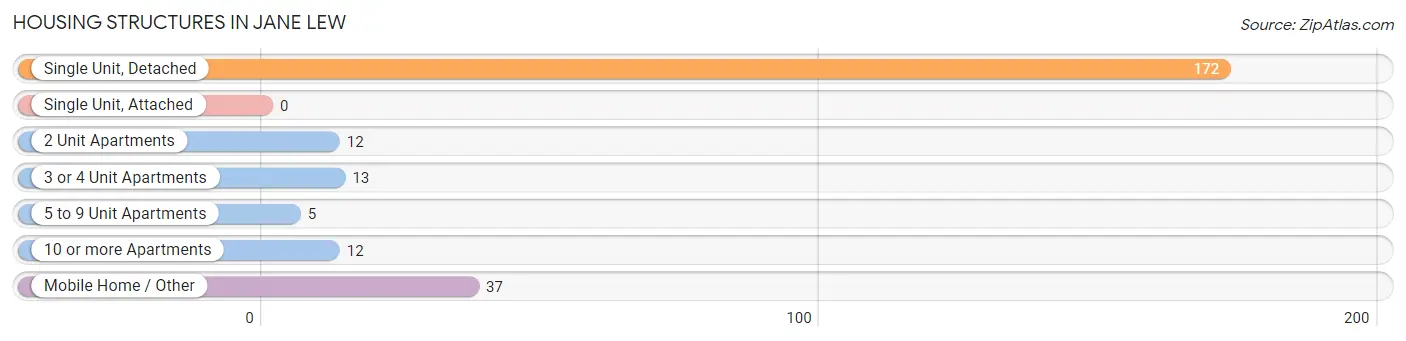
| Structure Type | # Housing Units | % Housing Units |
| Single Unit, Detached | 172 | 68.5% |
| Single Unit, Attached | 0 | 0.0% |
| 2 Unit Apartments | 12 | 4.8% |
| 3 or 4 Unit Apartments | 13 | 5.2% |
| 5 to 9 Unit Apartments | 5 | 2.0% |
| 10 or more Apartments | 12 | 4.8% |
| Mobile Home / Other | 37 | 14.7% |
| Total | 251 | 100.0% |
Housing Structures by Occupancy in Jane Lew
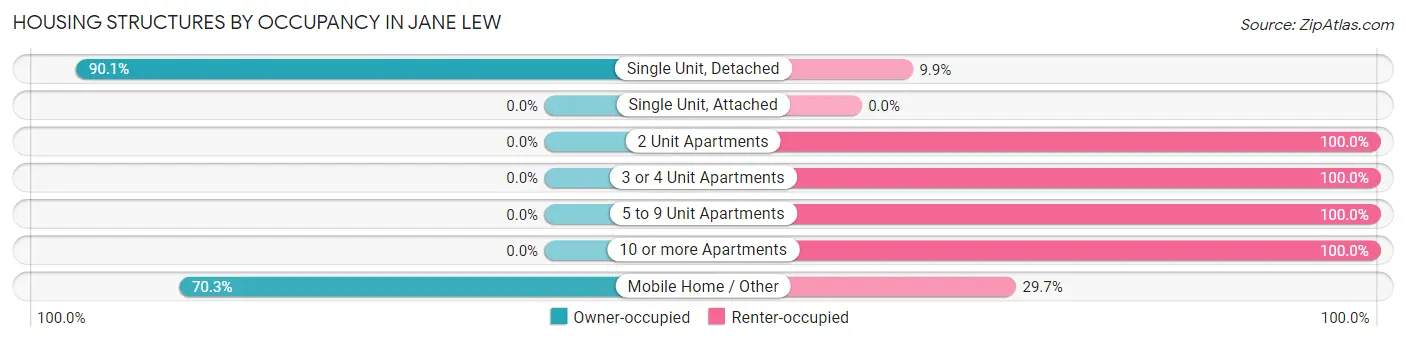
| Structure Type | Owner-occupied | Renter-occupied |
| Single Unit, Detached | 155 (90.1%) | 17 (9.9%) |
| Single Unit, Attached | 0 (0.0%) | 0 (0.0%) |
| 2 Unit Apartments | 0 (0.0%) | 12 (100.0%) |
| 3 or 4 Unit Apartments | 0 (0.0%) | 13 (100.0%) |
| 5 to 9 Unit Apartments | 0 (0.0%) | 5 (100.0%) |
| 10 or more Apartments | 0 (0.0%) | 12 (100.0%) |
| Mobile Home / Other | 26 (70.3%) | 11 (29.7%) |
| Total | 181 (72.1%) | 70 (27.9%) |
Housing Structures by Number of Rooms in Jane Lew
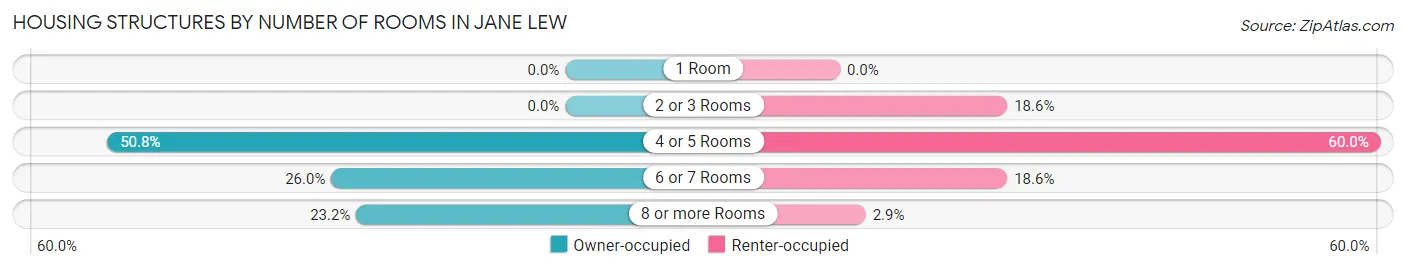
| Number of Rooms | Owner-occupied | Renter-occupied |
| 1 Room | 0 (0.0%) | 0 (0.0%) |
| 2 or 3 Rooms | 0 (0.0%) | 13 (18.6%) |
| 4 or 5 Rooms | 92 (50.8%) | 42 (60.0%) |
| 6 or 7 Rooms | 47 (26.0%) | 13 (18.6%) |
| 8 or more Rooms | 42 (23.2%) | 2 (2.9%) |
| Total | 181 (100.0%) | 70 (100.0%) |
Housing Structure by Heating Type in Jane Lew
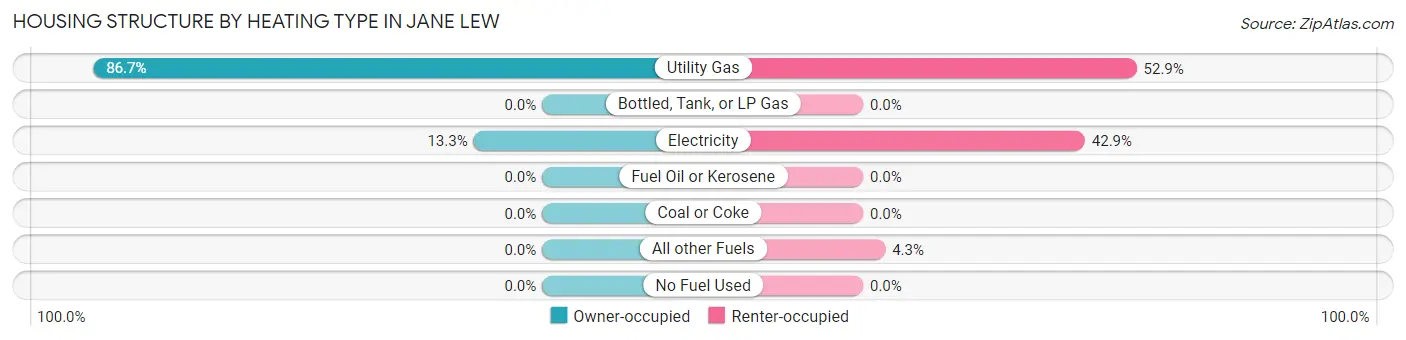
| Heating Type | Owner-occupied | Renter-occupied |
| Utility Gas | 157 (86.7%) | 37 (52.9%) |
| Bottled, Tank, or LP Gas | 0 (0.0%) | 0 (0.0%) |
| Electricity | 24 (13.3%) | 30 (42.9%) |
| Fuel Oil or Kerosene | 0 (0.0%) | 0 (0.0%) |
| Coal or Coke | 0 (0.0%) | 0 (0.0%) |
| All other Fuels | 0 (0.0%) | 3 (4.3%) |
| No Fuel Used | 0 (0.0%) | 0 (0.0%) |
| Total | 181 (100.0%) | 70 (100.0%) |
Household Vehicle Usage in Jane Lew
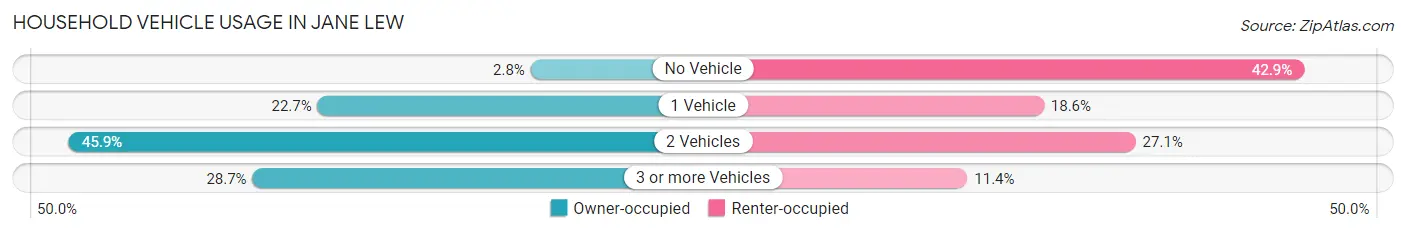
| Vehicles per Household | Owner-occupied | Renter-occupied |
| No Vehicle | 5 (2.8%) | 30 (42.9%) |
| 1 Vehicle | 41 (22.7%) | 13 (18.6%) |
| 2 Vehicles | 83 (45.9%) | 19 (27.1%) |
| 3 or more Vehicles | 52 (28.7%) | 8 (11.4%) |
| Total | 181 (100.0%) | 70 (100.0%) |
Real Estate & Mortgages in Jane Lew
Real Estate and Mortgage Overview in Jane Lew
| Characteristic | Without Mortgage | With Mortgage |
| Housing Units | 133 | 48 |
| Median Property Value | $66,300 | $0 |
| Median Household Income | $51,280 | $16 |
| Monthly Housing Costs | $327 | $14 |
| Real Estate Taxes | $850 | $0 |
Property Value by Mortgage Status in Jane Lew
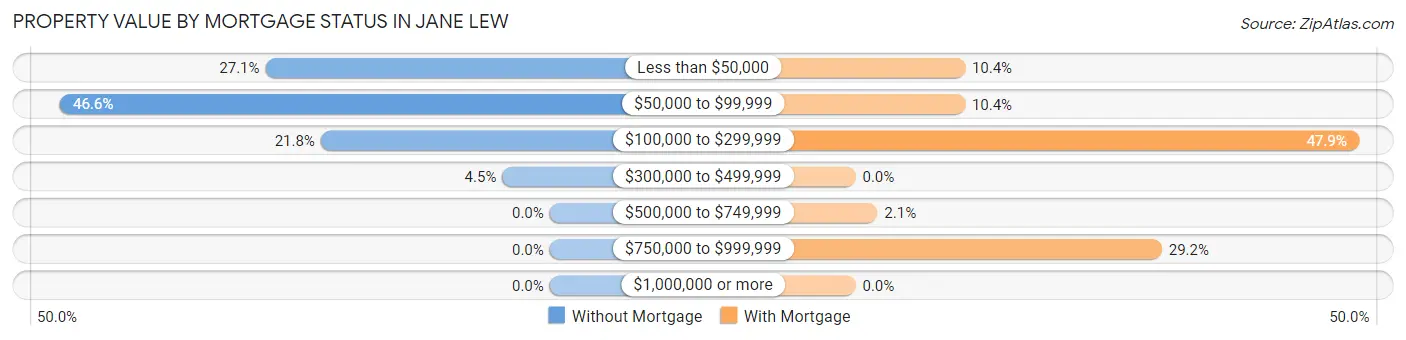
| Property Value | Without Mortgage | With Mortgage |
| Less than $50,000 | 36 (27.1%) | 5 (10.4%) |
| $50,000 to $99,999 | 62 (46.6%) | 5 (10.4%) |
| $100,000 to $299,999 | 29 (21.8%) | 23 (47.9%) |
| $300,000 to $499,999 | 6 (4.5%) | 0 (0.0%) |
| $500,000 to $749,999 | 0 (0.0%) | 1 (2.1%) |
| $750,000 to $999,999 | 0 (0.0%) | 14 (29.2%) |
| $1,000,000 or more | 0 (0.0%) | 0 (0.0%) |
| Total | 133 (100.0%) | 48 (100.0%) |
Household Income by Mortgage Status in Jane Lew
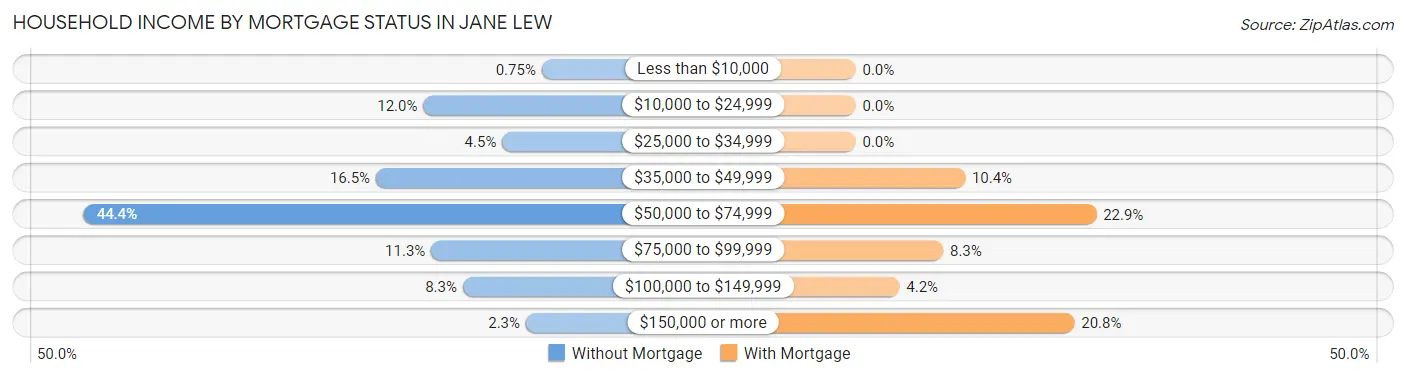
| Household Income | Without Mortgage | With Mortgage |
| Less than $10,000 | 1 (0.7%) | 0 (0.0%) |
| $10,000 to $24,999 | 16 (12.0%) | 0 (0.0%) |
| $25,000 to $34,999 | 6 (4.5%) | 0 (0.0%) |
| $35,000 to $49,999 | 22 (16.5%) | 5 (10.4%) |
| $50,000 to $74,999 | 59 (44.4%) | 11 (22.9%) |
| $75,000 to $99,999 | 15 (11.3%) | 4 (8.3%) |
| $100,000 to $149,999 | 11 (8.3%) | 2 (4.2%) |
| $150,000 or more | 3 (2.3%) | 10 (20.8%) |
| Total | 133 (100.0%) | 48 (100.0%) |
Property Value to Household Income Ratio in Jane Lew
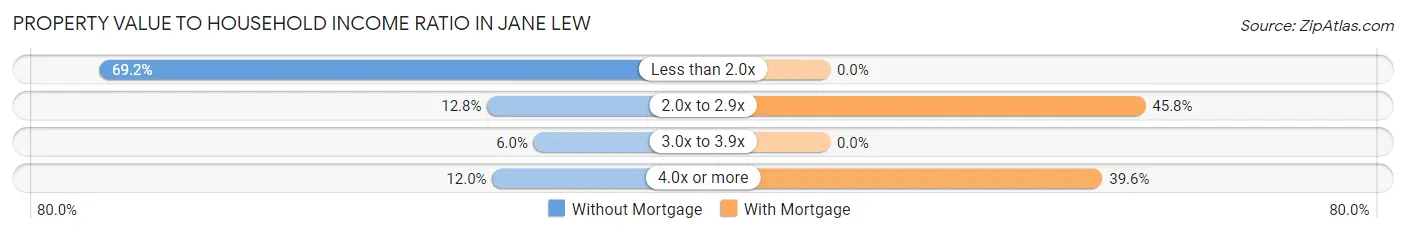
| Value-to-Income Ratio | Without Mortgage | With Mortgage |
| Less than 2.0x | 92 (69.2%) | 0 (0.0%) |
| 2.0x to 2.9x | 17 (12.8%) | 22 (45.8%) |
| 3.0x to 3.9x | 8 (6.0%) | 0 (0.0%) |
| 4.0x or more | 16 (12.0%) | 19 (39.6%) |
| Total | 133 (100.0%) | 48 (100.0%) |
Real Estate Taxes by Mortgage Status in Jane Lew
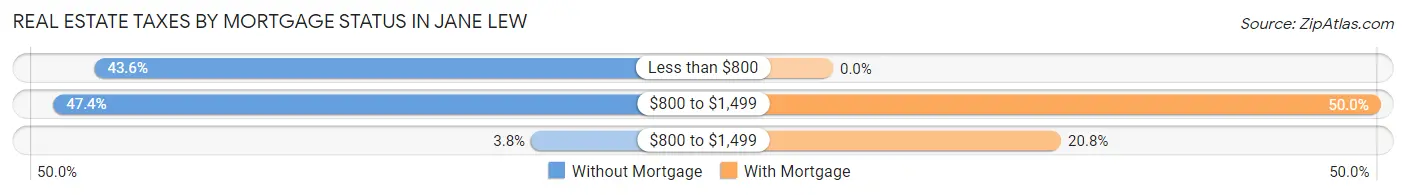
| Property Taxes | Without Mortgage | With Mortgage |
| Less than $800 | 58 (43.6%) | 0 (0.0%) |
| $800 to $1,499 | 63 (47.4%) | 24 (50.0%) |
| $800 to $1,499 | 5 (3.8%) | 10 (20.8%) |
| Total | 133 (100.0%) | 48 (100.0%) |
Health & Disability in Jane Lew
Health Insurance Coverage by Age in Jane Lew
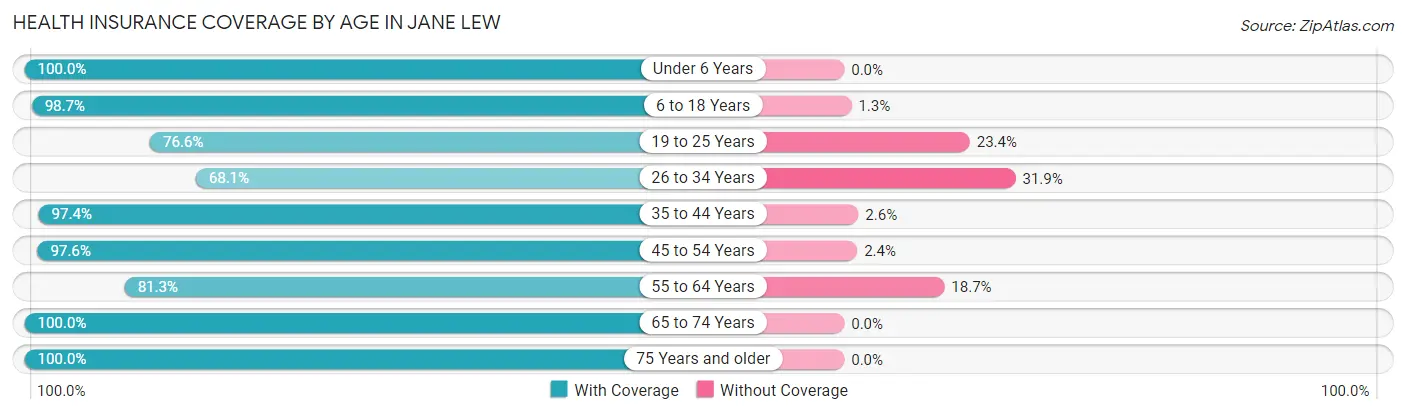
| Age Bracket | With Coverage | Without Coverage |
| Under 6 Years | 40 (100.0%) | 0 (0.0%) |
| 6 to 18 Years | 74 (98.7%) | 1 (1.3%) |
| 19 to 25 Years | 36 (76.6%) | 11 (23.4%) |
| 26 to 34 Years | 49 (68.1%) | 23 (31.9%) |
| 35 to 44 Years | 37 (97.4%) | 1 (2.6%) |
| 45 to 54 Years | 81 (97.6%) | 2 (2.4%) |
| 55 to 64 Years | 61 (81.3%) | 14 (18.7%) |
| 65 to 74 Years | 150 (100.0%) | 0 (0.0%) |
| 75 Years and older | 36 (100.0%) | 0 (0.0%) |
| Total | 564 (91.6%) | 52 (8.4%) |
Health Insurance Coverage by Citizenship Status in Jane Lew

| Citizenship Status | With Coverage | Without Coverage |
| Native Born | 40 (100.0%) | 0 (0.0%) |
| Foreign Born, Citizen | 74 (98.7%) | 1 (1.3%) |
| Foreign Born, not a Citizen | 36 (76.6%) | 11 (23.4%) |
Health Insurance Coverage by Household Income in Jane Lew
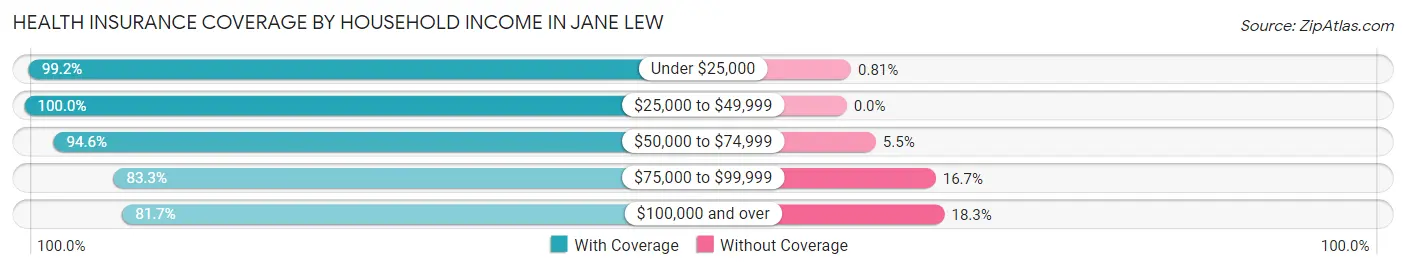
| Household Income | With Coverage | Without Coverage |
| Under $25,000 | 123 (99.2%) | 1 (0.8%) |
| $25,000 to $49,999 | 131 (100.0%) | 0 (0.0%) |
| $50,000 to $74,999 | 104 (94.6%) | 6 (5.4%) |
| $75,000 to $99,999 | 50 (83.3%) | 10 (16.7%) |
| $100,000 and over | 156 (81.7%) | 35 (18.3%) |
Public vs Private Health Insurance Coverage by Age in Jane Lew
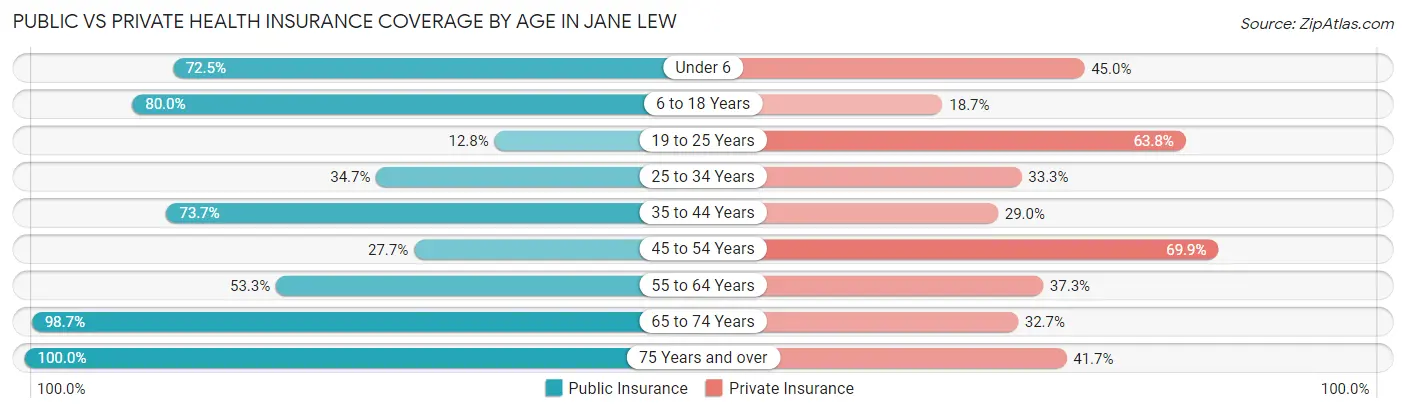
| Age Bracket | Public Insurance | Private Insurance |
| Under 6 | 29 (72.5%) | 18 (45.0%) |
| 6 to 18 Years | 60 (80.0%) | 14 (18.7%) |
| 19 to 25 Years | 6 (12.8%) | 30 (63.8%) |
| 25 to 34 Years | 25 (34.7%) | 24 (33.3%) |
| 35 to 44 Years | 28 (73.7%) | 11 (28.9%) |
| 45 to 54 Years | 23 (27.7%) | 58 (69.9%) |
| 55 to 64 Years | 40 (53.3%) | 28 (37.3%) |
| 65 to 74 Years | 148 (98.7%) | 49 (32.7%) |
| 75 Years and over | 36 (100.0%) | 15 (41.7%) |
| Total | 395 (64.1%) | 247 (40.1%) |
Disability Status by Sex by Age in Jane Lew
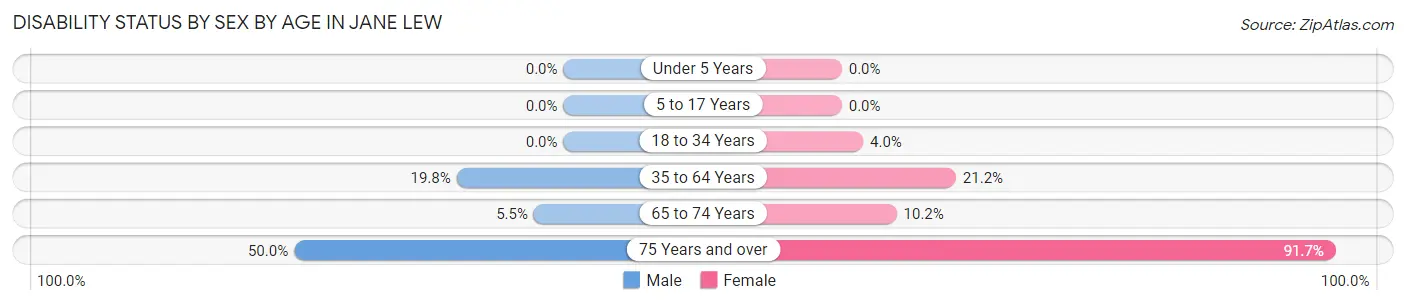
| Age Bracket | Male | Female |
| Under 5 Years | 0 (0.0%) | 0 (0.0%) |
| 5 to 17 Years | 0 (0.0%) | 0 (0.0%) |
| 18 to 34 Years | 0 (0.0%) | 3 (4.0%) |
| 35 to 64 Years | 22 (19.8%) | 18 (21.2%) |
| 65 to 74 Years | 5 (5.5%) | 6 (10.2%) |
| 75 Years and over | 6 (50.0%) | 22 (91.7%) |
Disability Class by Sex by Age in Jane Lew
Disability Class: Hearing Difficulty
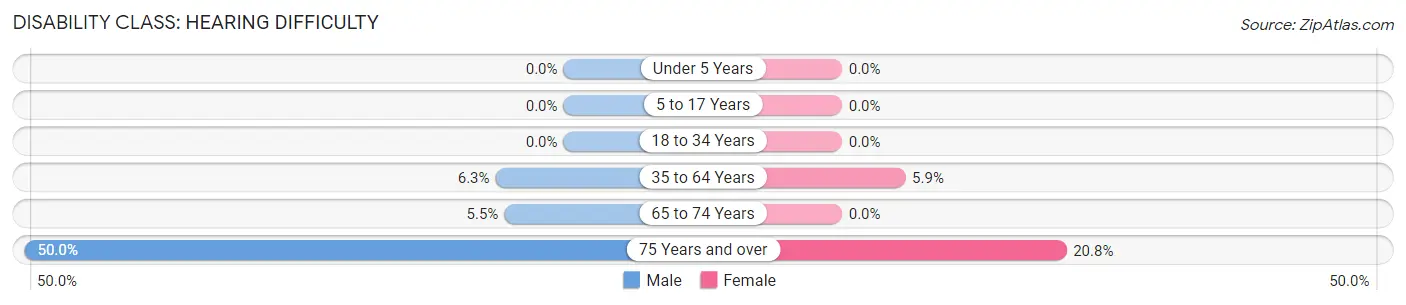
| Age Bracket | Male | Female |
| Under 5 Years | 0 (0.0%) | 0 (0.0%) |
| 5 to 17 Years | 0 (0.0%) | 0 (0.0%) |
| 18 to 34 Years | 0 (0.0%) | 0 (0.0%) |
| 35 to 64 Years | 7 (6.3%) | 5 (5.9%) |
| 65 to 74 Years | 5 (5.5%) | 0 (0.0%) |
| 75 Years and over | 6 (50.0%) | 5 (20.8%) |
Disability Class: Vision Difficulty
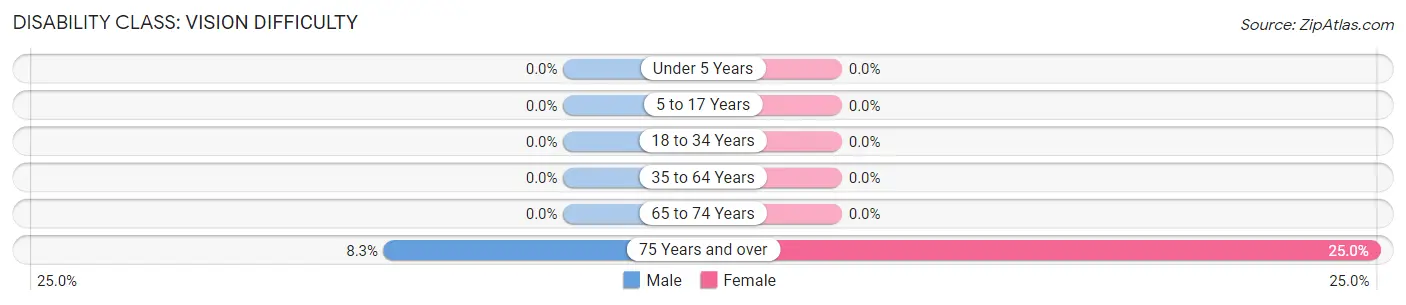
| Age Bracket | Male | Female |
| Under 5 Years | 0 (0.0%) | 0 (0.0%) |
| 5 to 17 Years | 0 (0.0%) | 0 (0.0%) |
| 18 to 34 Years | 0 (0.0%) | 0 (0.0%) |
| 35 to 64 Years | 0 (0.0%) | 0 (0.0%) |
| 65 to 74 Years | 0 (0.0%) | 0 (0.0%) |
| 75 Years and over | 1 (8.3%) | 6 (25.0%) |
Disability Class: Cognitive Difficulty
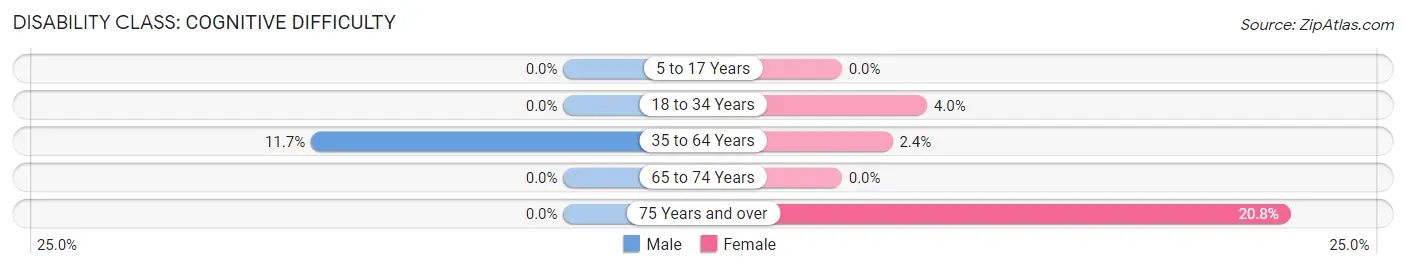
| Age Bracket | Male | Female |
| 5 to 17 Years | 0 (0.0%) | 0 (0.0%) |
| 18 to 34 Years | 0 (0.0%) | 3 (4.0%) |
| 35 to 64 Years | 13 (11.7%) | 2 (2.4%) |
| 65 to 74 Years | 0 (0.0%) | 0 (0.0%) |
| 75 Years and over | 0 (0.0%) | 5 (20.8%) |
Disability Class: Ambulatory Difficulty
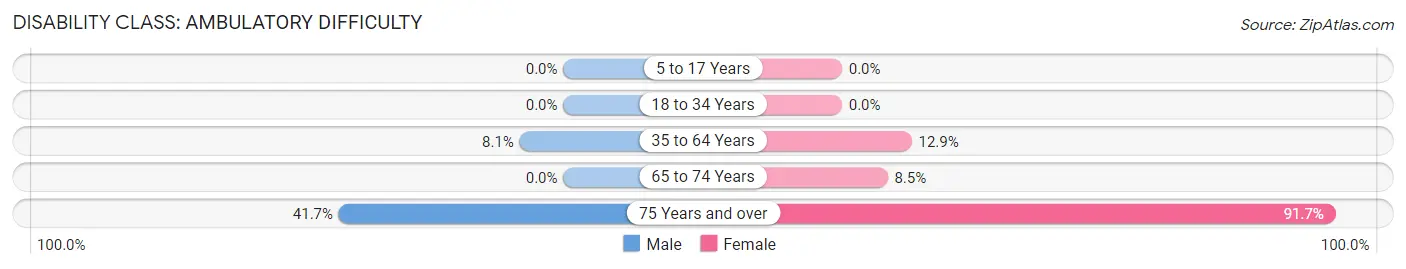
| Age Bracket | Male | Female |
| 5 to 17 Years | 0 (0.0%) | 0 (0.0%) |
| 18 to 34 Years | 0 (0.0%) | 0 (0.0%) |
| 35 to 64 Years | 9 (8.1%) | 11 (12.9%) |
| 65 to 74 Years | 0 (0.0%) | 5 (8.5%) |
| 75 Years and over | 5 (41.7%) | 22 (91.7%) |
Disability Class: Self-Care Difficulty
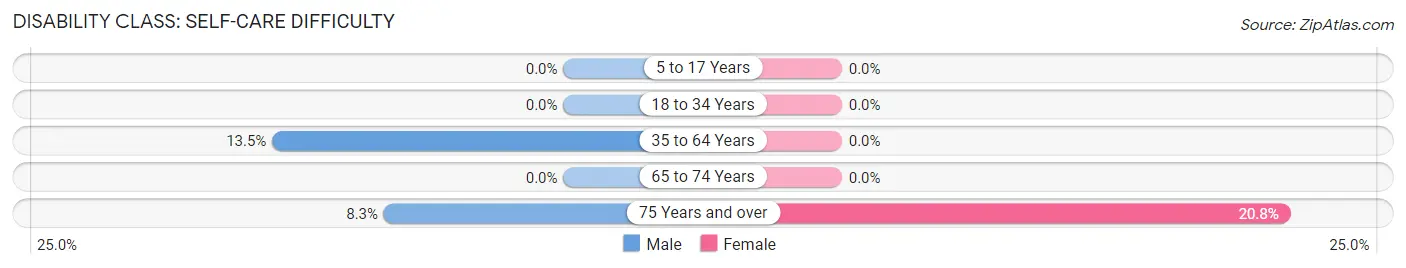
| Age Bracket | Male | Female |
| 5 to 17 Years | 0 (0.0%) | 0 (0.0%) |
| 18 to 34 Years | 0 (0.0%) | 0 (0.0%) |
| 35 to 64 Years | 15 (13.5%) | 0 (0.0%) |
| 65 to 74 Years | 0 (0.0%) | 0 (0.0%) |
| 75 Years and over | 1 (8.3%) | 5 (20.8%) |
Technology Access in Jane Lew
Computing Device Access in Jane Lew
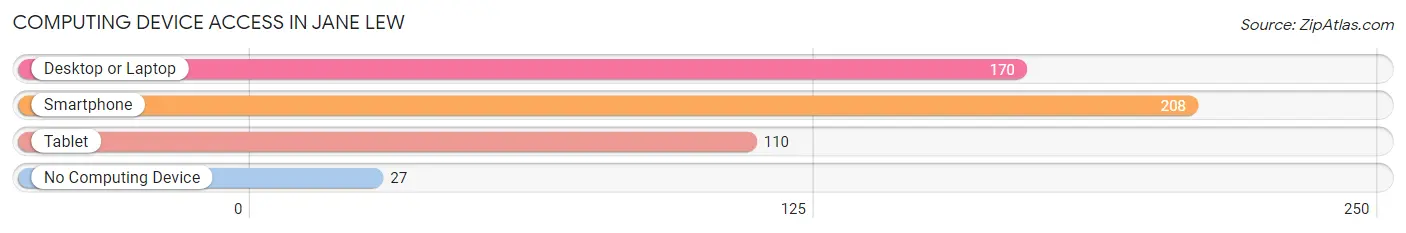
| Device Type | # Households | % Households |
| Desktop or Laptop | 170 | 67.7% |
| Smartphone | 208 | 82.9% |
| Tablet | 110 | 43.8% |
| No Computing Device | 27 | 10.8% |
| Total | 251 | 100.0% |
Internet Access in Jane Lew
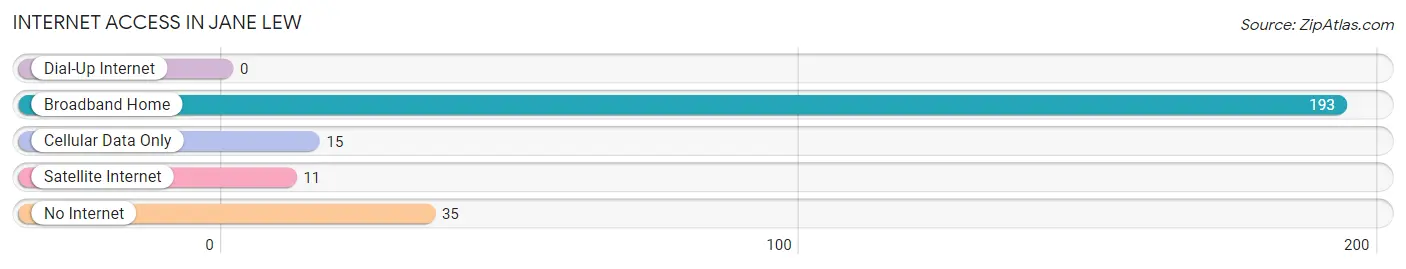
| Internet Type | # Households | % Households |
| Dial-Up Internet | 0 | 0.0% |
| Broadband Home | 193 | 76.9% |
| Cellular Data Only | 15 | 6.0% |
| Satellite Internet | 11 | 4.4% |
| No Internet | 35 | 13.9% |
| Total | 251 | 100.0% |
Jane Lew Summary
Located in Lewis County, West Virginia, Jane Lew is a small town with a population of just over 500 people. The town was founded in 1845 and named after Jane Lewis, the daughter of a local landowner. Jane Lew is located in the foothills of the Appalachian Mountains and is surrounded by rolling hills and lush forests.
Geography
Jane Lew is located in the Appalachian Mountains of West Virginia, in the foothills of the Allegheny Mountains. The town is situated in the Tygart Valley River Valley, which is a tributary of the Monongahela River. The town is located at an elevation of 1,400 feet and is surrounded by rolling hills and lush forests. The climate in Jane Lew is humid continental, with hot summers and cold winters.
Economy
The economy of Jane Lew is largely based on agriculture and tourism. The town is home to several small farms, which produce a variety of crops, including corn, soybeans, hay, and wheat. The town also has a few small businesses, including a gas station, a grocery store, and a few restaurants. Tourism is also an important part of the local economy, as the town is located near several popular outdoor recreation areas, including the Monongahela National Forest and the Tygart Valley River.
Demographics
As of the 2010 census, the population of Jane Lew was 517 people. The racial makeup of the town was 97.3% White, 0.6% African American, 0.2% Native American, 0.2% Asian, 0.2% from other races, and 1.5% from two or more races. The median household income in Jane Lew was $30,000, and the median family income was $35,000. The per capita income in Jane Lew was $14,000.
History
Jane Lew was founded in 1845 and named after Jane Lewis, the daughter of a local landowner. The town was originally a small farming community, but it began to grow in the late 19th century when the railroad was built through the area. The town was incorporated in 1891 and has remained relatively unchanged since then.
Today, Jane Lew is a small, rural town with a population of just over 500 people. The town is home to several small businesses and farms, and it is a popular destination for outdoor recreation. Despite its small size, Jane Lew has a rich history and a vibrant culture that make it a great place to live and visit.
Common Questions
What is the Total Population of Jane Lew?
Total Population of Jane Lew is 616.
What is the Total Male Population of Jane Lew?
Total Male Population of Jane Lew is 354.
What is the Total Female Population of Jane Lew?
Total Female Population of Jane Lew is 262.
What is the Ratio of Males per 100 Females in Jane Lew?
There are 135.11 Males per 100 Females in Jane Lew.
What is the Ratio of Females per 100 Males in Jane Lew?
There are 74.01 Females per 100 Males in Jane Lew.
What is the Median Population Age in Jane Lew?
Median Population Age in Jane Lew is 50.8 Years.
What is the Average Family Size in Jane Lew
Average Family Size in Jane Lew is 3.0 People.
What is the Average Household Size in Jane Lew
Average Household Size in Jane Lew is 2.5 People.
What is Per Capita Income in Jane Lew?
Per Capita income in Jane Lew is $27,852.
What is the Median Family Income in Jane Lew?
Median Family Income in Jane Lew is $52,021.
What is the Median Household income in Jane Lew?
Median Household Income in Jane Lew is $50,583.
What is Inequality or Gini Index in Jane Lew?
Inequality or Gini Index in Jane Lew is 0.44.
How Large is the Labor Force in Jane Lew?
There are 246 People in the Labor Forcein in Jane Lew.
What is the Percentage of People in the Labor Force in Jane Lew?
47.8% of People are in the Labor Force in Jane Lew.
What is the Unemployment Rate in Jane Lew?
Unemployment Rate in Jane Lew is 1.2%.