Moorefield, WV
Moorefield Map
Moorefield Overview
2,846
TOTAL POPULATION
1,598
MALE POPULATION
1,248
FEMALE POPULATION
128.04
MALES / 100 FEMALES
78.10
FEMALES / 100 MALES
43.6
MEDIAN AGE
2.7
AVG FAMILY SIZE
2.6
AVG HOUSEHOLD SIZE
$40,327
PER CAPITA INCOME
$59,966
AVG FAMILY INCOME
$51,985
AVG HOUSEHOLD INCOME
32.6%
WAGE / INCOME GAP [ % ]
67.4¢/ $1
WAGE / INCOME GAP [ $ ]
0.54
INEQUALITY / GINI INDEX
1,489
LABOR FORCE [ PEOPLE ]
58.5%
PERCENT IN LABOR FORCE
4.6%
UNEMPLOYMENT RATE
Moorefield Zip Codes
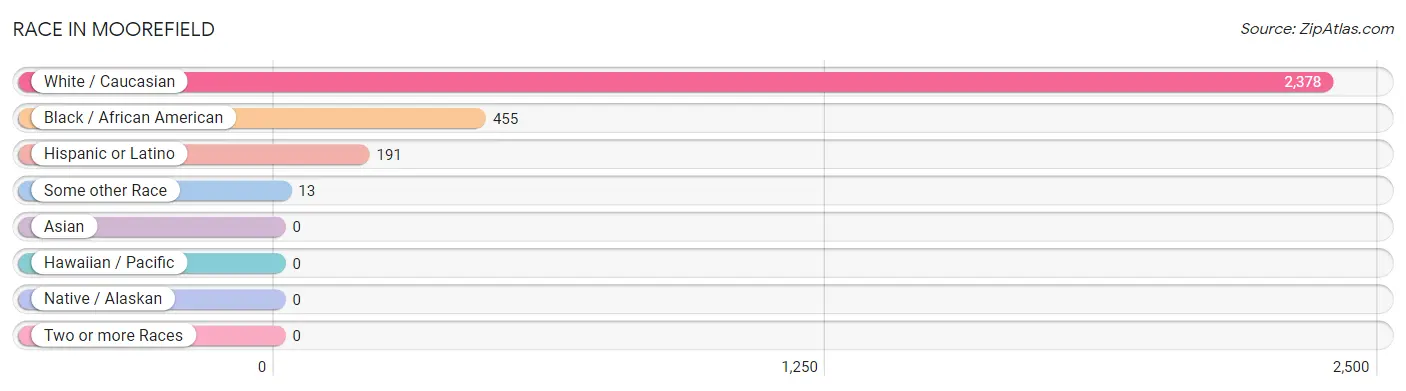
Race in Moorefield
The most populous races in Moorefield are White / Caucasian (2,378 | 83.6%), Black / African American (455 | 16.0%), and Hispanic or Latino (191 | 6.7%).
| Race | # Population | % Population |
| Asian | 0 | 0.0% |
| Black / African American | 455 | 16.0% |
| Hawaiian / Pacific | 0 | 0.0% |
| Hispanic or Latino | 191 | 6.7% |
| Native / Alaskan | 0 | 0.0% |
| White / Caucasian | 2,378 | 83.6% |
| Two or more Races | 0 | 0.0% |
| Some other Race | 13 | 0.5% |
| Total | 2,846 | 100.0% |
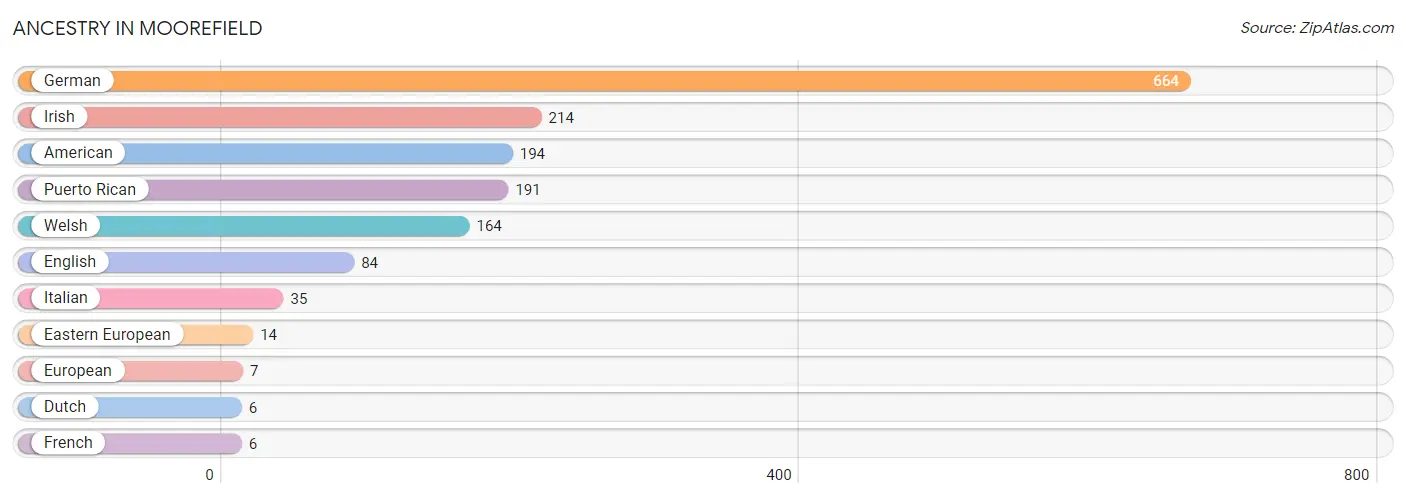
Ancestry in Moorefield
The most populous ancestries reported in Moorefield are German (664 | 23.3%), Irish (214 | 7.5%), American (194 | 6.8%), Puerto Rican (191 | 6.7%), and Welsh (164 | 5.8%), together accounting for 50.1% of all Moorefield residents.
| Ancestry | # Population | % Population |
| American | 194 | 6.8% |
| Dutch | 6 | 0.2% |
| Eastern European | 14 | 0.5% |
| English | 84 | 2.9% |
| European | 7 | 0.3% |
| French | 6 | 0.2% |
| German | 664 | 23.3% |
| Irish | 214 | 7.5% |
| Italian | 35 | 1.2% |
| Puerto Rican | 191 | 6.7% |
| Welsh | 164 | 5.8% | View All 11 Rows |
Immigrants in Moorefield

| Immigration Origin | # Population | % Population | View All 0 Rows |
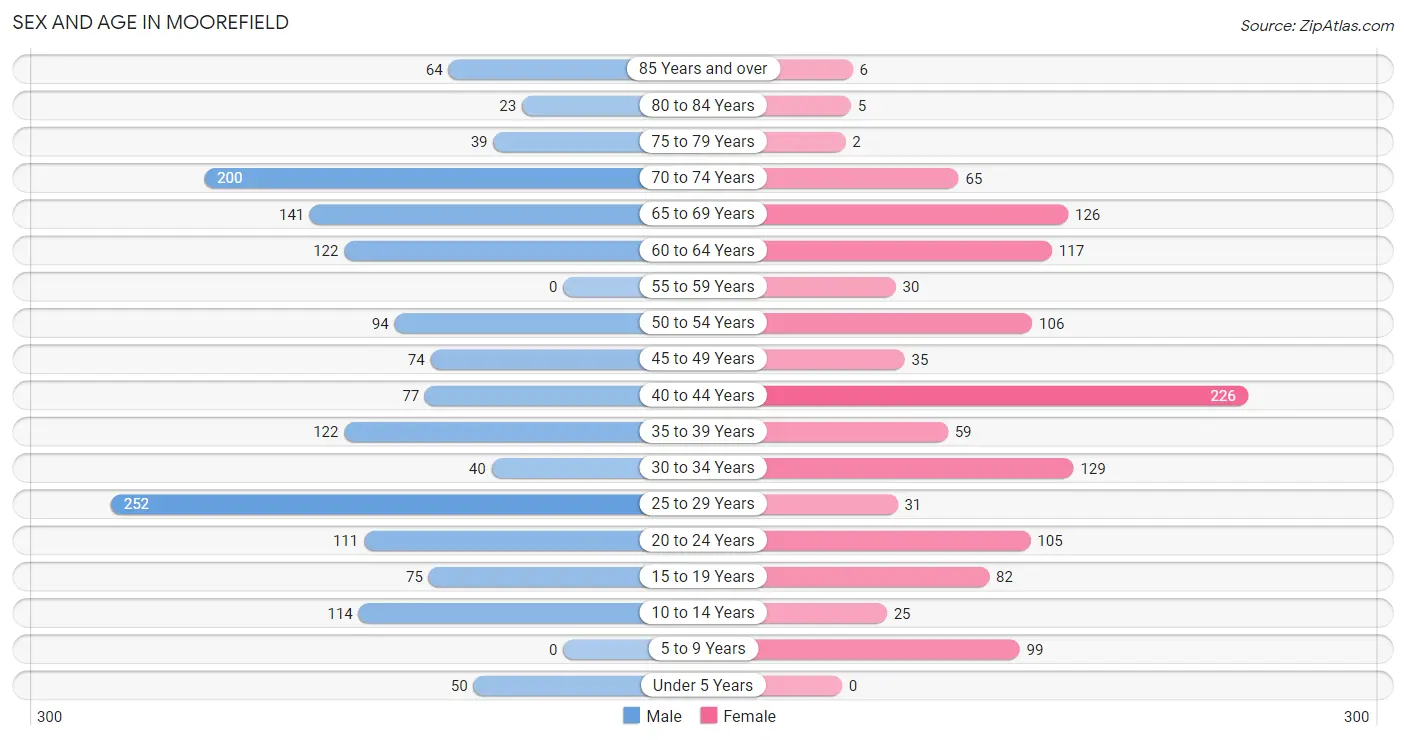
Sex and Age in Moorefield
Sex and Age in Moorefield
The most populous age groups in Moorefield are 25 to 29 Years (252 | 15.8%) for men and 40 to 44 Years (226 | 18.1%) for women.
| Age Bracket | Male | Female |
| Under 5 Years | 50 (3.1%) | 0 (0.0%) |
| 5 to 9 Years | 0 (0.0%) | 99 (7.9%) |
| 10 to 14 Years | 114 (7.1%) | 25 (2.0%) |
| 15 to 19 Years | 75 (4.7%) | 82 (6.6%) |
| 20 to 24 Years | 111 (7.0%) | 105 (8.4%) |
| 25 to 29 Years | 252 (15.8%) | 31 (2.5%) |
| 30 to 34 Years | 40 (2.5%) | 129 (10.3%) |
| 35 to 39 Years | 122 (7.6%) | 59 (4.7%) |
| 40 to 44 Years | 77 (4.8%) | 226 (18.1%) |
| 45 to 49 Years | 74 (4.6%) | 35 (2.8%) |
| 50 to 54 Years | 94 (5.9%) | 106 (8.5%) |
| 55 to 59 Years | 0 (0.0%) | 30 (2.4%) |
| 60 to 64 Years | 122 (7.6%) | 117 (9.4%) |
| 65 to 69 Years | 141 (8.8%) | 126 (10.1%) |
| 70 to 74 Years | 200 (12.5%) | 65 (5.2%) |
| 75 to 79 Years | 39 (2.4%) | 2 (0.2%) |
| 80 to 84 Years | 23 (1.4%) | 5 (0.4%) |
| 85 Years and over | 64 (4.0%) | 6 (0.5%) |
| Total | 1,598 (100.0%) | 1,248 (100.0%) |
Families and Households in Moorefield
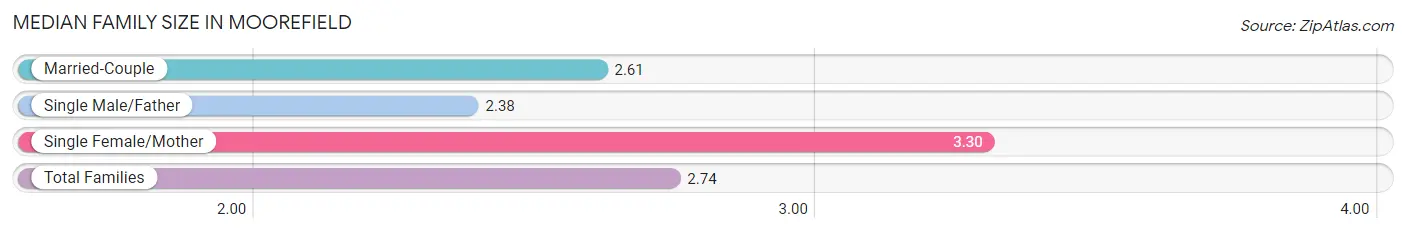
Median Family Size in Moorefield
The median family size in Moorefield is 2.74 persons per family, with single female/mother families (166 | 24.8%) accounting for the largest median family size of 3.3 persons per family. On the other hand, single male/father families (132 | 19.7%) represent the smallest median family size with 2.38 persons per family.
| Family Type | # Families | Family Size |
| Married-Couple | 371 (55.5%) | 2.61 |
| Single Male/Father | 132 (19.7%) | 2.38 |
| Single Female/Mother | 166 (24.8%) | 3.30 |
| Total Families | 669 (100.0%) | 2.74 |
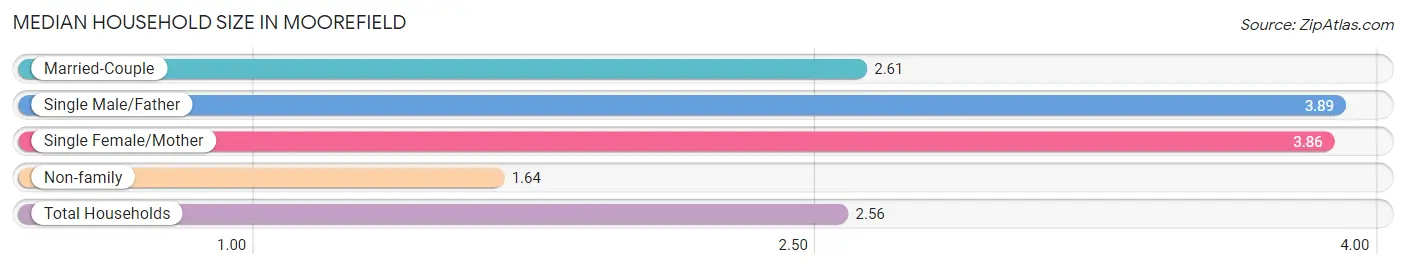
Median Household Size in Moorefield
The median household size in Moorefield is 2.56 persons per household, with single male/father households (132 | 11.9%) accounting for the largest median household size of 3.89 persons per household. non-family households (441 | 39.7%) represent the smallest median household size with 1.64 persons per household.
| Household Type | # Households | Household Size |
| Married-Couple | 371 (33.4%) | 2.61 |
| Single Male/Father | 132 (11.9%) | 3.89 |
| Single Female/Mother | 166 (14.9%) | 3.86 |
| Non-family | 441 (39.7%) | 1.64 |
| Total Households | 1,110 (100.0%) | 2.56 |
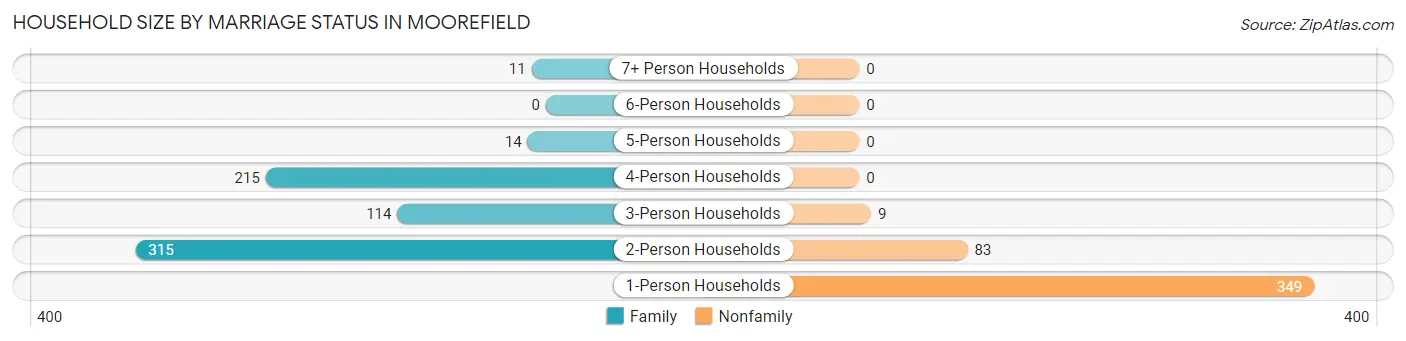
Household Size by Marriage Status in Moorefield
Out of a total of 1,110 households in Moorefield, 669 (60.3%) are family households, while 441 (39.7%) are nonfamily households. The most numerous type of family households are 2-person households, comprising 315, and the most common type of nonfamily households are 1-person households, comprising 349.
| Household Size | Family Households | Nonfamily Households |
| 1-Person Households | - | 349 (31.4%) |
| 2-Person Households | 315 (28.4%) | 83 (7.5%) |
| 3-Person Households | 114 (10.3%) | 9 (0.8%) |
| 4-Person Households | 215 (19.4%) | 0 (0.0%) |
| 5-Person Households | 14 (1.3%) | 0 (0.0%) |
| 6-Person Households | 0 (0.0%) | 0 (0.0%) |
| 7+ Person Households | 11 (1.0%) | 0 (0.0%) |
| Total | 669 (60.3%) | 441 (39.7%) |
Female Fertility in Moorefield
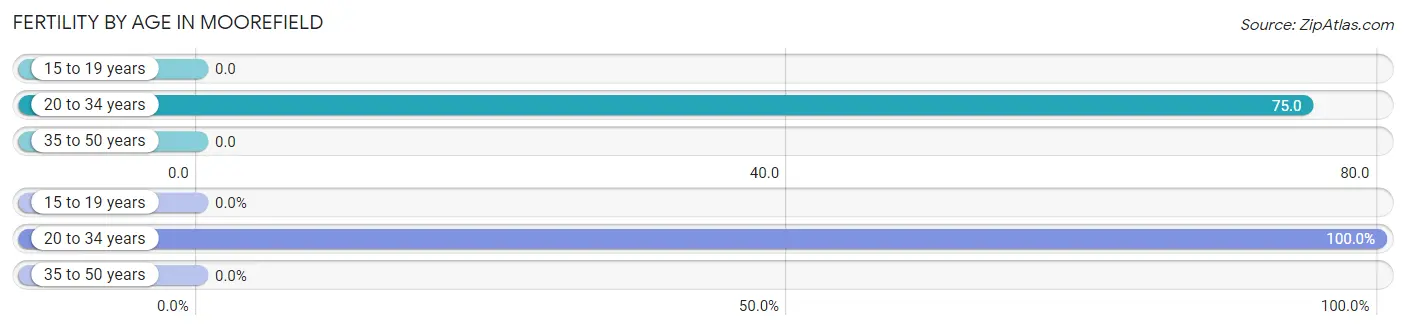
Fertility by Age in Moorefield
Average fertility rate in Moorefield is 30.0 births per 1,000 women. Women in the age bracket of 20 to 34 years have the highest fertility rate with 75.0 births per 1,000 women. Women in the age bracket of 20 to 34 years acount for 100.0% of all women with births.
| Age Bracket | Women with Births | Births / 1,000 Women |
| 15 to 19 years | 0 (0.0%) | 0.0 |
| 20 to 34 years | 20 (100.0%) | 75.0 |
| 35 to 50 years | 0 (0.0%) | 0.0 |
| Total | 20 (100.0%) | 30.0 |
Fertility by Age by Marriage Status in Moorefield
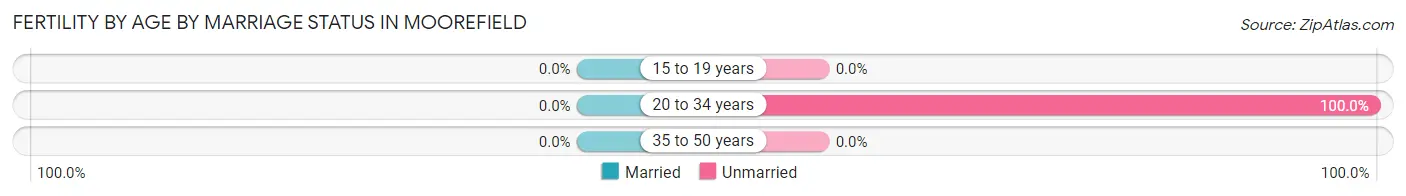
| Age Bracket | Married | Unmarried |
| 15 to 19 years | 0 (0.0%) | 0 (0.0%) |
| 20 to 34 years | 0 (0.0%) | 20 (100.0%) |
| 35 to 50 years | 0 (0.0%) | 0 (0.0%) |
| Total | 0 (0.0%) | 20 (100.0%) |
Fertility by Education in Moorefield
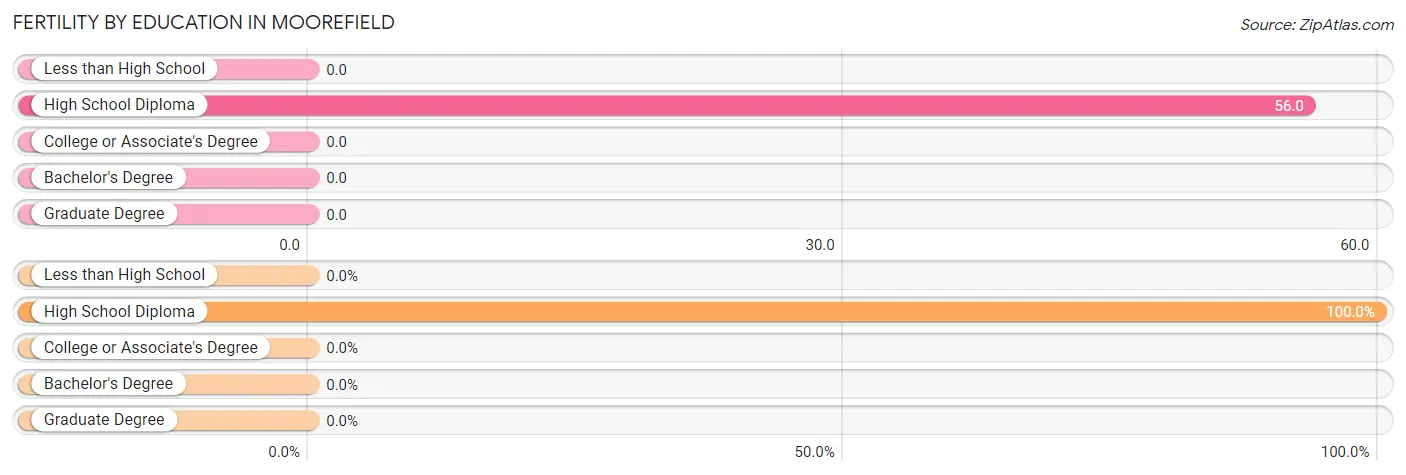
| Educational Attainment | Women with Births | Births / 1,000 Women |
| Less than High School | 0 (0.0%) | 0.0 |
| High School Diploma | 20 (100.0%) | 56.0 |
| College or Associate's Degree | 0 (0.0%) | 0.0 |
| Bachelor's Degree | 0 (0.0%) | 0.0 |
| Graduate Degree | 0 (0.0%) | 0.0 |
| Total | 20 (100.0%) | 30.0 |
Fertility by Education by Marriage Status in Moorefield
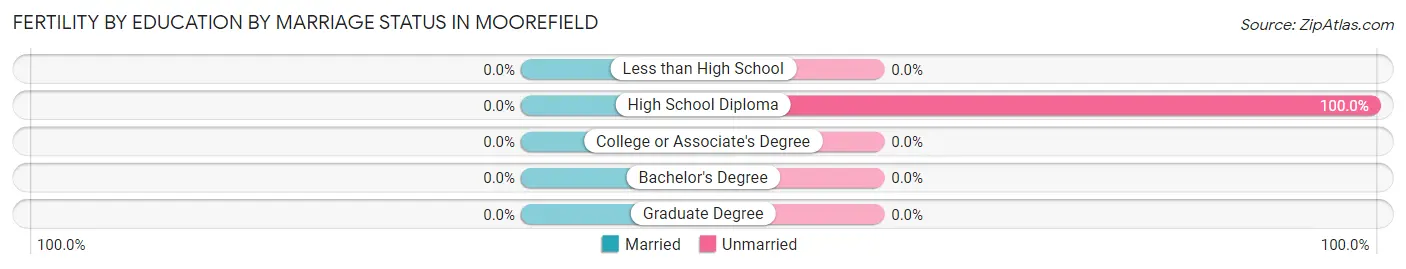
| Educational Attainment | Married | Unmarried |
| Less than High School | 0 (0.0%) | 0 (0.0%) |
| High School Diploma | 0 (0.0%) | 20 (100.0%) |
| College or Associate's Degree | 0 (0.0%) | 0 (0.0%) |
| Bachelor's Degree | 0 (0.0%) | 0 (0.0%) |
| Graduate Degree | 0 (0.0%) | 0 (0.0%) |
| Total | 0 (0.0%) | 20 (100.0%) |
Income in Moorefield
Income Overview in Moorefield
Per Capita Income in Moorefield is $40,327, while median incomes of families and households are $59,966 and $51,985 respectively.
| Characteristic | Number | Measure |
| Per Capita Income | 2,846 | $40,327 |
| Median Family Income | 669 | $59,966 |
| Mean Family Income | 669 | $118,157 |
| Median Household Income | 1,110 | $51,985 |
| Mean Household Income | 1,110 | $92,746 |
| Income Deficit | 669 | $0 |
| Wage / Income Gap (%) | 2,846 | 32.59% |
| Wage / Income Gap ($) | 2,846 | 67.41¢ per $1 |
| Gini / Inequality Index | 2,846 | 0.54 |
Earnings by Sex in Moorefield
Average Earnings in Moorefield are $24,185, $31,351 for men and $21,133 for women, a difference of 32.6%.
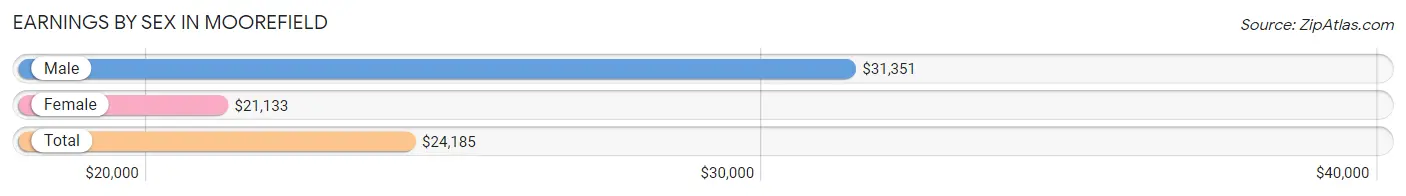
| Sex | Number | Average Earnings |
| Male | 884 (51.7%) | $31,351 |
| Female | 826 (48.3%) | $21,133 |
| Total | 1,710 (100.0%) | $24,185 |
Earnings by Sex by Income Bracket in Moorefield
The most common earnings brackets in Moorefield are $30,000 to $34,999 for men (197 | 22.3%) and $22,500 to $24,999 for women (151 | 18.3%).
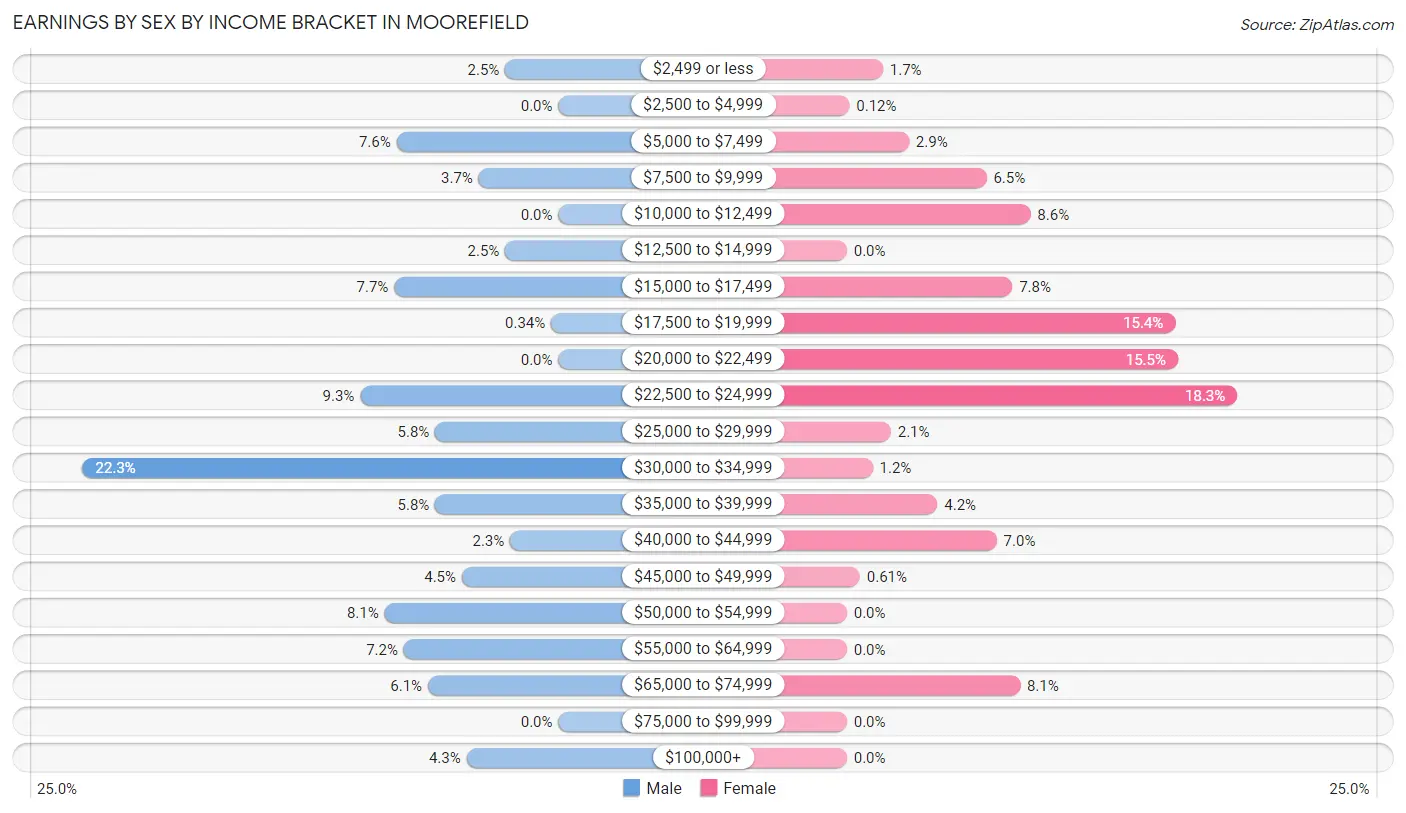
| Income | Male | Female |
| $2,499 or less | 22 (2.5%) | 14 (1.7%) |
| $2,500 to $4,999 | 0 (0.0%) | 1 (0.1%) |
| $5,000 to $7,499 | 67 (7.6%) | 24 (2.9%) |
| $7,500 to $9,999 | 33 (3.7%) | 54 (6.5%) |
| $10,000 to $12,499 | 0 (0.0%) | 71 (8.6%) |
| $12,500 to $14,999 | 22 (2.5%) | 0 (0.0%) |
| $15,000 to $17,499 | 68 (7.7%) | 64 (7.7%) |
| $17,500 to $19,999 | 3 (0.3%) | 127 (15.4%) |
| $20,000 to $22,499 | 0 (0.0%) | 128 (15.5%) |
| $22,500 to $24,999 | 82 (9.3%) | 151 (18.3%) |
| $25,000 to $29,999 | 51 (5.8%) | 17 (2.1%) |
| $30,000 to $34,999 | 197 (22.3%) | 10 (1.2%) |
| $35,000 to $39,999 | 51 (5.8%) | 35 (4.2%) |
| $40,000 to $44,999 | 20 (2.3%) | 58 (7.0%) |
| $45,000 to $49,999 | 40 (4.5%) | 5 (0.6%) |
| $50,000 to $54,999 | 72 (8.1%) | 0 (0.0%) |
| $55,000 to $64,999 | 64 (7.2%) | 0 (0.0%) |
| $65,000 to $74,999 | 54 (6.1%) | 67 (8.1%) |
| $75,000 to $99,999 | 0 (0.0%) | 0 (0.0%) |
| $100,000+ | 38 (4.3%) | 0 (0.0%) |
| Total | 884 (100.0%) | 826 (100.0%) |
Earnings by Sex by Educational Attainment in Moorefield
Average earnings in Moorefield are $33,261 for men and $21,719 for women, a difference of 34.7%. Men with an educational attainment of high school diploma enjoy the highest average annual earnings of $39,250, while those with college or associate's degree education earn the least with $32,059. Women with an educational attainment of high school diploma earn the most with the average annual earnings of $22,873, while those with college or associate's degree education have the smallest earnings of $19,947.
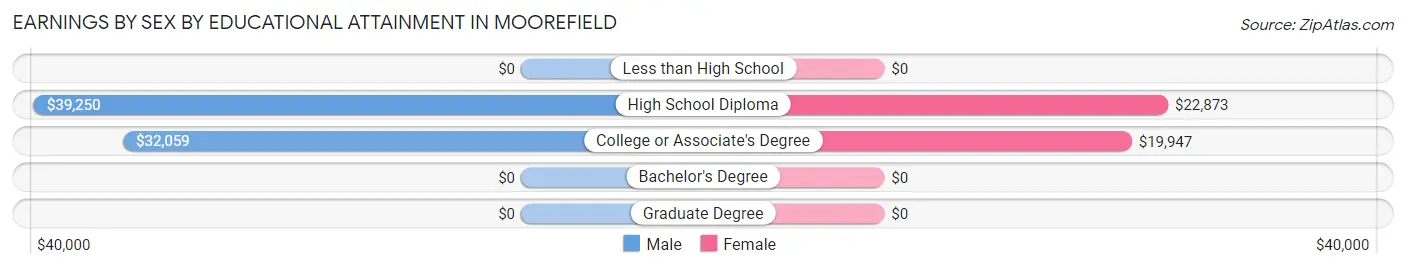
| Educational Attainment | Male Income | Female Income |
| Less than High School | - | - |
| High School Diploma | $39,250 | $22,873 |
| College or Associate's Degree | $32,059 | $19,947 |
| Bachelor's Degree | - | - |
| Graduate Degree | - | - |
| Total | $33,261 | $21,719 |
Family Income in Moorefield
Family Income Brackets in Moorefield
According to the Moorefield family income data, there are 147 families falling into the $35,000 to $49,999 income range, which is the most common income bracket and makes up 22.0% of all families.
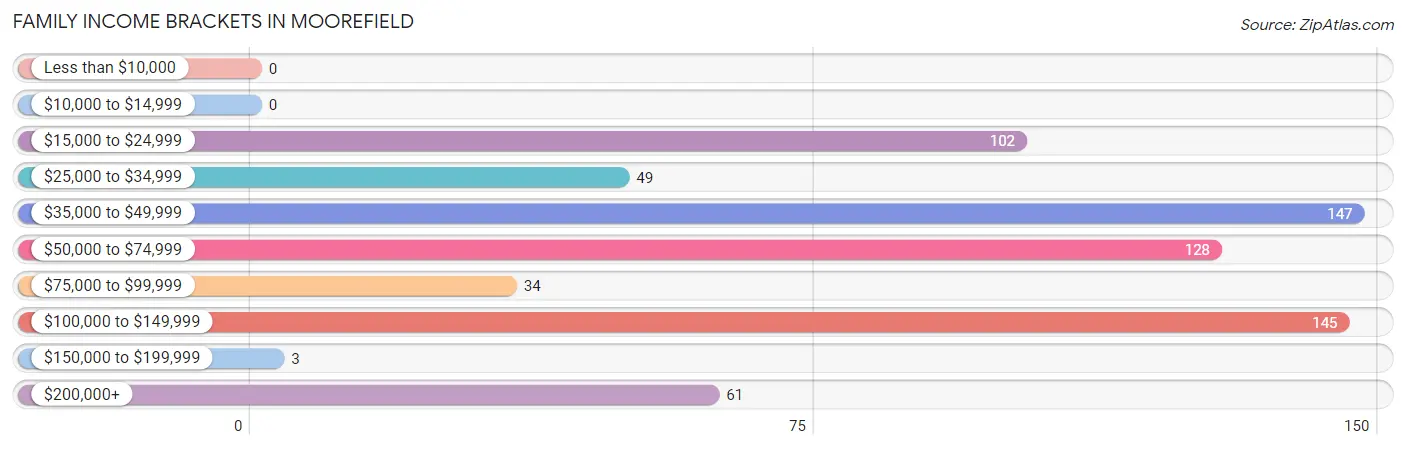
| Income Bracket | # Families | % Families |
| Less than $10,000 | 0 | 0.0% |
| $10,000 to $14,999 | 0 | 0.0% |
| $15,000 to $24,999 | 102 | 15.2% |
| $25,000 to $34,999 | 49 | 7.3% |
| $35,000 to $49,999 | 147 | 22.0% |
| $50,000 to $74,999 | 128 | 19.1% |
| $75,000 to $99,999 | 34 | 5.1% |
| $100,000 to $149,999 | 145 | 21.7% |
| $150,000 to $199,999 | 3 | 0.4% |
| $200,000+ | 61 | 9.1% |
Family Income by Famaliy Size in Moorefield
2-person families (364 | 54.4%) account for the highest median family income in Moorefield with $68,214 per family, while 2-person families (364 | 54.4%) have the highest median income of $34,107 per family member.
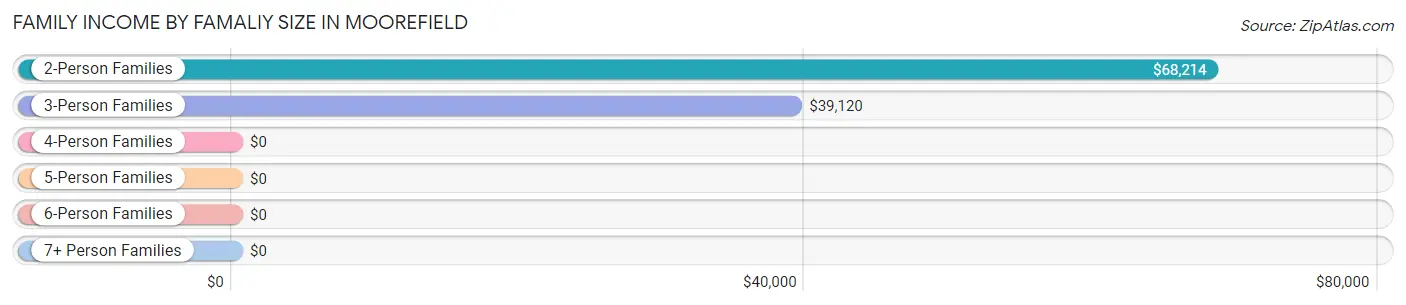
| Income Bracket | # Families | Median Income |
| 2-Person Families | 364 (54.4%) | $68,214 |
| 3-Person Families | 229 (34.2%) | $39,120 |
| 4-Person Families | 51 (7.6%) | $0 |
| 5-Person Families | 14 (2.1%) | $0 |
| 6-Person Families | 0 (0.0%) | $0 |
| 7+ Person Families | 11 (1.6%) | $0 |
| Total | 669 (100.0%) | $59,966 |
Family Income by Number of Earners in Moorefield
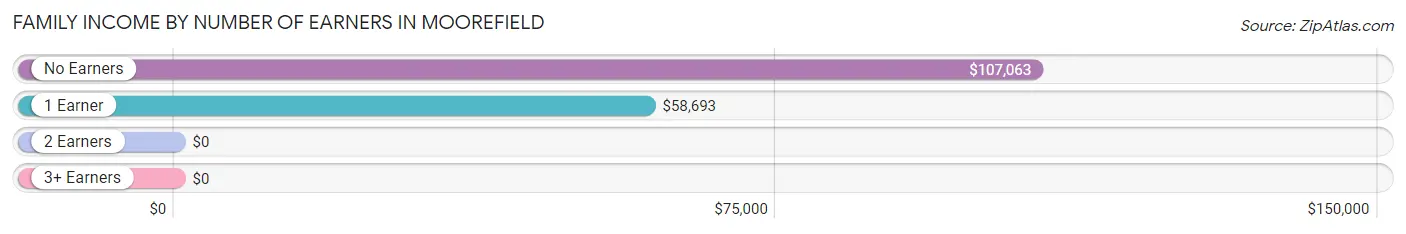
| Number of Earners | # Families | Median Income |
| No Earners | 47 (7.0%) | $107,063 |
| 1 Earner | 363 (54.3%) | $58,693 |
| 2 Earners | 244 (36.5%) | $0 |
| 3+ Earners | 15 (2.2%) | $0 |
| Total | 669 (100.0%) | $59,966 |
Household Income in Moorefield
Household Income Brackets in Moorefield
With 215 households falling in the category, the $35,000 to $49,999 income range is the most frequent in Moorefield, accounting for 19.4% of all households. In contrast, only 3 households (0.3%) fall into the $150,000 to $199,999 income bracket, making it the least populous group.
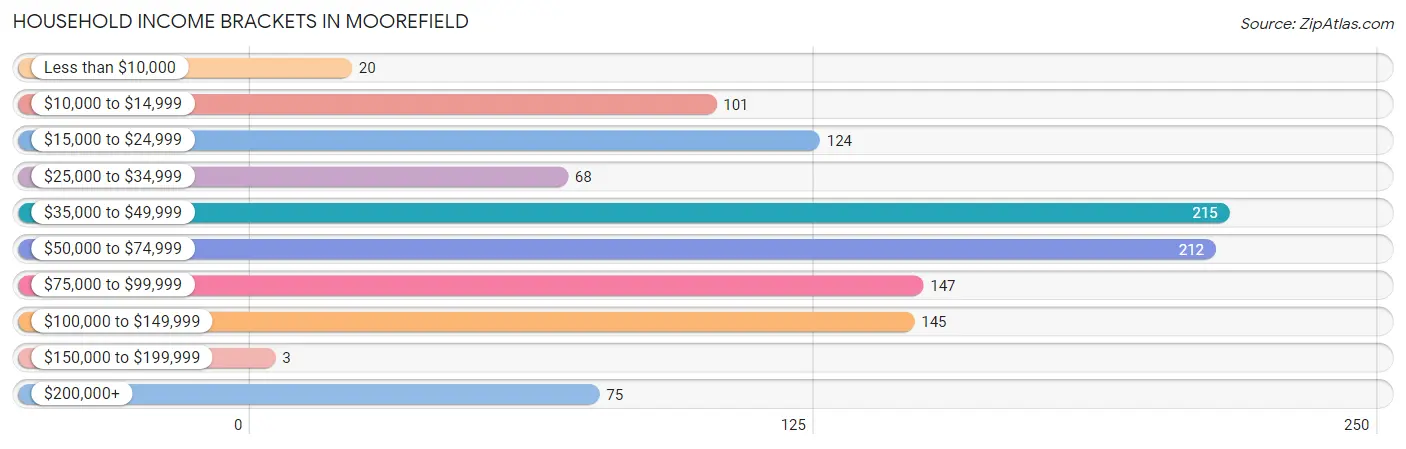
| Income Bracket | # Households | % Households |
| Less than $10,000 | 20 | 1.8% |
| $10,000 to $14,999 | 101 | 9.1% |
| $15,000 to $24,999 | 124 | 11.2% |
| $25,000 to $34,999 | 68 | 6.1% |
| $35,000 to $49,999 | 215 | 19.4% |
| $50,000 to $74,999 | 212 | 19.1% |
| $75,000 to $99,999 | 147 | 13.2% |
| $100,000 to $149,999 | 145 | 13.1% |
| $150,000 to $199,999 | 3 | 0.3% |
| $200,000+ | 75 | 6.8% |
Household Income by Householder Age in Moorefield
The median household income in Moorefield is $51,985, with the highest median household income of $66,638 found in the 65+ years age bracket for the primary householder. A total of 390 households (35.1%) fall into this category. Meanwhile, the 45 to 64 years age bracket for the primary householder has the lowest median household income of $44,500, with 396 households (35.7%) in this group.
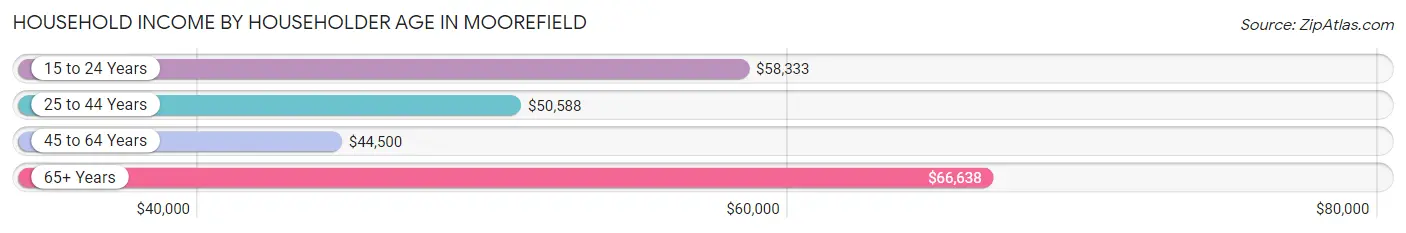
| Income Bracket | # Households | Median Income |
| 15 to 24 Years | 36 (3.2%) | $58,333 |
| 25 to 44 Years | 288 (26.0%) | $50,588 |
| 45 to 64 Years | 396 (35.7%) | $44,500 |
| 65+ Years | 390 (35.1%) | $66,638 |
| Total | 1,110 (100.0%) | $51,985 |
Poverty in Moorefield
Income Below Poverty by Sex and Age in Moorefield
With 14.1% poverty level for males and 15.2% for females among the residents of Moorefield, 12 to 14 year old males and 16 and 17 year old females are the most vulnerable to poverty, with 66 males (67.3%) and 67 females (81.7%) in their respective age groups living below the poverty level.
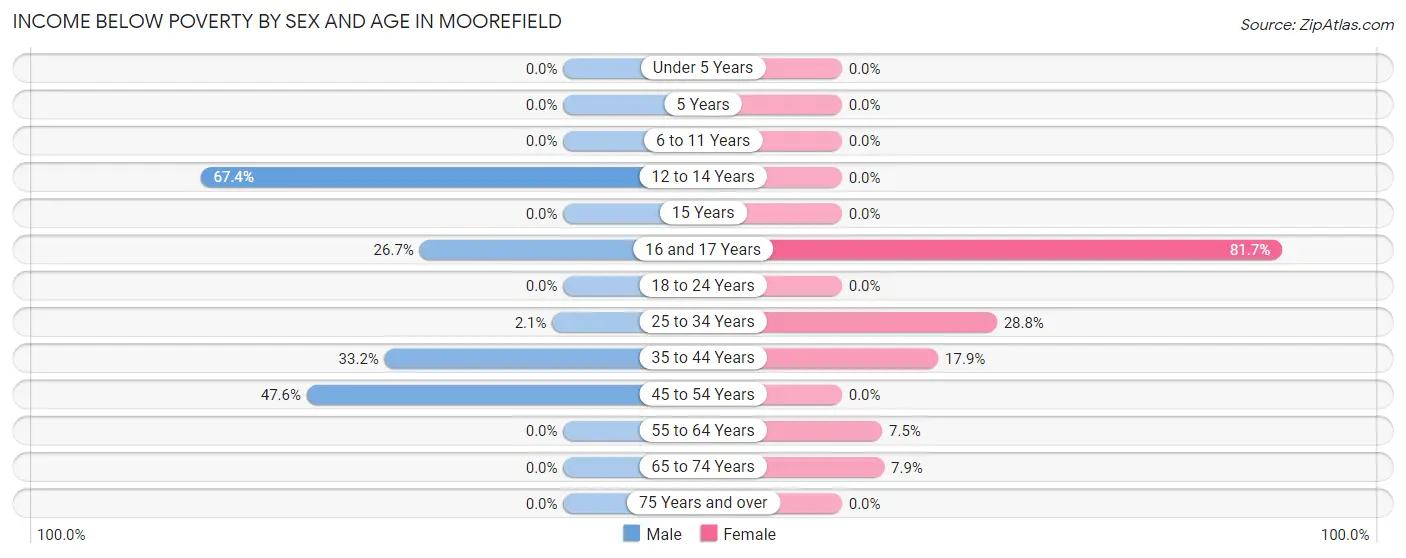
| Age Bracket | Male | Female |
| Under 5 Years | 0 (0.0%) | 0 (0.0%) |
| 5 Years | 0 (0.0%) | 0 (0.0%) |
| 6 to 11 Years | 0 (0.0%) | 0 (0.0%) |
| 12 to 14 Years | 66 (67.3%) | 0 (0.0%) |
| 15 Years | 0 (0.0%) | 0 (0.0%) |
| 16 and 17 Years | 8 (26.7%) | 67 (81.7%) |
| 18 to 24 Years | 0 (0.0%) | 0 (0.0%) |
| 25 to 34 Years | 6 (2.1%) | 46 (28.7%) |
| 35 to 44 Years | 66 (33.2%) | 51 (17.9%) |
| 45 to 54 Years | 80 (47.6%) | 0 (0.0%) |
| 55 to 64 Years | 0 (0.0%) | 11 (7.5%) |
| 65 to 74 Years | 0 (0.0%) | 15 (7.9%) |
| 75 Years and over | 0 (0.0%) | 0 (0.0%) |
| Total | 226 (14.1%) | 190 (15.2%) |
Income Above Poverty by Sex and Age in Moorefield
According to the poverty statistics in Moorefield, males aged under 5 years and females aged 5 years are the age groups that are most secure financially, with 100.0% of males and 100.0% of females in these age groups living above the poverty line.
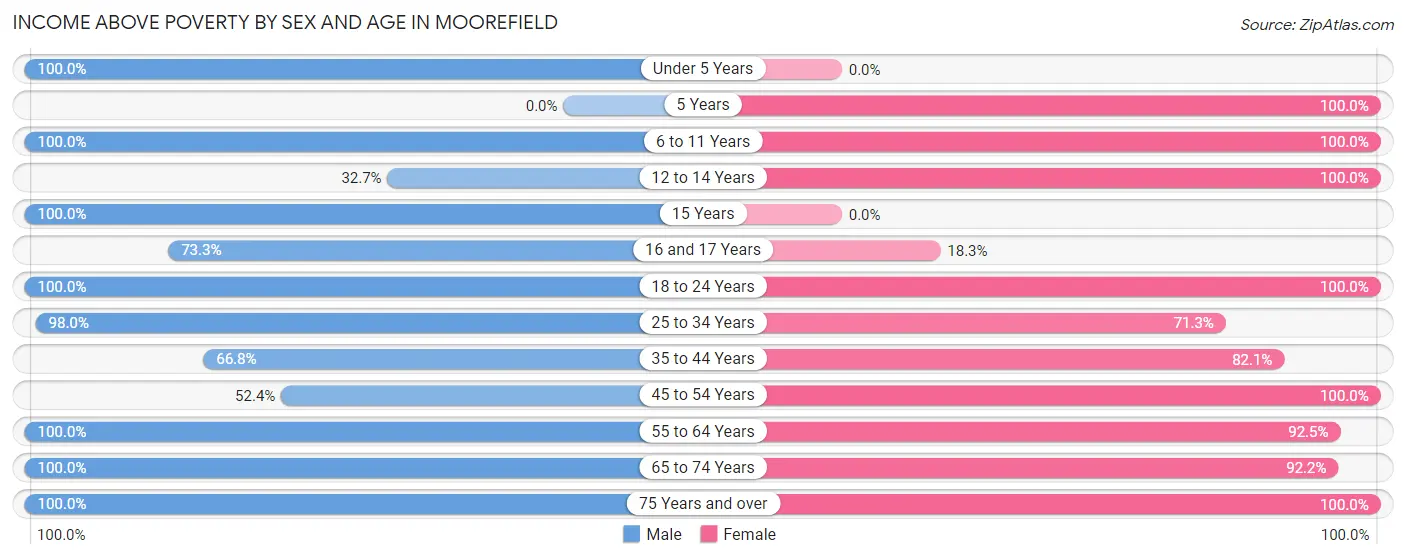
| Age Bracket | Male | Female |
| Under 5 Years | 50 (100.0%) | 0 (0.0%) |
| 5 Years | 0 (0.0%) | 14 (100.0%) |
| 6 to 11 Years | 16 (100.0%) | 96 (100.0%) |
| 12 to 14 Years | 32 (32.7%) | 14 (100.0%) |
| 15 Years | 12 (100.0%) | 0 (0.0%) |
| 16 and 17 Years | 22 (73.3%) | 15 (18.3%) |
| 18 to 24 Years | 144 (100.0%) | 105 (100.0%) |
| 25 to 34 Years | 286 (98.0%) | 114 (71.3%) |
| 35 to 44 Years | 133 (66.8%) | 234 (82.1%) |
| 45 to 54 Years | 88 (52.4%) | 141 (100.0%) |
| 55 to 64 Years | 122 (100.0%) | 136 (92.5%) |
| 65 to 74 Years | 341 (100.0%) | 176 (92.1%) |
| 75 Years and over | 126 (100.0%) | 13 (100.0%) |
| Total | 1,372 (85.9%) | 1,058 (84.8%) |
Income Below Poverty Among Married-Couple Families in Moorefield
| Children | Above Poverty | Below Poverty |
| No Children | 320 (100.0%) | 0 (0.0%) |
| 1 or 2 Children | 40 (100.0%) | 0 (0.0%) |
| 3 or 4 Children | 11 (100.0%) | 0 (0.0%) |
| 5 or more Children | 0 (0.0%) | 0 (0.0%) |
| Total | 371 (100.0%) | 0 (0.0%) |
Income Below Poverty Among Single-Parent Households in Moorefield
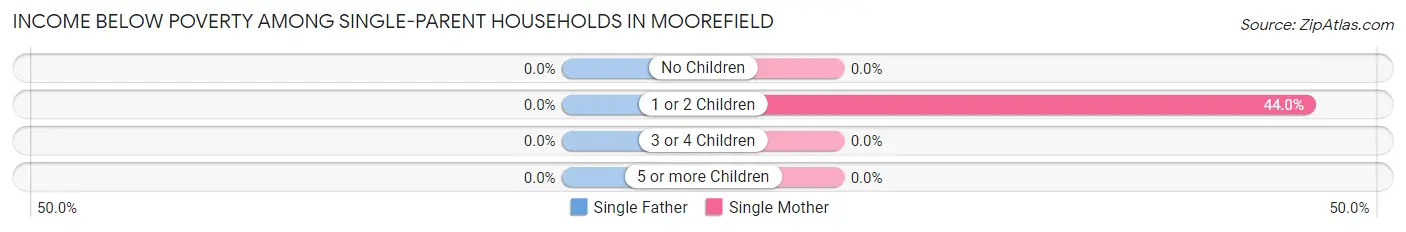
| Children | Single Father | Single Mother |
| No Children | 0 (0.0%) | 0 (0.0%) |
| 1 or 2 Children | 0 (0.0%) | 51 (44.0%) |
| 3 or 4 Children | 0 (0.0%) | 0 (0.0%) |
| 5 or more Children | 0 (0.0%) | 0 (0.0%) |
| Total | 0 (0.0%) | 51 (30.7%) |
Income Below Poverty Among Married-Couple vs Single-Parent Households in Moorefield
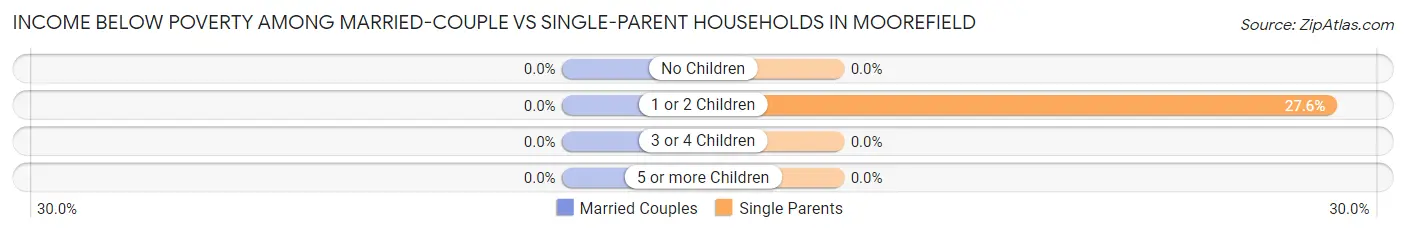
| Children | Married-Couple Families | Single-Parent Households |
| No Children | 0 (0.0%) | 0 (0.0%) |
| 1 or 2 Children | 0 (0.0%) | 51 (27.6%) |
| 3 or 4 Children | 0 (0.0%) | 0 (0.0%) |
| 5 or more Children | 0 (0.0%) | 0 (0.0%) |
| Total | 0 (0.0%) | 51 (17.1%) |
Employment Characteristics in Moorefield
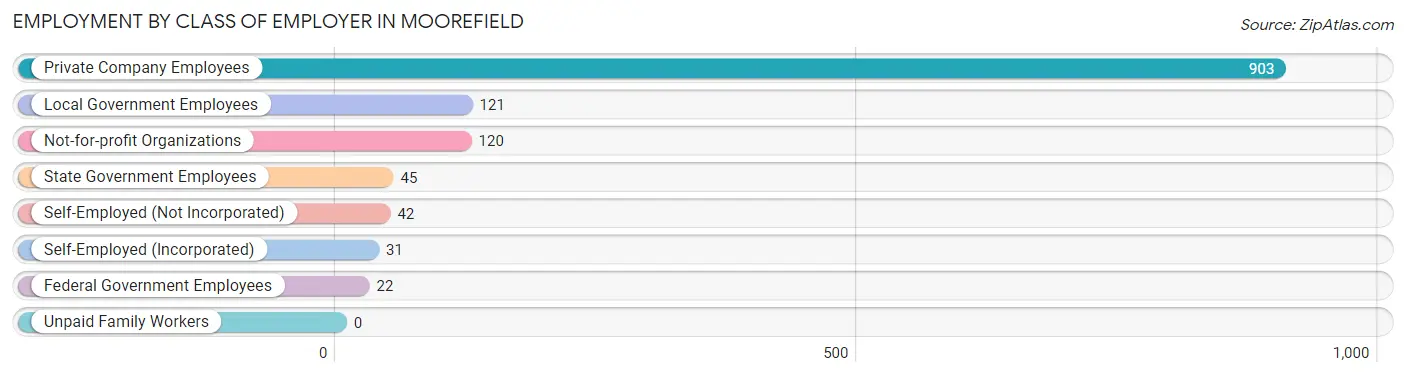
Employment by Class of Employer in Moorefield
Among the 1,284 employed individuals in Moorefield, private company employees (903 | 70.3%), local government employees (121 | 9.4%), and not-for-profit organizations (120 | 9.3%) make up the most common classes of employment.
| Employer Class | # Employees | % Employees |
| Private Company Employees | 903 | 70.3% |
| Self-Employed (Incorporated) | 31 | 2.4% |
| Self-Employed (Not Incorporated) | 42 | 3.3% |
| Not-for-profit Organizations | 120 | 9.3% |
| Local Government Employees | 121 | 9.4% |
| State Government Employees | 45 | 3.5% |
| Federal Government Employees | 22 | 1.7% |
| Unpaid Family Workers | 0 | 0.0% |
| Total | 1,284 | 100.0% |
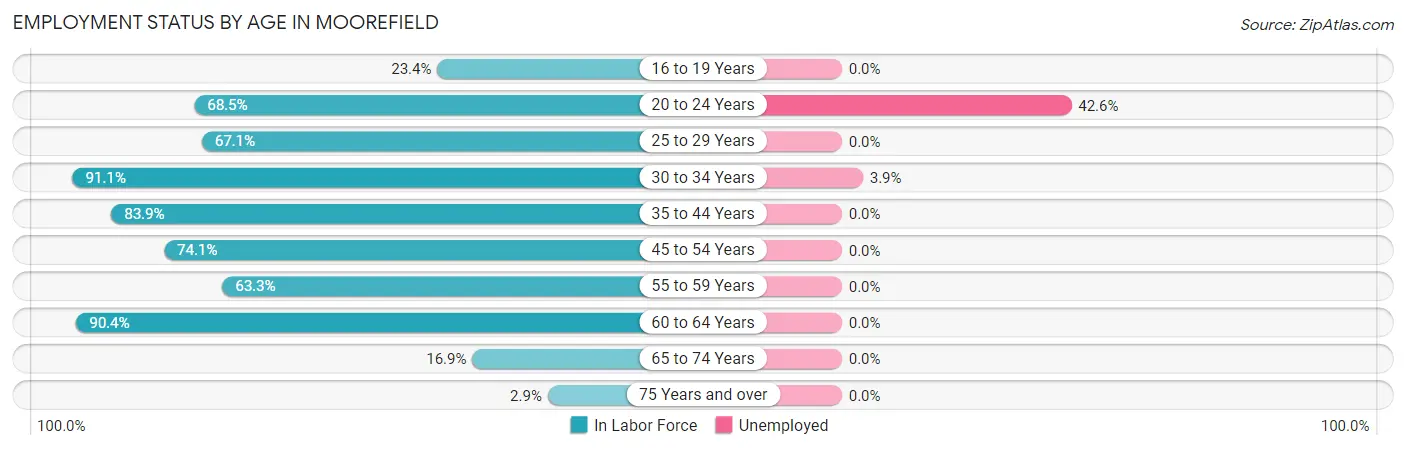
Employment Status by Age in Moorefield
According to the labor force statistics for Moorefield, out of the total population over 16 years of age (2,546), 58.5% or 1,489 individuals are in the labor force, with 4.6% or 68 of them unemployed. The age group with the highest labor force participation rate is 30 to 34 years, with 91.1% or 154 individuals in the labor force. Within the labor force, the 20 to 24 years age range has the highest percentage of unemployed individuals, with 42.6% or 63 of them being unemployed.
| Age Bracket | In Labor Force | Unemployed |
| 16 to 19 Years | 34 (23.4%) | 0 (0.0%) |
| 20 to 24 Years | 148 (68.5%) | 63 (42.6%) |
| 25 to 29 Years | 190 (67.1%) | 0 (0.0%) |
| 30 to 34 Years | 154 (91.1%) | 6 (3.9%) |
| 35 to 44 Years | 406 (83.9%) | 0 (0.0%) |
| 45 to 54 Years | 229 (74.1%) | 0 (0.0%) |
| 55 to 59 Years | 19 (63.3%) | 0 (0.0%) |
| 60 to 64 Years | 216 (90.4%) | 0 (0.0%) |
| 65 to 74 Years | 90 (16.9%) | 0 (0.0%) |
| 75 Years and over | 4 (2.9%) | 0 (0.0%) |
| Total | 1,489 (58.5%) | 68 (4.6%) |
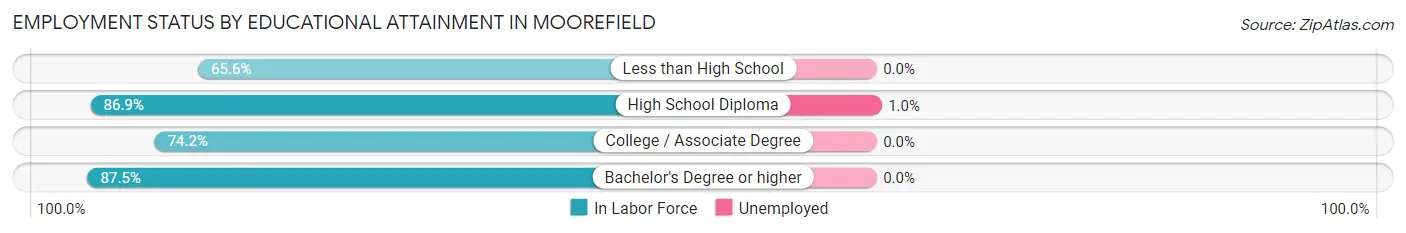
Employment Status by Educational Attainment in Moorefield
According to labor force statistics for Moorefield, 80.2% of individuals (1,214) out of the total population between 25 and 64 years of age (1,514) are in the labor force, with 0.5% or 6 of them being unemployed. The group with the highest labor force participation rate are those with the educational attainment of bachelor's degree or higher, with 87.5% or 77 individuals in the labor force. Within the labor force, individuals with high school diploma education have the highest percentage of unemployment, with 1.0% or 6 of them being unemployed.
| Educational Attainment | In Labor Force | Unemployed |
| Less than High School | 86 (65.6%) | 0 (0.0%) |
| High School Diploma | 617 (86.9%) | 7 (1.0%) |
| College / Associate Degree | 434 (74.2%) | 0 (0.0%) |
| Bachelor's Degree or higher | 77 (87.5%) | 0 (0.0%) |
| Total | 1,214 (80.2%) | 8 (0.5%) |
Employment Occupations by Sex in Moorefield
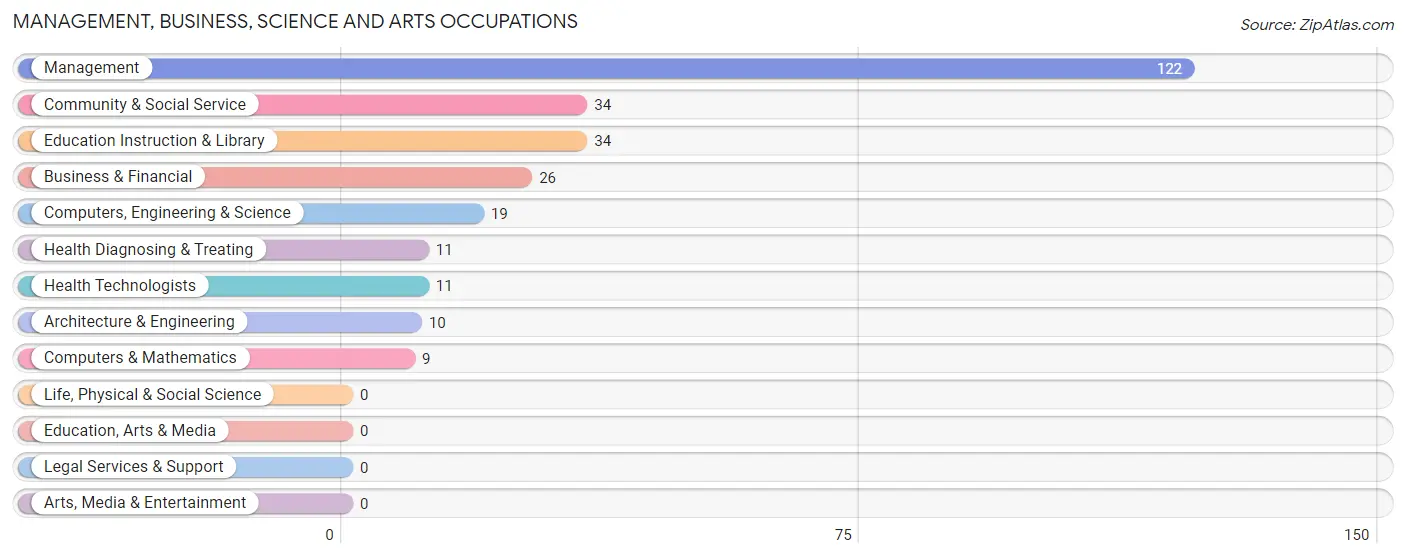
Management, Business, Science and Arts Occupations
The most common Management, Business, Science and Arts occupations in Moorefield are Management (122 | 8.6%), Community & Social Service (34 | 2.4%), Education Instruction & Library (34 | 2.4%), Business & Financial (26 | 1.8%), and Computers, Engineering & Science (19 | 1.3%).
Management, Business, Science and Arts Occupations by Sex
Within the Management, Business, Science and Arts occupations in Moorefield, the most male-oriented occupations are Business & Financial (100.0%), Computers, Engineering & Science (100.0%), and Computers & Mathematics (100.0%), while the most female-oriented occupations are Community & Social Service (100.0%), Education Instruction & Library (100.0%), and Health Diagnosing & Treating (100.0%).
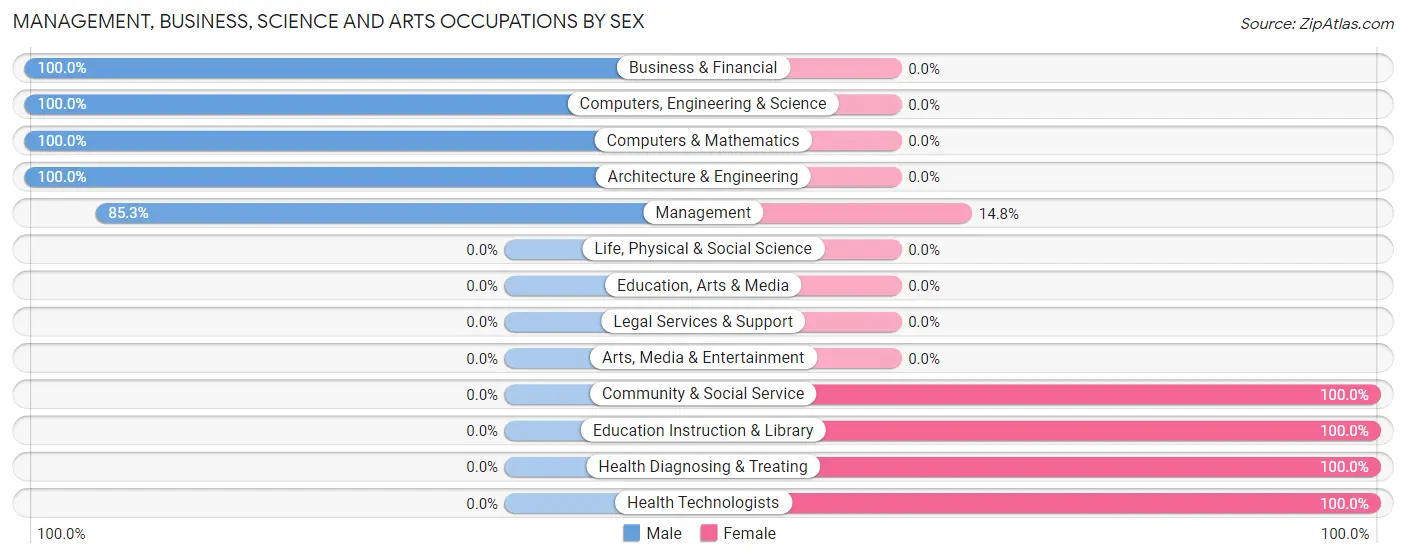
| Occupation | Male | Female |
| Management | 104 (85.3%) | 18 (14.7%) |
| Business & Financial | 26 (100.0%) | 0 (0.0%) |
| Computers, Engineering & Science | 19 (100.0%) | 0 (0.0%) |
| Computers & Mathematics | 9 (100.0%) | 0 (0.0%) |
| Architecture & Engineering | 10 (100.0%) | 0 (0.0%) |
| Life, Physical & Social Science | 0 (0.0%) | 0 (0.0%) |
| Community & Social Service | 0 (0.0%) | 34 (100.0%) |
| Education, Arts & Media | 0 (0.0%) | 0 (0.0%) |
| Legal Services & Support | 0 (0.0%) | 0 (0.0%) |
| Education Instruction & Library | 0 (0.0%) | 34 (100.0%) |
| Arts, Media & Entertainment | 0 (0.0%) | 0 (0.0%) |
| Health Diagnosing & Treating | 0 (0.0%) | 11 (100.0%) |
| Health Technologists | 0 (0.0%) | 11 (100.0%) |
| Total (Category) | 149 (70.3%) | 63 (29.7%) |
| Total (Overall) | 709 (49.9%) | 712 (50.1%) |
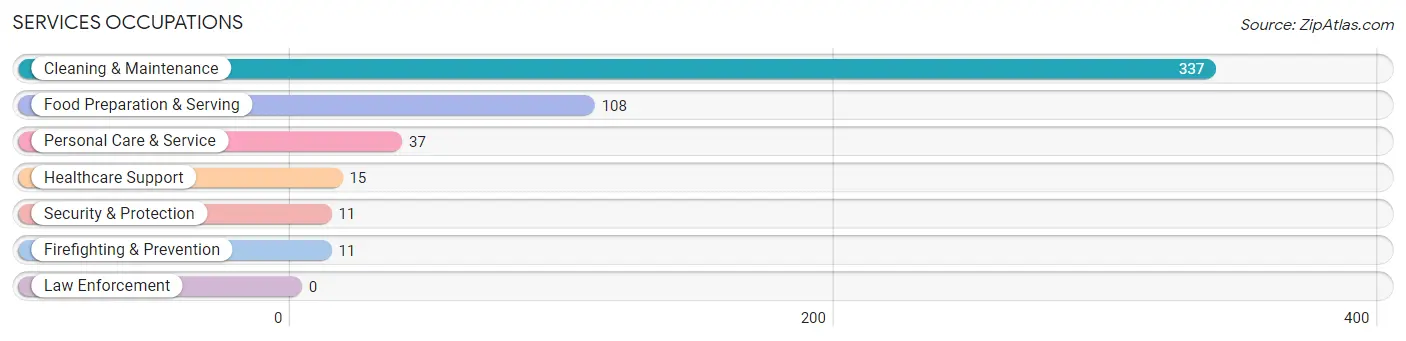
Services Occupations
The most common Services occupations in Moorefield are Cleaning & Maintenance (337 | 23.7%), Food Preparation & Serving (108 | 7.6%), Personal Care & Service (37 | 2.6%), Healthcare Support (15 | 1.1%), and Security & Protection (11 | 0.8%).
Services Occupations by Sex
Within the Services occupations in Moorefield, the most male-oriented occupations are Security & Protection (100.0%), Firefighting & Prevention (100.0%), and Cleaning & Maintenance (82.8%), while the most female-oriented occupations are Healthcare Support (100.0%), Personal Care & Service (100.0%), and Food Preparation & Serving (66.7%).
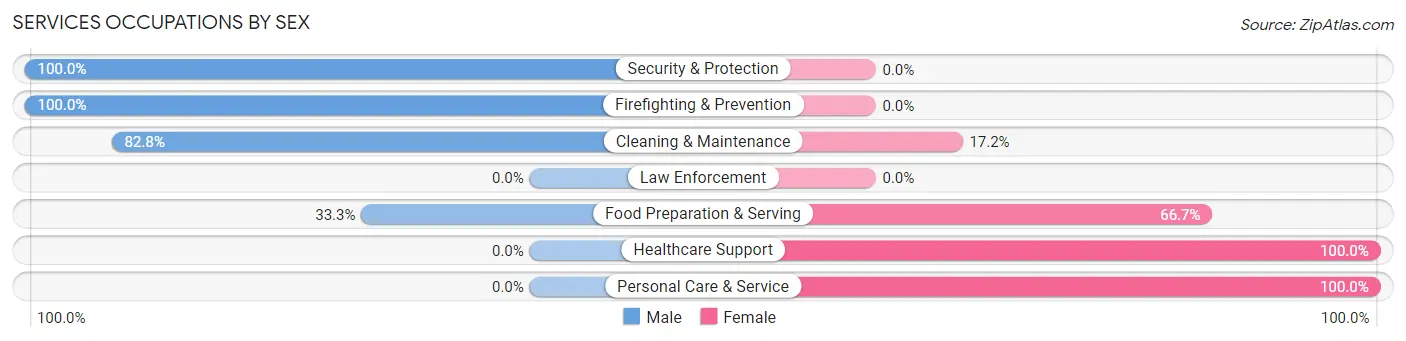
| Occupation | Male | Female |
| Healthcare Support | 0 (0.0%) | 15 (100.0%) |
| Security & Protection | 11 (100.0%) | 0 (0.0%) |
| Firefighting & Prevention | 11 (100.0%) | 0 (0.0%) |
| Law Enforcement | 0 (0.0%) | 0 (0.0%) |
| Food Preparation & Serving | 36 (33.3%) | 72 (66.7%) |
| Cleaning & Maintenance | 279 (82.8%) | 58 (17.2%) |
| Personal Care & Service | 0 (0.0%) | 37 (100.0%) |
| Total (Category) | 326 (64.2%) | 182 (35.8%) |
| Total (Overall) | 709 (49.9%) | 712 (50.1%) |
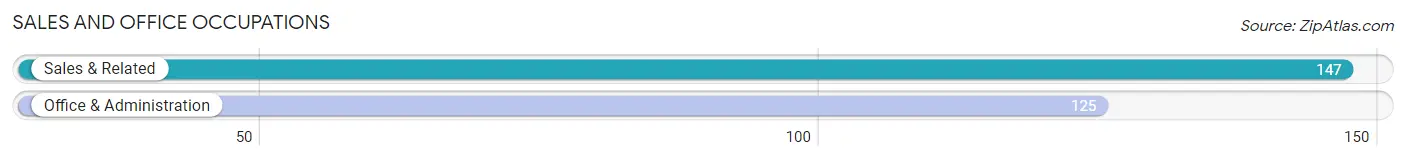
Sales and Office Occupations
The most common Sales and Office occupations in Moorefield are Sales & Related (147 | 10.3%), and Office & Administration (125 | 8.8%).
Sales and Office Occupations by Sex
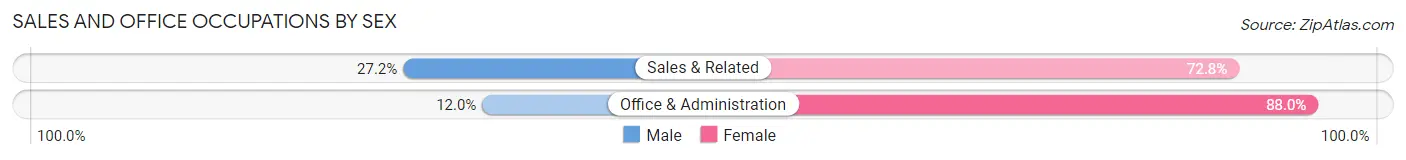
| Occupation | Male | Female |
| Sales & Related | 40 (27.2%) | 107 (72.8%) |
| Office & Administration | 15 (12.0%) | 110 (88.0%) |
| Total (Category) | 55 (20.2%) | 217 (79.8%) |
| Total (Overall) | 709 (49.9%) | 712 (50.1%) |
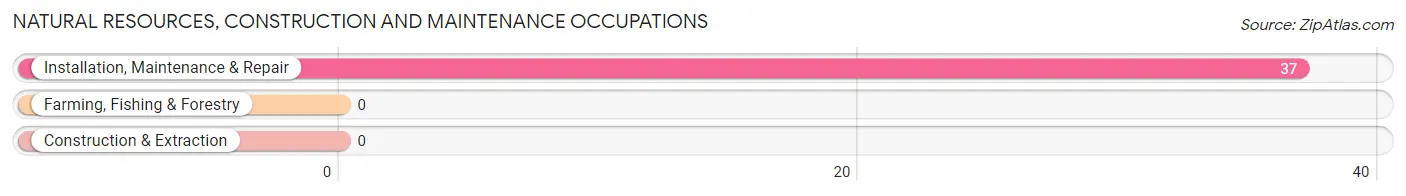
Natural Resources, Construction and Maintenance Occupations
The most common Natural Resources, Construction and Maintenance occupations in Moorefield are , and Installation, Maintenance & Repair (37 | 2.6%).
Natural Resources, Construction and Maintenance Occupations by Sex
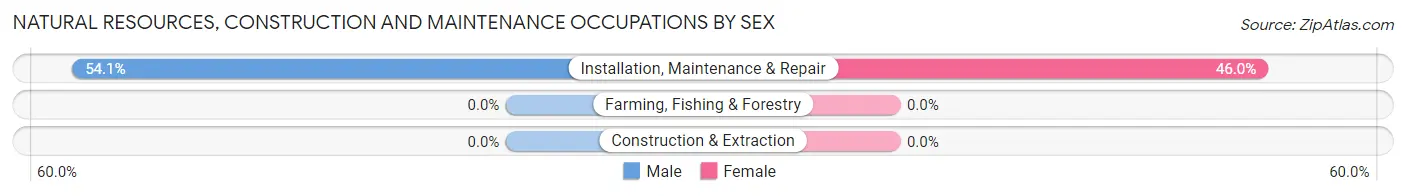
| Occupation | Male | Female |
| Farming, Fishing & Forestry | 0 (0.0%) | 0 (0.0%) |
| Construction & Extraction | 0 (0.0%) | 0 (0.0%) |
| Installation, Maintenance & Repair | 20 (54.0%) | 17 (46.0%) |
| Total (Category) | 20 (54.0%) | 17 (46.0%) |
| Total (Overall) | 709 (49.9%) | 712 (50.1%) |
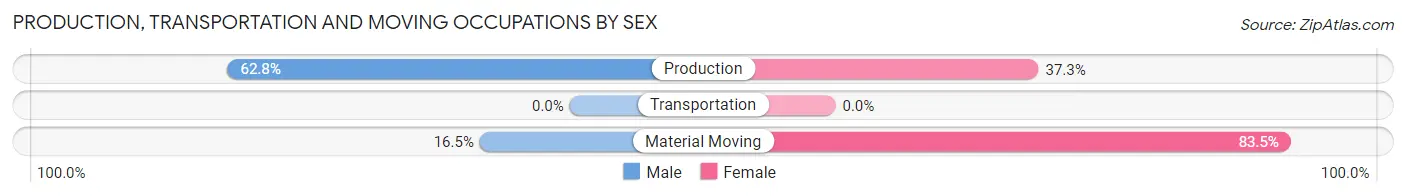
Production, Transportation and Moving Occupations
The most common Production, Transportation and Moving occupations in Moorefield are Production (204 | 14.4%), and Material Moving (188 | 13.2%).
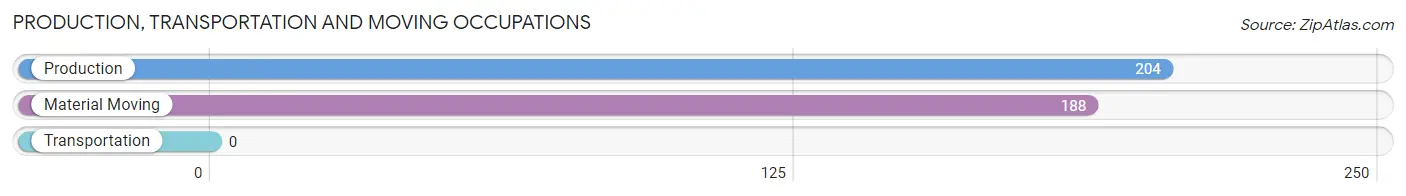
Production, Transportation and Moving Occupations by Sex
| Occupation | Male | Female |
| Production | 128 (62.7%) | 76 (37.2%) |
| Transportation | 0 (0.0%) | 0 (0.0%) |
| Material Moving | 31 (16.5%) | 157 (83.5%) |
| Total (Category) | 159 (40.6%) | 233 (59.4%) |
| Total (Overall) | 709 (49.9%) | 712 (50.1%) |
Employment Industries by Sex in Moorefield
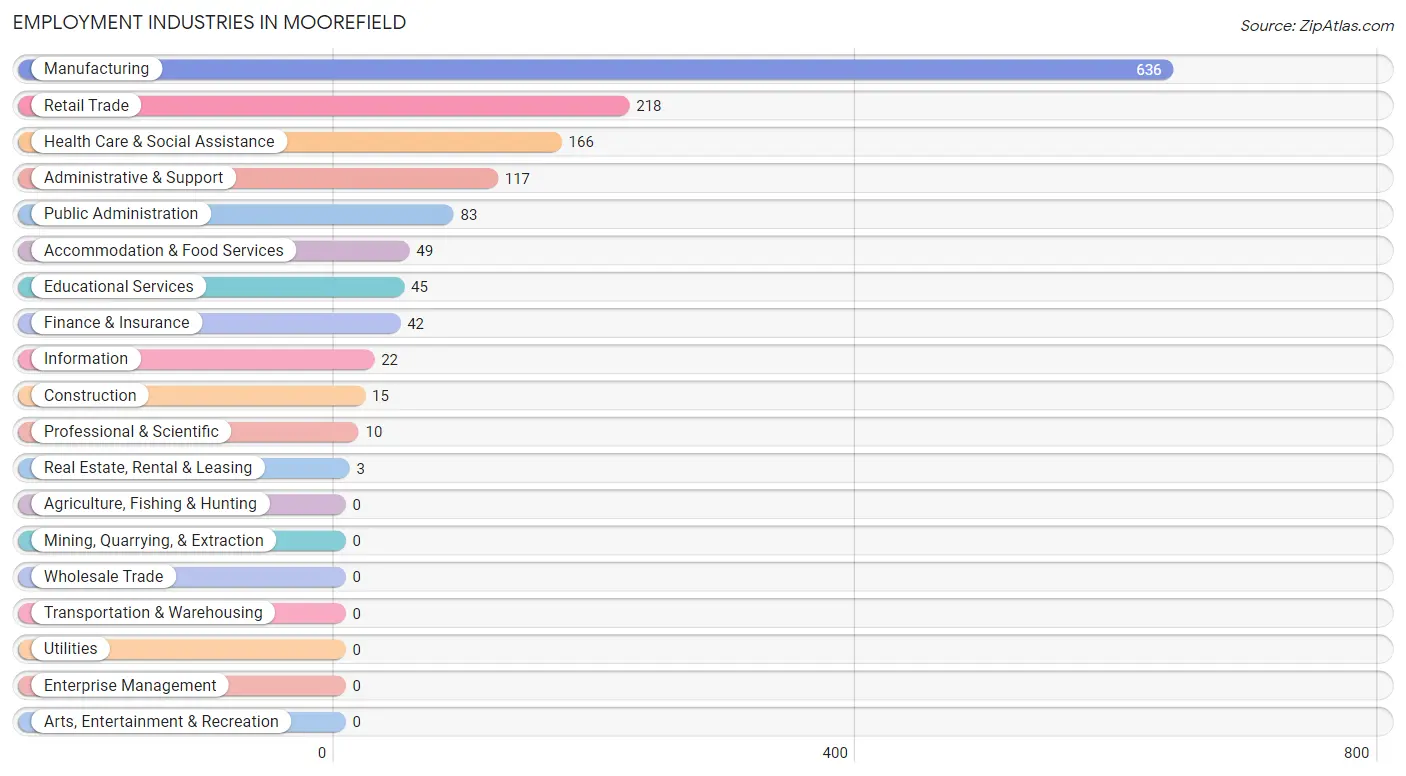
Employment Industries in Moorefield
The major employment industries in Moorefield include Manufacturing (636 | 44.8%), Retail Trade (218 | 15.3%), Health Care & Social Assistance (166 | 11.7%), Administrative & Support (117 | 8.2%), and Public Administration (83 | 5.8%).
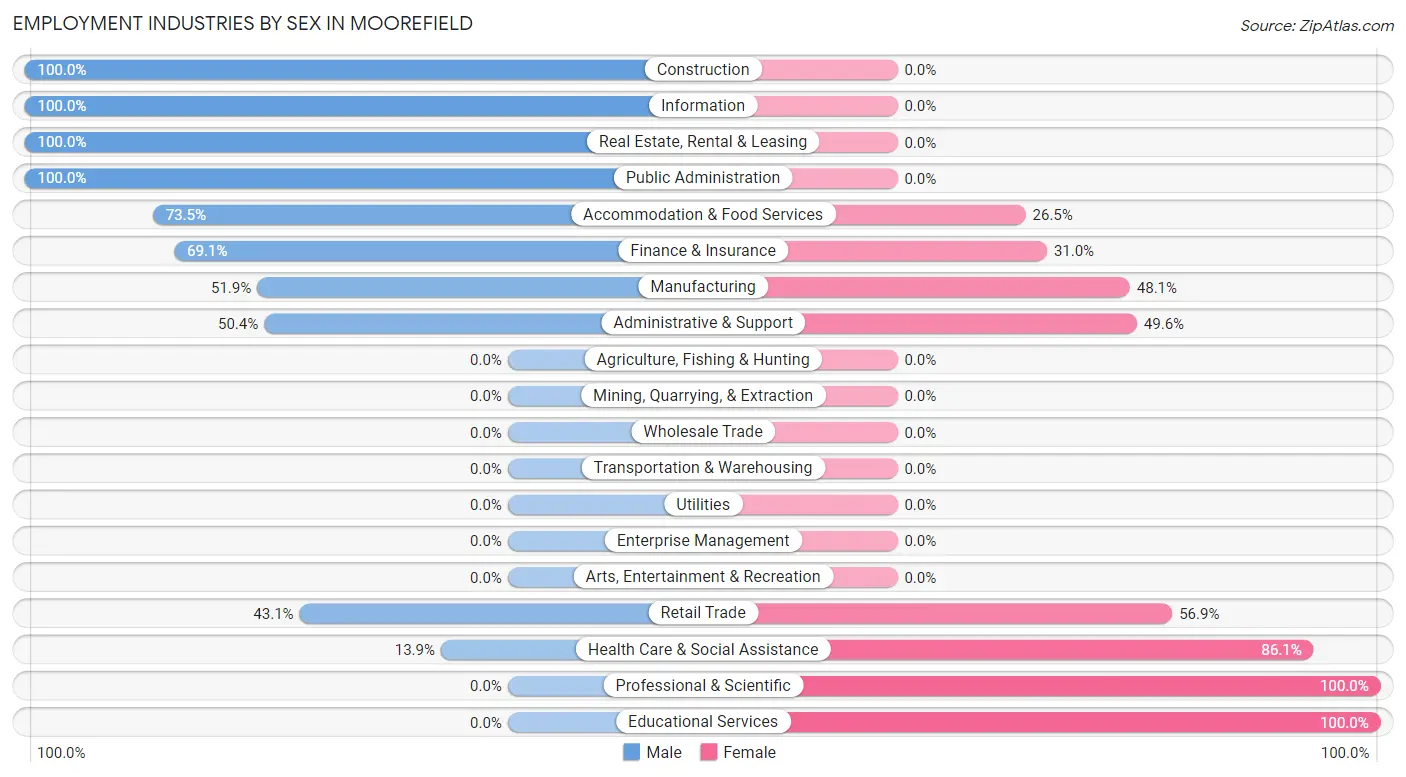
Employment Industries by Sex in Moorefield
The Moorefield industries that see more men than women are Construction (100.0%), Information (100.0%), and Real Estate, Rental & Leasing (100.0%), whereas the industries that tend to have a higher number of women are Professional & Scientific (100.0%), Educational Services (100.0%), and Health Care & Social Assistance (86.1%).
| Industry | Male | Female |
| Agriculture, Fishing & Hunting | 0 (0.0%) | 0 (0.0%) |
| Mining, Quarrying, & Extraction | 0 (0.0%) | 0 (0.0%) |
| Construction | 15 (100.0%) | 0 (0.0%) |
| Manufacturing | 330 (51.9%) | 306 (48.1%) |
| Wholesale Trade | 0 (0.0%) | 0 (0.0%) |
| Retail Trade | 94 (43.1%) | 124 (56.9%) |
| Transportation & Warehousing | 0 (0.0%) | 0 (0.0%) |
| Utilities | 0 (0.0%) | 0 (0.0%) |
| Information | 22 (100.0%) | 0 (0.0%) |
| Finance & Insurance | 29 (69.1%) | 13 (30.9%) |
| Real Estate, Rental & Leasing | 3 (100.0%) | 0 (0.0%) |
| Professional & Scientific | 0 (0.0%) | 10 (100.0%) |
| Enterprise Management | 0 (0.0%) | 0 (0.0%) |
| Administrative & Support | 59 (50.4%) | 58 (49.6%) |
| Educational Services | 0 (0.0%) | 45 (100.0%) |
| Health Care & Social Assistance | 23 (13.9%) | 143 (86.1%) |
| Arts, Entertainment & Recreation | 0 (0.0%) | 0 (0.0%) |
| Accommodation & Food Services | 36 (73.5%) | 13 (26.5%) |
| Public Administration | 83 (100.0%) | 0 (0.0%) |
| Total | 709 (49.9%) | 712 (50.1%) |
Education in Moorefield
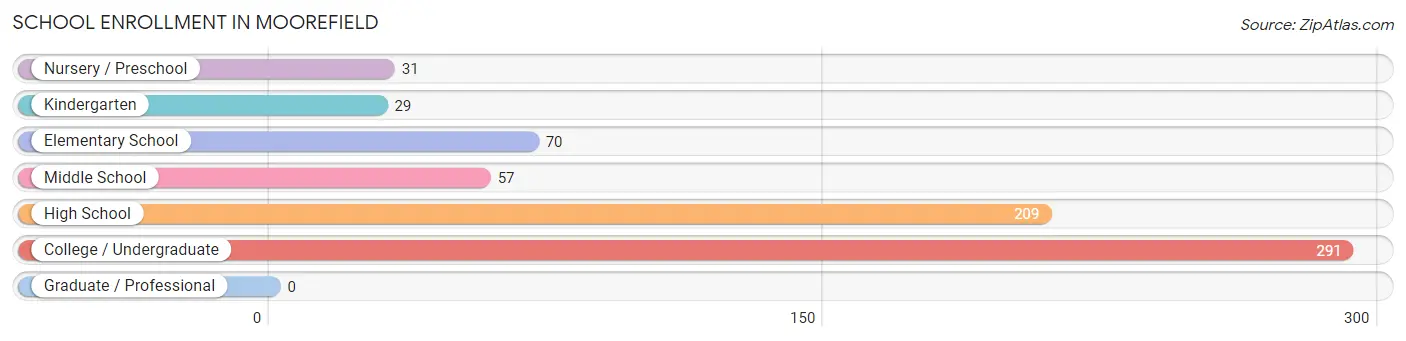
School Enrollment in Moorefield
The most common levels of schooling among the 687 students in Moorefield are college / undergraduate (291 | 42.4%), high school (209 | 30.4%), and elementary school (70 | 10.2%).
| School Level | # Students | % Students |
| Nursery / Preschool | 31 | 4.5% |
| Kindergarten | 29 | 4.2% |
| Elementary School | 70 | 10.2% |
| Middle School | 57 | 8.3% |
| High School | 209 | 30.4% |
| College / Undergraduate | 291 | 42.4% |
| Graduate / Professional | 0 | 0.0% |
| Total | 687 | 100.0% |
School Enrollment by Age by Funding Source in Moorefield
Out of a total of 687 students who are enrolled in schools in Moorefield, 9 (1.3%) attend a private institution, while the remaining 678 (98.7%) are enrolled in public schools. The age group of 35 years and over has the highest likelihood of being enrolled in private schools, with 9 (100.0% in the age bracket) enrolled. Conversely, the age group of 3 to 4 year olds has the lowest likelihood of being enrolled in a private school, with 31 (100.0% in the age bracket) attending a public institution.
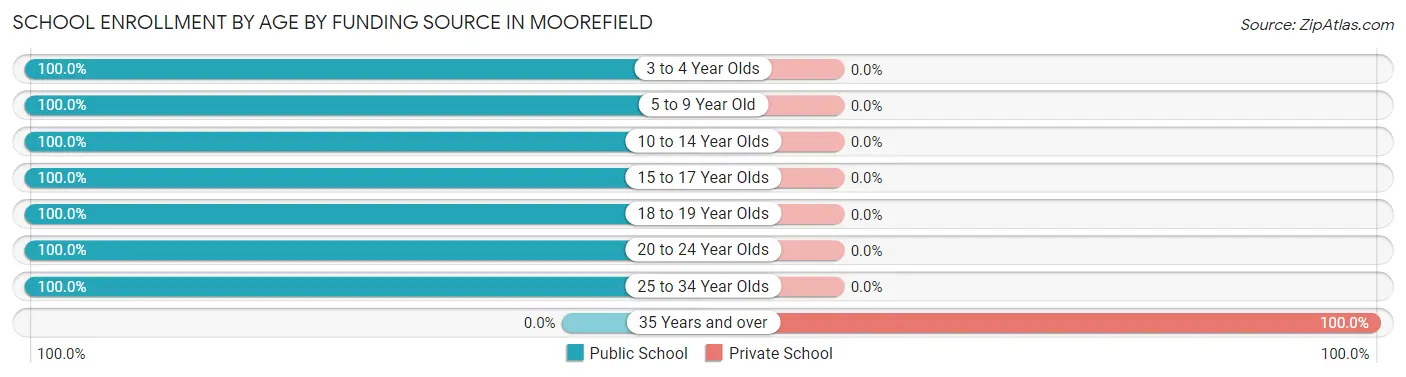
| Age Bracket | Public School | Private School |
| 3 to 4 Year Olds | 31 (100.0%) | 0 (0.0%) |
| 5 to 9 Year Old | 99 (100.0%) | 0 (0.0%) |
| 10 to 14 Year Olds | 123 (100.0%) | 0 (0.0%) |
| 15 to 17 Year Olds | 110 (100.0%) | 0 (0.0%) |
| 18 to 19 Year Olds | 33 (100.0%) | 0 (0.0%) |
| 20 to 24 Year Olds | 81 (100.0%) | 0 (0.0%) |
| 25 to 34 Year Olds | 201 (100.0%) | 0 (0.0%) |
| 35 Years and over | 0 (0.0%) | 9 (100.0%) |
| Total | 678 (98.7%) | 9 (1.3%) |
Educational Attainment by Field of Study in Moorefield
Education (68 | 38.0%), science & technology (62 | 34.6%), arts & humanities (30 | 16.8%), psychology (14 | 7.8%), and bio, nature & agricultural (5 | 2.8%) are the most common fields of study among 179 individuals in Moorefield who have obtained a bachelor's degree or higher.
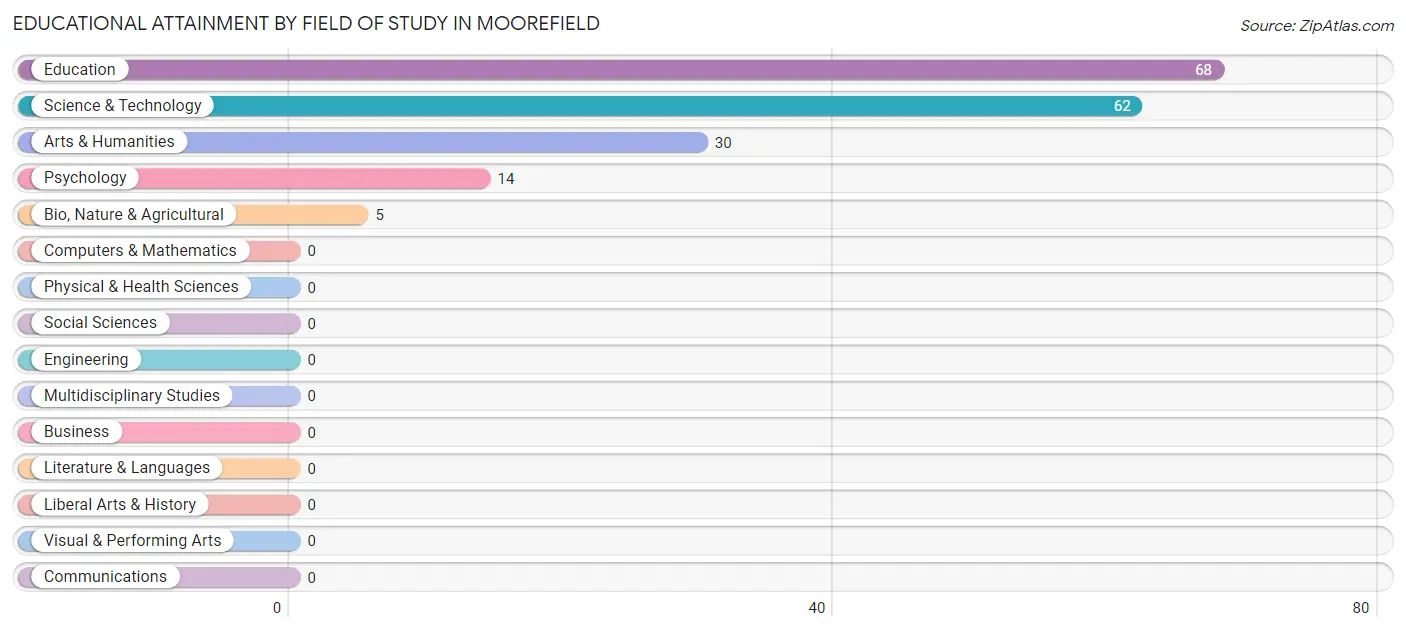
| Field of Study | # Graduates | % Graduates |
| Computers & Mathematics | 0 | 0.0% |
| Bio, Nature & Agricultural | 5 | 2.8% |
| Physical & Health Sciences | 0 | 0.0% |
| Psychology | 14 | 7.8% |
| Social Sciences | 0 | 0.0% |
| Engineering | 0 | 0.0% |
| Multidisciplinary Studies | 0 | 0.0% |
| Science & Technology | 62 | 34.6% |
| Business | 0 | 0.0% |
| Education | 68 | 38.0% |
| Literature & Languages | 0 | 0.0% |
| Liberal Arts & History | 0 | 0.0% |
| Visual & Performing Arts | 0 | 0.0% |
| Communications | 0 | 0.0% |
| Arts & Humanities | 30 | 16.8% |
| Total | 179 | 100.0% |
Transportation & Commute in Moorefield
Vehicle Availability by Sex in Moorefield
The most prevalent vehicle ownership categories in Moorefield are males with 2 vehicles (334, accounting for 47.1%) and females with 2 vehicles (223, making up 58.1%).
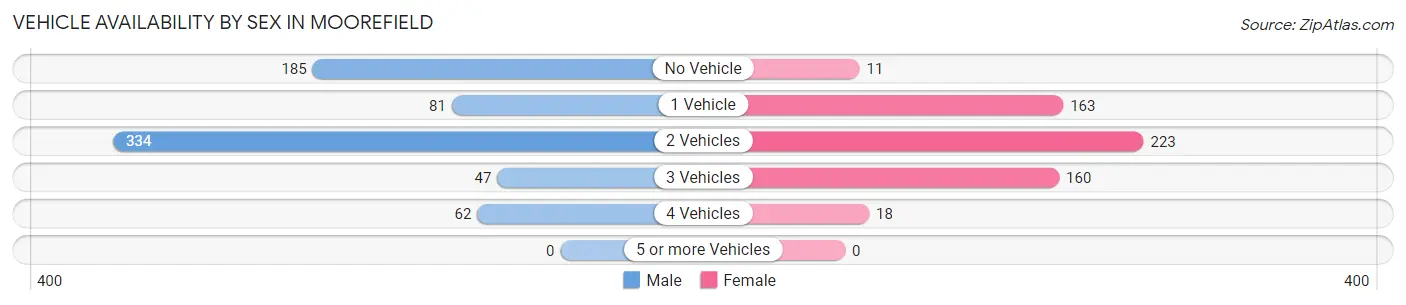
| Vehicles Available | Male | Female |
| No Vehicle | 185 (26.1%) | 11 (1.9%) |
| 1 Vehicle | 81 (11.4%) | 163 (28.3%) |
| 2 Vehicles | 334 (47.1%) | 223 (38.8%) |
| 3 Vehicles | 47 (6.6%) | 160 (27.8%) |
| 4 Vehicles | 62 (8.7%) | 18 (3.1%) |
| 5 or more Vehicles | 0 (0.0%) | 0 (0.0%) |
| Total | 709 (100.0%) | 575 (100.0%) |
Commute Time in Moorefield
The most frequently occuring commute durations in Moorefield are less than 5 minutes (309 commuters, 27.8%), 5 to 9 minutes (251 commuters, 22.6%), and 10 to 14 minutes (230 commuters, 20.7%).
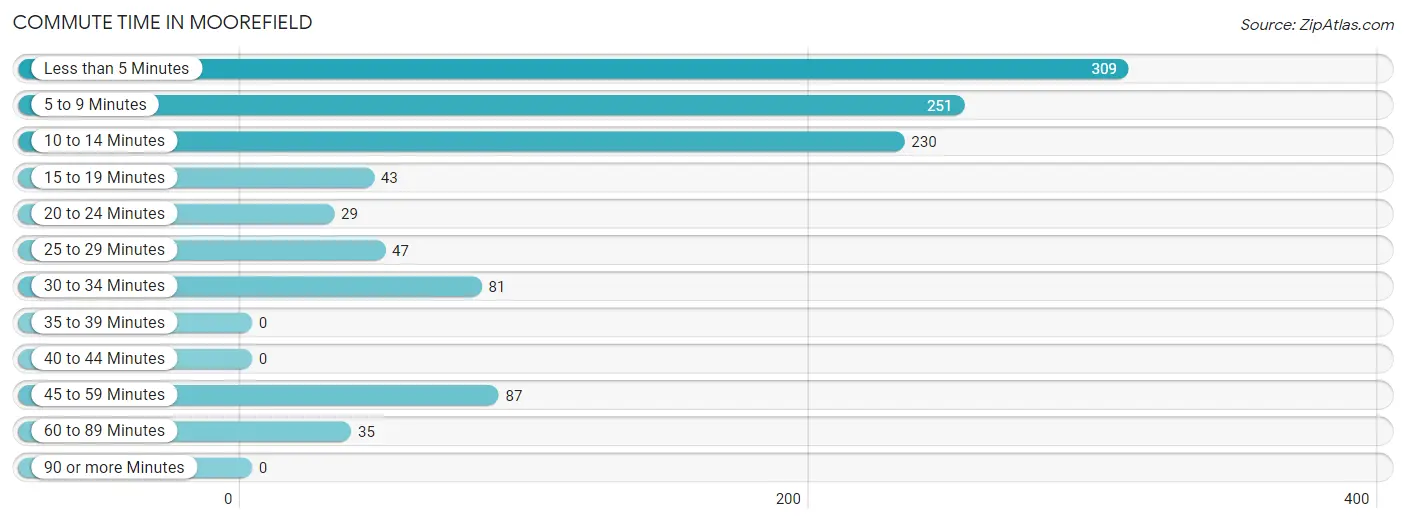
| Commute Time | # Commuters | % Commuters |
| Less than 5 Minutes | 309 | 27.8% |
| 5 to 9 Minutes | 251 | 22.6% |
| 10 to 14 Minutes | 230 | 20.7% |
| 15 to 19 Minutes | 43 | 3.9% |
| 20 to 24 Minutes | 29 | 2.6% |
| 25 to 29 Minutes | 47 | 4.2% |
| 30 to 34 Minutes | 81 | 7.3% |
| 35 to 39 Minutes | 0 | 0.0% |
| 40 to 44 Minutes | 0 | 0.0% |
| 45 to 59 Minutes | 87 | 7.8% |
| 60 to 89 Minutes | 35 | 3.2% |
| 90 or more Minutes | 0 | 0.0% |
Commute Time by Sex in Moorefield
The most common commute times in Moorefield are less than 5 minutes (164 commuters, 30.4%) for males and 5 to 9 minutes (153 commuters, 26.7%) for females.
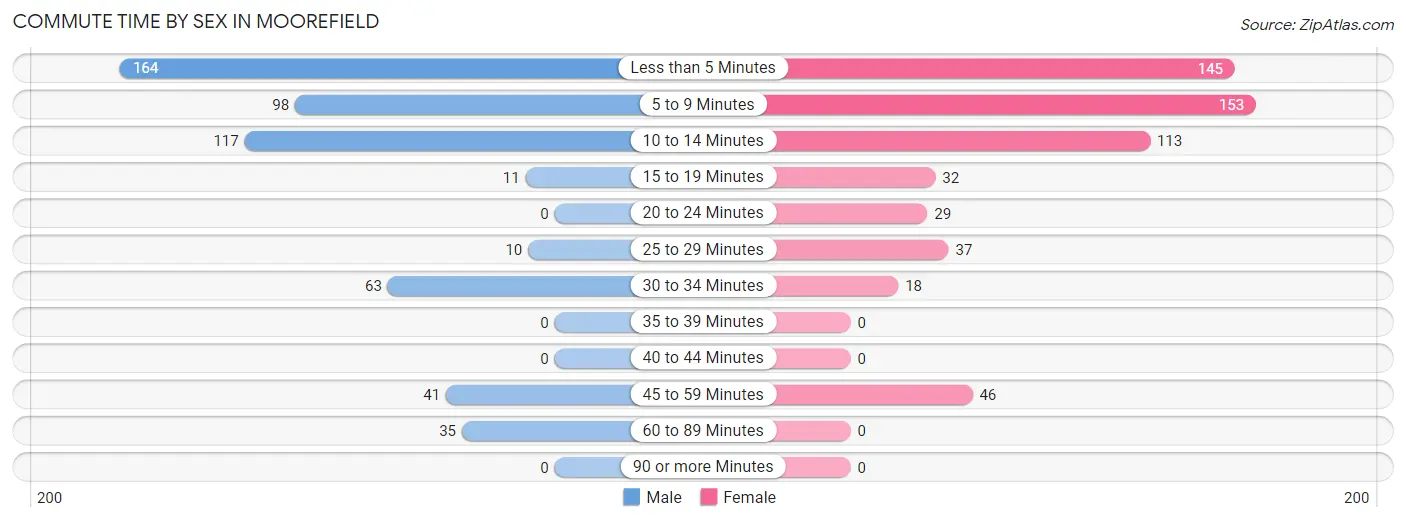
| Commute Time | Male | Female |
| Less than 5 Minutes | 164 (30.4%) | 145 (25.3%) |
| 5 to 9 Minutes | 98 (18.2%) | 153 (26.7%) |
| 10 to 14 Minutes | 117 (21.7%) | 113 (19.7%) |
| 15 to 19 Minutes | 11 (2.0%) | 32 (5.6%) |
| 20 to 24 Minutes | 0 (0.0%) | 29 (5.1%) |
| 25 to 29 Minutes | 10 (1.9%) | 37 (6.5%) |
| 30 to 34 Minutes | 63 (11.7%) | 18 (3.1%) |
| 35 to 39 Minutes | 0 (0.0%) | 0 (0.0%) |
| 40 to 44 Minutes | 0 (0.0%) | 0 (0.0%) |
| 45 to 59 Minutes | 41 (7.6%) | 46 (8.0%) |
| 60 to 89 Minutes | 35 (6.5%) | 0 (0.0%) |
| 90 or more Minutes | 0 (0.0%) | 0 (0.0%) |
Time of Departure to Work by Sex in Moorefield
The most frequent times of departure to work in Moorefield are 8:00 AM to 8:29 AM (104, 19.3%) for males and 4:00 PM to 11:59 PM (108, 18.9%) for females.
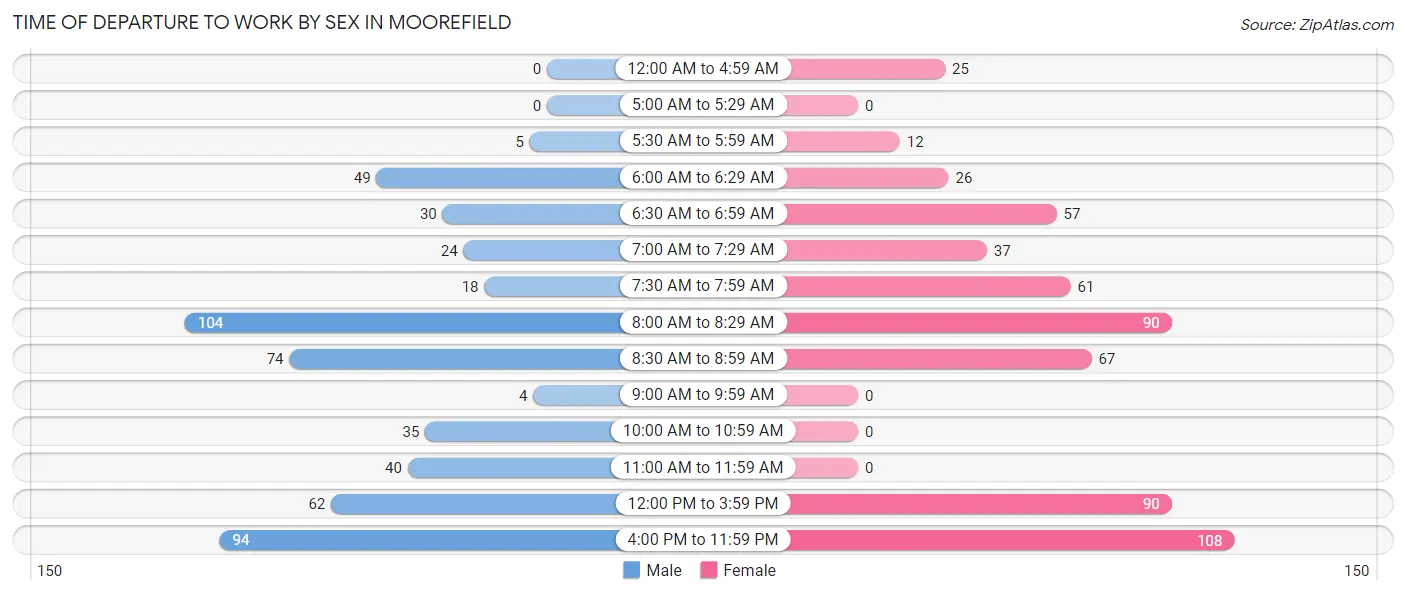
| Time of Departure | Male | Female |
| 12:00 AM to 4:59 AM | 0 (0.0%) | 25 (4.4%) |
| 5:00 AM to 5:29 AM | 0 (0.0%) | 0 (0.0%) |
| 5:30 AM to 5:59 AM | 5 (0.9%) | 12 (2.1%) |
| 6:00 AM to 6:29 AM | 49 (9.1%) | 26 (4.5%) |
| 6:30 AM to 6:59 AM | 30 (5.6%) | 57 (10.0%) |
| 7:00 AM to 7:29 AM | 24 (4.4%) | 37 (6.5%) |
| 7:30 AM to 7:59 AM | 18 (3.3%) | 61 (10.6%) |
| 8:00 AM to 8:29 AM | 104 (19.3%) | 90 (15.7%) |
| 8:30 AM to 8:59 AM | 74 (13.7%) | 67 (11.7%) |
| 9:00 AM to 9:59 AM | 4 (0.7%) | 0 (0.0%) |
| 10:00 AM to 10:59 AM | 35 (6.5%) | 0 (0.0%) |
| 11:00 AM to 11:59 AM | 40 (7.4%) | 0 (0.0%) |
| 12:00 PM to 3:59 PM | 62 (11.5%) | 90 (15.7%) |
| 4:00 PM to 11:59 PM | 94 (17.4%) | 108 (18.9%) |
| Total | 539 (100.0%) | 573 (100.0%) |
Housing Occupancy in Moorefield
Occupancy by Ownership in Moorefield
Of the total 1,110 dwellings in Moorefield, owner-occupied units account for 688 (62.0%), while renter-occupied units make up 422 (38.0%).
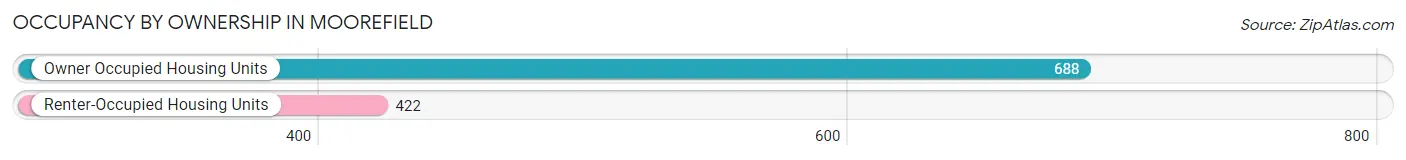
| Occupancy | # Housing Units | % Housing Units |
| Owner Occupied Housing Units | 688 | 62.0% |
| Renter-Occupied Housing Units | 422 | 38.0% |
| Total Occupied Housing Units | 1,110 | 100.0% |
Occupancy by Household Size in Moorefield
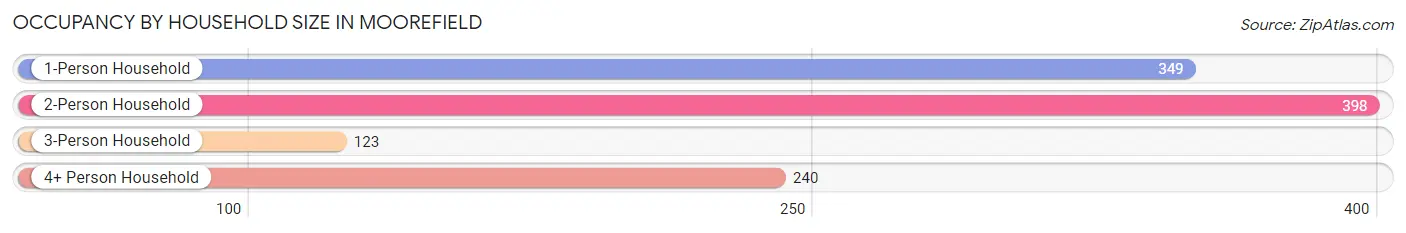
| Household Size | # Housing Units | % Housing Units |
| 1-Person Household | 349 | 31.4% |
| 2-Person Household | 398 | 35.9% |
| 3-Person Household | 123 | 11.1% |
| 4+ Person Household | 240 | 21.6% |
| Total Housing Units | 1,110 | 100.0% |
Occupancy by Ownership by Household Size in Moorefield
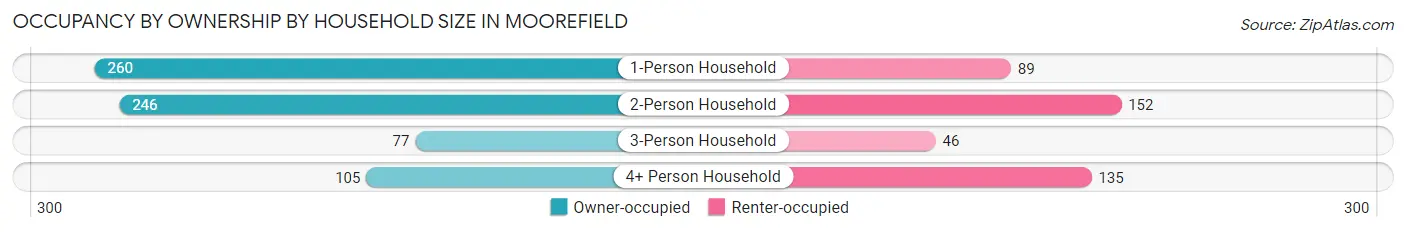
| Household Size | Owner-occupied | Renter-occupied |
| 1-Person Household | 260 (74.5%) | 89 (25.5%) |
| 2-Person Household | 246 (61.8%) | 152 (38.2%) |
| 3-Person Household | 77 (62.6%) | 46 (37.4%) |
| 4+ Person Household | 105 (43.8%) | 135 (56.2%) |
| Total Housing Units | 688 (62.0%) | 422 (38.0%) |
Occupancy by Educational Attainment in Moorefield
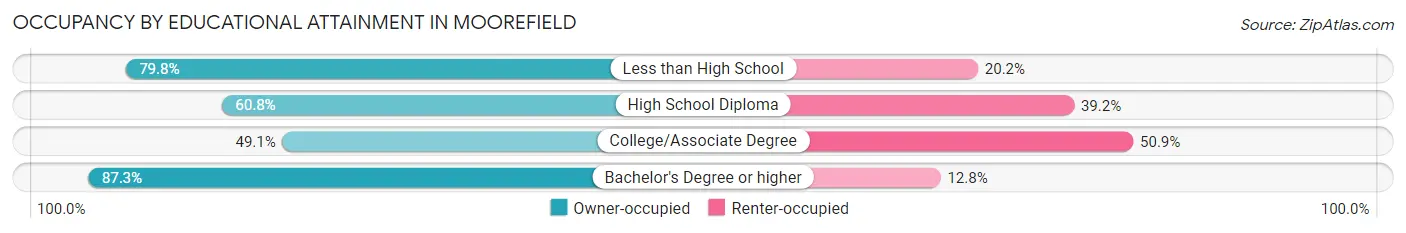
| Household Size | Owner-occupied | Renter-occupied |
| Less than High School | 99 (79.8%) | 25 (20.2%) |
| High School Diploma | 344 (60.8%) | 222 (39.2%) |
| College/Associate Degree | 156 (49.1%) | 162 (50.9%) |
| Bachelor's Degree or higher | 89 (87.3%) | 13 (12.8%) |
Occupancy by Age of Householder in Moorefield
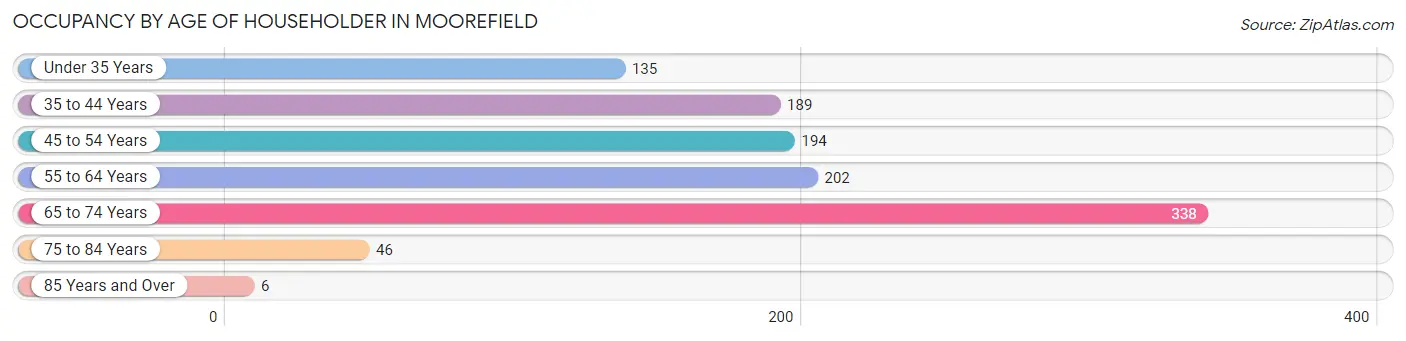
| Age Bracket | # Households | % Households |
| Under 35 Years | 135 | 12.2% |
| 35 to 44 Years | 189 | 17.0% |
| 45 to 54 Years | 194 | 17.5% |
| 55 to 64 Years | 202 | 18.2% |
| 65 to 74 Years | 338 | 30.4% |
| 75 to 84 Years | 46 | 4.1% |
| 85 Years and Over | 6 | 0.5% |
| Total | 1,110 | 100.0% |
Housing Finances in Moorefield
Median Income by Occupancy in Moorefield
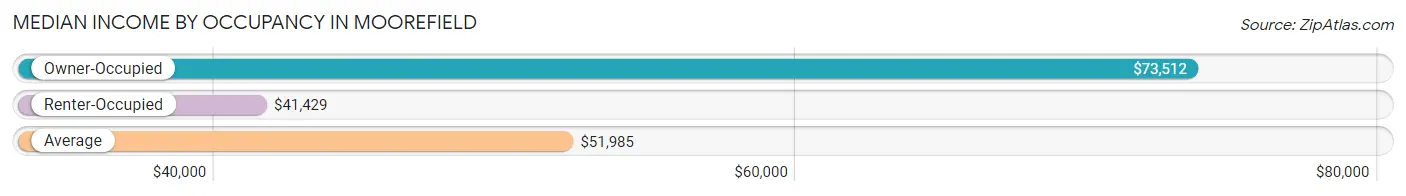
| Occupancy Type | # Households | Median Income |
| Owner-Occupied | 688 (62.0%) | $73,512 |
| Renter-Occupied | 422 (38.0%) | $41,429 |
| Average | 1,110 (100.0%) | $51,985 |
Occupancy by Householder Income Bracket in Moorefield
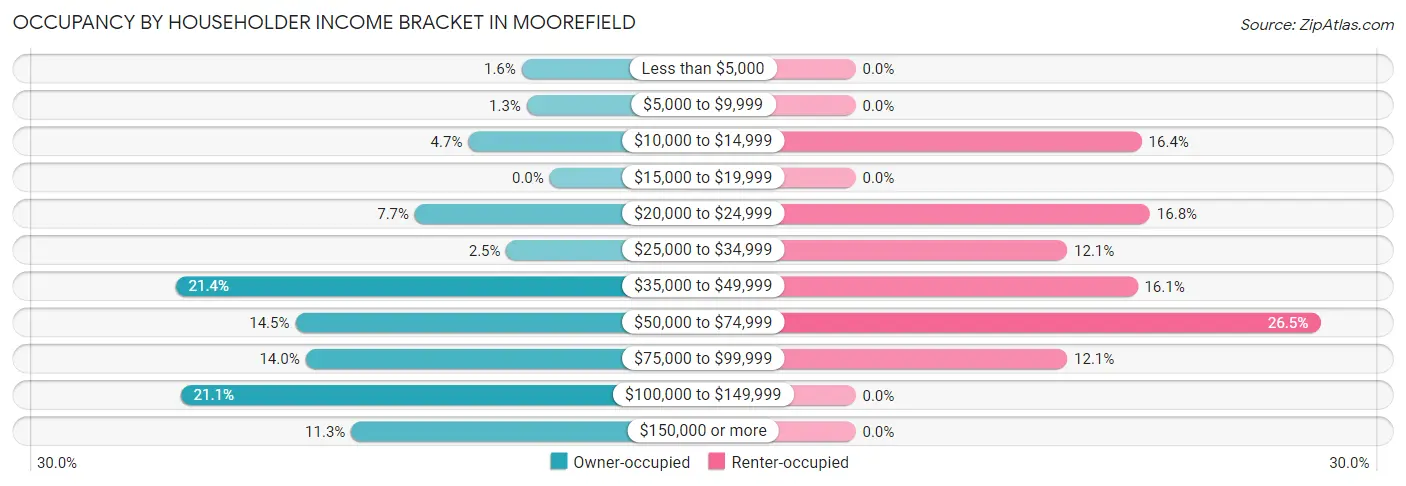
| Income Bracket | Owner-occupied | Renter-occupied |
| Less than $5,000 | 11 (1.6%) | 0 (0.0%) |
| $5,000 to $9,999 | 9 (1.3%) | 0 (0.0%) |
| $10,000 to $14,999 | 32 (4.6%) | 69 (16.4%) |
| $15,000 to $19,999 | 0 (0.0%) | 0 (0.0%) |
| $20,000 to $24,999 | 53 (7.7%) | 71 (16.8%) |
| $25,000 to $34,999 | 17 (2.5%) | 51 (12.1%) |
| $35,000 to $49,999 | 147 (21.4%) | 68 (16.1%) |
| $50,000 to $74,999 | 100 (14.5%) | 112 (26.5%) |
| $75,000 to $99,999 | 96 (14.0%) | 51 (12.1%) |
| $100,000 to $149,999 | 145 (21.1%) | 0 (0.0%) |
| $150,000 or more | 78 (11.3%) | 0 (0.0%) |
| Total | 688 (100.0%) | 422 (100.0%) |
Monthly Housing Cost Tiers in Moorefield
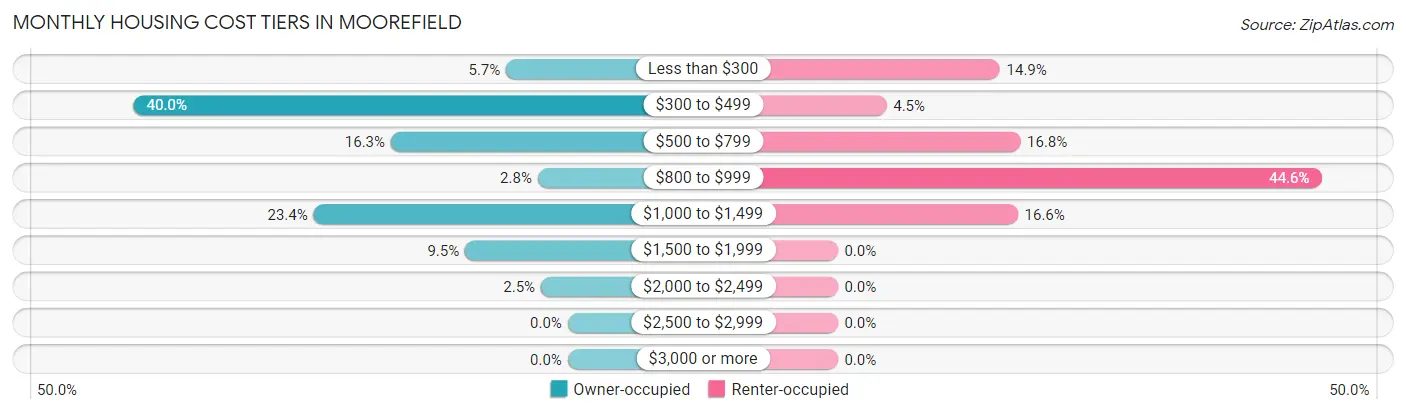
| Monthly Cost | Owner-occupied | Renter-occupied |
| Less than $300 | 39 (5.7%) | 63 (14.9%) |
| $300 to $499 | 275 (40.0%) | 19 (4.5%) |
| $500 to $799 | 112 (16.3%) | 71 (16.8%) |
| $800 to $999 | 19 (2.8%) | 188 (44.6%) |
| $1,000 to $1,499 | 161 (23.4%) | 70 (16.6%) |
| $1,500 to $1,999 | 65 (9.5%) | 0 (0.0%) |
| $2,000 to $2,499 | 17 (2.5%) | 0 (0.0%) |
| $2,500 to $2,999 | 0 (0.0%) | 0 (0.0%) |
| $3,000 or more | 0 (0.0%) | 0 (0.0%) |
| Total | 688 (100.0%) | 422 (100.0%) |
Physical Housing Characteristics in Moorefield
Housing Structures in Moorefield
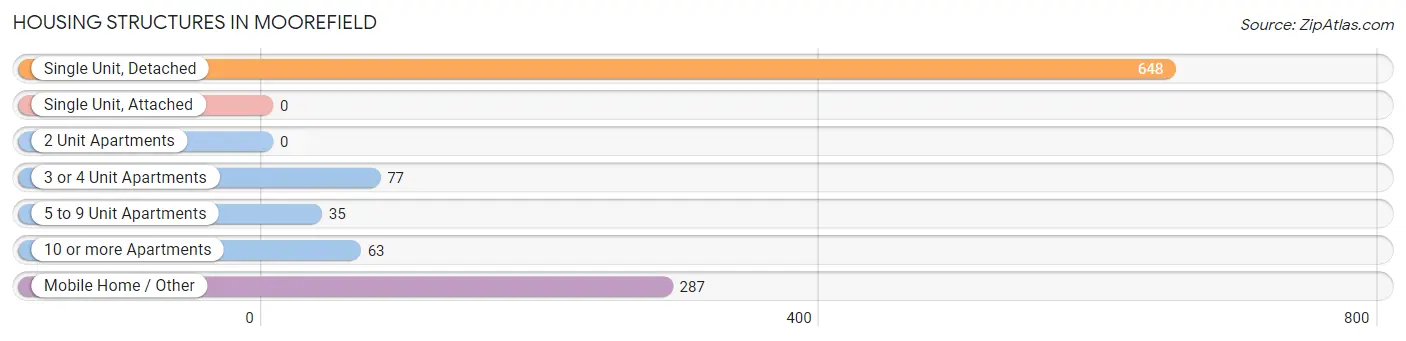
| Structure Type | # Housing Units | % Housing Units |
| Single Unit, Detached | 648 | 58.4% |
| Single Unit, Attached | 0 | 0.0% |
| 2 Unit Apartments | 0 | 0.0% |
| 3 or 4 Unit Apartments | 77 | 6.9% |
| 5 to 9 Unit Apartments | 35 | 3.2% |
| 10 or more Apartments | 63 | 5.7% |
| Mobile Home / Other | 287 | 25.9% |
| Total | 1,110 | 100.0% |
Housing Structures by Occupancy in Moorefield
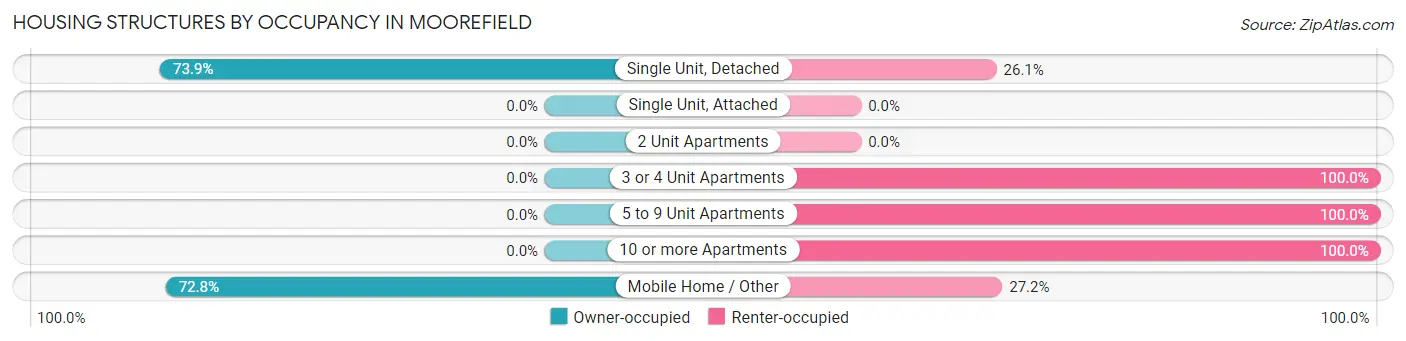
| Structure Type | Owner-occupied | Renter-occupied |
| Single Unit, Detached | 479 (73.9%) | 169 (26.1%) |
| Single Unit, Attached | 0 (0.0%) | 0 (0.0%) |
| 2 Unit Apartments | 0 (0.0%) | 0 (0.0%) |
| 3 or 4 Unit Apartments | 0 (0.0%) | 77 (100.0%) |
| 5 to 9 Unit Apartments | 0 (0.0%) | 35 (100.0%) |
| 10 or more Apartments | 0 (0.0%) | 63 (100.0%) |
| Mobile Home / Other | 209 (72.8%) | 78 (27.2%) |
| Total | 688 (62.0%) | 422 (38.0%) |
Housing Structures by Number of Rooms in Moorefield
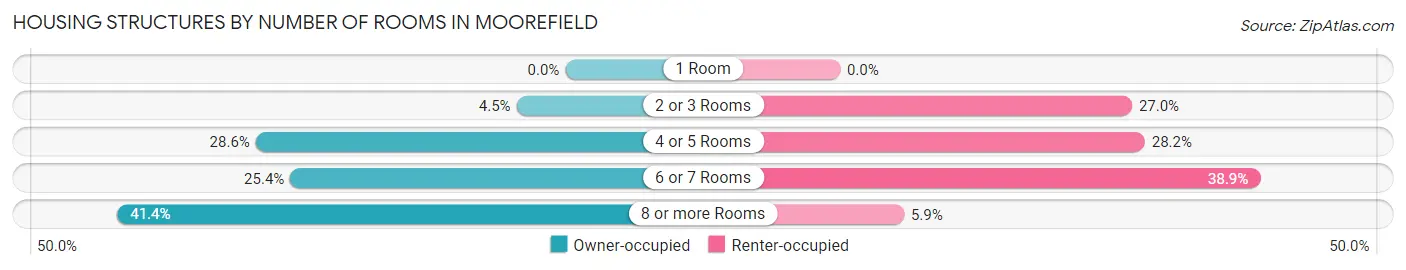
| Number of Rooms | Owner-occupied | Renter-occupied |
| 1 Room | 0 (0.0%) | 0 (0.0%) |
| 2 or 3 Rooms | 31 (4.5%) | 114 (27.0%) |
| 4 or 5 Rooms | 197 (28.6%) | 119 (28.2%) |
| 6 or 7 Rooms | 175 (25.4%) | 164 (38.9%) |
| 8 or more Rooms | 285 (41.4%) | 25 (5.9%) |
| Total | 688 (100.0%) | 422 (100.0%) |
Housing Structure by Heating Type in Moorefield
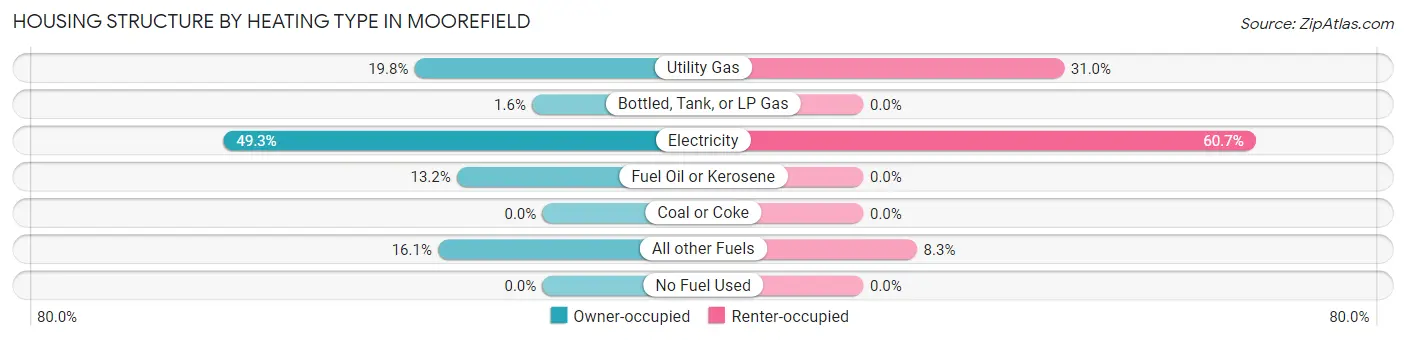
| Heating Type | Owner-occupied | Renter-occupied |
| Utility Gas | 136 (19.8%) | 131 (31.0%) |
| Bottled, Tank, or LP Gas | 11 (1.6%) | 0 (0.0%) |
| Electricity | 339 (49.3%) | 256 (60.7%) |
| Fuel Oil or Kerosene | 91 (13.2%) | 0 (0.0%) |
| Coal or Coke | 0 (0.0%) | 0 (0.0%) |
| All other Fuels | 111 (16.1%) | 35 (8.3%) |
| No Fuel Used | 0 (0.0%) | 0 (0.0%) |
| Total | 688 (100.0%) | 422 (100.0%) |
Household Vehicle Usage in Moorefield
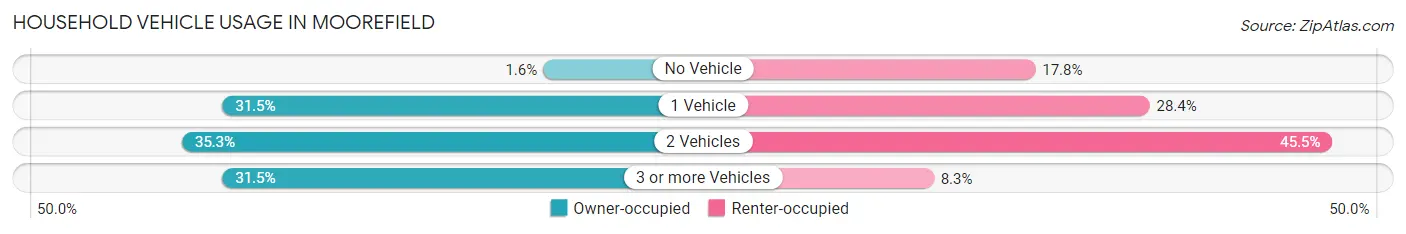
| Vehicles per Household | Owner-occupied | Renter-occupied |
| No Vehicle | 11 (1.6%) | 75 (17.8%) |
| 1 Vehicle | 217 (31.5%) | 120 (28.4%) |
| 2 Vehicles | 243 (35.3%) | 192 (45.5%) |
| 3 or more Vehicles | 217 (31.5%) | 35 (8.3%) |
| Total | 688 (100.0%) | 422 (100.0%) |
Real Estate & Mortgages in Moorefield
Real Estate and Mortgage Overview in Moorefield
| Characteristic | Without Mortgage | With Mortgage |
| Housing Units | 417 | 271 |
| Median Property Value | $117,000 | $212,700 |
| Median Household Income | $44,736 | $78 |
| Monthly Housing Costs | $414 | $0 |
| Real Estate Taxes | $587 | $0 |
Property Value by Mortgage Status in Moorefield
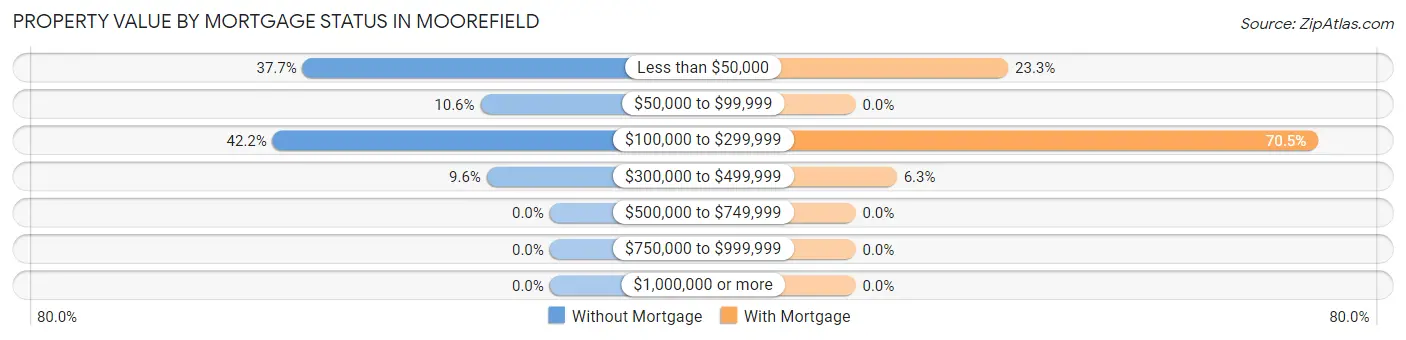
| Property Value | Without Mortgage | With Mortgage |
| Less than $50,000 | 157 (37.7%) | 63 (23.3%) |
| $50,000 to $99,999 | 44 (10.5%) | 0 (0.0%) |
| $100,000 to $299,999 | 176 (42.2%) | 191 (70.5%) |
| $300,000 to $499,999 | 40 (9.6%) | 17 (6.3%) |
| $500,000 to $749,999 | 0 (0.0%) | 0 (0.0%) |
| $750,000 to $999,999 | 0 (0.0%) | 0 (0.0%) |
| $1,000,000 or more | 0 (0.0%) | 0 (0.0%) |
| Total | 417 (100.0%) | 271 (100.0%) |
Household Income by Mortgage Status in Moorefield
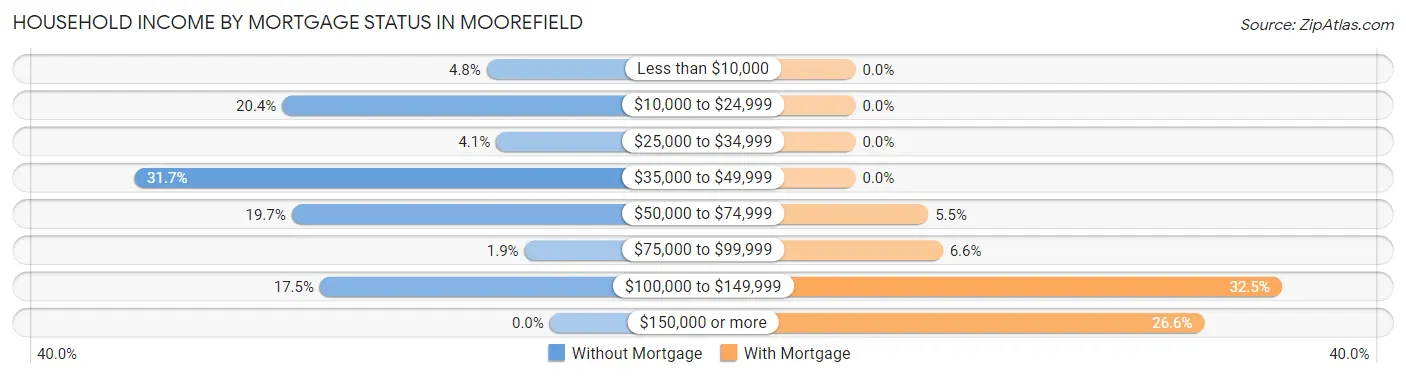
| Household Income | Without Mortgage | With Mortgage |
| Less than $10,000 | 20 (4.8%) | 0 (0.0%) |
| $10,000 to $24,999 | 85 (20.4%) | 0 (0.0%) |
| $25,000 to $34,999 | 17 (4.1%) | 0 (0.0%) |
| $35,000 to $49,999 | 132 (31.7%) | 0 (0.0%) |
| $50,000 to $74,999 | 82 (19.7%) | 15 (5.5%) |
| $75,000 to $99,999 | 8 (1.9%) | 18 (6.6%) |
| $100,000 to $149,999 | 73 (17.5%) | 88 (32.5%) |
| $150,000 or more | 0 (0.0%) | 72 (26.6%) |
| Total | 417 (100.0%) | 271 (100.0%) |
Property Value to Household Income Ratio in Moorefield
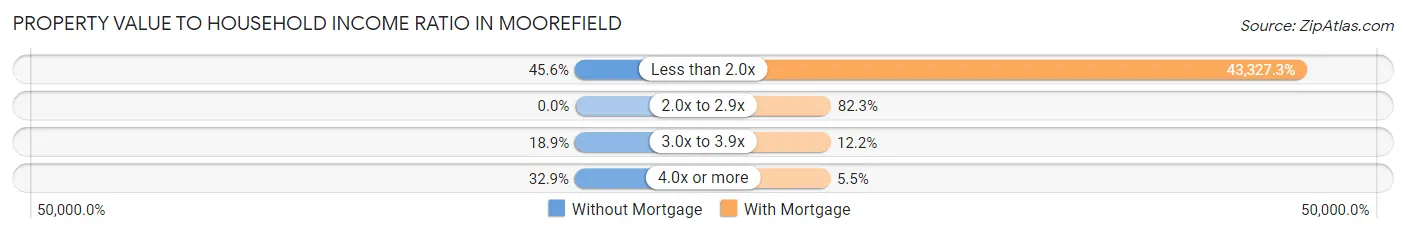
| Value-to-Income Ratio | Without Mortgage | With Mortgage |
| Less than 2.0x | 190 (45.6%) | 117,417 (43,327.3%) |
| 2.0x to 2.9x | 0 (0.0%) | 223 (82.3%) |
| 3.0x to 3.9x | 79 (18.9%) | 33 (12.2%) |
| 4.0x or more | 137 (32.9%) | 15 (5.5%) |
| Total | 417 (100.0%) | 271 (100.0%) |
Real Estate Taxes by Mortgage Status in Moorefield
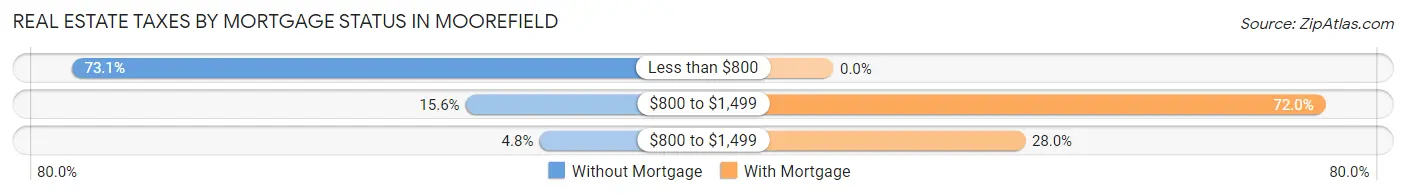
| Property Taxes | Without Mortgage | With Mortgage |
| Less than $800 | 305 (73.1%) | 0 (0.0%) |
| $800 to $1,499 | 65 (15.6%) | 195 (72.0%) |
| $800 to $1,499 | 20 (4.8%) | 76 (28.0%) |
| Total | 417 (100.0%) | 271 (100.0%) |
Health & Disability in Moorefield
Health Insurance Coverage by Age in Moorefield
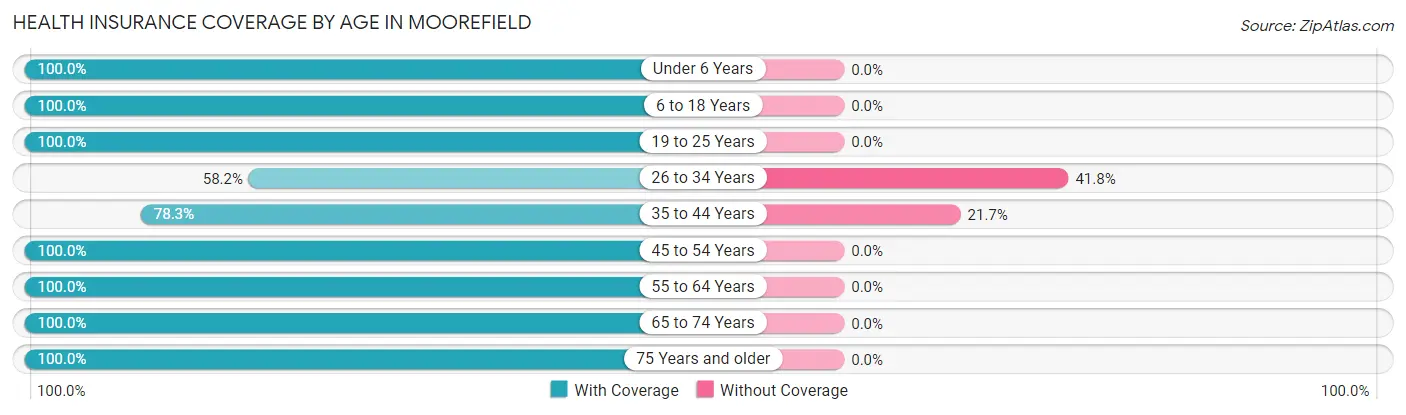
| Age Bracket | With Coverage | Without Coverage |
| Under 6 Years | 64 (100.0%) | 0 (0.0%) |
| 6 to 18 Years | 381 (100.0%) | 0 (0.0%) |
| 19 to 25 Years | 247 (100.0%) | 0 (0.0%) |
| 26 to 34 Years | 245 (58.2%) | 176 (41.8%) |
| 35 to 44 Years | 379 (78.3%) | 105 (21.7%) |
| 45 to 54 Years | 309 (100.0%) | 0 (0.0%) |
| 55 to 64 Years | 269 (100.0%) | 0 (0.0%) |
| 65 to 74 Years | 532 (100.0%) | 0 (0.0%) |
| 75 Years and older | 139 (100.0%) | 0 (0.0%) |
| Total | 2,565 (90.1%) | 281 (9.9%) |
Health Insurance Coverage by Citizenship Status in Moorefield
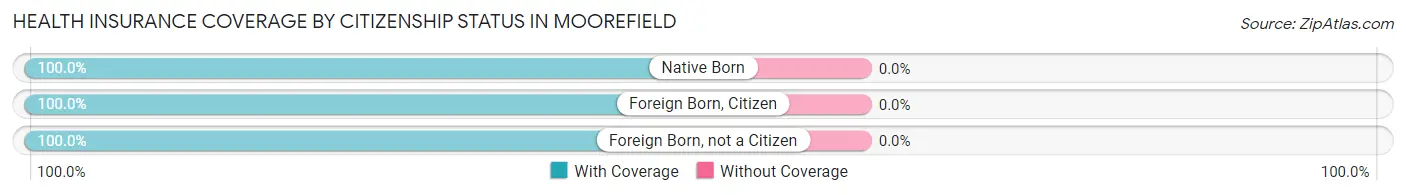
| Citizenship Status | With Coverage | Without Coverage |
| Native Born | 64 (100.0%) | 0 (0.0%) |
| Foreign Born, Citizen | 381 (100.0%) | 0 (0.0%) |
| Foreign Born, not a Citizen | 247 (100.0%) | 0 (0.0%) |
Health Insurance Coverage by Household Income in Moorefield
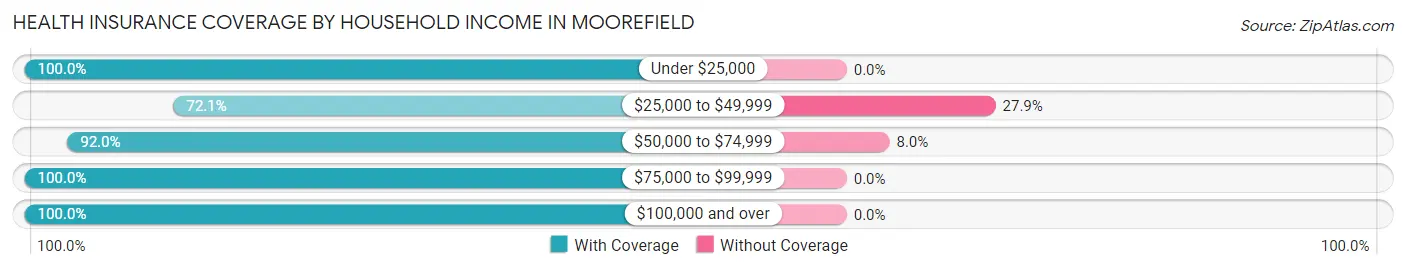
| Household Income | With Coverage | Without Coverage |
| Under $25,000 | 297 (100.0%) | 0 (0.0%) |
| $25,000 to $49,999 | 608 (72.1%) | 235 (27.9%) |
| $50,000 to $74,999 | 528 (92.0%) | 46 (8.0%) |
| $75,000 to $99,999 | 590 (100.0%) | 0 (0.0%) |
| $100,000 and over | 542 (100.0%) | 0 (0.0%) |
Public vs Private Health Insurance Coverage by Age in Moorefield
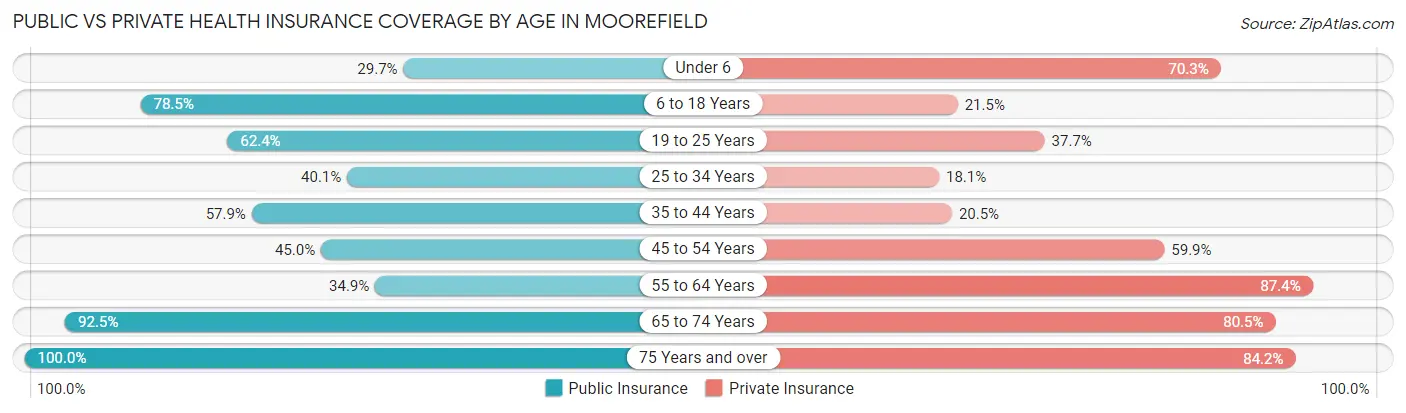
| Age Bracket | Public Insurance | Private Insurance |
| Under 6 | 19 (29.7%) | 45 (70.3%) |
| 6 to 18 Years | 299 (78.5%) | 82 (21.5%) |
| 19 to 25 Years | 154 (62.4%) | 93 (37.7%) |
| 25 to 34 Years | 169 (40.1%) | 76 (18.0%) |
| 35 to 44 Years | 280 (57.9%) | 99 (20.4%) |
| 45 to 54 Years | 139 (45.0%) | 185 (59.9%) |
| 55 to 64 Years | 94 (34.9%) | 235 (87.4%) |
| 65 to 74 Years | 492 (92.5%) | 428 (80.4%) |
| 75 Years and over | 139 (100.0%) | 117 (84.2%) |
| Total | 1,785 (62.7%) | 1,360 (47.8%) |
Disability Status by Sex by Age in Moorefield
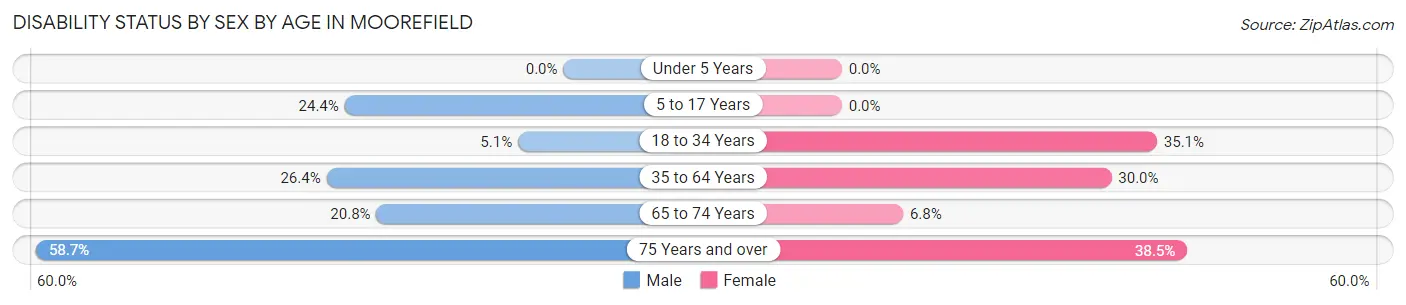
| Age Bracket | Male | Female |
| Under 5 Years | 0 (0.0%) | 0 (0.0%) |
| 5 to 17 Years | 38 (24.4%) | 0 (0.0%) |
| 18 to 34 Years | 22 (5.1%) | 93 (35.1%) |
| 35 to 64 Years | 129 (26.4%) | 172 (30.0%) |
| 65 to 74 Years | 71 (20.8%) | 13 (6.8%) |
| 75 Years and over | 74 (58.7%) | 5 (38.5%) |
Disability Class by Sex by Age in Moorefield
Disability Class: Hearing Difficulty
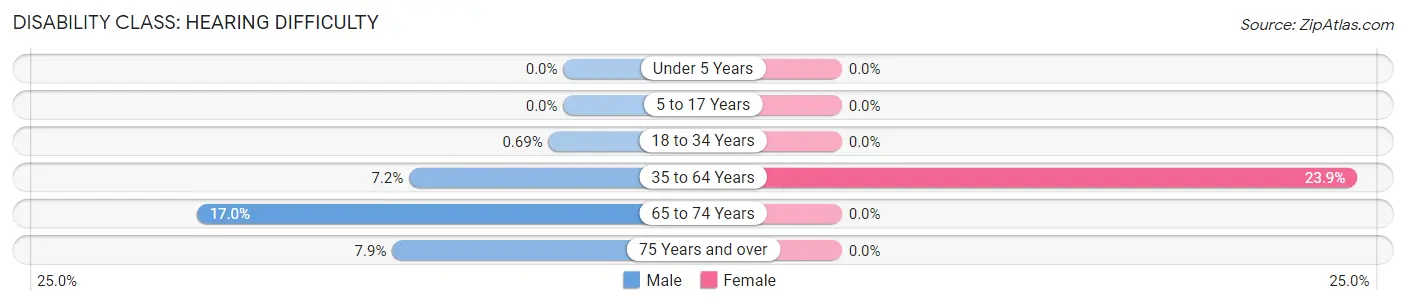
| Age Bracket | Male | Female |
| Under 5 Years | 0 (0.0%) | 0 (0.0%) |
| 5 to 17 Years | 0 (0.0%) | 0 (0.0%) |
| 18 to 34 Years | 3 (0.7%) | 0 (0.0%) |
| 35 to 64 Years | 35 (7.2%) | 137 (23.9%) |
| 65 to 74 Years | 58 (17.0%) | 0 (0.0%) |
| 75 Years and over | 10 (7.9%) | 0 (0.0%) |
Disability Class: Vision Difficulty
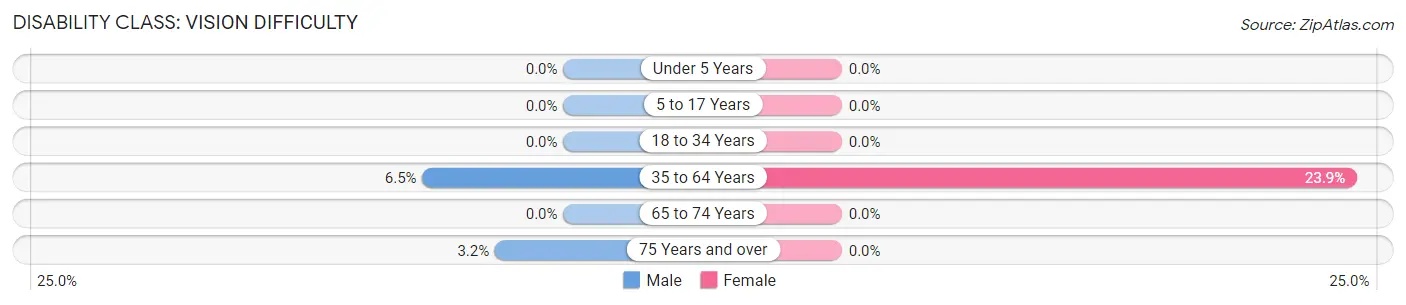
| Age Bracket | Male | Female |
| Under 5 Years | 0 (0.0%) | 0 (0.0%) |
| 5 to 17 Years | 0 (0.0%) | 0 (0.0%) |
| 18 to 34 Years | 0 (0.0%) | 0 (0.0%) |
| 35 to 64 Years | 32 (6.5%) | 137 (23.9%) |
| 65 to 74 Years | 0 (0.0%) | 0 (0.0%) |
| 75 Years and over | 4 (3.2%) | 0 (0.0%) |
Disability Class: Cognitive Difficulty
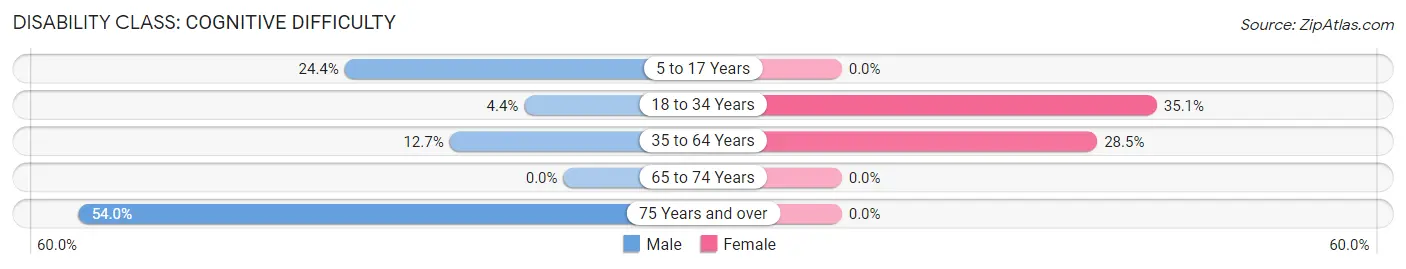
| Age Bracket | Male | Female |
| 5 to 17 Years | 38 (24.4%) | 0 (0.0%) |
| 18 to 34 Years | 19 (4.4%) | 93 (35.1%) |
| 35 to 64 Years | 62 (12.7%) | 163 (28.4%) |
| 65 to 74 Years | 0 (0.0%) | 0 (0.0%) |
| 75 Years and over | 68 (54.0%) | 0 (0.0%) |
Disability Class: Ambulatory Difficulty
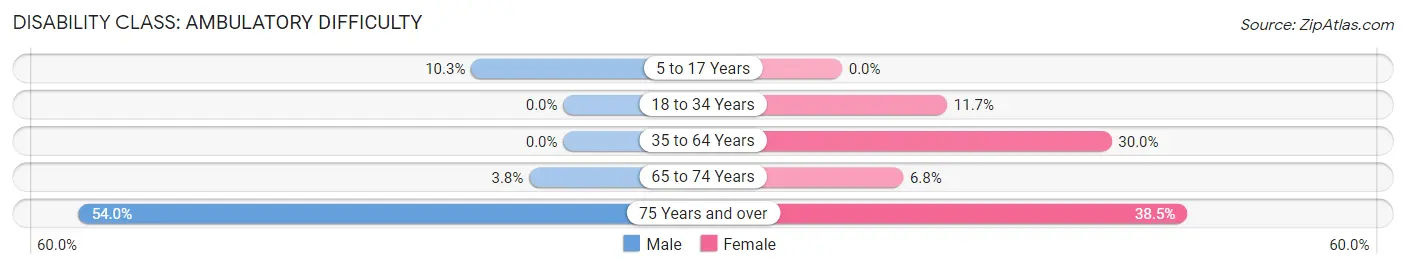
| Age Bracket | Male | Female |
| 5 to 17 Years | 16 (10.3%) | 0 (0.0%) |
| 18 to 34 Years | 0 (0.0%) | 31 (11.7%) |
| 35 to 64 Years | 0 (0.0%) | 172 (30.0%) |
| 65 to 74 Years | 13 (3.8%) | 13 (6.8%) |
| 75 Years and over | 68 (54.0%) | 5 (38.5%) |
Disability Class: Self-Care Difficulty
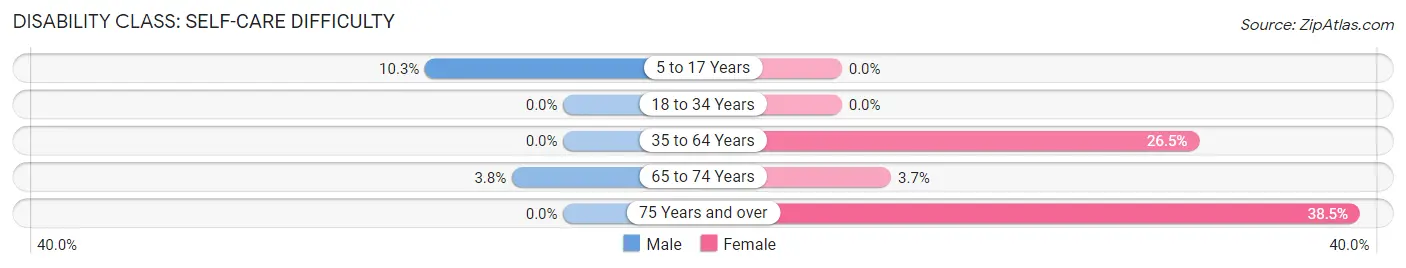
| Age Bracket | Male | Female |
| 5 to 17 Years | 16 (10.3%) | 0 (0.0%) |
| 18 to 34 Years | 0 (0.0%) | 0 (0.0%) |
| 35 to 64 Years | 0 (0.0%) | 152 (26.5%) |
| 65 to 74 Years | 13 (3.8%) | 7 (3.7%) |
| 75 Years and over | 0 (0.0%) | 5 (38.5%) |
Technology Access in Moorefield
Computing Device Access in Moorefield
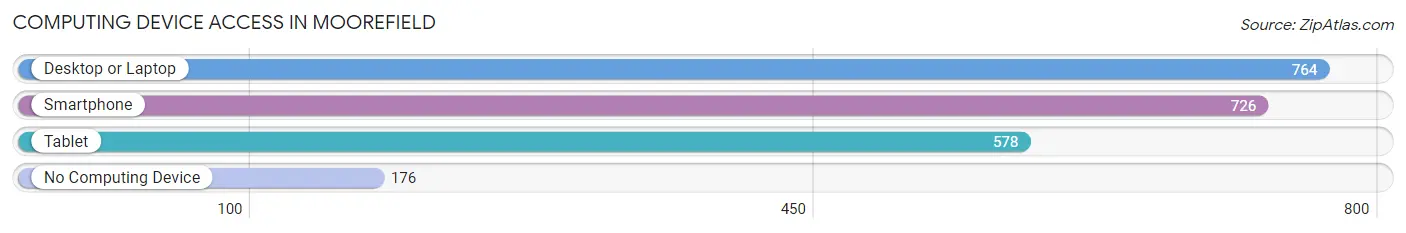
| Device Type | # Households | % Households |
| Desktop or Laptop | 764 | 68.8% |
| Smartphone | 726 | 65.4% |
| Tablet | 578 | 52.1% |
| No Computing Device | 176 | 15.9% |
| Total | 1,110 | 100.0% |
Internet Access in Moorefield
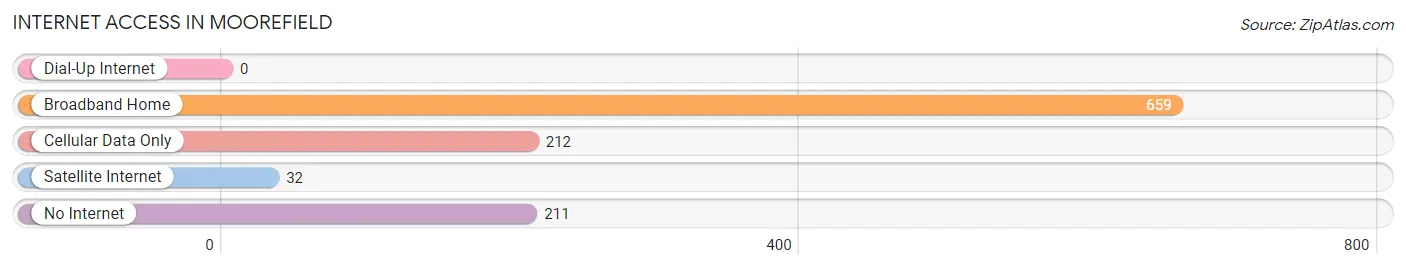
| Internet Type | # Households | % Households |
| Dial-Up Internet | 0 | 0.0% |
| Broadband Home | 659 | 59.4% |
| Cellular Data Only | 212 | 19.1% |
| Satellite Internet | 32 | 2.9% |
| No Internet | 211 | 19.0% |
| Total | 1,110 | 100.0% |
Moorefield Summary
Moorefield is a town located in Hardy County, West Virginia, United States. It is the county seat of Hardy County and is located along the South Branch of the Potomac River. The population was 2,544 at the 2010 census.
History
Moorefield was founded in 1777 by Colonel Joseph Moore, a Revolutionary War veteran. The town was originally known as Moore's Fort, and was the site of a skirmish between the British and American forces during the Revolutionary War. The town was later renamed Moorefield in honor of Colonel Moore.
In the early 19th century, Moorefield was a major stop on the Northwestern Turnpike, a major transportation route connecting the Shenandoah Valley to the Ohio River Valley. The town was also a major stop on the Baltimore and Ohio Railroad, which connected the town to the rest of the country.
Geography
Moorefield is located at 39°3′17″N 78°54′45″W (39.054722, -78.9125). According to the United States Census Bureau, the town has a total area of 1.2 square miles (3.1 km2), all of it land.
Economy
The economy of Moorefield is largely based on agriculture and tourism. The town is home to several farms, as well as a number of small businesses. Tourism is also an important part of the local economy, with visitors coming to the area to enjoy the nearby South Branch of the Potomac River and the nearby George Washington National Forest.
Demographics
As of the census of 2010, there were 2,544 people, 1,072 households, and 645 families residing in the town. The population density was 2,093.3 people per square mile (808.3/km2). There were 1,183 housing units at an average density of 976.7 per square mile (377.3/km2). The racial makeup of the town was 95.2% White, 1.2% African American, 0.2% Native American, 0.4% Asian, 0.1% Pacific Islander, 0.7% from other races, and 2.2% from two or more races. Hispanic or Latino of any race were 1.7% of the population.
There were 1,072 households, out of which 28.2% had children under the age of 18 living with them, 44.2% were married couples living together, 13.2% had a female householder with no husband present, and 37.2% were non-families. 32.2% of all households were made up of individuals, and 14.2% had someone living alone who was 65 years of age or older. The average household size was 2.30 and the average family size was 2.90.
In the town, the population was spread out, with 23.2% under the age of 18, 8.2% from 18 to 24, 27.2% from 25 to 44, 24.2% from 45 to 64, and 17.2% who were 65 years of age or older. The median age was 38 years. For every 100 females, there were 91.2 males. For every 100 females age 18 and over, there were 87.2 males.
The median income for a household in the town was $30,938, and the median income for a family was $37,917. Males had a median income of $30,000 versus $20,000 for females. The per capita income for the town was $17,845. About 11.2% of families and 14.2% of the population were below the poverty line, including 19.2% of those under age 18 and 11.2% of those age 65 or over.
Common Questions
What is the Total Population of Moorefield?
Total Population of Moorefield is 2,846.
What is the Total Male Population of Moorefield?
Total Male Population of Moorefield is 1,598.
What is the Total Female Population of Moorefield?
Total Female Population of Moorefield is 1,248.
What is the Ratio of Males per 100 Females in Moorefield?
There are 128.04 Males per 100 Females in Moorefield.
What is the Ratio of Females per 100 Males in Moorefield?
There are 78.10 Females per 100 Males in Moorefield.
What is the Median Population Age in Moorefield?
Median Population Age in Moorefield is 43.6 Years.
What is the Average Family Size in Moorefield
Average Family Size in Moorefield is 2.7 People.
What is the Average Household Size in Moorefield
Average Household Size in Moorefield is 2.6 People.
What is Per Capita Income in Moorefield?
Per Capita income in Moorefield is $40,327.
What is the Median Family Income in Moorefield?
Median Family Income in Moorefield is $59,966.
What is the Median Household income in Moorefield?
Median Household Income in Moorefield is $51,985.
What is Income or Wage Gap in Moorefield?
Income or Wage Gap in Moorefield is 32.6%.
Women in Moorefield earn 67.4 cents for every dollar earned by a man.
What is Inequality or Gini Index in Moorefield?
Inequality or Gini Index in Moorefield is 0.54.
How Large is the Labor Force in Moorefield?
There are 1,489 People in the Labor Forcein in Moorefield.
What is the Percentage of People in the Labor Force in Moorefield?
58.5% of People are in the Labor Force in Moorefield.
What is the Unemployment Rate in Moorefield?
Unemployment Rate in Moorefield is 4.6%.