Italian vs Chilean 4 or more Vehicles in Household
COMPARE
Italian
Chilean
4 or more Vehicles in Household
4 or more Vehicles in Household Comparison
Italians
Chileans
6.6%
4 OR MORE VEHICLES IN HOUSEHOLD
84.5/ 100
METRIC RATING
138th/ 347
METRIC RANK
6.4%
4 OR MORE VEHICLES IN HOUSEHOLD
61.2/ 100
METRIC RATING
163rd/ 347
METRIC RANK
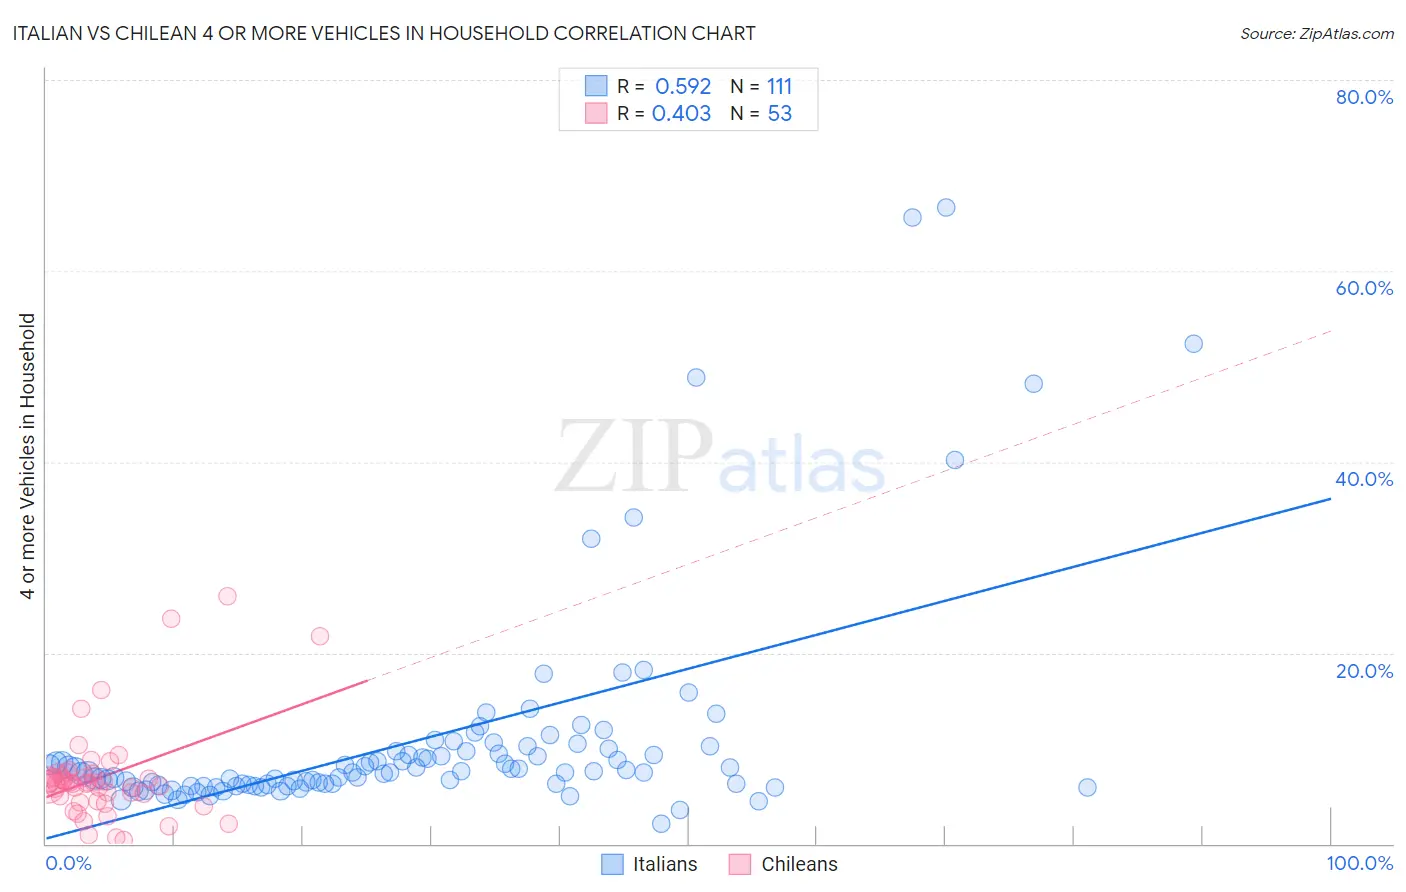
Italian vs Chilean 4 or more Vehicles in Household Correlation Chart
The statistical analysis conducted on geographies consisting of 571,215,304 people shows a substantial positive correlation between the proportion of Italians and percentage of households with 4 or more vehicles available in the United States with a correlation coefficient (R) of 0.592 and weighted average of 6.6%. Similarly, the statistical analysis conducted on geographies consisting of 255,549,782 people shows a moderate positive correlation between the proportion of Chileans and percentage of households with 4 or more vehicles available in the United States with a correlation coefficient (R) of 0.403 and weighted average of 6.4%, a difference of 3.1%.
4 or more Vehicles in Household Correlation Summary
| Measurement | Italian | Chilean |
| Minimum | 2.1% | 0.37% |
| Maximum | 66.7% | 25.9% |
| Range | 64.5% | 25.6% |
| Mean | 10.9% | 7.0% |
| Median | 7.5% | 6.4% |
| Interquartile 25% (IQ1) | 6.1% | 4.8% |
| Interquartile 75% (IQ3) | 9.7% | 7.2% |
| Interquartile Range (IQR) | 3.6% | 2.4% |
| Standard Deviation (Sample) | 11.4% | 5.0% |
| Standard Deviation (Population) | 11.3% | 4.9% |
Similar Demographics by 4 or more Vehicles in Household
Demographics Similar to Italians by 4 or more Vehicles in Household
In terms of 4 or more vehicles in household, the demographic groups most similar to Italians are French Canadian (6.6%, a difference of 0.16%), Luxembourger (6.6%, a difference of 0.36%), Tohono O'odham (6.6%, a difference of 0.43%), Jordanian (6.6%, a difference of 0.43%), and Ottawa (6.6%, a difference of 0.46%).
| Demographics | Rating | Rank | 4 or more Vehicles in Household |
| Maltese | 88.4 /100 | #131 | Excellent 6.7% |
| Immigrants | Netherlands | 87.8 /100 | #132 | Excellent 6.6% |
| Armenians | 86.9 /100 | #133 | Excellent 6.6% |
| Ottawa | 86.9 /100 | #134 | Excellent 6.6% |
| Tohono O'odham | 86.7 /100 | #135 | Excellent 6.6% |
| Luxembourgers | 86.4 /100 | #136 | Excellent 6.6% |
| French Canadians | 85.4 /100 | #137 | Excellent 6.6% |
| Italians | 84.5 /100 | #138 | Excellent 6.6% |
| Jordanians | 82.1 /100 | #139 | Excellent 6.6% |
| Slavs | 81.6 /100 | #140 | Excellent 6.6% |
| Australians | 80.8 /100 | #141 | Excellent 6.6% |
| Immigrants | Iraq | 79.4 /100 | #142 | Good 6.5% |
| Immigrants | Canada | 78.6 /100 | #143 | Good 6.5% |
| Immigrants | North America | 78.5 /100 | #144 | Good 6.5% |
| Croatians | 77.8 /100 | #145 | Good 6.5% |
Demographics Similar to Chileans by 4 or more Vehicles in Household
In terms of 4 or more vehicles in household, the demographic groups most similar to Chileans are Hungarian (6.4%, a difference of 0.010%), Immigrants from Peru (6.4%, a difference of 0.14%), Immigrants from Pakistan (6.4%, a difference of 0.22%), Immigrants from Cameroon (6.4%, a difference of 0.34%), and Immigrants from Denmark (6.4%, a difference of 0.35%).
| Demographics | Rating | Rank | 4 or more Vehicles in Household |
| Iranians | 69.9 /100 | #156 | Good 6.5% |
| Peruvians | 69.4 /100 | #157 | Good 6.5% |
| Zimbabweans | 67.1 /100 | #158 | Good 6.4% |
| Indians (Asian) | 66.3 /100 | #159 | Good 6.4% |
| Palestinians | 65.8 /100 | #160 | Good 6.4% |
| Immigrants | Cameroon | 64.4 /100 | #161 | Good 6.4% |
| Immigrants | Pakistan | 63.2 /100 | #162 | Good 6.4% |
| Chileans | 61.2 /100 | #163 | Good 6.4% |
| Hungarians | 61.1 /100 | #164 | Good 6.4% |
| Immigrants | Peru | 59.8 /100 | #165 | Average 6.4% |
| Immigrants | Denmark | 57.8 /100 | #166 | Average 6.4% |
| Poles | 56.9 /100 | #167 | Average 6.4% |
| Lebanese | 55.8 /100 | #168 | Average 6.4% |
| Estonians | 55.1 /100 | #169 | Average 6.4% |
| Immigrants | Syria | 52.8 /100 | #170 | Average 6.3% |