Italian vs German 4 or more Vehicles in Household

COMPARE

Italian
Race
Ancestry
AfghanAfricanAlaska NativeAlaskan AthabascanAlbanianAleutAlsatianAmericanApacheArabArapahoArgentineanArmenianAssyrian/Chaldean/SyriacAustralianAustrianBahamianBangladeshiBarbadianBasqueBelgianBelizeanBermudanBhutaneseBlackfeetBolivianBrazilianBritishBritish West IndianBulgarianBurmeseCajunCambodianCanadianCape VerdeanCarpatho RusynCelticCentral AmericanCentral American IndianCherokeeCheyenneChickasawChileanChineseChippewaChoctawColombianColvilleComancheCosta RicanCreeCreekCroatianCrowCubanCypriotCzechCzechoslovakianDanishDelawareDominicanDutchDutch West IndianEastern EuropeanEcuadorianEgyptianEnglishEstonianEthiopianEuropeanFijianFilipinoFinnishFrenchFrench American IndianFrench CanadianGerman RussianGhanaianGreekGuamanian/ChamorroGuatemalanGuyaneseHaitianHmongHonduranHopiHoumaHungarianIcelanderIndian (Asian)IndonesianInupiatIranianIraqiIrishIroquoisIsraeliItalianJamaicanJapaneseJordanianKenyanKiowaKoreanLaotianLatvianLebaneseLiberianLithuanianLumbeeLuxembourgerMacedonianMalaysianMalteseMarshalleseMenomineeMexicanMexican American IndianMongolianMoroccanNative HawaiianNavajoNepaleseNew ZealanderNicaraguanNigerianNorthern EuropeanNorwegianOkinawanOsageOttawaPaiutePakistaniPalestinianPanamanianParaguayanPennsylvania GermanPeruvianPimaPolishPortuguesePotawatomiPuebloPuerto RicanPuget Sound SalishRomanianRussianSalvadoranSamoanScandinavianScotch-IrishScottishSeminoleSenegaleseSerbianShoshoneSierra LeoneanSiouxSlavicSlovakSloveneSomaliSouth AfricanSouth AmericanSouth American IndianSoviet UnionSpaniardSpanishSpanish AmericanSpanish American IndianSri LankanSubsaharan AfricanSudaneseSwedishSwissSyrianTaiwaneseThaiTlingit-HaidaTohono O'OdhamTonganTrinidadian and TobagonianTsimshianTurkishU.S. Virgin IslanderUgandanUkrainianUruguayanUteVenezuelanVietnameseWelshWest IndianYakamaYaquiYugoslavianYumanYup'ikZimbabwean
Immigration
NonimmigrantsImmigrantsAfghanistanAfricaAlbaniaArgentinaArmeniaAsiaAustraliaAustriaBahamasBangladeshBarbadosBelarusBelgiumBelizeBoliviaBosnia and HerzegovinaBrazilBulgariaBurma/MyanmarCabo VerdeCambodiaCameroonCanadaCaribbeanCentral AmericaChileChinaColombiaCongoCosta RicaCroatiaCubaCzechoslovakiaDenmarkDominicaDominican RepublicEastern AfricaEastern AsiaEastern EuropeEcuadorEgyptEl SalvadorEnglandEritreaEthiopiaEuropeFijiFranceGermanyGhanaGreeceGrenadaGuatemalaGuyanaHaitiHondurasHong KongHungaryIndiaIndonesiaIranIraqIrelandIsraelItalyJamaicaJapanJordanKazakhstanKenyaKoreaKuwaitLaosLatin AmericaLatviaLebanonLiberiaLithuaniaMalaysiaMexicoMicronesiaMiddle AfricaMoldovaMoroccoNepalNetherlandsNicaraguaNigeriaNorth AmericaNorth MacedoniaNorthern AfricaNorthern EuropeNorwayOceaniaPakistanPanamaPeruPhilippinesPolandPortugalRomaniaRussiaSaudi ArabiaScotlandSenegalSerbiaSierra LeoneSingaporeSomaliaSouth AfricaSouth AmericaSouth Central AsiaSouth Eastern AsiaSouthern EuropeSpainSri LankaSt. Vincent and the GrenadinesSudanSwedenSwitzerlandSyriaTaiwanThailandTrinidad and TobagoTurkeyUgandaUkraineUruguayUzbekistanVenezuelaVietnamWest IndiesWestern AfricaWestern AsiaWestern EuropeYemenZaireZimbabweAzores
German
Race
Ancestry
AfghanAfricanAlaska NativeAlaskan AthabascanAlbanianAleutAlsatianAmericanApacheArabArapahoArgentineanArmenianAssyrian/Chaldean/SyriacAustralianAustrianBahamianBangladeshiBarbadianBasqueBelgianBelizeanBermudanBhutaneseBlackfeetBolivianBrazilianBritishBritish West IndianBulgarianBurmeseCajunCambodianCanadianCape VerdeanCarpatho RusynCelticCentral AmericanCentral American IndianCherokeeCheyenneChickasawChileanChineseChippewaChoctawColombianColvilleComancheCosta RicanCreeCreekCroatianCrowCubanCypriotCzechCzechoslovakianDanishDelawareDominicanDutchDutch West IndianEastern EuropeanEcuadorianEgyptianEnglishEstonianEthiopianEuropeanFijianFilipinoFinnishFrenchFrench American IndianFrench CanadianGermanGerman RussianGhanaianGreekGuamanian/ChamorroGuatemalanGuyaneseHaitianHmongHonduranHopiHoumaHungarianIcelanderIndian (Asian)IndonesianInupiatIranianIraqiIrishIroquoisIsraeliJamaicanJapaneseJordanianKenyanKiowaKoreanLaotianLatvianLebaneseLiberianLithuanianLumbeeLuxembourgerMacedonianMalaysianMalteseMarshalleseMenomineeMexicanMexican American IndianMongolianMoroccanNative HawaiianNavajoNepaleseNew ZealanderNicaraguanNigerianNorthern EuropeanNorwegianOkinawanOsageOttawaPaiutePakistaniPalestinianPanamanianParaguayanPennsylvania GermanPeruvianPimaPolishPortuguesePotawatomiPuebloPuerto RicanPuget Sound SalishRomanianRussianSalvadoranSamoanScandinavianScotch-IrishScottishSeminoleSenegaleseSerbianShoshoneSierra LeoneanSiouxSlavicSlovakSloveneSomaliSouth AfricanSouth AmericanSouth American IndianSoviet UnionSpaniardSpanishSpanish AmericanSpanish American IndianSri LankanSubsaharan AfricanSudaneseSwedishSwissSyrianTaiwaneseThaiTlingit-HaidaTohono O'OdhamTonganTrinidadian and TobagonianTsimshianTurkishU.S. Virgin IslanderUgandanUkrainianUruguayanUteVenezuelanVietnameseWelshWest IndianYakamaYaquiYugoslavianYumanYup'ikZimbabwean
Immigration
NonimmigrantsImmigrantsAfghanistanAfricaAlbaniaArgentinaArmeniaAsiaAustraliaAustriaBahamasBangladeshBarbadosBelarusBelgiumBelizeBoliviaBosnia and HerzegovinaBrazilBulgariaBurma/MyanmarCabo VerdeCambodiaCameroonCanadaCaribbeanCentral AmericaChileChinaColombiaCongoCosta RicaCroatiaCubaCzechoslovakiaDenmarkDominicaDominican RepublicEastern AfricaEastern AsiaEastern EuropeEcuadorEgyptEl SalvadorEnglandEritreaEthiopiaEuropeFijiFranceGermanyGhanaGreeceGrenadaGuatemalaGuyanaHaitiHondurasHong KongHungaryIndiaIndonesiaIranIraqIrelandIsraelItalyJamaicaJapanJordanKazakhstanKenyaKoreaKuwaitLaosLatin AmericaLatviaLebanonLiberiaLithuaniaMalaysiaMexicoMicronesiaMiddle AfricaMoldovaMoroccoNepalNetherlandsNicaraguaNigeriaNorth AmericaNorth MacedoniaNorthern AfricaNorthern EuropeNorwayOceaniaPakistanPanamaPeruPhilippinesPolandPortugalRomaniaRussiaSaudi ArabiaScotlandSenegalSerbiaSierra LeoneSingaporeSomaliaSouth AfricaSouth AmericaSouth Central AsiaSouth Eastern AsiaSouthern EuropeSpainSri LankaSt. Vincent and the GrenadinesSudanSwedenSwitzerlandSyriaTaiwanThailandTrinidad and TobagoTurkeyUgandaUkraineUruguayUzbekistanVenezuelaVietnamWest IndiesWestern AfricaWestern AsiaWestern EuropeYemenZaireZimbabweAzores
4 or more Vehicles in Household
Income
Poverty
Unemployment
Labor Participation
Family Structure
Vehicle Availability
Education Level
Disability

4 or more Vehicles in Household Comparison

Italians

Germans

Excellent
Exceptional
6.6%
4 OR MORE VEHICLES IN HOUSEHOLD
84.5/ 100
METRIC RATING
138th/ 347
METRIC RANK
7.5%
4 OR MORE VEHICLES IN HOUSEHOLD
99.9/ 100
METRIC RATING
69th/ 347
METRIC RANK

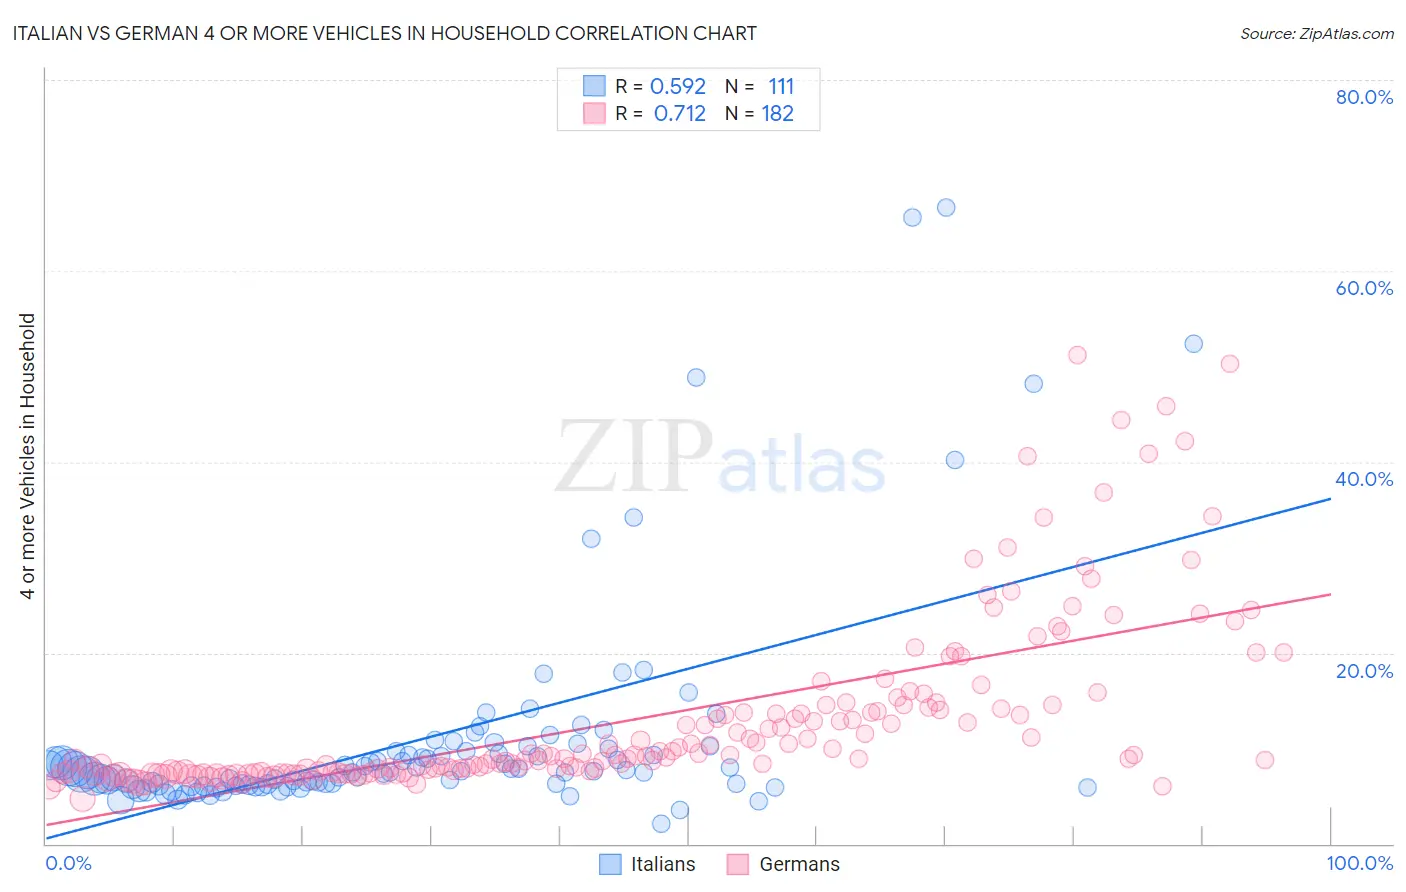
Italian vs German 4 or more Vehicles in Household Correlation Chart

The statistical analysis conducted on geographies consisting of 571,215,304 people shows a substantial positive correlation between the proportion of Italians and percentage of households with 4 or more vehicles available in the United States with a correlation coefficient (R) of 0.592 and weighted average of 6.6%. Similarly, the statistical analysis conducted on geographies consisting of 576,875,838 people shows a strong positive correlation between the proportion of Germans and percentage of households with 4 or more vehicles available in the United States with a correlation coefficient (R) of 0.712 and weighted average of 7.5%, a difference of 13.0%.
Italian vs German 4 or more Vehicles in Household

4 or more Vehicles in Household Correlation Summary

MeasurementItalianGerman
Minimum2.1%4.7%
Maximum66.7%51.2%
Range64.5%46.6%
Mean10.9%13.0%
Median7.5%9.0%
Interquartile 25% (IQ1)6.1%7.5%
Interquartile 75% (IQ3)9.7%14.1%
Interquartile Range (IQR)3.6%6.6%
Standard Deviation (Sample)11.4%9.1%
Standard Deviation (Population)11.3%9.0%

Similar Demographics by 4 or more Vehicles in Household

Demographics Similar to Italians by 4 or more Vehicles in Household

In terms of 4 or more vehicles in household, the demographic groups most similar to Italians are French Canadian (6.6%, a difference of 0.16%), Luxembourger (6.6%, a difference of 0.36%), Tohono O'odham (6.6%, a difference of 0.43%), Jordanian (6.6%, a difference of 0.43%), and Ottawa (6.6%, a difference of 0.46%).
DemographicsRating | Rank4 or more Vehicles in Household
Maltese
88.4
/100
|
#131
Excellent
6.7%
Immigrants | Netherlands
87.8
/100
|
#132
Excellent
6.6%
Armenians
86.9
/100
|
#133
Excellent
6.6%
Ottawa
86.9
/100
|
#134
Excellent
6.6%
Tohono O'odham
86.7
/100
|
#135
Excellent
6.6%
Luxembourgers
86.4
/100
|
#136
Excellent
6.6%
French Canadians
85.4
/100
|
#137
Excellent
6.6%
Italians
84.5
/100
|
#138
Excellent
6.6%
Jordanians
82.1
/100
|
#139
Excellent
6.6%
Slavs
81.6
/100
|
#140
Excellent
6.6%
Australians
80.8
/100
|
#141
Excellent
6.6%
Immigrants | Iraq
79.4
/100
|
#142
Good
6.5%
Immigrants | Canada
78.6
/100
|
#143
Good
6.5%
Immigrants | North America
78.5
/100
|
#144
Good
6.5%
Croatians
77.8
/100
|
#145
Good
6.5%

Demographics Similar to Germans by 4 or more Vehicles in Household

In terms of 4 or more vehicles in household, the demographic groups most similar to Germans are Scottish (7.4%, a difference of 0.070%), Chickasaw (7.4%, a difference of 0.20%), Scotch-Irish (7.4%, a difference of 0.50%), Welsh (7.5%, a difference of 0.59%), and Portuguese (7.4%, a difference of 0.60%).
DemographicsRating | Rank4 or more Vehicles in Household
Chippewa
100.0
/100
|
#62
Exceptional
7.6%
Immigrants | Micronesia
100.0
/100
|
#63
Exceptional
7.6%
Bangladeshis
100.0
/100
|
#64
Exceptional
7.6%
Immigrants | Azores
100.0
/100
|
#65
Exceptional
7.5%
Immigrants | Taiwan
99.9
/100
|
#66
Exceptional
7.5%
Americans
99.9
/100
|
#67
Exceptional
7.5%
Welsh
99.9
/100
|
#68
Exceptional
7.5%
Germans
99.9
/100
|
#69
Exceptional
7.5%
Scottish
99.9
/100
|
#70
Exceptional
7.4%
Chickasaw
99.9
/100
|
#71
Exceptional
7.4%
Scotch-Irish
99.9
/100
|
#72
Exceptional
7.4%
Portuguese
99.9
/100
|
#73
Exceptional
7.4%
Icelanders
99.9
/100
|
#74
Exceptional
7.4%
Immigrants | Cambodia
99.9
/100
|
#75
Exceptional
7.4%
Laotians
99.9
/100
|
#76
Exceptional
7.4%