Zip Codes with the Highest Percentage of Population Employed in Legal Services & Support in Leander, TX
RELATED REPORTS & OPTIONS
Legal Services & Support
Leander
Compare Zip Codes
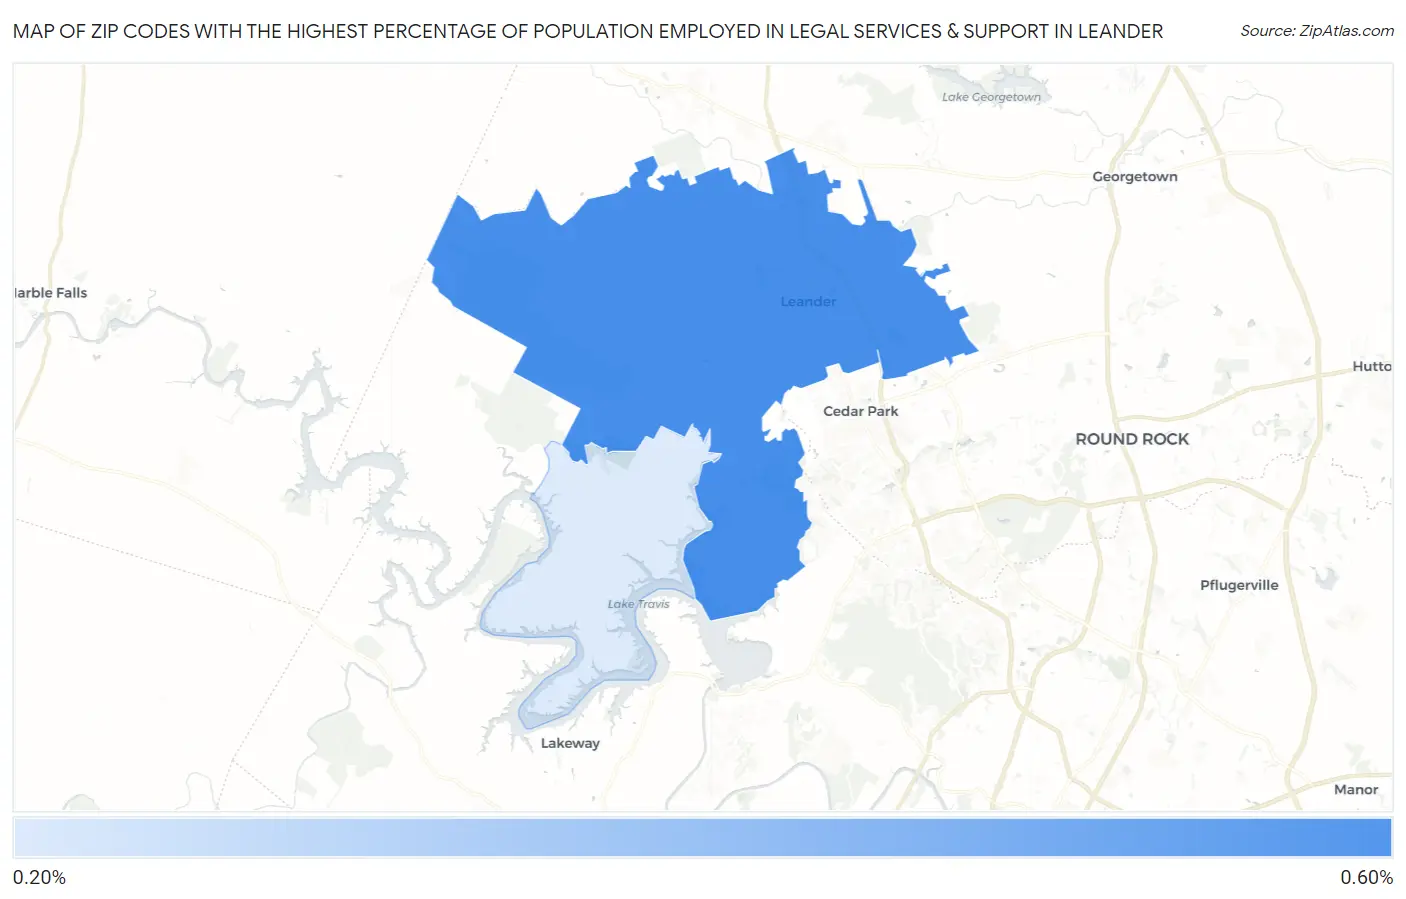
Map of Zip Codes with the Highest Percentage of Population Employed in Legal Services & Support in Leander
0.0%
0.60%
Zip Codes with the Highest Percentage of Population Employed in Legal Services & Support in Leander, TX
| Zip Code | % Employed | vs State | vs National | |
| 1. | 78641 | 0.55% | 1.0%(-0.462)#712 | 1.2%(-0.637)#12,090 |
| 2. | 78645 | 0.27% | 1.0%(-0.734)#944 | 1.2%(-0.910)#15,336 |
1
Common Questions
What are the Top Zip Codes with the Highest Percentage of Population Employed in Legal Services & Support in Leander, TX?
Top Zip Codes with the Highest Percentage of Population Employed in Legal Services & Support in Leander, TX are:
What zip code has the Highest Percentage of Population Employed in Legal Services & Support in Leander, TX?
78641 has the Highest Percentage of Population Employed in Legal Services & Support in Leander, TX with 0.55%.
What is the Percentage of Population Employed in Legal Services & Support in Leander, TX?
Percentage of Population Employed in Legal Services & Support in Leander is 0.57%.
What is the Percentage of Population Employed in Legal Services & Support in Texas?
Percentage of Population Employed in Legal Services & Support in Texas is 1.0%.
What is the Percentage of Population Employed in Legal Services & Support in the United States?
Percentage of Population Employed in Legal Services & Support in the United States is 1.2%.