Zip Codes with the Highest Percentage of Population Employed in Installation, Maintenance & Repair in Leander, TX
RELATED REPORTS & OPTIONS
Installation, Maintenance & Repair
Leander
Compare Zip Codes
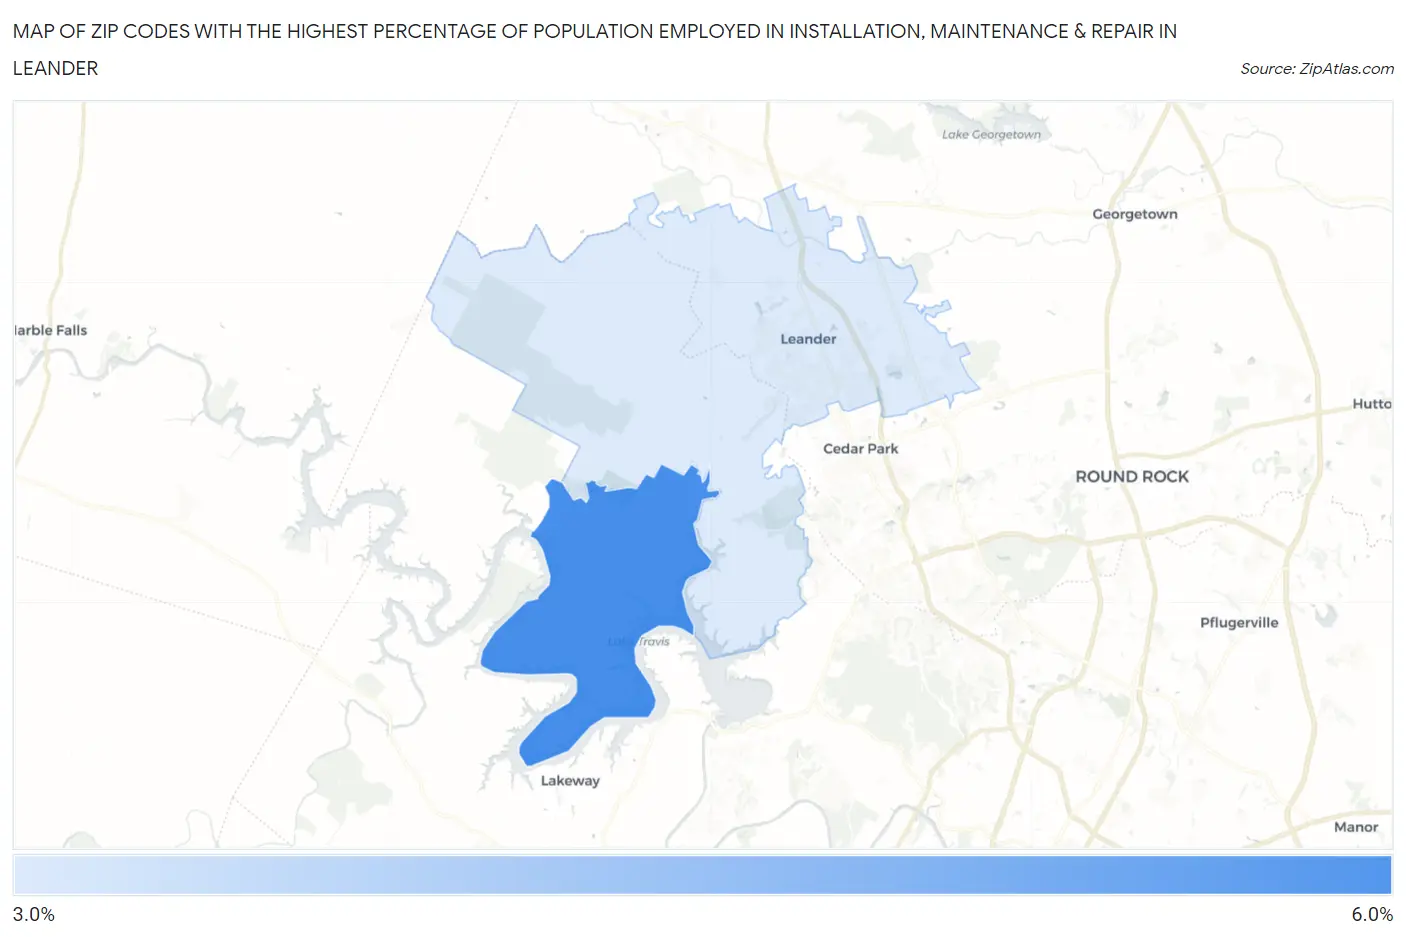
Map of Zip Codes with the Highest Percentage of Population Employed in Installation, Maintenance & Repair in Leander
0.0%
6.0%
Zip Codes with the Highest Percentage of Population Employed in Installation, Maintenance & Repair in Leander, TX
| Zip Code | % Employed | vs State | vs National | |
| 1. | 78645 | 5.0% | 3.4%(+1.62)#523 | 3.1%(+1.96)#8,645 |
| 2. | 78641 | 3.0% | 3.4%(-0.376)#1,056 | 3.1%(-0.041)#16,861 |
1
Common Questions
What are the Top Zip Codes with the Highest Percentage of Population Employed in Installation, Maintenance & Repair in Leander, TX?
Top Zip Codes with the Highest Percentage of Population Employed in Installation, Maintenance & Repair in Leander, TX are:
What zip code has the Highest Percentage of Population Employed in Installation, Maintenance & Repair in Leander, TX?
78645 has the Highest Percentage of Population Employed in Installation, Maintenance & Repair in Leander, TX with 5.0%.
What is the Percentage of Population Employed in Installation, Maintenance & Repair in Leander, TX?
Percentage of Population Employed in Installation, Maintenance & Repair in Leander is 2.7%.
What is the Percentage of Population Employed in Installation, Maintenance & Repair in Texas?
Percentage of Population Employed in Installation, Maintenance & Repair in Texas is 3.4%.
What is the Percentage of Population Employed in Installation, Maintenance & Repair in the United States?
Percentage of Population Employed in Installation, Maintenance & Repair in the United States is 3.1%.