Zip Codes with the Highest Percentage of Population with a Degree in Liberal Arts and History in Leander, TX
RELATED REPORTS & OPTIONS
Liberal Arts and History
Leander
Compare Zip Codes
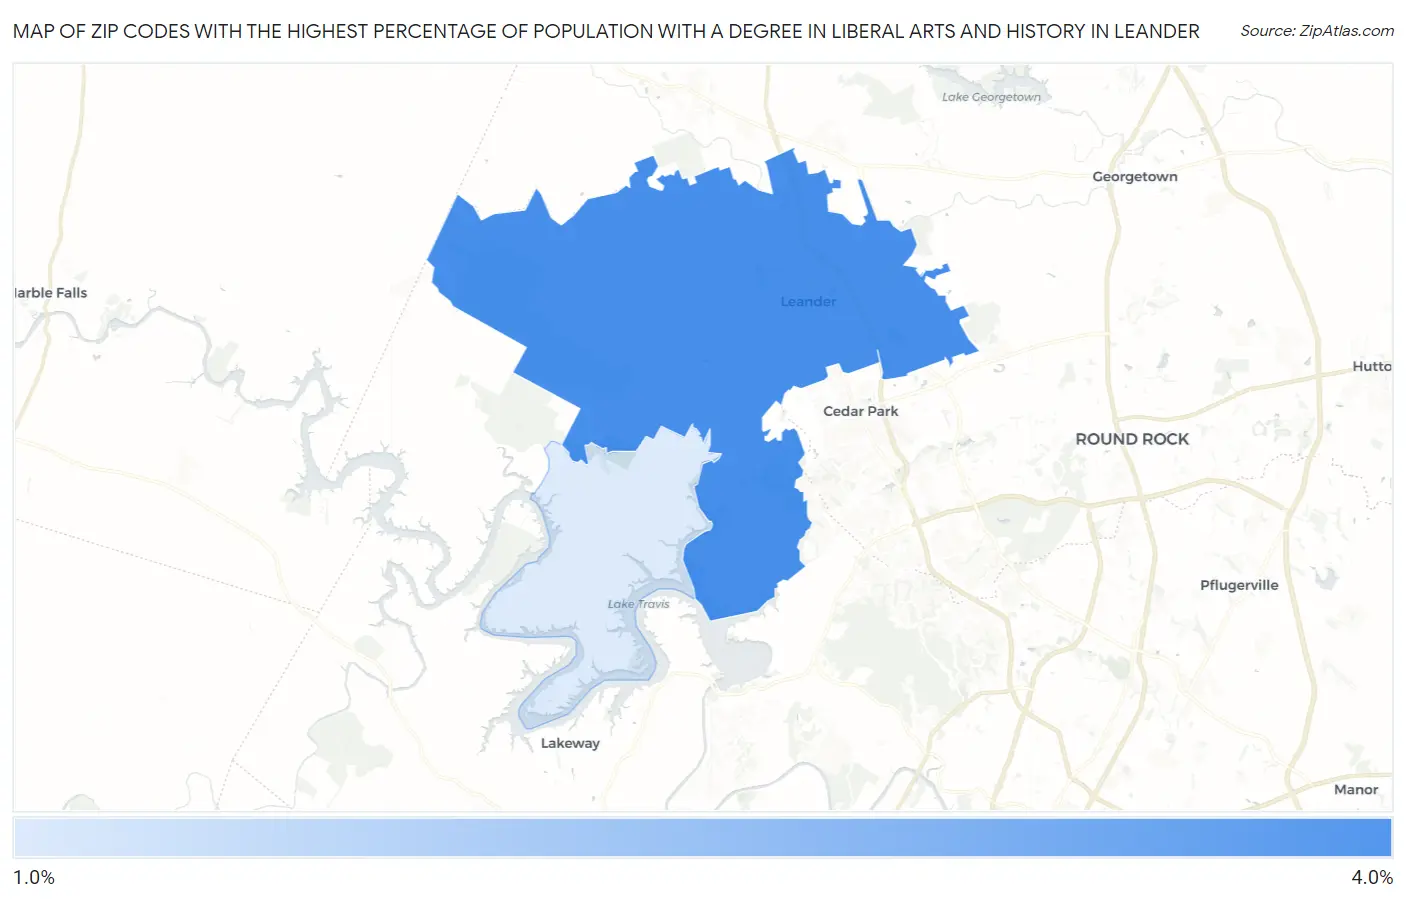
Map of Zip Codes with the Highest Percentage of Population with a Degree in Liberal Arts and History in Leander
0.0%
4.0%
Zip Codes with the Highest Percentage of Population with a Degree in Liberal Arts and History in Leander, TX
| Zip Code | % Graduates | vs State | vs National | |
| 1. | 78641 | 3.9% | 4.2%(-0.211)#797 | 4.9%(-0.932)#15,016 |
| 2. | 78645 | 1.1% | 4.2%(-3.09)#1,365 | 4.9%(-3.81)#23,281 |
1
Common Questions
What are the Top Zip Codes with the Highest Percentage of Population with a Degree in Liberal Arts and History in Leander, TX?
Top Zip Codes with the Highest Percentage of Population with a Degree in Liberal Arts and History in Leander, TX are:
What zip code has the Highest Percentage of Population with a Degree in Liberal Arts and History in Leander, TX?
78641 has the Highest Percentage of Population with a Degree in Liberal Arts and History in Leander, TX with 3.9%.
What is the Percentage of Population with a Degree in Liberal Arts and History in Leander, TX?
Percentage of Population with a Degree in Liberal Arts and History in Leander is 3.4%.
What is the Percentage of Population with a Degree in Liberal Arts and History in Texas?
Percentage of Population with a Degree in Liberal Arts and History in Texas is 4.2%.
What is the Percentage of Population with a Degree in Liberal Arts and History in the United States?
Percentage of Population with a Degree in Liberal Arts and History in the United States is 4.9%.