Zip Codes with the Highest Percentage of Population Employed in Firefighting & Prevention in Maryland
RELATED REPORTS & OPTIONS
Firefighting & Prevention
Maryland
Compare Zip Codes
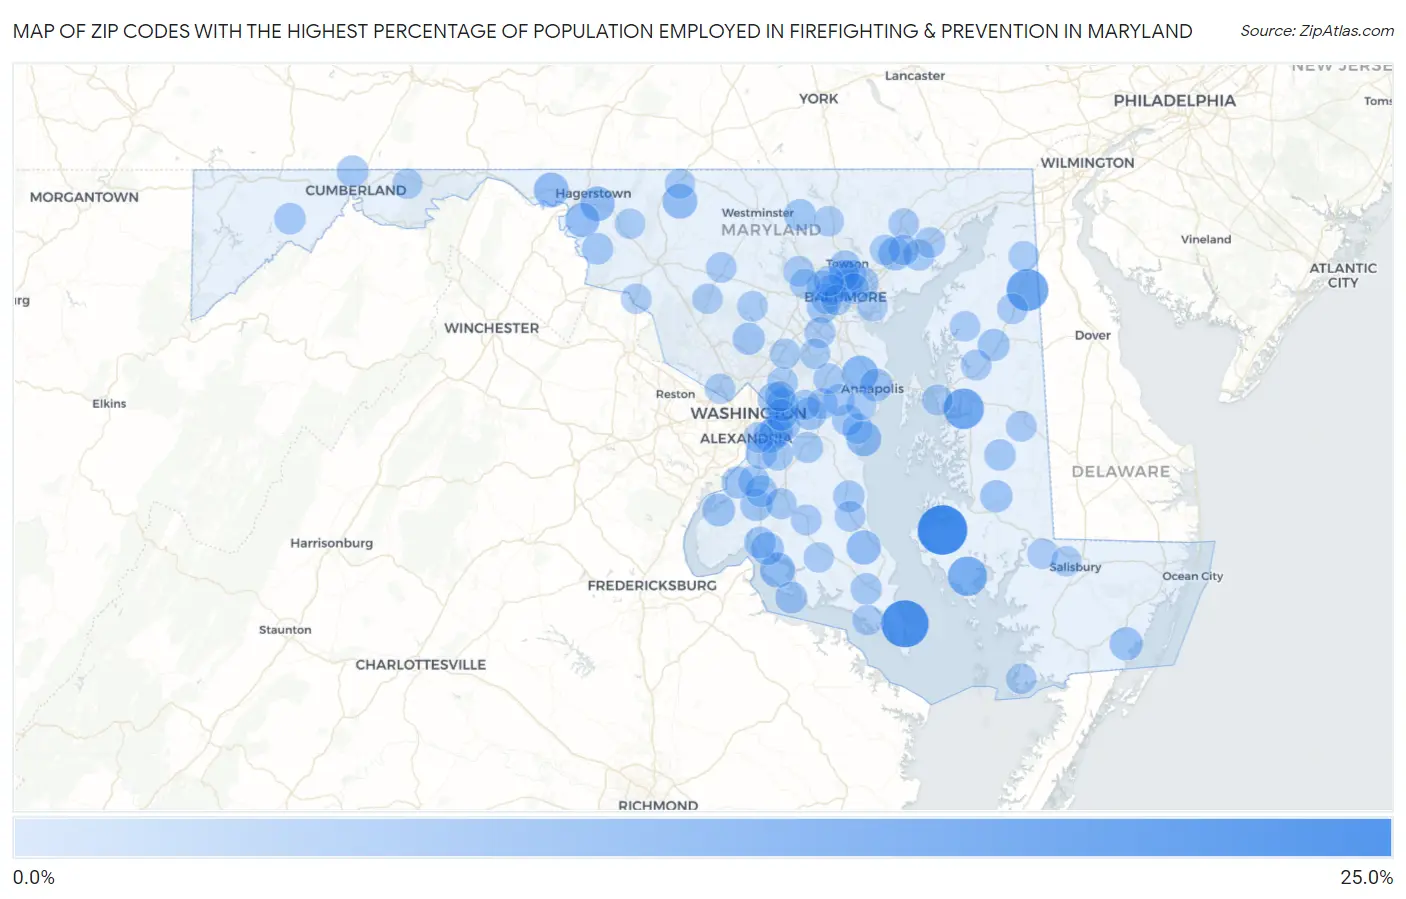
Map of Zip Codes with the Highest Percentage of Population Employed in Firefighting & Prevention in Maryland
0.0%
25.0%
Zip Codes with the Highest Percentage of Population Employed in Firefighting & Prevention in Maryland
| Zip Code | % Employed | vs State | vs National | |
| 1. | 21677 | 24.2% | 1.6%(+22.6)#1 | 1.2%(+23.0)#65 |
| 2. | 20628 | 21.5% | 1.6%(+19.9)#2 | 1.2%(+20.3)#89 |
| 3. | 21650 | 15.0% | 1.6%(+13.4)#3 | 1.2%(+13.8)#158 |
| 4. | 21679 | 13.5% | 1.6%(+11.9)#4 | 1.2%(+12.3)#191 |
| 5. | 21626 | 12.1% | 1.6%(+10.5)#5 | 1.2%(+10.9)#221 |
| 6. | 21405 | 8.6% | 1.6%(+6.98)#6 | 1.2%(+7.39)#365 |
| 7. | 20664 | 7.3% | 1.6%(+5.69)#7 | 1.2%(+6.10)#477 |
| 8. | 20733 | 7.2% | 1.6%(+5.59)#8 | 1.2%(+5.99)#492 |
| 9. | 21722 | 7.0% | 1.6%(+5.46)#9 | 1.2%(+5.86)#508 |
| 10. | 21778 | 7.0% | 1.6%(+5.38)#10 | 1.2%(+5.78)#519 |
| 11. | 21734 | 6.7% | 1.6%(+5.15)#11 | 1.2%(+5.56)#548 |
| 12. | 21733 | 6.4% | 1.6%(+4.81)#12 | 1.2%(+5.21)#606 |
| 13. | 20685 | 6.4% | 1.6%(+4.78)#13 | 1.2%(+5.18)#614 |
| 14. | 21156 | 5.3% | 1.6%(+3.72)#14 | 1.2%(+4.12)#805 |
| 15. | 21829 | 5.2% | 1.6%(+3.58)#15 | 1.2%(+3.99)#845 |
| 16. | 20748 | 5.0% | 1.6%(+3.40)#16 | 1.2%(+3.80)#914 |
| 17. | 20746 | 4.9% | 1.6%(+3.33)#17 | 1.2%(+3.73)#942 |
| 18. | 21402 | 4.7% | 1.6%(+3.13)#18 | 1.2%(+3.53)#1,019 |
| 19. | 20632 | 4.6% | 1.6%(+3.02)#19 | 1.2%(+3.42)#1,056 |
| 20. | 20640 | 4.5% | 1.6%(+2.95)#20 | 1.2%(+3.36)#1,083 |
| 21. | 20747 | 4.5% | 1.6%(+2.93)#21 | 1.2%(+3.34)#1,092 |
| 22. | 20774 | 4.5% | 1.6%(+2.88)#22 | 1.2%(+3.28)#1,119 |
| 23. | 20785 | 4.4% | 1.6%(+2.77)#23 | 1.2%(+3.17)#1,170 |
| 24. | 20710 | 4.3% | 1.6%(+2.73)#24 | 1.2%(+3.13)#1,194 |
| 25. | 21664 | 4.2% | 1.6%(+2.66)#25 | 1.2%(+3.06)#1,227 |
| 26. | 20675 | 4.0% | 1.6%(+2.45)#26 | 1.2%(+2.85)#1,333 |
| 27. | 20860 | 4.0% | 1.6%(+2.44)#27 | 1.2%(+2.84)#1,341 |
| 28. | 21623 | 3.9% | 1.6%(+2.35)#28 | 1.2%(+2.75)#1,390 |
| 29. | 20616 | 3.8% | 1.6%(+2.19)#29 | 1.2%(+2.60)#1,479 |
| 30. | 21155 | 3.7% | 1.6%(+2.14)#30 | 1.2%(+2.55)#1,521 |
| 31. | 20625 | 3.7% | 1.6%(+2.13)#31 | 1.2%(+2.53)#1,541 |
| 32. | 21206 | 3.7% | 1.6%(+2.11)#32 | 1.2%(+2.52)#1,550 |
| 33. | 20603 | 3.6% | 1.6%(+1.97)#33 | 1.2%(+2.38)#1,671 |
| 34. | 20743 | 3.6% | 1.6%(+1.97)#34 | 1.2%(+2.37)#1,676 |
| 35. | 21252 | 3.5% | 1.6%(+1.87)#35 | 1.2%(+2.27)#1,759 |
| 36. | 20611 | 3.4% | 1.6%(+1.83)#36 | 1.2%(+2.23)#1,800 |
| 37. | 21529 | 3.4% | 1.6%(+1.82)#37 | 1.2%(+2.22)#1,803 |
| 38. | 21035 | 3.4% | 1.6%(+1.80)#38 | 1.2%(+2.20)#1,815 |
| 39. | 21756 | 3.3% | 1.6%(+1.70)#39 | 1.2%(+2.11)#1,906 |
| 40. | 21655 | 3.3% | 1.6%(+1.70)#40 | 1.2%(+2.10)#1,913 |
| 41. | 21250 | 3.3% | 1.6%(+1.69)#41 | 1.2%(+2.09)#1,924 |
| 42. | 20639 | 3.3% | 1.6%(+1.67)#42 | 1.2%(+2.08)#1,939 |
| 43. | 21521 | 3.2% | 1.6%(+1.58)#43 | 1.2%(+1.99)#2,054 |
| 44. | 20776 | 3.1% | 1.6%(+1.55)#44 | 1.2%(+1.95)#2,095 |
| 45. | 20607 | 3.1% | 1.6%(+1.54)#45 | 1.2%(+1.94)#2,108 |
| 46. | 21207 | 3.1% | 1.6%(+1.52)#46 | 1.2%(+1.92)#2,129 |
| 47. | 20619 | 3.1% | 1.6%(+1.47)#47 | 1.2%(+1.87)#2,173 |
| 48. | 21040 | 3.0% | 1.6%(+1.41)#48 | 1.2%(+1.81)#2,253 |
| 49. | 20744 | 3.0% | 1.6%(+1.39)#49 | 1.2%(+1.80)#2,267 |
| 50. | 21218 | 3.0% | 1.6%(+1.38)#50 | 1.2%(+1.79)#2,281 |
| 51. | 20735 | 2.9% | 1.6%(+1.31)#51 | 1.2%(+1.72)#2,370 |
| 52. | 20772 | 2.8% | 1.6%(+1.17)#52 | 1.2%(+1.58)#2,625 |
| 53. | 21239 | 2.8% | 1.6%(+1.17)#53 | 1.2%(+1.58)#2,631 |
| 54. | 20602 | 2.7% | 1.6%(+1.12)#54 | 1.2%(+1.53)#2,709 |
| 55. | 21212 | 2.6% | 1.6%(+1.05)#55 | 1.2%(+1.45)#2,816 |
| 56. | 21617 | 2.6% | 1.6%(+1.00)#56 | 1.2%(+1.41)#2,915 |
| 57. | 20770 | 2.5% | 1.6%(+0.954)#57 | 1.2%(+1.36)#3,000 |
| 58. | 20678 | 2.5% | 1.6%(+0.953)#58 | 1.2%(+1.36)#3,001 |
| 59. | 21076 | 2.5% | 1.6%(+0.951)#59 | 1.2%(+1.36)#3,008 |
| 60. | 21213 | 2.5% | 1.6%(+0.929)#60 | 1.2%(+1.33)#3,059 |
| 61. | 21229 | 2.5% | 1.6%(+0.887)#61 | 1.2%(+1.29)#3,150 |
| 62. | 20716 | 2.5% | 1.6%(+0.872)#62 | 1.2%(+1.28)#3,182 |
| 63. | 21638 | 2.5% | 1.6%(+0.872)#63 | 1.2%(+1.28)#3,183 |
| 64. | 20637 | 2.5% | 1.6%(+0.863)#64 | 1.2%(+1.27)#3,194 |
| 65. | 21014 | 2.4% | 1.6%(+0.842)#65 | 1.2%(+1.25)#3,254 |
| 66. | 21017 | 2.4% | 1.6%(+0.841)#66 | 1.2%(+1.25)#3,258 |
| 67. | 20745 | 2.4% | 1.6%(+0.827)#67 | 1.2%(+1.23)#3,289 |
| 68. | 21629 | 2.4% | 1.6%(+0.817)#68 | 1.2%(+1.22)#3,314 |
| 69. | 21216 | 2.4% | 1.6%(+0.815)#69 | 1.2%(+1.22)#3,318 |
| 70. | 21114 | 2.4% | 1.6%(+0.794)#70 | 1.2%(+1.20)#3,371 |
| 71. | 21651 | 2.3% | 1.6%(+0.752)#71 | 1.2%(+1.16)#3,466 |
| 72. | 21085 | 2.3% | 1.6%(+0.666)#72 | 1.2%(+1.07)#3,692 |
| 73. | 21771 | 2.2% | 1.6%(+0.651)#73 | 1.2%(+1.06)#3,739 |
| 74. | 20778 | 2.2% | 1.6%(+0.634)#74 | 1.2%(+1.04)#3,785 |
| 75. | 21133 | 2.2% | 1.6%(+0.627)#75 | 1.2%(+1.03)#3,806 |
| 76. | 21737 | 2.2% | 1.6%(+0.626)#76 | 1.2%(+1.03)#3,813 |
| 77. | 21912 | 2.2% | 1.6%(+0.599)#77 | 1.2%(+1.00)#3,901 |
| 78. | 21223 | 2.2% | 1.6%(+0.593)#78 | 1.2%(+0.997)#3,923 |
| 79. | 21830 | 2.2% | 1.6%(+0.583)#79 | 1.2%(+0.987)#3,951 |
| 80. | 21087 | 2.2% | 1.6%(+0.578)#80 | 1.2%(+0.983)#3,959 |
| 81. | 21037 | 2.2% | 1.6%(+0.572)#81 | 1.2%(+0.976)#3,980 |
| 82. | 20755 | 2.1% | 1.6%(+0.549)#82 | 1.2%(+0.953)#4,034 |
| 83. | 20721 | 2.1% | 1.6%(+0.546)#83 | 1.2%(+0.950)#4,046 |
| 84. | 20818 | 2.1% | 1.6%(+0.540)#84 | 1.2%(+0.944)#4,066 |
| 85. | 21777 | 2.1% | 1.6%(+0.532)#85 | 1.2%(+0.936)#4,090 |
| 86. | 20784 | 2.1% | 1.6%(+0.519)#86 | 1.2%(+0.923)#4,130 |
| 87. | 21620 | 2.1% | 1.6%(+0.515)#87 | 1.2%(+0.919)#4,140 |
| 88. | 21222 | 2.1% | 1.6%(+0.491)#88 | 1.2%(+0.895)#4,215 |
| 89. | 21152 | 2.1% | 1.6%(+0.484)#89 | 1.2%(+0.888)#4,237 |
| 90. | 20707 | 2.1% | 1.6%(+0.477)#90 | 1.2%(+0.881)#4,270 |
| 91. | 21773 | 2.1% | 1.6%(+0.465)#91 | 1.2%(+0.870)#4,304 |
| 92. | 21530 | 2.0% | 1.6%(+0.436)#92 | 1.2%(+0.840)#4,417 |
| 93. | 21801 | 2.0% | 1.6%(+0.427)#93 | 1.2%(+0.831)#4,453 |
| 94. | 21215 | 2.0% | 1.6%(+0.426)#94 | 1.2%(+0.830)#4,457 |
| 95. | 20692 | 2.0% | 1.6%(+0.415)#95 | 1.2%(+0.819)#4,490 |
| 96. | 21244 | 2.0% | 1.6%(+0.393)#96 | 1.2%(+0.797)#4,569 |
| 97. | 20872 | 2.0% | 1.6%(+0.392)#97 | 1.2%(+0.796)#4,576 |
| 98. | 20659 | 2.0% | 1.6%(+0.387)#98 | 1.2%(+0.792)#4,601 |
| 99. | 21817 | 2.0% | 1.6%(+0.378)#99 | 1.2%(+0.783)#4,634 |
| 100. | 21727 | 2.0% | 1.6%(+0.369)#100 | 1.2%(+0.774)#4,663 |
Common Questions
What are the Top 10 Zip Codes with the Highest Percentage of Population Employed in Firefighting & Prevention in Maryland?
Top 10 Zip Codes with the Highest Percentage of Population Employed in Firefighting & Prevention in Maryland are:
What zip code has the Highest Percentage of Population Employed in Firefighting & Prevention in Maryland?
21677 has the Highest Percentage of Population Employed in Firefighting & Prevention in Maryland with 24.2%.
What is the Percentage of Population Employed in Firefighting & Prevention in the State of Maryland?
Percentage of Population Employed in Firefighting & Prevention in Maryland is 1.6%.
What is the Percentage of Population Employed in Firefighting & Prevention in the United States?
Percentage of Population Employed in Firefighting & Prevention in the United States is 1.2%.