Zip Codes with the Highest Percentage of Population Employed in Firefighting & Prevention in Illinois
RELATED REPORTS & OPTIONS
Firefighting & Prevention
Illinois
Compare Zip Codes
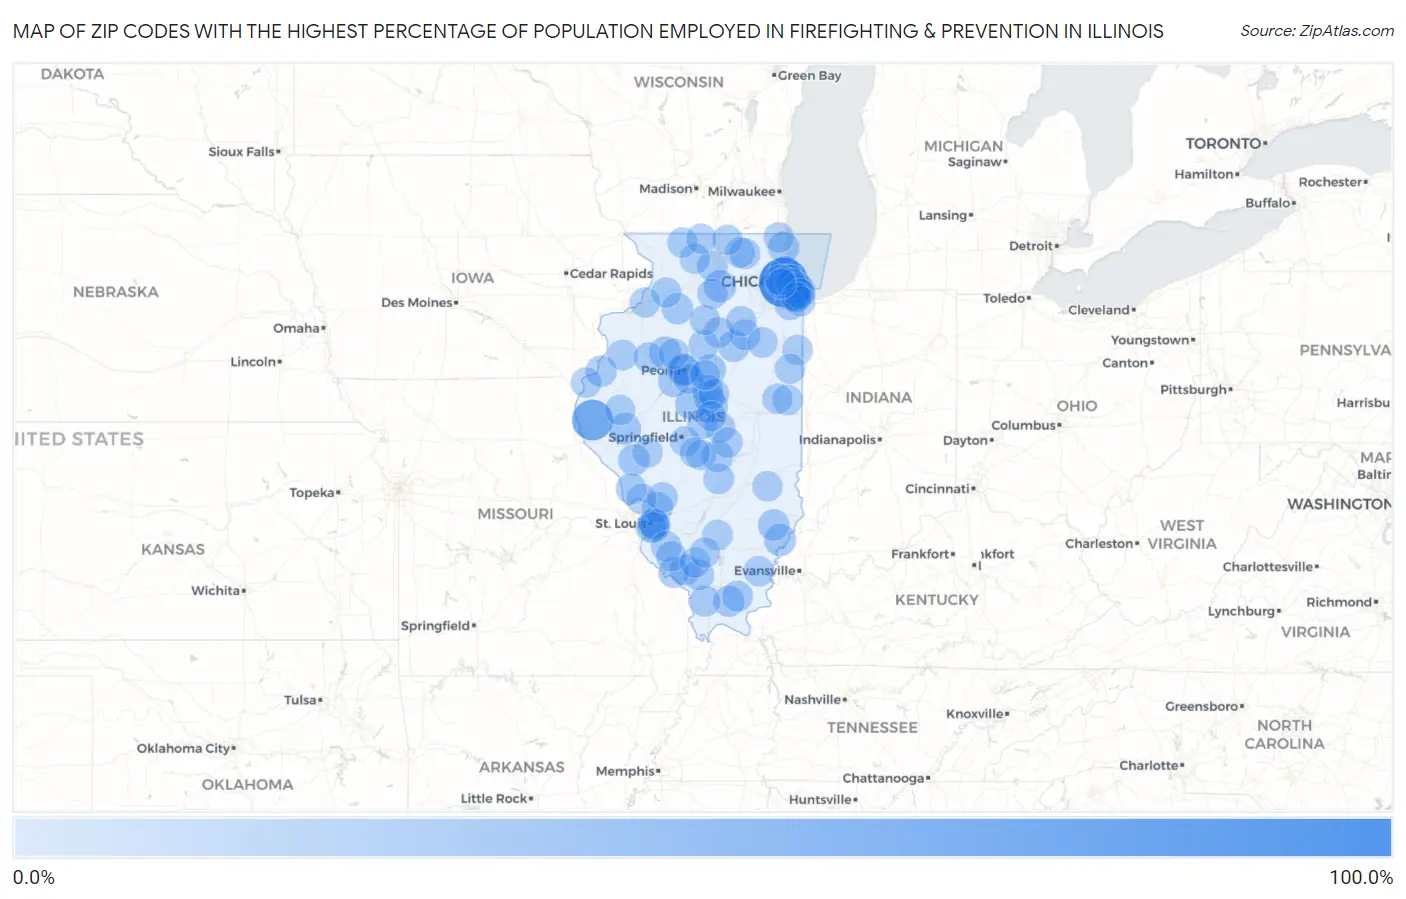
Map of Zip Codes with the Highest Percentage of Population Employed in Firefighting & Prevention in Illinois
0.0%
100.0%
Zip Codes with the Highest Percentage of Population Employed in Firefighting & Prevention in Illinois
| Zip Code | % Employed | vs State | vs National | |
| 1. | 60141 | 100.0% | 1.2%(+98.8)#1 | 1.2%(+98.8)#2 |
| 2. | 62359 | 55.3% | 1.2%(+54.1)#2 | 1.2%(+54.1)#16 |
| 3. | 61625 | 15.2% | 1.2%(+14.0)#3 | 1.2%(+14.0)#153 |
| 4. | 60530 | 11.6% | 1.2%(+10.4)#4 | 1.2%(+10.4)#242 |
| 5. | 62811 | 11.0% | 1.2%(+9.73)#5 | 1.2%(+9.77)#267 |
| 6. | 61451 | 10.8% | 1.2%(+9.54)#6 | 1.2%(+9.58)#270 |
| 7. | 62643 | 10.1% | 1.2%(+8.89)#7 | 1.2%(+8.93)#296 |
| 8. | 61771 | 9.7% | 1.2%(+8.50)#8 | 1.2%(+8.54)#314 |
| 9. | 62378 | 9.5% | 1.2%(+8.25)#9 | 1.2%(+8.29)#327 |
| 10. | 60088 | 8.5% | 1.2%(+7.30)#10 | 1.2%(+7.34)#367 |
| 11. | 61319 | 8.4% | 1.2%(+7.18)#11 | 1.2%(+7.22)#375 |
| 12. | 62452 | 8.2% | 1.2%(+7.01)#12 | 1.2%(+7.05)#388 |
| 13. | 61539 | 8.1% | 1.2%(+6.84)#13 | 1.2%(+6.88)#406 |
| 14. | 62078 | 8.0% | 1.2%(+6.78)#14 | 1.2%(+6.81)#413 |
| 15. | 62207 | 7.9% | 1.2%(+6.70)#15 | 1.2%(+6.74)#417 |
| 16. | 61346 | 7.7% | 1.2%(+6.47)#16 | 1.2%(+6.51)#442 |
| 17. | 62510 | 7.6% | 1.2%(+6.36)#17 | 1.2%(+6.40)#453 |
| 18. | 61454 | 7.1% | 1.2%(+5.88)#18 | 1.2%(+5.92)#501 |
| 19. | 61778 | 6.6% | 1.2%(+5.42)#19 | 1.2%(+5.46)#568 |
| 20. | 60636 | 6.5% | 1.2%(+5.28)#20 | 1.2%(+5.31)#592 |
| 21. | 60655 | 6.5% | 1.2%(+5.26)#21 | 1.2%(+5.30)#593 |
| 22. | 61754 | 6.5% | 1.2%(+5.23)#22 | 1.2%(+5.27)#598 |
| 23. | 62972 | 6.3% | 1.2%(+5.08)#23 | 1.2%(+5.12)#626 |
| 24. | 62205 | 5.8% | 1.2%(+4.55)#24 | 1.2%(+4.59)#713 |
| 25. | 62987 | 5.6% | 1.2%(+4.37)#25 | 1.2%(+4.41)#751 |
| 26. | 60620 | 5.6% | 1.2%(+4.34)#26 | 1.2%(+4.38)#755 |
| 27. | 60437 | 5.2% | 1.2%(+3.95)#27 | 1.2%(+3.99)#847 |
| 28. | 60619 | 5.1% | 1.2%(+3.91)#28 | 1.2%(+3.95)#856 |
| 29. | 60180 | 5.1% | 1.2%(+3.89)#29 | 1.2%(+3.93)#864 |
| 30. | 62920 | 5.1% | 1.2%(+3.85)#30 | 1.2%(+3.89)#878 |
| 31. | 62997 | 5.0% | 1.2%(+3.79)#31 | 1.2%(+3.83)#906 |
| 32. | 60624 | 5.0% | 1.2%(+3.73)#32 | 1.2%(+3.77)#926 |
| 33. | 60631 | 5.0% | 1.2%(+3.73)#33 | 1.2%(+3.77)#927 |
| 34. | 60628 | 4.9% | 1.2%(+3.72)#34 | 1.2%(+3.76)#931 |
| 35. | 60621 | 4.9% | 1.2%(+3.67)#35 | 1.2%(+3.71)#950 |
| 36. | 62431 | 4.9% | 1.2%(+3.66)#36 | 1.2%(+3.70)#955 |
| 37. | 62031 | 4.8% | 1.2%(+3.57)#37 | 1.2%(+3.61)#992 |
| 38. | 61462 | 4.8% | 1.2%(+3.56)#38 | 1.2%(+3.60)#996 |
| 39. | 60155 | 4.7% | 1.2%(+3.52)#39 | 1.2%(+3.56)#1,008 |
| 40. | 60649 | 4.7% | 1.2%(+3.52)#40 | 1.2%(+3.55)#1,011 |
| 41. | 62206 | 4.7% | 1.2%(+3.45)#41 | 1.2%(+3.48)#1,036 |
| 42. | 62084 | 4.7% | 1.2%(+3.44)#42 | 1.2%(+3.48)#1,038 |
| 43. | 62201 | 4.5% | 1.2%(+3.23)#43 | 1.2%(+3.27)#1,126 |
| 44. | 62994 | 4.4% | 1.2%(+3.19)#44 | 1.2%(+3.23)#1,144 |
| 45. | 61606 | 4.4% | 1.2%(+3.17)#45 | 1.2%(+3.21)#1,151 |
| 46. | 60643 | 4.4% | 1.2%(+3.17)#46 | 1.2%(+3.21)#1,156 |
| 47. | 60644 | 4.4% | 1.2%(+3.16)#47 | 1.2%(+3.20)#1,158 |
| 48. | 62233 | 4.3% | 1.2%(+3.08)#48 | 1.2%(+3.12)#1,202 |
| 49. | 61043 | 4.0% | 1.2%(+2.78)#49 | 1.2%(+2.81)#1,361 |
| 50. | 61332 | 4.0% | 1.2%(+2.78)#50 | 1.2%(+2.81)#1,362 |
| 51. | 62264 | 3.9% | 1.2%(+2.71)#51 | 1.2%(+2.75)#1,389 |
| 52. | 62217 | 3.8% | 1.2%(+2.57)#52 | 1.2%(+2.61)#1,475 |
| 53. | 61774 | 3.7% | 1.2%(+2.51)#53 | 1.2%(+2.54)#1,527 |
| 54. | 62021 | 3.7% | 1.2%(+2.50)#54 | 1.2%(+2.54)#1,535 |
| 55. | 60637 | 3.7% | 1.2%(+2.50)#55 | 1.2%(+2.54)#1,536 |
| 56. | 62535 | 3.7% | 1.2%(+2.43)#56 | 1.2%(+2.47)#1,595 |
| 57. | 61865 | 3.7% | 1.2%(+2.43)#57 | 1.2%(+2.47)#1,596 |
| 58. | 62893 | 3.6% | 1.2%(+2.37)#58 | 1.2%(+2.41)#1,646 |
| 59. | 61375 | 3.5% | 1.2%(+2.32)#59 | 1.2%(+2.36)#1,689 |
| 60. | 60152 | 3.5% | 1.2%(+2.28)#60 | 1.2%(+2.32)#1,719 |
| 61. | 61772 | 3.5% | 1.2%(+2.27)#61 | 1.2%(+2.31)#1,725 |
| 62. | 61360 | 3.5% | 1.2%(+2.25)#62 | 1.2%(+2.29)#1,736 |
| 63. | 60623 | 3.5% | 1.2%(+2.25)#63 | 1.2%(+2.29)#1,743 |
| 64. | 60478 | 3.5% | 1.2%(+2.23)#64 | 1.2%(+2.27)#1,755 |
| 65. | 60409 | 3.4% | 1.2%(+2.20)#65 | 1.2%(+2.24)#1,793 |
| 66. | 60917 | 3.3% | 1.2%(+2.07)#66 | 1.2%(+2.11)#1,904 |
| 67. | 62319 | 3.3% | 1.2%(+2.07)#67 | 1.2%(+2.11)#1,905 |
| 68. | 61535 | 3.3% | 1.2%(+2.06)#68 | 1.2%(+2.10)#1,919 |
| 69. | 60617 | 3.3% | 1.2%(+2.03)#69 | 1.2%(+2.07)#1,951 |
| 70. | 60912 | 3.2% | 1.2%(+2.01)#70 | 1.2%(+2.05)#1,975 |
| 71. | 61065 | 3.2% | 1.2%(+1.98)#71 | 1.2%(+2.02)#2,011 |
| 72. | 62548 | 3.2% | 1.2%(+1.98)#72 | 1.2%(+2.02)#2,020 |
| 73. | 61436 | 3.2% | 1.2%(+1.95)#73 | 1.2%(+1.98)#2,055 |
| 74. | 61925 | 3.1% | 1.2%(+1.92)#74 | 1.2%(+1.96)#2,084 |
| 75. | 62432 | 3.1% | 1.2%(+1.92)#75 | 1.2%(+1.96)#2,087 |
| 76. | 62028 | 3.1% | 1.2%(+1.89)#76 | 1.2%(+1.93)#2,120 |
| 77. | 62354 | 3.1% | 1.2%(+1.88)#77 | 1.2%(+1.92)#2,132 |
| 78. | 61862 | 3.1% | 1.2%(+1.85)#78 | 1.2%(+1.89)#2,158 |
| 79. | 60163 | 3.0% | 1.2%(+1.81)#79 | 1.2%(+1.85)#2,198 |
| 80. | 61047 | 3.0% | 1.2%(+1.78)#80 | 1.2%(+1.82)#2,241 |
| 81. | 61318 | 3.0% | 1.2%(+1.76)#81 | 1.2%(+1.79)#2,271 |
| 82. | 61559 | 3.0% | 1.2%(+1.75)#82 | 1.2%(+1.79)#2,283 |
| 83. | 61729 | 3.0% | 1.2%(+1.73)#83 | 1.2%(+1.77)#2,307 |
| 84. | 62668 | 2.9% | 1.2%(+1.71)#84 | 1.2%(+1.75)#2,334 |
| 85. | 60827 | 2.9% | 1.2%(+1.69)#85 | 1.2%(+1.72)#2,363 |
| 86. | 62274 | 2.9% | 1.2%(+1.68)#86 | 1.2%(+1.72)#2,368 |
| 87. | 61013 | 2.9% | 1.2%(+1.67)#87 | 1.2%(+1.71)#2,393 |
| 88. | 61275 | 2.9% | 1.2%(+1.64)#88 | 1.2%(+1.68)#2,437 |
| 89. | 60974 | 2.8% | 1.2%(+1.61)#89 | 1.2%(+1.64)#2,508 |
| 90. | 61024 | 2.8% | 1.2%(+1.60)#90 | 1.2%(+1.64)#2,512 |
| 91. | 60083 | 2.8% | 1.2%(+1.59)#91 | 1.2%(+1.63)#2,532 |
| 92. | 62831 | 2.8% | 1.2%(+1.53)#92 | 1.2%(+1.57)#2,641 |
| 93. | 62712 | 2.7% | 1.2%(+1.52)#93 | 1.2%(+1.56)#2,655 |
| 94. | 60526 | 2.7% | 1.2%(+1.50)#94 | 1.2%(+1.54)#2,684 |
| 95. | 61261 | 2.7% | 1.2%(+1.49)#95 | 1.2%(+1.53)#2,710 |
| 96. | 62568 | 2.7% | 1.2%(+1.48)#96 | 1.2%(+1.52)#2,720 |
| 97. | 61749 | 2.7% | 1.2%(+1.48)#97 | 1.2%(+1.52)#2,722 |
| 98. | 61362 | 2.7% | 1.2%(+1.45)#98 | 1.2%(+1.49)#2,763 |
| 99. | 62540 | 2.7% | 1.2%(+1.44)#99 | 1.2%(+1.48)#2,772 |
| 100. | 62869 | 2.7% | 1.2%(+1.44)#100 | 1.2%(+1.48)#2,776 |
Common Questions
What are the Top 10 Zip Codes with the Highest Percentage of Population Employed in Firefighting & Prevention in Illinois?
Top 10 Zip Codes with the Highest Percentage of Population Employed in Firefighting & Prevention in Illinois are:
What zip code has the Highest Percentage of Population Employed in Firefighting & Prevention in Illinois?
60141 has the Highest Percentage of Population Employed in Firefighting & Prevention in Illinois with 100.0%.
What is the Percentage of Population Employed in Firefighting & Prevention in the State of Illinois?
Percentage of Population Employed in Firefighting & Prevention in Illinois is 1.2%.
What is the Percentage of Population Employed in Firefighting & Prevention in the United States?
Percentage of Population Employed in Firefighting & Prevention in the United States is 1.2%.