Zip Codes with the Highest Percentage of Population Employed in Firefighting & Prevention in the United States
RELATED REPORTS & OPTIONS
Firefighting & Prevention
United States
Compare Zip Codes
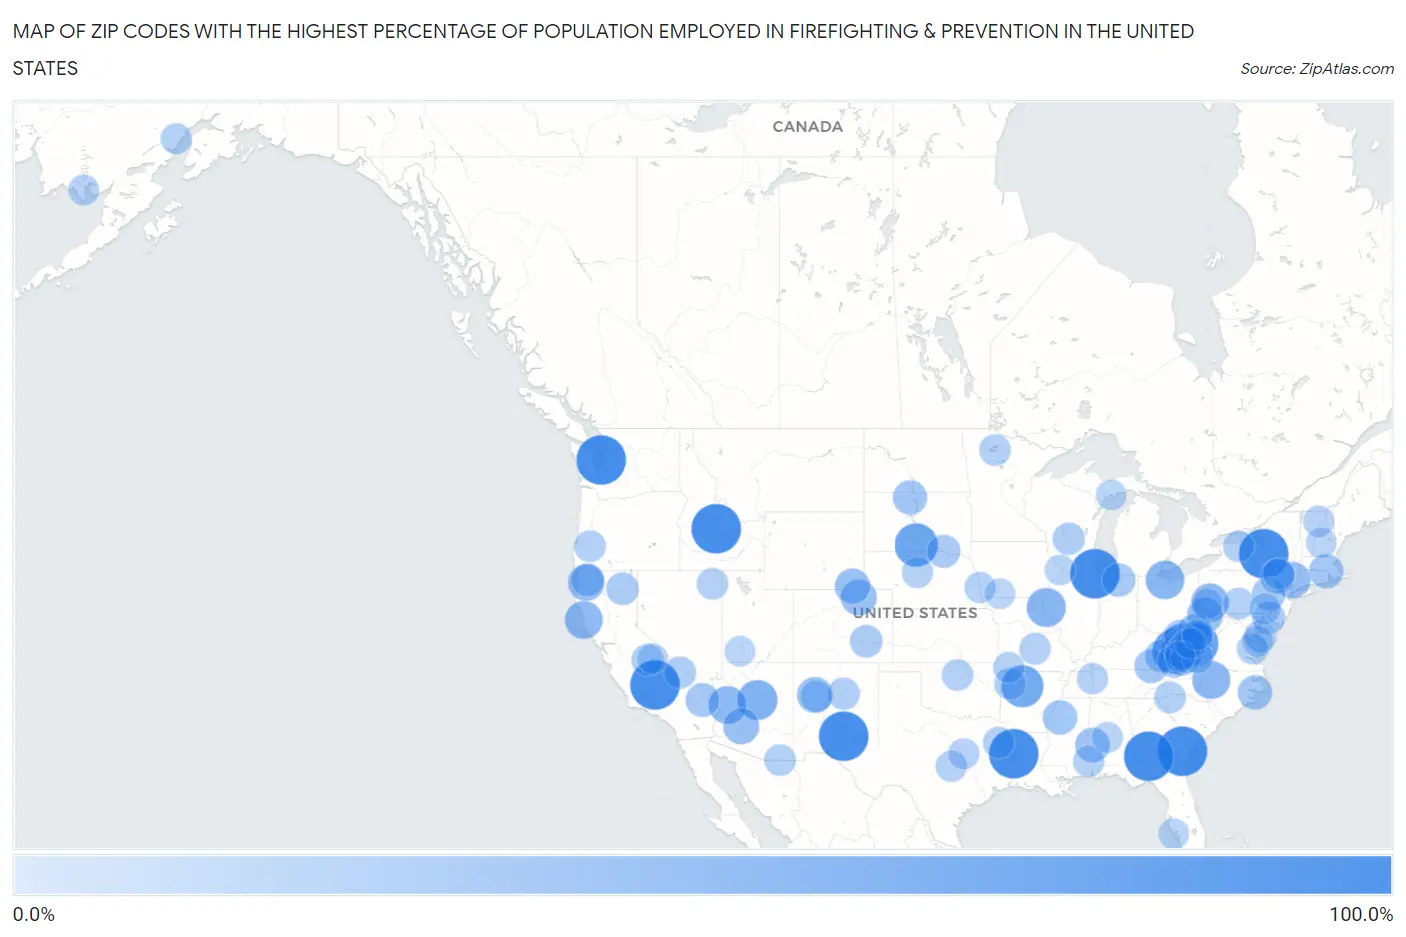
Map of Zip Codes with the Highest Percentage of Population Employed in Firefighting & Prevention in the United States
0.0%
100.0%
Zip Codes with the Highest Percentage of Population Employed in Firefighting & Prevention in the United States
| Zip Code | % Employed | vs State | vs National | |
| 1. | 31314 | 100.0% | 1.2%(+98.8)#1 | 1.2%(+98.8)#1 |
| 2. | 60141 | 100.0% | 1.2%(+98.8)#1 | 1.2%(+98.8)#2 |
| 3. | 71406 | 100.0% | 1.3%(+98.7)#1 | 1.2%(+98.8)#3 |
| 4. | 31704 | 100.0% | 1.2%(+98.8)#2 | 1.2%(+98.8)#4 |
| 5. | 88354 | 100.0% | 1.5%(+98.5)#1 | 1.2%(+98.8)#5 |
| 6. | 83227 | 100.0% | 0.91%(+99.1)#1 | 1.2%(+98.8)#6 |
| 7. | 93226 | 100.0% | 1.3%(+98.7)#1 | 1.2%(+98.8)#7 |
| 8. | 13051 | 100.0% | 1.6%(+98.4)#1 | 1.2%(+98.8)#8 |
| 9. | 98353 | 100.0% | 1.1%(+98.9)#1 | 1.2%(+98.8)#9 |
| 10. | 25688 | 80.4% | 1.3%(+79.2)#1 | 1.2%(+79.2)#10 |
| 11. | 25204 | 80.0% | 1.3%(+78.7)#2 | 1.2%(+78.8)#11 |
| 12. | 25972 | 76.7% | 1.3%(+75.5)#3 | 1.2%(+75.6)#12 |
| 13. | 57563 | 73.3% | 0.79%(+72.5)#1 | 1.2%(+72.1)#13 |
| 14. | 72686 | 67.9% | 0.91%(+67.0)#1 | 1.2%(+66.8)#14 |
| 15. | 86038 | 59.4% | 1.4%(+58.0)#1 | 1.2%(+58.2)#15 |
| 16. | 62359 | 55.3% | 1.2%(+54.1)#2 | 1.2%(+54.1)#16 |
| 17. | 43433 | 53.5% | 1.1%(+52.4)#1 | 1.2%(+52.3)#17 |
| 18. | 27342 | 50.9% | 0.96%(+49.9)#1 | 1.2%(+49.7)#18 |
| 19. | 95420 | 50.7% | 1.3%(+49.4)#2 | 1.2%(+49.5)#19 |
| 20. | 85360 | 50.0% | 1.4%(+48.6)#2 | 1.2%(+48.8)#20 |
| 21. | 15647 | 50.0% | 1.0%(+49.0)#1 | 1.2%(+48.8)#21 |
| 22. | 95556 | 44.8% | 1.3%(+43.5)#3 | 1.2%(+43.6)#22 |
| 23. | 12527 | 43.8% | 1.6%(+42.2)#2 | 1.2%(+42.6)#23 |
| 24. | 80622 | 42.4% | 1.2%(+41.3)#1 | 1.2%(+41.3)#24 |
| 25. | 87014 | 42.2% | 1.5%(+40.6)#2 | 1.2%(+41.0)#25 |
| 26. | 85343 | 42.1% | 1.4%(+40.7)#3 | 1.2%(+40.9)#26 |
| 27. | 26546 | 41.8% | 1.3%(+40.5)#4 | 1.2%(+40.6)#27 |
| 28. | 25651 | 41.2% | 1.3%(+39.9)#5 | 1.2%(+40.0)#28 |
| 29. | 82005 | 40.0% | 0.90%(+39.1)#1 | 1.2%(+38.8)#29 |
| 30. | 36763 | 37.1% | 1.2%(+35.9)#1 | 1.2%(+35.9)#30 |
| 31. | 26619 | 36.4% | 1.3%(+35.1)#6 | 1.2%(+35.2)#31 |
| 32. | 12750 | 36.4% | 1.6%(+34.8)#3 | 1.2%(+35.2)#32 |
| 33. | 38928 | 36.2% | 1.2%(+35.0)#1 | 1.2%(+35.0)#33 |
| 34. | 28552 | 35.9% | 0.96%(+34.9)#2 | 1.2%(+34.7)#34 |
| 35. | 57639 | 35.7% | 0.79%(+34.9)#2 | 1.2%(+34.5)#35 |
| 36. | 02824 | 35.7% | 1.5%(+34.2)#1 | 1.2%(+34.5)#36 |
| 37. | 92332 | 33.6% | 1.3%(+32.3)#4 | 1.2%(+32.4)#37 |
| 38. | 40903 | 33.5% | 1.1%(+32.4)#1 | 1.2%(+32.3)#38 |
| 39. | 24815 | 32.4% | 1.3%(+31.2)#7 | 1.2%(+31.2)#39 |
| 40. | 18035 | 32.0% | 1.0%(+31.0)#2 | 1.2%(+30.8)#40 |
| 41. | 46595 | 31.6% | 0.91%(+30.7)#1 | 1.2%(+30.4)#41 |
| 42. | 57361 | 31.0% | 0.79%(+30.2)#3 | 1.2%(+29.8)#42 |
| 43. | 25646 | 31.0% | 1.3%(+29.7)#8 | 1.2%(+29.8)#43 |
| 44. | 41712 | 29.9% | 1.1%(+28.8)#2 | 1.2%(+28.8)#44 |
| 45. | 95568 | 29.7% | 1.3%(+28.4)#5 | 1.2%(+28.5)#45 |
| 46. | 19731 | 29.2% | 1.4%(+27.8)#1 | 1.2%(+28.0)#46 |
| 47. | 24220 | 29.1% | 1.4%(+27.7)#1 | 1.2%(+27.9)#47 |
| 48. | 25126 | 29.1% | 1.3%(+27.8)#9 | 1.2%(+27.9)#48 |
| 49. | 81033 | 28.6% | 1.2%(+27.4)#2 | 1.2%(+27.4)#49 |
| 50. | 25011 | 28.5% | 1.3%(+27.3)#10 | 1.2%(+27.3)#50 |
| 51. | 96009 | 28.4% | 1.3%(+27.1)#6 | 1.2%(+27.2)#51 |
| 52. | 24839 | 27.9% | 1.3%(+26.6)#11 | 1.2%(+26.7)#52 |
| 53. | 53920 | 26.9% | 0.80%(+26.1)#1 | 1.2%(+25.7)#53 |
| 54. | 92328 | 26.6% | 1.3%(+25.3)#7 | 1.2%(+25.4)#54 |
| 55. | 87560 | 26.5% | 1.5%(+25.0)#3 | 1.2%(+25.3)#55 |
| 56. | 25008 | 26.3% | 1.3%(+25.0)#12 | 1.2%(+25.1)#56 |
| 57. | 93605 | 26.1% | 1.3%(+24.8)#8 | 1.2%(+24.9)#57 |
| 58. | 26208 | 25.3% | 1.3%(+24.0)#13 | 1.2%(+24.1)#58 |
| 59. | 17217 | 25.0% | 1.0%(+24.0)#3 | 1.2%(+23.8)#59 |
| 60. | 29683 | 24.9% | 1.1%(+23.8)#1 | 1.2%(+23.7)#60 |
| 61. | 87038 | 24.6% | 1.5%(+23.1)#4 | 1.2%(+23.4)#61 |
| 62. | 72721 | 24.5% | 0.91%(+23.6)#2 | 1.2%(+23.3)#62 |
| 63. | 89835 | 24.4% | 2.1%(+22.3)#1 | 1.2%(+23.2)#63 |
| 64. | 85620 | 24.4% | 1.4%(+23.0)#4 | 1.2%(+23.2)#64 |
| 65. | 21677 | 24.2% | 1.6%(+22.6)#1 | 1.2%(+23.0)#65 |
| 66. | 65457 | 24.1% | 0.95%(+23.2)#1 | 1.2%(+23.0)#66 |
| 67. | 97495 | 24.1% | 1.1%(+23.0)#1 | 1.2%(+22.9)#67 |
| 68. | 56666 | 23.9% | 0.66%(+23.3)#1 | 1.2%(+22.7)#68 |
| 69. | 73757 | 23.8% | 1.1%(+22.7)#1 | 1.2%(+22.6)#69 |
| 70. | 75641 | 23.7% | 1.1%(+22.6)#1 | 1.2%(+22.5)#70 |
| 71. | 12791 | 23.7% | 1.6%(+22.1)#4 | 1.2%(+22.5)#71 |
| 72. | 36529 | 23.5% | 1.2%(+22.2)#2 | 1.2%(+22.3)#72 |
| 73. | 14515 | 22.9% | 1.6%(+21.4)#5 | 1.2%(+21.7)#73 |
| 74. | 24808 | 22.6% | 1.3%(+21.4)#14 | 1.2%(+21.5)#74 |
| 75. | 38333 | 22.6% | 1.1%(+21.5)#1 | 1.2%(+21.4)#75 |
| 76. | 22504 | 22.5% | 1.4%(+21.1)#2 | 1.2%(+21.3)#76 |
| 77. | 24086 | 22.5% | 1.4%(+21.1)#3 | 1.2%(+21.3)#77 |
| 78. | 69142 | 22.4% | 0.88%(+21.5)#1 | 1.2%(+21.2)#78 |
| 79. | 68113 | 22.3% | 0.88%(+21.4)#2 | 1.2%(+21.1)#79 |
| 80. | 25090 | 22.2% | 1.3%(+21.0)#15 | 1.2%(+21.0)#80 |
| 81. | 19367 | 22.2% | 1.0%(+21.2)#4 | 1.2%(+21.0)#81 |
| 82. | 99635 | 22.2% | 1.7%(+20.6)#1 | 1.2%(+21.0)#82 |
| 83. | 65623 | 22.2% | 0.95%(+21.3)#2 | 1.2%(+21.0)#83 |
| 84. | 78608 | 22.1% | 1.1%(+20.9)#2 | 1.2%(+20.9)#84 |
| 85. | 76654 | 21.7% | 1.1%(+20.6)#3 | 1.2%(+20.6)#85 |
| 86. | 05850 | 21.7% | 0.67%(+21.0)#1 | 1.2%(+20.5)#86 |
| 87. | 25837 | 21.6% | 1.3%(+20.4)#16 | 1.2%(+20.5)#87 |
| 88. | 36790 | 21.6% | 1.2%(+20.4)#3 | 1.2%(+20.4)#88 |
| 89. | 20628 | 21.5% | 1.6%(+19.9)#2 | 1.2%(+20.3)#89 |
| 90. | 99628 | 21.0% | 1.7%(+19.4)#2 | 1.2%(+19.8)#90 |
| 91. | 24817 | 20.4% | 1.3%(+19.2)#17 | 1.2%(+19.2)#91 |
| 92. | 26203 | 20.0% | 1.3%(+18.7)#18 | 1.2%(+18.8)#92 |
| 93. | 15038 | 20.0% | 1.0%(+19.0)#5 | 1.2%(+18.8)#93 |
| 94. | 84719 | 20.0% | 0.95%(+19.1)#1 | 1.2%(+18.8)#94 |
| 95. | 52771 | 20.0% | 0.74%(+19.3)#1 | 1.2%(+18.8)#95 |
| 96. | 49864 | 20.0% | 0.89%(+19.1)#1 | 1.2%(+18.8)#96 |
| 97. | 93634 | 20.0% | 1.3%(+18.7)#9 | 1.2%(+18.8)#97 |
| 98. | 33946 | 19.9% | 1.4%(+18.5)#1 | 1.2%(+18.7)#98 |
| 99. | 03233 | 19.7% | 0.89%(+18.9)#1 | 1.2%(+18.6)#99 |
| 100. | 50840 | 19.5% | 0.74%(+18.7)#2 | 1.2%(+18.3)#100 |
Common Questions
What are the Top 10 Zip Codes with the Highest Percentage of Population Employed in Firefighting & Prevention in the United States?
Top 10 Zip Codes with the Highest Percentage of Population Employed in Firefighting & Prevention in the United States are:
#1
100.0%
#2
100.0%
#3
100.0%
#4
100.0%
#5
100.0%
#6
100.0%
#7
100.0%
#8
100.0%
#9
100.0%
#10
80.4%
What zip code has the Highest Percentage of Population Employed in Firefighting & Prevention in the United States?
31314 has the Highest Percentage of Population Employed in Firefighting & Prevention in the United States with 100.0%.
What is the Percentage of Population Employed in Firefighting & Prevention in the United States?
Percentage of Population Employed in Firefighting & Prevention in the United States is 1.2%.