Zip Codes with the Highest Percentage of Population Employed in Firefighting & Prevention in San Antonio, TX

RELATED REPORTS & OPTIONS

Firefighting & Prevention
Population
Families and Households
Female Fertility
Female Fertility (Unmarried)
Race (Community Size)
Race (Percentage)
Ancestry (Community Size)
AfghanAfricanAlbanianAleutAlsatianAmericanApacheArabArgentineanArmenianAustralianAustrianBahamianBangladeshiBarbadianBasqueBelgianBelizeanBhutaneseBlackfeetBolivianBrazilianBritishBritish West IndianBulgarianBurmeseCajunCambodianCanadianCape VerdeanCelticCentral AmericanCentral American IndianCherokeeCheyenneChickasawChileanChineseChippewaChoctawColombianComancheCosta RicanCreekCroatianCubanCzechCzechoslovakianDanishDelawareDominicanDutchDutch West IndianEastern EuropeanEcuadorianEgyptianEnglishEstonianEthiopianEuropeanFilipinoFinnishFrenchFrench American IndianFrench CanadianGermanGerman RussianGhanaianGreekGuamanian / ChamorroGuatemalanGuyaneseHaitianHonduranHopiHungarianIcelanderIndian (Asian)IndonesianInupiatIranianIraqiIrishIroquoisIsraeliItalianJamaicanJapaneseJordanianKenyanKoreanLaotianLatvianLebaneseLiberianLithuanianLumbeeLuxembourgerMacedonianMalaysianMexicanMexican American IndianMongolianMoroccanNative HawaiianNavajoNew ZealanderNicaraguanNigerianNorthern EuropeanNorwegianOkinawanOsageOttawaPakistaniPalestinianPanamanianParaguayanPennsylvania GermanPeruvianPimaPolishPortuguesePotawatomiPuebloPuerto RicanRomanianRussianSalvadoranSamoanScandinavianScotch-IrishScottishSeminoleSerbianShoshoneSierra LeoneanSiouxSlavicSlovakSloveneSomaliSouth AfricanSouth AmericanSouth American IndianSoviet UnionSpaniardSpanishSpanish AmericanSpanish American IndianSri LankanSubsaharan AfricanSudaneseSwedishSwissSyrianThaiTrinidadian and TobagonianTurkishU.S. Virgin IslanderUgandanUkrainianUruguayanUteVenezuelanVietnameseWelshWest IndianYaquiYugoslavian
Ancestry (Percentage)
AfghanAfricanAlbanianAleutAlsatianAmericanApacheArabArgentineanArmenianAustralianAustrianBahamianBangladeshiBarbadianBasqueBelgianBelizeanBhutaneseBlackfeetBolivianBrazilianBritishBritish West IndianBulgarianBurmeseCajunCambodianCanadianCape VerdeanCelticCentral AmericanCentral American IndianCherokeeCheyenneChickasawChileanChineseChippewaChoctawColombianComancheCosta RicanCreekCroatianCubanCzechCzechoslovakianDanishDelawareDominicanDutchDutch West IndianEastern EuropeanEcuadorianEgyptianEnglishEstonianEthiopianEuropeanFilipinoFinnishFrenchFrench American IndianFrench CanadianGermanGerman RussianGhanaianGreekGuamanian / ChamorroGuatemalanGuyaneseHaitianHonduranHopiHungarianIcelanderIndian (Asian)IndonesianInupiatIranianIraqiIrishIroquoisIsraeliItalianJamaicanJapaneseJordanianKenyanKoreanLaotianLatvianLebaneseLiberianLithuanianLumbeeLuxembourgerMacedonianMalaysianMexicanMexican American IndianMongolianMoroccanNative HawaiianNavajoNew ZealanderNicaraguanNigerianNorthern EuropeanNorwegianOkinawanOsageOttawaPakistaniPalestinianPanamanianParaguayanPennsylvania GermanPeruvianPimaPolishPortuguesePotawatomiPuebloPuerto RicanRomanianRussianSalvadoranSamoanScandinavianScotch-IrishScottishSeminoleSerbianShoshoneSierra LeoneanSiouxSlavicSlovakSloveneSomaliSouth AfricanSouth AmericanSouth American IndianSoviet UnionSpaniardSpanishSpanish AmericanSpanish American IndianSri LankanSubsaharan AfricanSudaneseSwedishSwissSyrianThaiTrinidadian and TobagonianTurkishU.S. Virgin IslanderUgandanUkrainianUruguayanUteVenezuelanVietnameseWelshWest IndianYaquiYugoslavian
Immigrant Origin (Total)
AfghanistanAfricaArgentinaAsiaAustraliaAustriaBangladeshBarbadosBelizeBoliviaBrazilBulgariaBurma / MyanmarCambodiaCameroonCanadaCaribbeanCentral AmericaChileChinaColombiaCongoCosta RicaCubaCzechoslovakiaDenmarkDominican RepublicEastern AfricaEastern AsiaEastern EuropeEcuadorEgyptEl SalvadorEnglandEritreaEthiopiaEuropeFijiFranceGermanyGhanaGreeceGuatemalaGuyanaHaitiHondurasHong KongHungaryIndiaIndonesiaIranIraqIrelandIsraelItalyJamaicaJapanJordanKazakhstanKenyaKoreaKuwaitLaosLatin AmericaLatviaLebanonLiberiaLithuaniaMalaysiaMexicoMiddle AfricaMoldovaMoroccoNepalNetherlandsNicaraguaNigeriaNorthern AfricaNorthern EuropeNorwayOceaniaPakistanPanamaPeruPhilippinesPolandPortugalRomaniaRussiaSaudi ArabiaScotlandSerbiaSierra LeoneSingaporeSomaliaSouth AfricaSouth AmericaSouth Central AsiaSouth Eastern AsiaSouthern EuropeSpainSri LankaSudanSwedenSwitzerlandSyriaTaiwanThailandTrinidad and TobagoTurkeyUgandaUkraineUruguayUzbekistanVenezuelaVietnamWestern AfricaWestern AsiaWestern EuropeZaireZimbabwe
Immigrant Origin (Percentage)
AfghanistanAfricaArgentinaAsiaAustraliaAustriaBangladeshBarbadosBelizeBoliviaBrazilBulgariaBurma / MyanmarCambodiaCameroonCanadaCaribbeanCentral AmericaChileChinaColombiaCongoCosta RicaCubaCzechoslovakiaDenmarkDominican RepublicEastern AfricaEastern AsiaEastern EuropeEcuadorEgyptEl SalvadorEnglandEritreaEthiopiaEuropeFijiFranceGermanyGhanaGreeceGuatemalaGuyanaHaitiHondurasHong KongHungaryIndiaIndonesiaIranIraqIrelandIsraelItalyJamaicaJapanJordanKazakhstanKenyaKoreaKuwaitLaosLatin AmericaLatviaLebanonLiberiaLithuaniaMalaysiaMexicoMiddle AfricaMoldovaMoroccoNepalNetherlandsNicaraguaNigeriaNorthern AfricaNorthern EuropeNorwayOceaniaPakistanPanamaPeruPhilippinesPolandPortugalRomaniaRussiaSaudi ArabiaScotlandSerbiaSierra LeoneSingaporeSomaliaSouth AfricaSouth AmericaSouth Central AsiaSouth Eastern AsiaSouthern EuropeSpainSri LankaSudanSwedenSwitzerlandSyriaTaiwanThailandTrinidad and TobagoTurkeyUgandaUkraineUruguayUzbekistanVenezuelaVietnamWestern AfricaWestern AsiaWestern EuropeZaireZimbabwe
Income
Income (Families)
Income (Households)
Poverty
Poverty (Families)
Unemployment
Employment Occupations
Employment Industries
Employer Class
Commute Time
Commute Means
School Enrollment
Education by Degree Field
Occupancy
Finances
Physical Characteristics
San Antonio
Compare Zip Codes
Comparison Subject

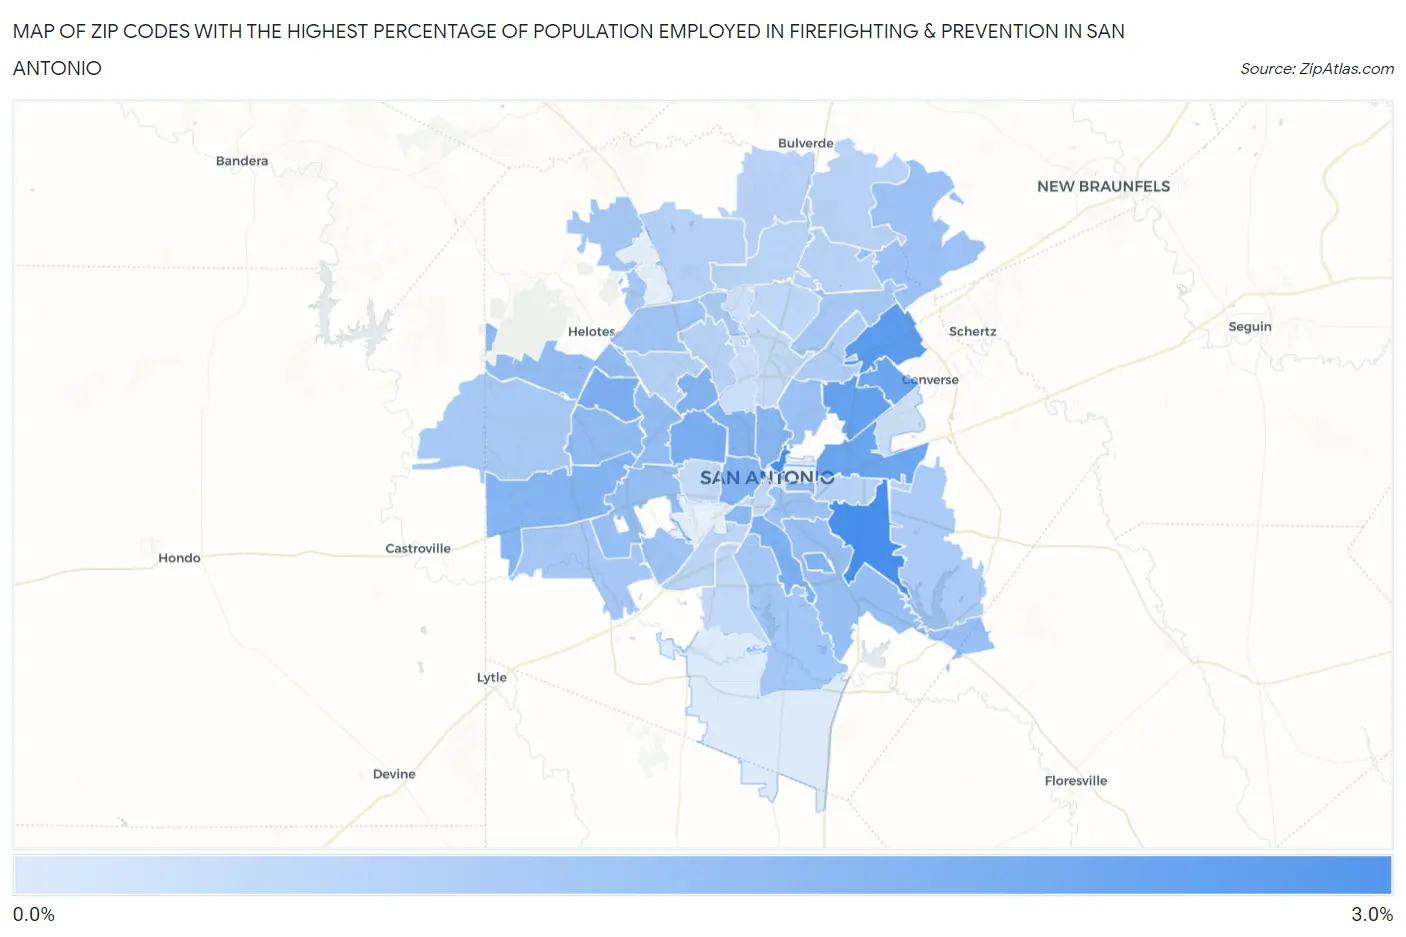
Map of Zip Codes with the Highest Percentage of Population Employed in Firefighting & Prevention in San Antonio

0.0%
3.0%
Zip Codes with the Highest Percentage of Population Employed in Firefighting & Prevention in San Antonio Map

Zip Codes with the Highest Percentage of Population Employed in Firefighting & Prevention in San Antonio, TX

Zip Code % Employed vs State vs National
1.782152.6%1.1%(+1.44)#1831.2%(+1.39)#2,951
2.782222.6%1.1%(+1.43)#1871.2%(+1.37)#2,982
3.782332.2%1.1%(+1.10)#2431.2%(+1.04)#3,775
4.782182.1%1.1%(+0.950)#2711.2%(+0.892)#4,224
5.782191.9%1.1%(+0.810)#3011.2%(+0.753)#4,752
6.782391.9%1.1%(+0.790)#3061.2%(+0.733)#4,840
7.782281.7%1.1%(+0.595)#3591.2%(+0.538)#5,719
8.782141.6%1.1%(+0.514)#3921.2%(+0.457)#6,147
9.782501.6%1.1%(+0.511)#3931.2%(+0.454)#6,171
10.782351.6%1.1%(+0.447)#4121.2%(+0.390)#6,519
11.782291.6%1.1%(+0.424)#4231.2%(+0.367)#6,636
12.782011.5%1.1%(+0.395)#4301.2%(+0.337)#6,831
13.782451.5%1.1%(+0.388)#4341.2%(+0.331)#6,864
14.782071.5%1.1%(+0.381)#4411.2%(+0.324)#6,914
15.782121.5%1.1%(+0.362)#4481.2%(+0.304)#7,040
16.782251.4%1.1%(+0.258)#4921.2%(+0.201)#7,737
17.782511.3%1.1%(+0.195)#5221.2%(+0.137)#8,176
18.782031.3%1.1%(+0.185)#5271.2%(+0.128)#8,251
19.782541.3%1.1%(+0.161)#5421.2%(+0.104)#8,425
20.782381.3%1.1%(+0.144)#5541.2%(+0.086)#8,569
21.782271.2%1.1%(+0.119)#5671.2%(+0.061)#8,759
22.782231.2%1.1%(+0.087)#5811.2%(+0.030)#9,014
23.782091.2%1.1%(+0.028)#6141.2%(-0.029)#9,540
24.782101.1%1.1%(+0.005)#6371.2%(-0.052)#9,791
25.782661.1%1.1%(-0.012)#6471.2%(-0.069)#9,951
26.782421.1%1.1%(-0.046)#6611.2%(-0.103)#10,256
27.782491.1%1.1%(-0.054)#6671.2%(-0.111)#10,340
28.782211.0%1.1%(-0.113)#6991.2%(-0.170)#10,913
29.782551.00%1.1%(-0.129)#7131.2%(-0.186)#11,095
30.782520.99%1.1%(-0.142)#7181.2%(-0.200)#11,232
31.782470.98%1.1%(-0.152)#7251.2%(-0.209)#11,344
32.782530.94%1.1%(-0.192)#7541.2%(-0.250)#11,774
33.782630.91%1.1%(-0.217)#7711.2%(-0.275)#12,041
34.782310.89%1.1%(-0.239)#7851.2%(-0.296)#12,267
35.782170.83%1.1%(-0.296)#8261.2%(-0.353)#12,834
36.782570.75%1.1%(-0.379)#8841.2%(-0.437)#13,771
37.782200.71%1.1%(-0.415)#9021.2%(-0.472)#14,177
38.782400.70%1.1%(-0.431)#9141.2%(-0.489)#14,363
39.782590.69%1.1%(-0.437)#9181.2%(-0.494)#14,429
40.782300.67%1.1%(-0.457)#9331.2%(-0.515)#14,654
41.782600.67%1.1%(-0.458)#9341.2%(-0.516)#14,665
42.782610.66%1.1%(-0.468)#9451.2%(-0.525)#14,784
43.782580.62%1.1%(-0.508)#9671.2%(-0.566)#15,201
44.782110.59%1.1%(-0.542)#9871.2%(-0.599)#15,566
45.782320.56%1.1%(-0.571)#1,0081.2%(-0.629)#15,866
46.782040.52%1.1%(-0.607)#1,0411.2%(-0.665)#16,308
47.782240.52%1.1%(-0.609)#1,0441.2%(-0.667)#16,343
48.782160.48%1.1%(-0.646)#1,0641.2%(-0.703)#16,744
49.782370.46%1.1%(-0.665)#1,0801.2%(-0.722)#16,958
50.782130.37%1.1%(-0.753)#1,1351.2%(-0.811)#17,940
51.782440.34%1.1%(-0.787)#1,1511.2%(-0.844)#18,335
52.782480.29%1.1%(-0.834)#1,1731.2%(-0.891)#18,809
53.782640.061%1.1%(-1.07)#1,2871.2%(-1.12)#20,474

Common Questions

What are the Top 10 Zip Codes with the Highest Percentage of Population Employed in Firefighting & Prevention in San Antonio, TX?
Top 10 Zip Codes with the Highest Percentage of Population Employed in Firefighting & Prevention in San Antonio, TX are:
#1
2.6%
#2
2.6%
#3
2.2%
#4
2.1%
#5
1.9%
#6
1.9%
#7
1.7%
#8
1.6%
#9
1.6%
#10
1.6%
What zip code has the Highest Percentage of Population Employed in Firefighting & Prevention in San Antonio, TX?
78215 has the Highest Percentage of Population Employed in Firefighting & Prevention in San Antonio, TX with 2.6%.
What is the Percentage of Population Employed in Firefighting & Prevention in San Antonio, TX?
Percentage of Population Employed in Firefighting & Prevention in San Antonio is 1.1%.
What is the Percentage of Population Employed in Firefighting & Prevention in Texas?
Percentage of Population Employed in Firefighting & Prevention in Texas is 1.1%.
What is the Percentage of Population Employed in Firefighting & Prevention in the United States?
Percentage of Population Employed in Firefighting & Prevention in the United States is 1.2%.