Zip Codes with the Highest Percentage of Population Employed in Installation, Maintenance & Repair in Boerne, TX
RELATED REPORTS & OPTIONS
Installation, Maintenance & Repair
Boerne
Compare Zip Codes
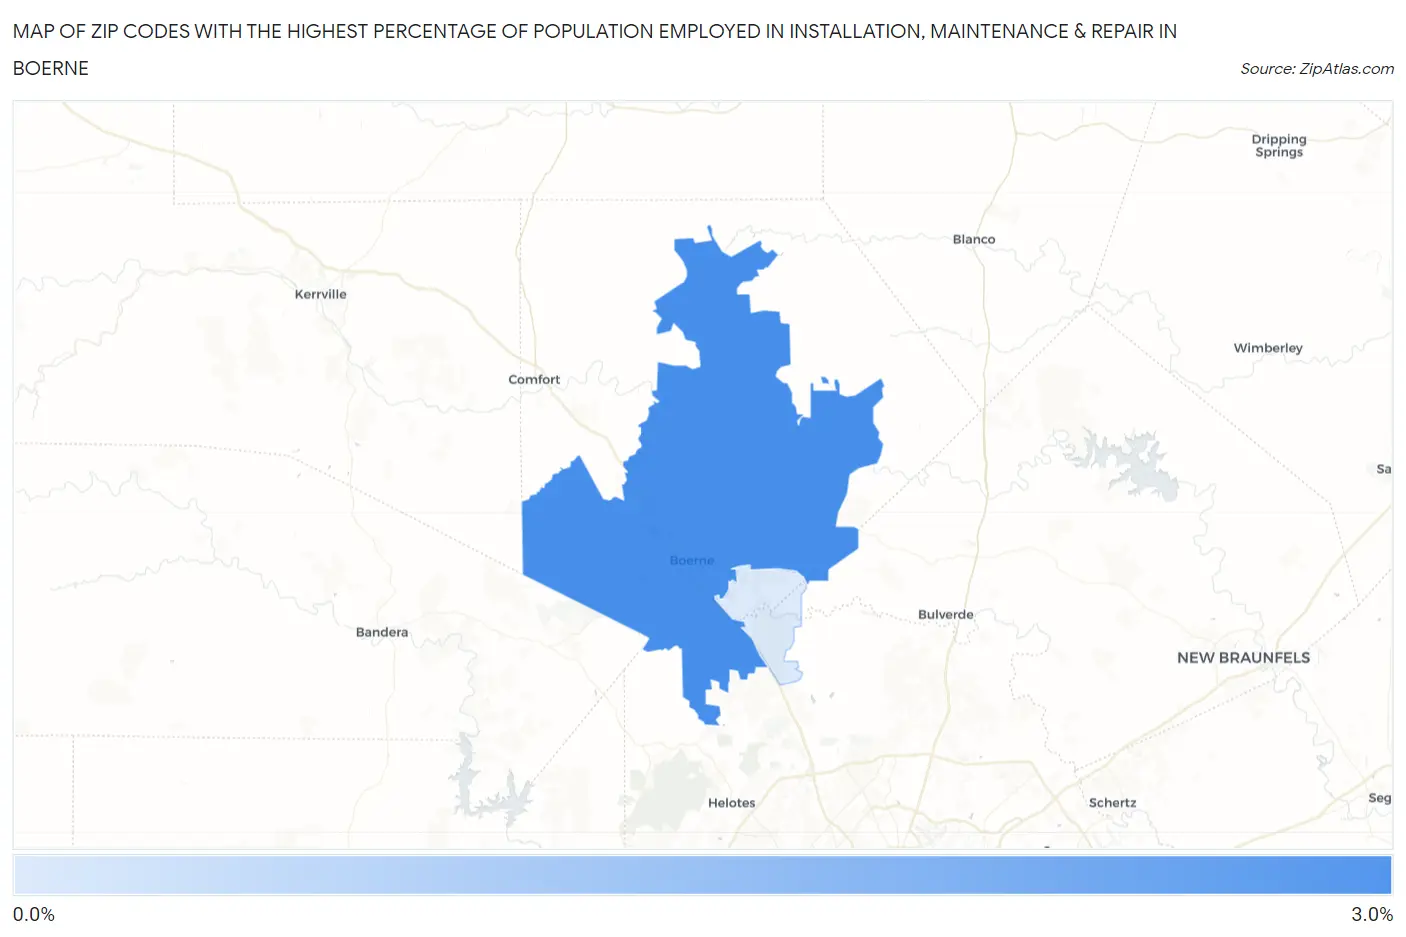
Map of Zip Codes with the Highest Percentage of Population Employed in Installation, Maintenance & Repair in Boerne
0.0%
3.0%
Zip Codes with the Highest Percentage of Population Employed in Installation, Maintenance & Repair in Boerne, TX
| Zip Code | % Employed | vs State | vs National | |
| 1. | 78006 | 2.6% | 3.4%(-0.785)#1,162 | 3.1%(-0.449)#18,983 |
| 2. | 78015 | 0.88% | 3.4%(-2.52)#1,549 | 3.1%(-2.18)#26,245 |
1
Common Questions
What are the Top Zip Codes with the Highest Percentage of Population Employed in Installation, Maintenance & Repair in Boerne, TX?
Top Zip Codes with the Highest Percentage of Population Employed in Installation, Maintenance & Repair in Boerne, TX are:
What zip code has the Highest Percentage of Population Employed in Installation, Maintenance & Repair in Boerne, TX?
78006 has the Highest Percentage of Population Employed in Installation, Maintenance & Repair in Boerne, TX with 2.6%.
What is the Percentage of Population Employed in Installation, Maintenance & Repair in Boerne, TX?
Percentage of Population Employed in Installation, Maintenance & Repair in Boerne is 4.1%.
What is the Percentage of Population Employed in Installation, Maintenance & Repair in Texas?
Percentage of Population Employed in Installation, Maintenance & Repair in Texas is 3.4%.
What is the Percentage of Population Employed in Installation, Maintenance & Repair in the United States?
Percentage of Population Employed in Installation, Maintenance & Repair in the United States is 3.1%.