Zip Codes with the Highest Percentage of Population Employed in Legal Services & Support in Boerne, TX
RELATED REPORTS & OPTIONS
Legal Services & Support
Boerne
Compare Zip Codes
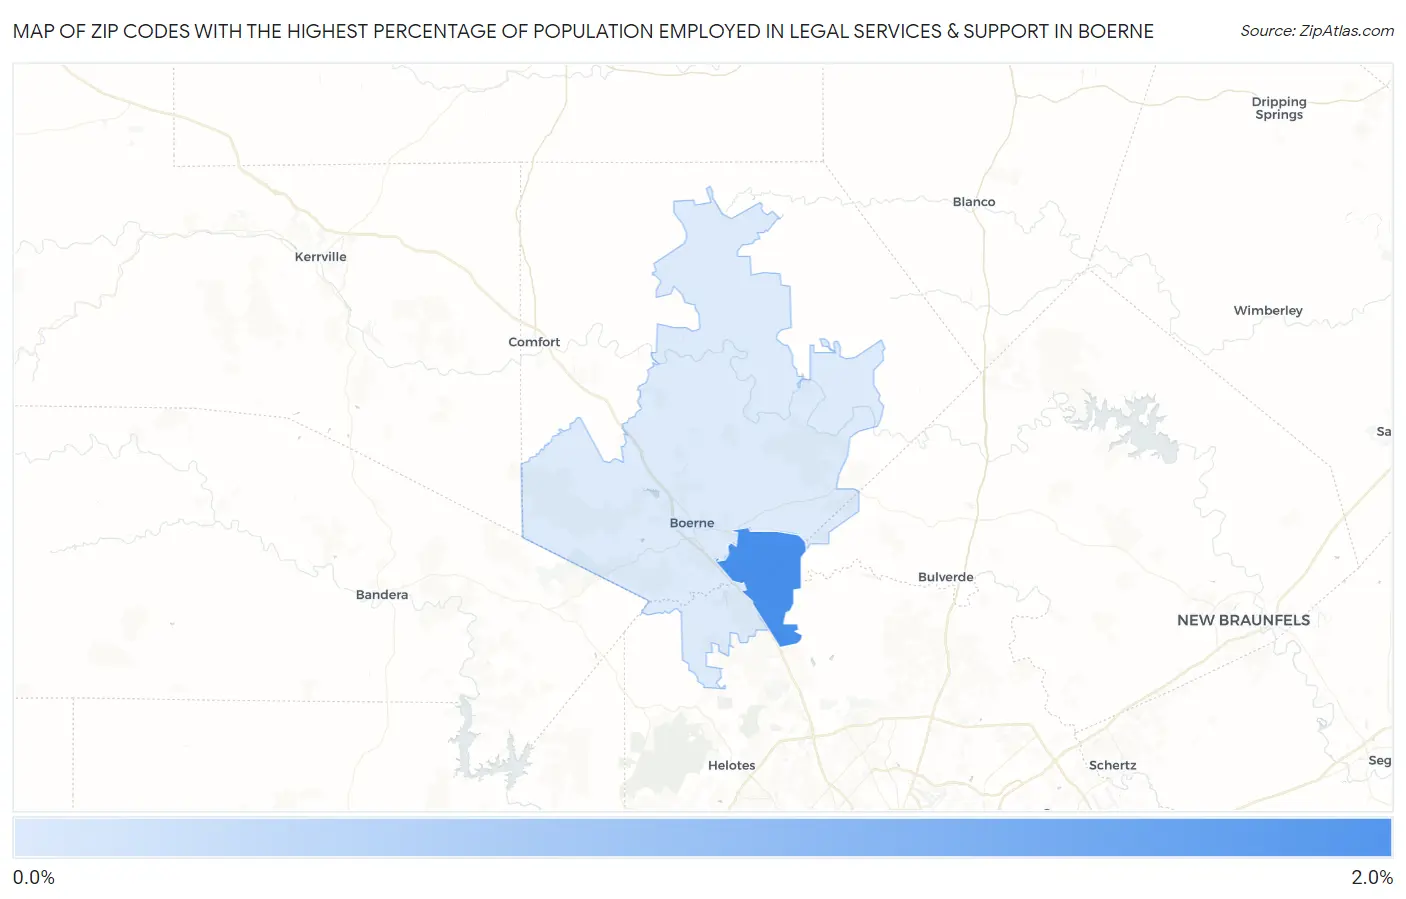
Map of Zip Codes with the Highest Percentage of Population Employed in Legal Services & Support in Boerne
0.0%
2.0%
Zip Codes with the Highest Percentage of Population Employed in Legal Services & Support in Boerne, TX
| Zip Code | % Employed | vs State | vs National | |
| 1. | 78015 | 1.7% | 1.0%(+0.732)#225 | 1.2%(+0.556)#4,175 |
| 2. | 78006 | 0.97% | 1.0%(-0.035)#449 | 1.2%(-0.211)#8,017 |
1
Common Questions
What are the Top Zip Codes with the Highest Percentage of Population Employed in Legal Services & Support in Boerne, TX?
Top Zip Codes with the Highest Percentage of Population Employed in Legal Services & Support in Boerne, TX are:
What zip code has the Highest Percentage of Population Employed in Legal Services & Support in Boerne, TX?
78015 has the Highest Percentage of Population Employed in Legal Services & Support in Boerne, TX with 1.7%.
What is the Percentage of Population Employed in Legal Services & Support in Boerne, TX?
Percentage of Population Employed in Legal Services & Support in Boerne is 0.95%.
What is the Percentage of Population Employed in Legal Services & Support in Texas?
Percentage of Population Employed in Legal Services & Support in Texas is 1.0%.
What is the Percentage of Population Employed in Legal Services & Support in the United States?
Percentage of Population Employed in Legal Services & Support in the United States is 1.2%.