Zip Codes with the Highest Percentage of Population with a Degree in Liberal Arts and History in Boerne, TX
RELATED REPORTS & OPTIONS
Liberal Arts and History
Boerne
Compare Zip Codes
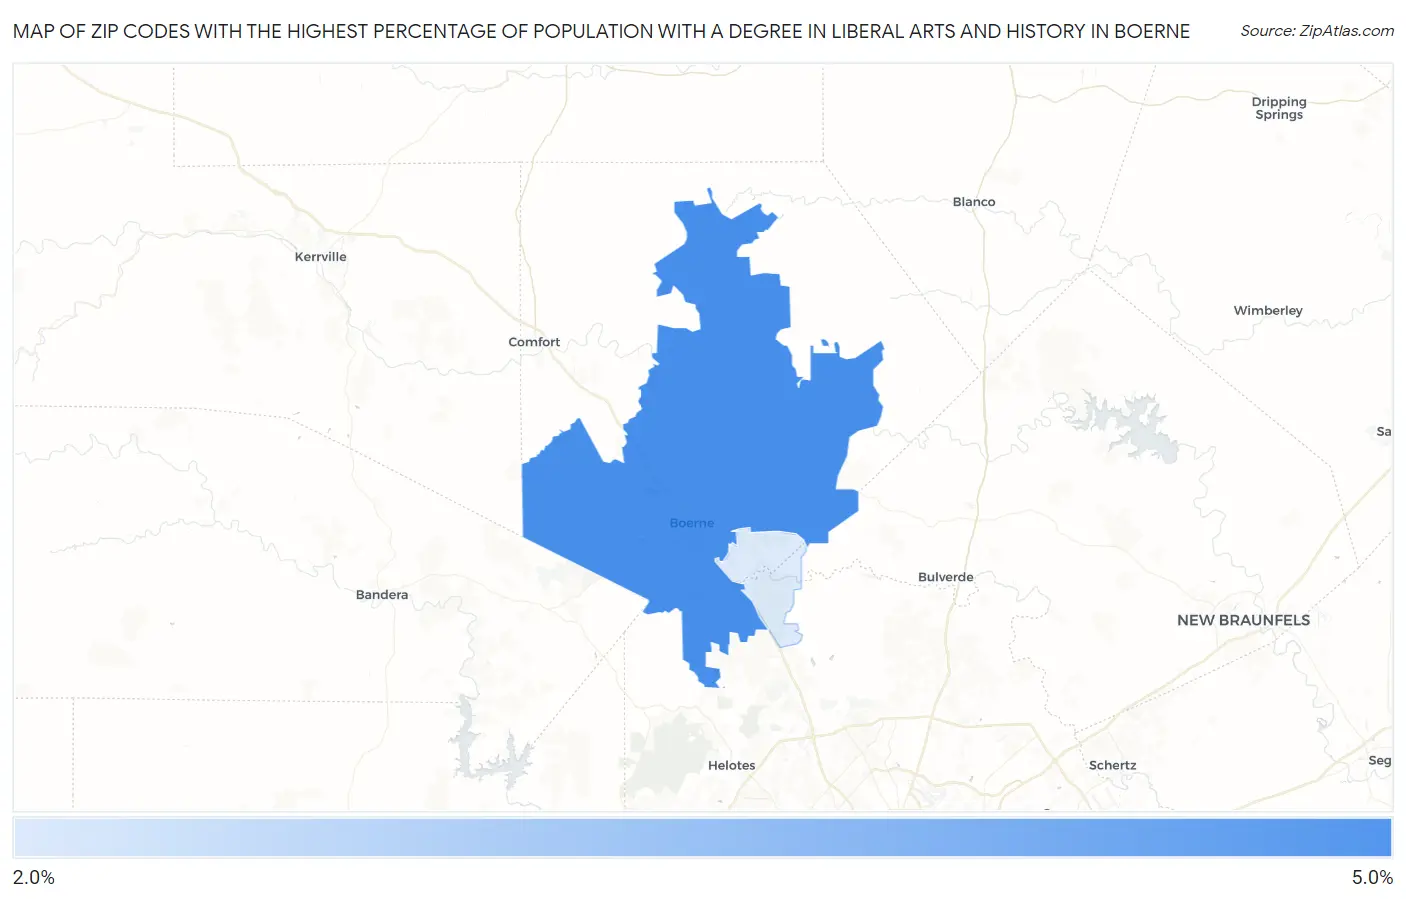
Map of Zip Codes with the Highest Percentage of Population with a Degree in Liberal Arts and History in Boerne
0.0%
5.0%
Zip Codes with the Highest Percentage of Population with a Degree in Liberal Arts and History in Boerne, TX
| Zip Code | % Graduates | vs State | vs National | |
| 1. | 78006 | 4.4% | 4.2%(+0.249)#689 | 4.9%(-0.473)#13,295 |
| 2. | 78015 | 2.7% | 4.2%(-1.50)#1,097 | 4.9%(-2.22)#19,488 |
1
Common Questions
What are the Top Zip Codes with the Highest Percentage of Population with a Degree in Liberal Arts and History in Boerne, TX?
Top Zip Codes with the Highest Percentage of Population with a Degree in Liberal Arts and History in Boerne, TX are:
What zip code has the Highest Percentage of Population with a Degree in Liberal Arts and History in Boerne, TX?
78006 has the Highest Percentage of Population with a Degree in Liberal Arts and History in Boerne, TX with 4.4%.
What is the Percentage of Population with a Degree in Liberal Arts and History in Boerne, TX?
Percentage of Population with a Degree in Liberal Arts and History in Boerne is 4.3%.
What is the Percentage of Population with a Degree in Liberal Arts and History in Texas?
Percentage of Population with a Degree in Liberal Arts and History in Texas is 4.2%.
What is the Percentage of Population with a Degree in Liberal Arts and History in the United States?
Percentage of Population with a Degree in Liberal Arts and History in the United States is 4.9%.