Zip Codes with the Highest Percentage of Population Employed in Security & Protection in Boerne, TX
RELATED REPORTS & OPTIONS
Security & Protection
Boerne
Compare Zip Codes
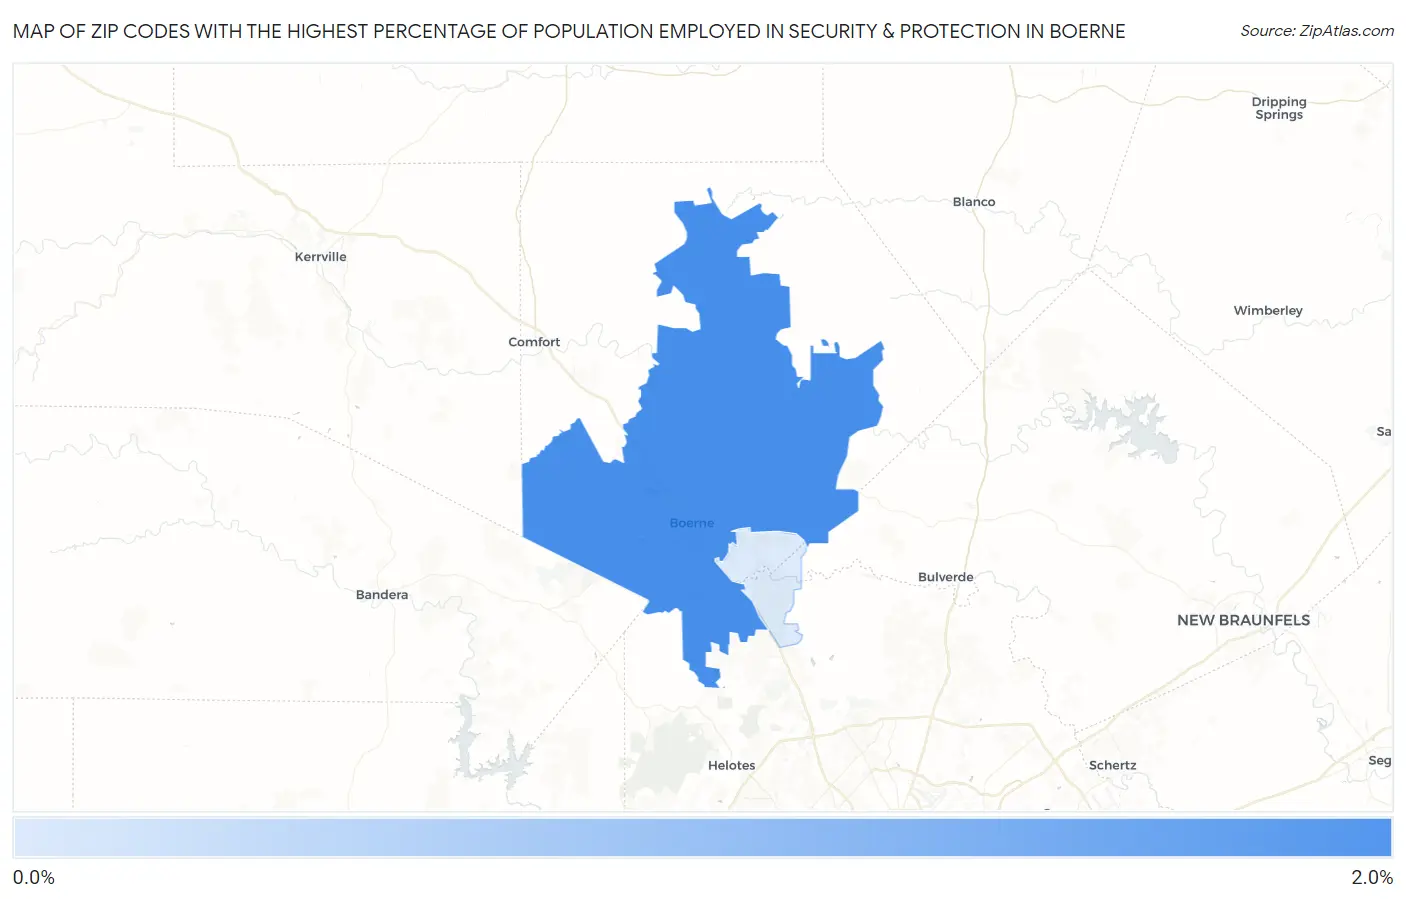
Map of Zip Codes with the Highest Percentage of Population Employed in Security & Protection in Boerne
0.0%
2.0%
Zip Codes with the Highest Percentage of Population Employed in Security & Protection in Boerne, TX
| Zip Code | % Employed | vs State | vs National | |
| 1. | 78006 | 1.8% | 2.2%(-0.463)#971 | 2.1%(-0.387)#14,220 |
| 2. | 78015 | 0.94% | 2.2%(-1.28)#1,328 | 2.1%(-1.20)#20,475 |
1
Common Questions
What are the Top Zip Codes with the Highest Percentage of Population Employed in Security & Protection in Boerne, TX?
Top Zip Codes with the Highest Percentage of Population Employed in Security & Protection in Boerne, TX are:
What zip code has the Highest Percentage of Population Employed in Security & Protection in Boerne, TX?
78006 has the Highest Percentage of Population Employed in Security & Protection in Boerne, TX with 1.8%.
What is the Percentage of Population Employed in Security & Protection in Boerne, TX?
Percentage of Population Employed in Security & Protection in Boerne is 2.0%.
What is the Percentage of Population Employed in Security & Protection in Texas?
Percentage of Population Employed in Security & Protection in Texas is 2.2%.
What is the Percentage of Population Employed in Security & Protection in the United States?
Percentage of Population Employed in Security & Protection in the United States is 2.1%.