Grant, OK
Grant Map
Grant Overview
247
TOTAL POPULATION
110
MALE POPULATION
137
FEMALE POPULATION
80.29
MALES / 100 FEMALES
124.55
FEMALES / 100 MALES
41.5
MEDIAN AGE
3.4
AVG FAMILY SIZE
2.6
AVG HOUSEHOLD SIZE
$20,475
PER CAPITA INCOME
$47,813
AVG FAMILY INCOME
$46,875
AVG HOUSEHOLD INCOME
5.8%
WAGE / INCOME GAP [ % ]
94.2¢/ $1
WAGE / INCOME GAP [ $ ]
0.40
INEQUALITY / GINI INDEX
111
LABOR FORCE [ PEOPLE ]
59.0%
PERCENT IN LABOR FORCE
14.4%
UNEMPLOYMENT RATE
Grant Zip Codes
Grant Area Codes
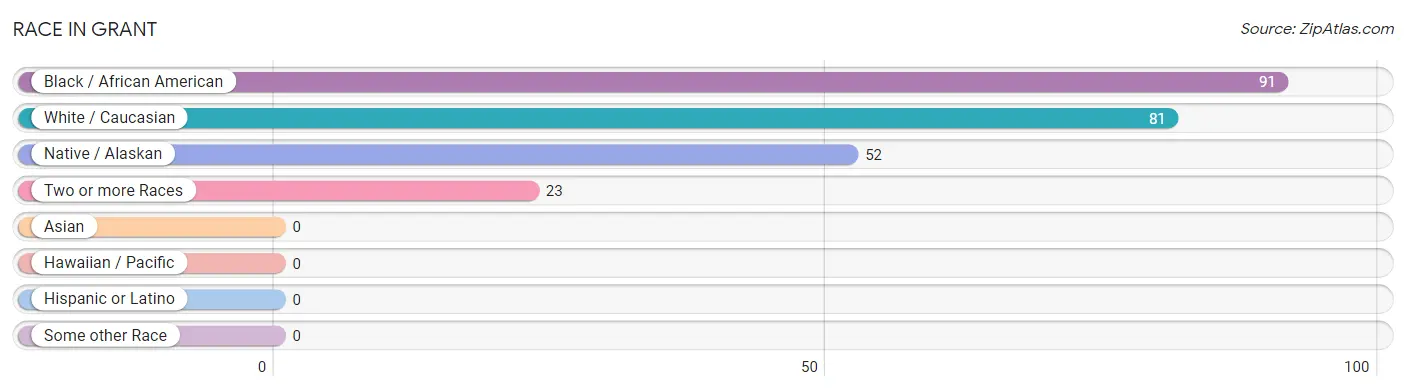
Race in Grant
The most populous races in Grant are Black / African American (91 | 36.8%), White / Caucasian (81 | 32.8%), and Native / Alaskan (52 | 21.0%).
| Race | # Population | % Population |
| Asian | 0 | 0.0% |
| Black / African American | 91 | 36.8% |
| Hawaiian / Pacific | 0 | 0.0% |
| Hispanic or Latino | 0 | 0.0% |
| Native / Alaskan | 52 | 21.0% |
| White / Caucasian | 81 | 32.8% |
| Two or more Races | 23 | 9.3% |
| Some other Race | 0 | 0.0% |
| Total | 247 | 100.0% |
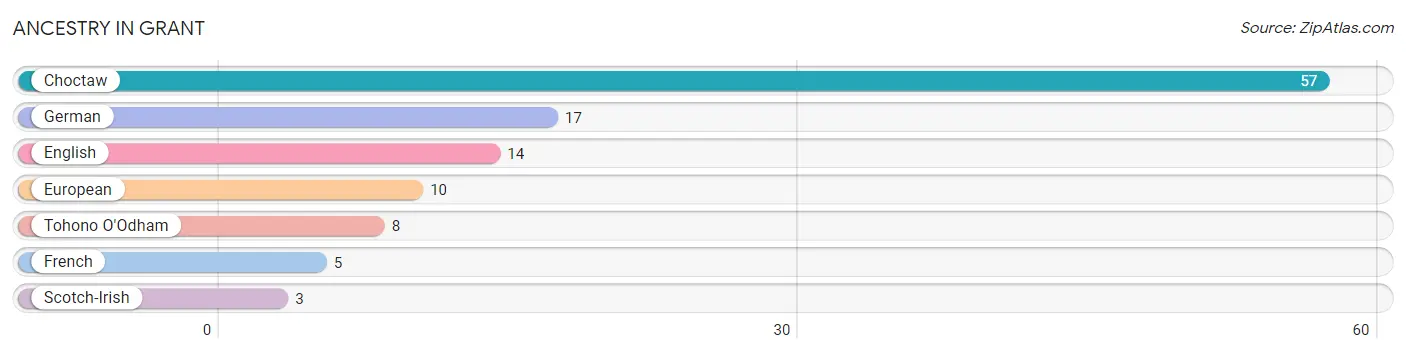
Ancestry in Grant
The most populous ancestries reported in Grant are Choctaw (57 | 23.1%), German (17 | 6.9%), English (14 | 5.7%), European (10 | 4.1%), and Tohono O'Odham (8 | 3.2%), together accounting for 42.9% of all Grant residents.
| Ancestry | # Population | % Population |
| Choctaw | 57 | 23.1% |
| English | 14 | 5.7% |
| European | 10 | 4.1% |
| French | 5 | 2.0% |
| German | 17 | 6.9% |
| Scotch-Irish | 3 | 1.2% |
| Tohono O'Odham | 8 | 3.2% | View All 7 Rows |
Immigrants in Grant

| Immigration Origin | # Population | % Population | View All 0 Rows |
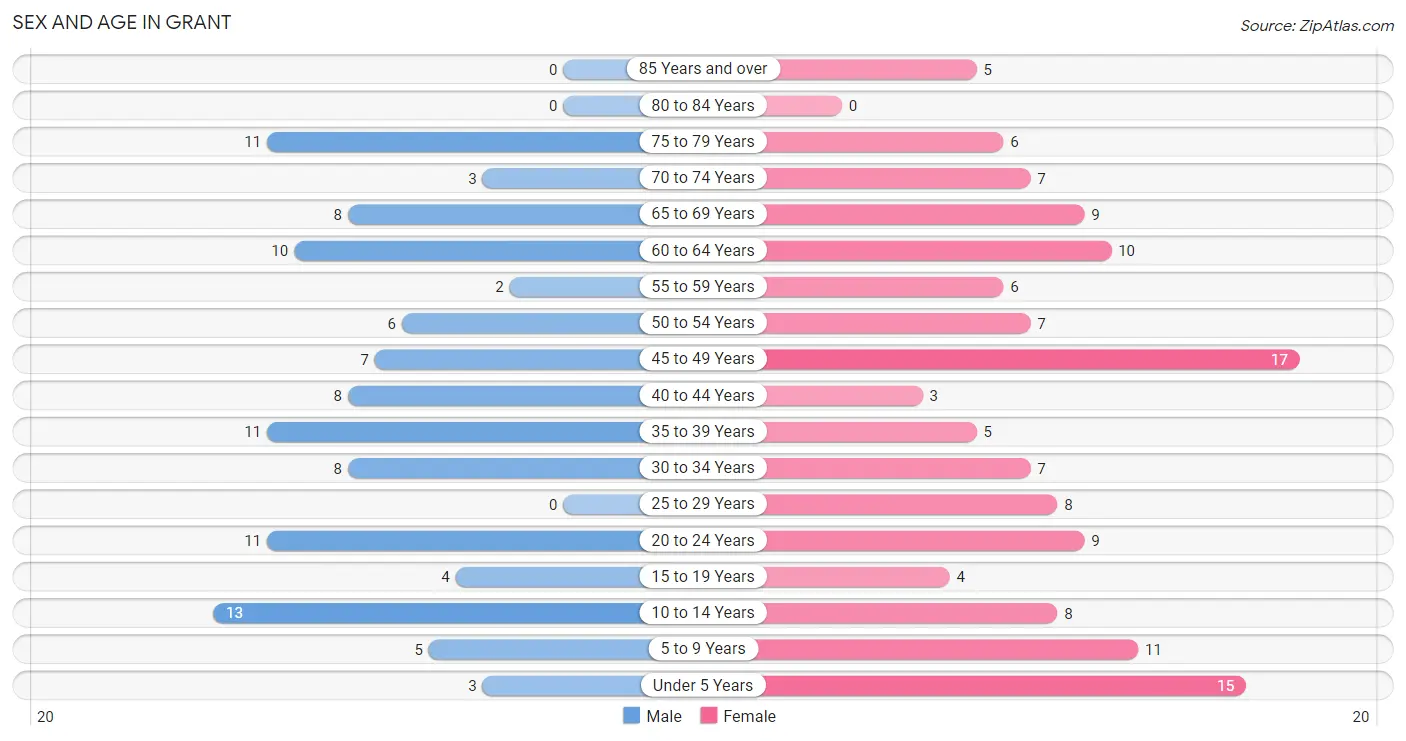
Sex and Age in Grant
Sex and Age in Grant
The most populous age groups in Grant are 10 to 14 Years (13 | 11.8%) for men and 45 to 49 Years (17 | 12.4%) for women.
| Age Bracket | Male | Female |
| Under 5 Years | 3 (2.7%) | 15 (11.0%) |
| 5 to 9 Years | 5 (4.5%) | 11 (8.0%) |
| 10 to 14 Years | 13 (11.8%) | 8 (5.8%) |
| 15 to 19 Years | 4 (3.6%) | 4 (2.9%) |
| 20 to 24 Years | 11 (10.0%) | 9 (6.6%) |
| 25 to 29 Years | 0 (0.0%) | 8 (5.8%) |
| 30 to 34 Years | 8 (7.3%) | 7 (5.1%) |
| 35 to 39 Years | 11 (10.0%) | 5 (3.6%) |
| 40 to 44 Years | 8 (7.3%) | 3 (2.2%) |
| 45 to 49 Years | 7 (6.4%) | 17 (12.4%) |
| 50 to 54 Years | 6 (5.4%) | 7 (5.1%) |
| 55 to 59 Years | 2 (1.8%) | 6 (4.4%) |
| 60 to 64 Years | 10 (9.1%) | 10 (7.3%) |
| 65 to 69 Years | 8 (7.3%) | 9 (6.6%) |
| 70 to 74 Years | 3 (2.7%) | 7 (5.1%) |
| 75 to 79 Years | 11 (10.0%) | 6 (4.4%) |
| 80 to 84 Years | 0 (0.0%) | 0 (0.0%) |
| 85 Years and over | 0 (0.0%) | 5 (3.6%) |
| Total | 110 (100.0%) | 137 (100.0%) |
Families and Households in Grant
Median Family Size in Grant
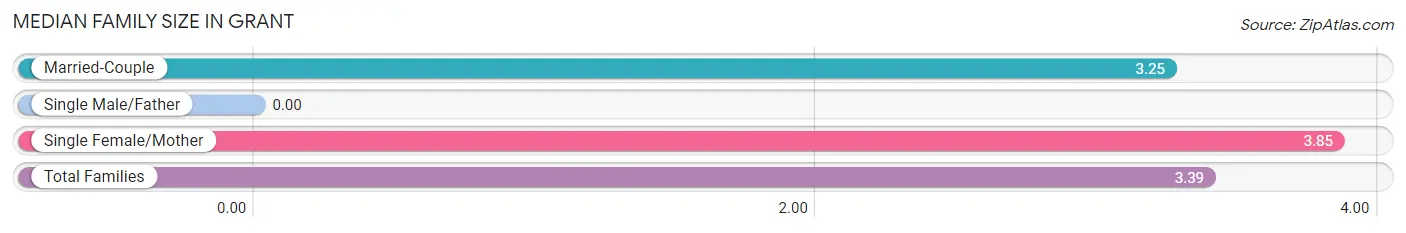
| Family Type | # Families | Family Size |
| Married-Couple | 44 (77.2%) | 3.25 |
| Single Male/Father | 0 (0.0%) | - |
| Single Female/Mother | 13 (22.8%) | 3.85 |
| Total Families | 57 (100.0%) | 3.39 |
Median Household Size in Grant
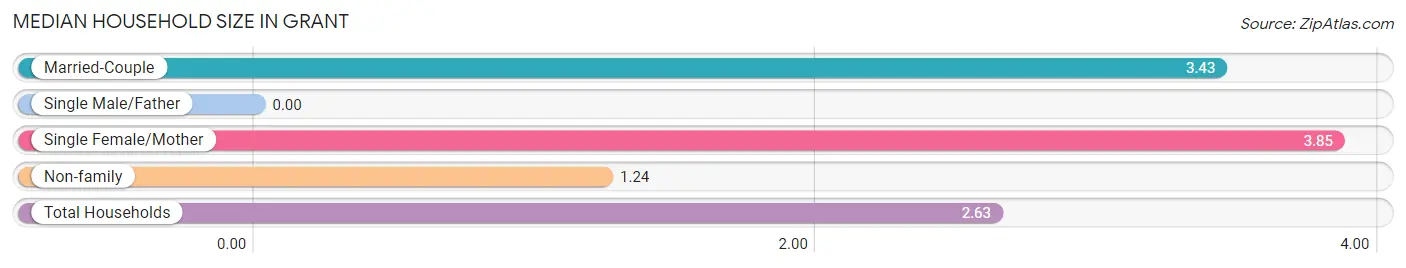
| Household Type | # Households | Household Size |
| Married-Couple | 44 (46.8%) | 3.43 |
| Single Male/Father | 0 (0.0%) | - |
| Single Female/Mother | 13 (13.8%) | 3.85 |
| Non-family | 37 (39.4%) | 1.24 |
| Total Households | 94 (100.0%) | 2.63 |
Household Size by Marriage Status in Grant
Out of a total of 94 households in Grant, 57 (60.6%) are family households, while 37 (39.4%) are nonfamily households. The most numerous type of family households are 2-person households, comprising 21, and the most common type of nonfamily households are 1-person households, comprising 24.
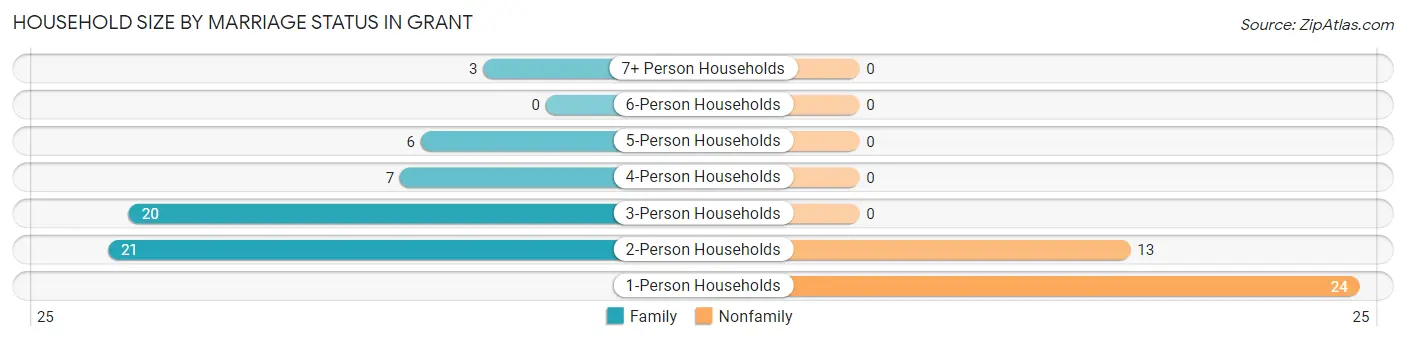
| Household Size | Family Households | Nonfamily Households |
| 1-Person Households | - | 24 (25.5%) |
| 2-Person Households | 21 (22.3%) | 13 (13.8%) |
| 3-Person Households | 20 (21.3%) | 0 (0.0%) |
| 4-Person Households | 7 (7.4%) | 0 (0.0%) |
| 5-Person Households | 6 (6.4%) | 0 (0.0%) |
| 6-Person Households | 0 (0.0%) | 0 (0.0%) |
| 7+ Person Households | 3 (3.2%) | 0 (0.0%) |
| Total | 57 (60.6%) | 37 (39.4%) |
Female Fertility in Grant
Fertility by Age in Grant
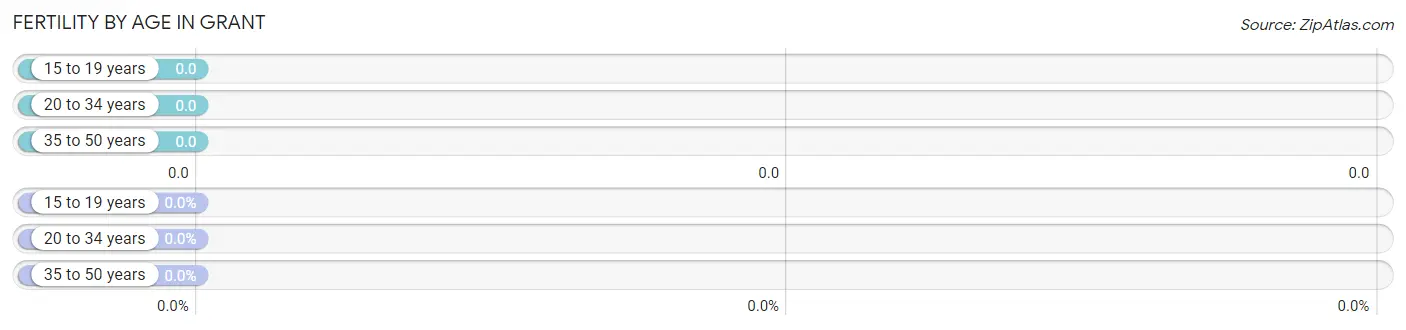
| Age Bracket | Women with Births | Births / 1,000 Women |
| 15 to 19 years | 0 (0.0%) | 0.0 |
| 20 to 34 years | 0 (0.0%) | 0.0 |
| 35 to 50 years | 0 (0.0%) | 0.0 |
| Total | 0 (0.0%) | 0.0 |
Fertility by Age by Marriage Status in Grant
| Age Bracket | Married | Unmarried |
| 15 to 19 years | 0 (0.0%) | 0 (0.0%) |
| 20 to 34 years | 0 (0.0%) | 0 (0.0%) |
| 35 to 50 years | 0 (0.0%) | 0 (0.0%) |
| Total | 0 (0.0%) | 0 (0.0%) |
Fertility by Education in Grant
| Educational Attainment | Women with Births | Births / 1,000 Women |
| Less than High School | 0 (0.0%) | 0.0 |
| High School Diploma | 0 (0.0%) | 0.0 |
| College or Associate's Degree | 0 (0.0%) | 0.0 |
| Bachelor's Degree | 0 (0.0%) | 0.0 |
| Graduate Degree | 0 (0.0%) | 0.0 |
| Total | 0 (0.0%) | 0.0 |
Fertility by Education by Marriage Status in Grant
| Educational Attainment | Married | Unmarried |
| Less than High School | 0 (0.0%) | 0 (0.0%) |
| High School Diploma | 0 (0.0%) | 0 (0.0%) |
| College or Associate's Degree | 0 (0.0%) | 0 (0.0%) |
| Bachelor's Degree | 0 (0.0%) | 0 (0.0%) |
| Graduate Degree | 0 (0.0%) | 0 (0.0%) |
| Total | 0 (0.0%) | 0 (0.0%) |
Income in Grant
Income Overview in Grant
Per Capita Income in Grant is $20,475, while median incomes of families and households are $47,813 and $46,875 respectively.
| Characteristic | Number | Measure |
| Per Capita Income | 247 | $20,475 |
| Median Family Income | 57 | $47,813 |
| Mean Family Income | 57 | $62,598 |
| Median Household Income | 94 | $46,875 |
| Mean Household Income | 94 | $52,031 |
| Income Deficit | 57 | $0 |
| Wage / Income Gap (%) | 247 | 5.84% |
| Wage / Income Gap ($) | 247 | 94.16¢ per $1 |
| Gini / Inequality Index | 247 | 0.40 |
Earnings by Sex in Grant
Average Earnings in Grant are $28,875, $28,500 for men and $30,268 for women, a difference of 5.8%.
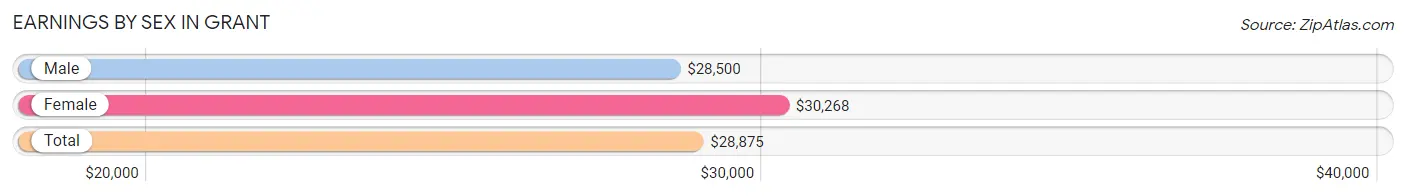
| Sex | Number | Average Earnings |
| Male | 50 (42.7%) | $28,500 |
| Female | 67 (57.3%) | $30,268 |
| Total | 117 (100.0%) | $28,875 |
Earnings by Sex by Income Bracket in Grant
The most common earnings brackets in Grant are $25,000 to $29,999 for men (10 | 20.0%) and $30,000 to $34,999 for women (14 | 20.9%).
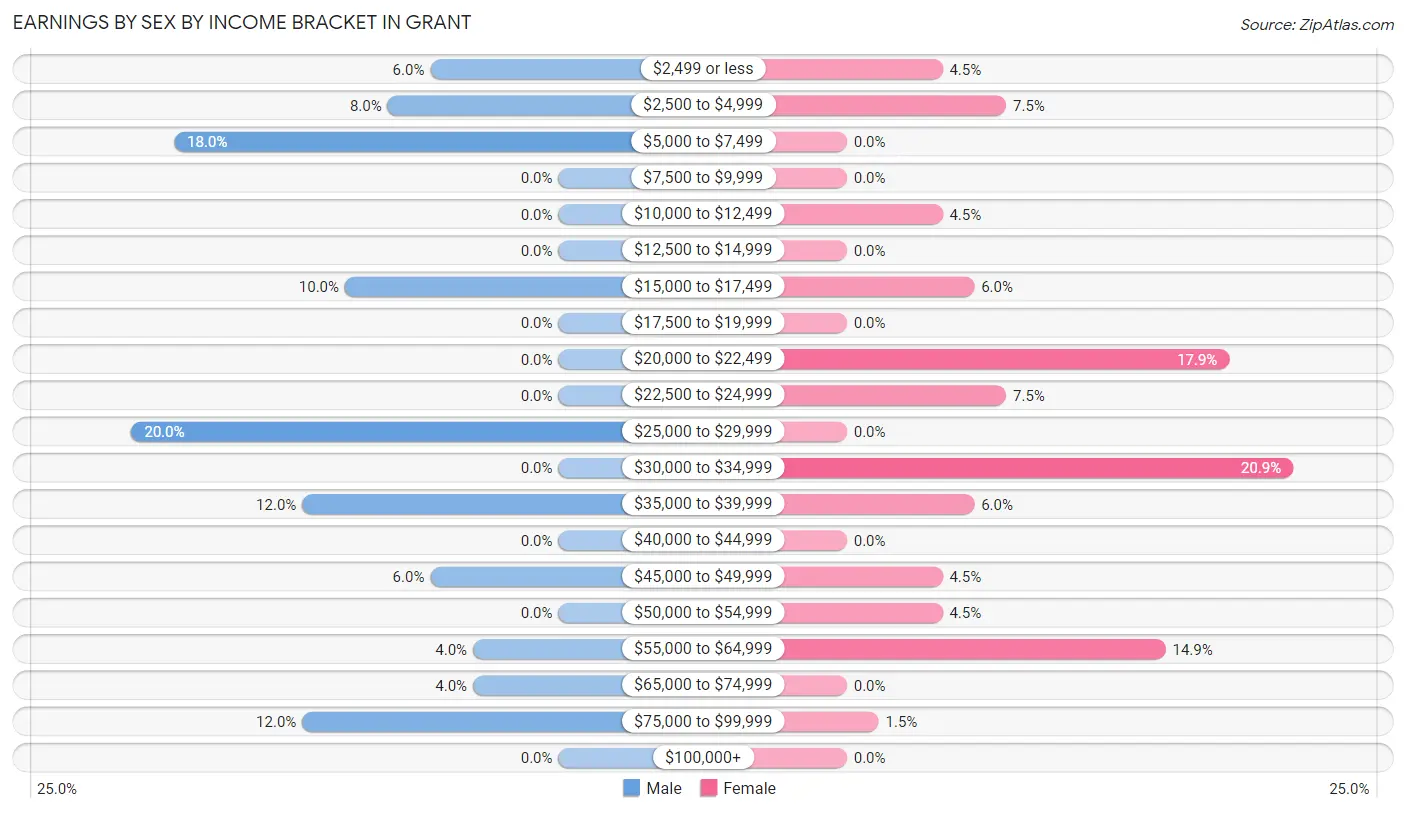
| Income | Male | Female |
| $2,499 or less | 3 (6.0%) | 3 (4.5%) |
| $2,500 to $4,999 | 4 (8.0%) | 5 (7.5%) |
| $5,000 to $7,499 | 9 (18.0%) | 0 (0.0%) |
| $7,500 to $9,999 | 0 (0.0%) | 0 (0.0%) |
| $10,000 to $12,499 | 0 (0.0%) | 3 (4.5%) |
| $12,500 to $14,999 | 0 (0.0%) | 0 (0.0%) |
| $15,000 to $17,499 | 5 (10.0%) | 4 (6.0%) |
| $17,500 to $19,999 | 0 (0.0%) | 0 (0.0%) |
| $20,000 to $22,499 | 0 (0.0%) | 12 (17.9%) |
| $22,500 to $24,999 | 0 (0.0%) | 5 (7.5%) |
| $25,000 to $29,999 | 10 (20.0%) | 0 (0.0%) |
| $30,000 to $34,999 | 0 (0.0%) | 14 (20.9%) |
| $35,000 to $39,999 | 6 (12.0%) | 4 (6.0%) |
| $40,000 to $44,999 | 0 (0.0%) | 0 (0.0%) |
| $45,000 to $49,999 | 3 (6.0%) | 3 (4.5%) |
| $50,000 to $54,999 | 0 (0.0%) | 3 (4.5%) |
| $55,000 to $64,999 | 2 (4.0%) | 10 (14.9%) |
| $65,000 to $74,999 | 2 (4.0%) | 0 (0.0%) |
| $75,000 to $99,999 | 6 (12.0%) | 1 (1.5%) |
| $100,000+ | 0 (0.0%) | 0 (0.0%) |
| Total | 50 (100.0%) | 67 (100.0%) |
Earnings by Sex by Educational Attainment in Grant
Average earnings in Grant are $29,844 for men and $31,071 for women, a difference of 4.0%. Men with an educational attainment of high school diploma enjoy the highest average annual earnings of $28,750, while those with high school diploma education earn the least with $28,750. Women with an educational attainment of college or associate's degree earn the most with the average annual earnings of $32,344, while those with high school diploma education have the smallest earnings of $20,625.
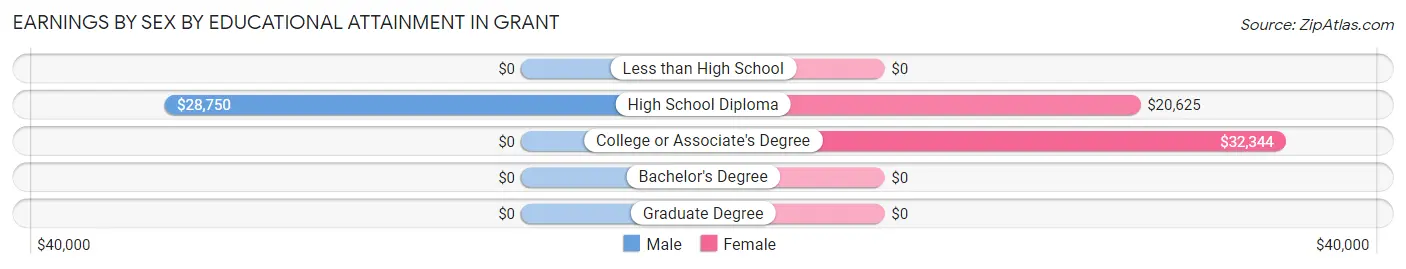
| Educational Attainment | Male Income | Female Income |
| Less than High School | - | - |
| High School Diploma | $28,750 | $20,625 |
| College or Associate's Degree | - | - |
| Bachelor's Degree | - | - |
| Graduate Degree | - | - |
| Total | $29,844 | $31,071 |
Family Income in Grant
Family Income Brackets in Grant
According to the Grant family income data, there are 15 families falling into the $35,000 to $49,999 income range, which is the most common income bracket and makes up 26.3% of all families.
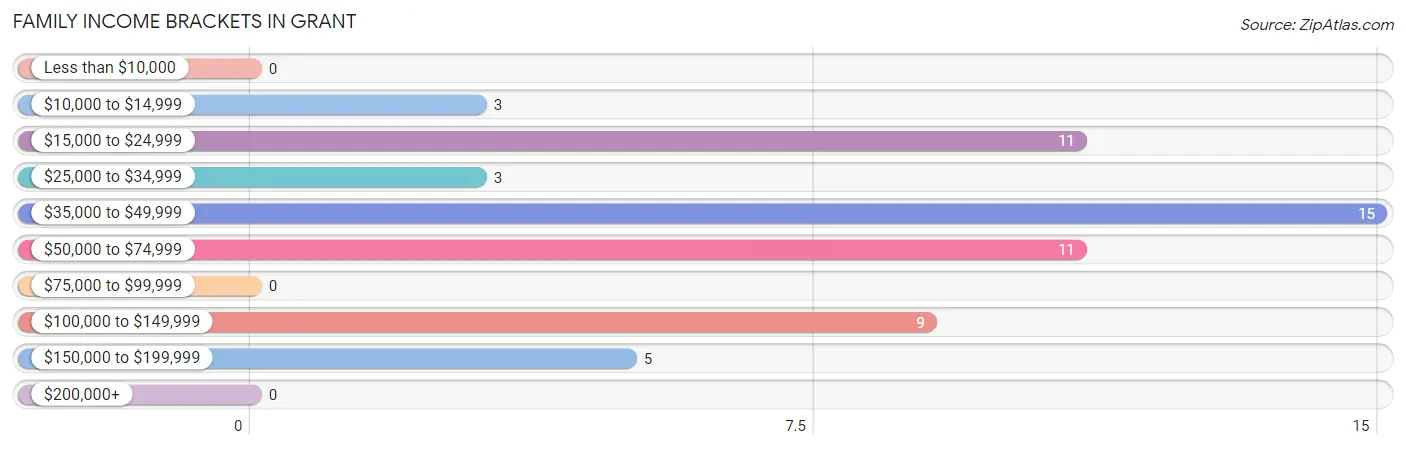
| Income Bracket | # Families | % Families |
| Less than $10,000 | 0 | 0.0% |
| $10,000 to $14,999 | 3 | 5.3% |
| $15,000 to $24,999 | 11 | 19.3% |
| $25,000 to $34,999 | 3 | 5.3% |
| $35,000 to $49,999 | 15 | 26.3% |
| $50,000 to $74,999 | 11 | 19.3% |
| $75,000 to $99,999 | 0 | 0.0% |
| $100,000 to $149,999 | 9 | 15.8% |
| $150,000 to $199,999 | 5 | 8.8% |
| $200,000+ | 0 | 0.0% |
Family Income by Famaliy Size in Grant
2-person families (21 | 36.8%) account for the highest median family income in Grant with $47,813 per family, while 2-person families (21 | 36.8%) have the highest median income of $23,906 per family member.
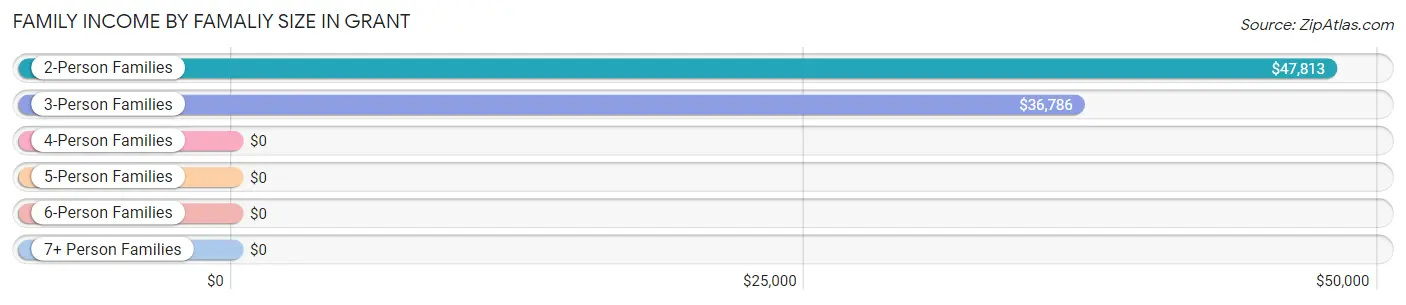
| Income Bracket | # Families | Median Income |
| 2-Person Families | 21 (36.8%) | $47,813 |
| 3-Person Families | 24 (42.1%) | $36,786 |
| 4-Person Families | 7 (12.3%) | $0 |
| 5-Person Families | 2 (3.5%) | $0 |
| 6-Person Families | 0 (0.0%) | $0 |
| 7+ Person Families | 3 (5.3%) | $0 |
| Total | 57 (100.0%) | $47,813 |
Family Income by Number of Earners in Grant
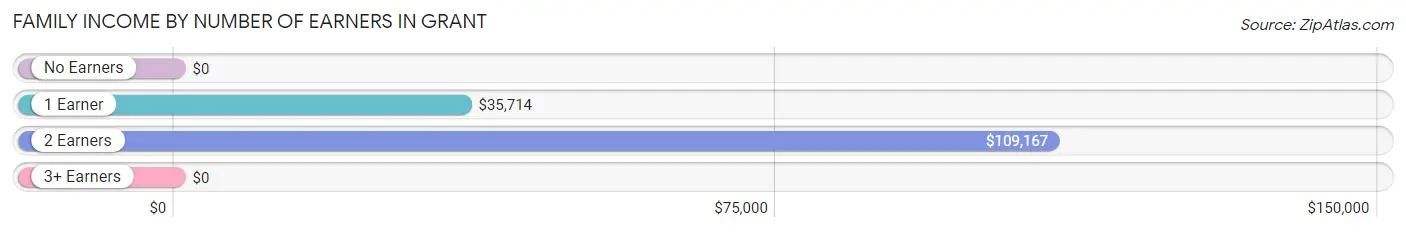
| Number of Earners | # Families | Median Income |
| No Earners | 18 (31.6%) | $0 |
| 1 Earner | 18 (31.6%) | $35,714 |
| 2 Earners | 18 (31.6%) | $109,167 |
| 3+ Earners | 3 (5.3%) | $0 |
| Total | 57 (100.0%) | $47,813 |
Household Income in Grant
Household Income Brackets in Grant
With 28 households falling in the category, the $50,000 to $74,999 income range is the most frequent in Grant, accounting for 29.8% of all households.
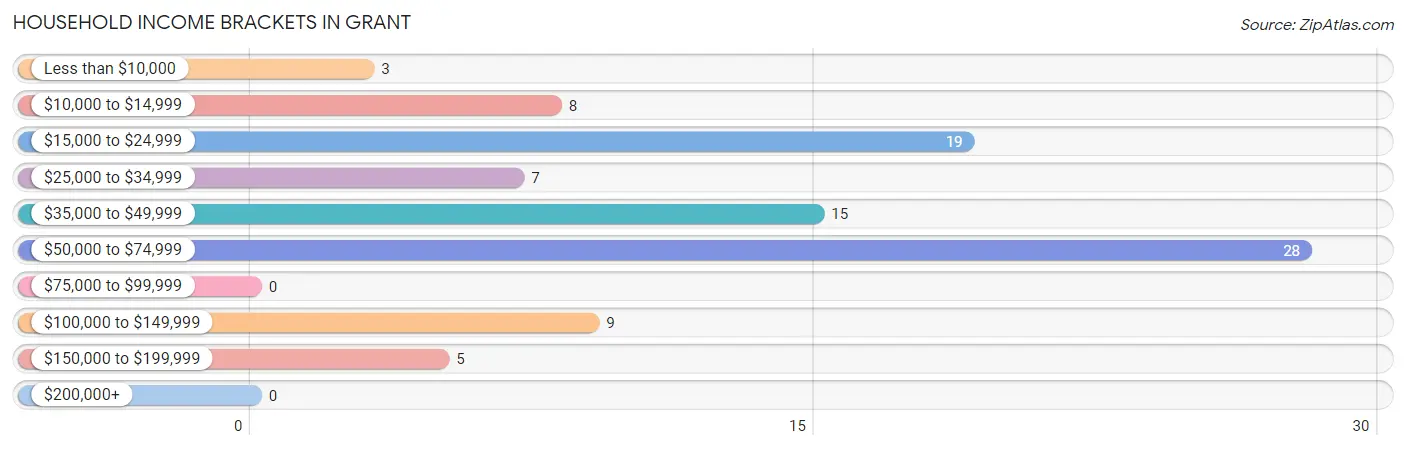
| Income Bracket | # Households | % Households |
| Less than $10,000 | 3 | 3.2% |
| $10,000 to $14,999 | 8 | 8.5% |
| $15,000 to $24,999 | 19 | 20.2% |
| $25,000 to $34,999 | 7 | 7.4% |
| $35,000 to $49,999 | 15 | 16.0% |
| $50,000 to $74,999 | 28 | 29.8% |
| $75,000 to $99,999 | 0 | 0.0% |
| $100,000 to $149,999 | 9 | 9.6% |
| $150,000 to $199,999 | 5 | 5.3% |
| $200,000+ | 0 | 0.0% |
Household Income by Householder Age in Grant
The median household income in Grant is $46,875, with the highest median household income of $55,000 found in the 45 to 64 years age bracket for the primary householder. A total of 42 households (44.7%) fall into this category. Meanwhile, the 15 to 24 years age bracket for the primary householder has the lowest median household income of $0, with 5 households (5.3%) in this group.
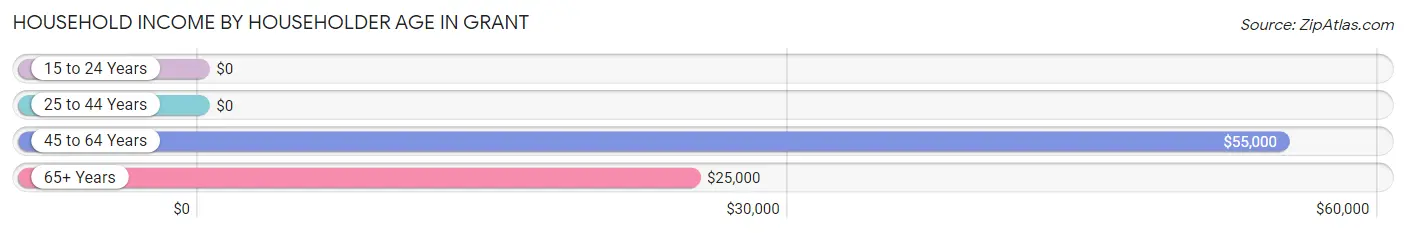
| Income Bracket | # Households | Median Income |
| 15 to 24 Years | 5 (5.3%) | $0 |
| 25 to 44 Years | 21 (22.3%) | $0 |
| 45 to 64 Years | 42 (44.7%) | $55,000 |
| 65+ Years | 26 (27.7%) | $25,000 |
| Total | 94 (100.0%) | $46,875 |
Poverty in Grant
Income Below Poverty by Sex and Age in Grant
With 13.1% poverty level for males and 15.9% for females among the residents of Grant, 6 to 11 year old males and 6 to 11 year old females are the most vulnerable to poverty, with 5 males (83.3%) and 11 females (68.8%) in their respective age groups living below the poverty level.
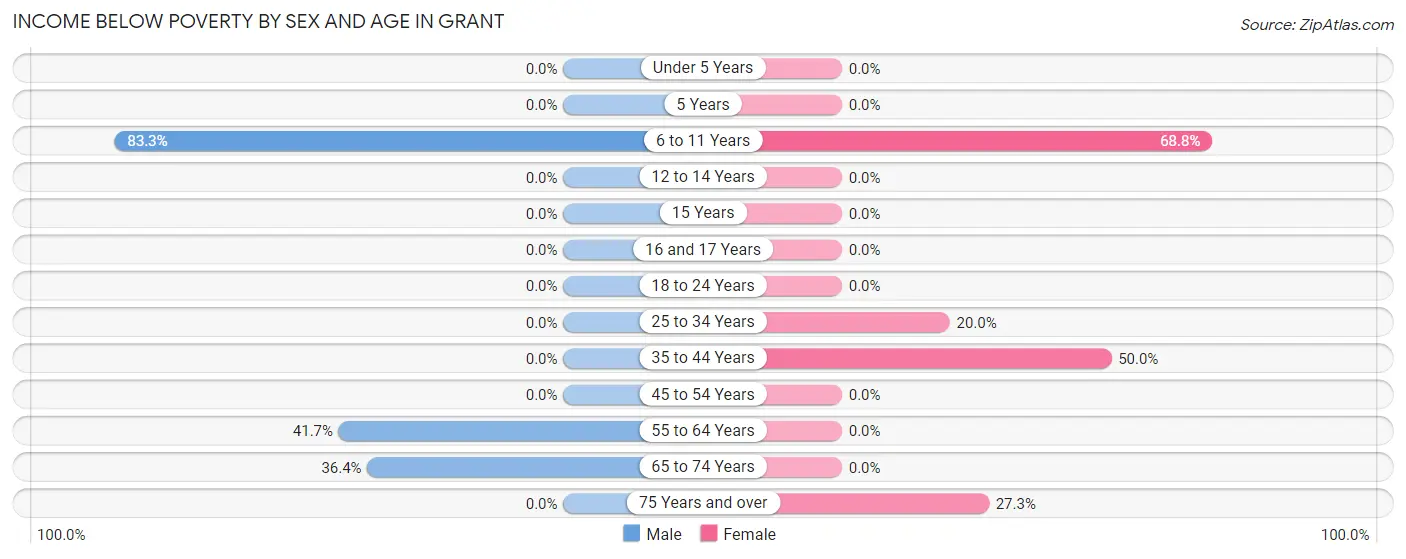
| Age Bracket | Male | Female |
| Under 5 Years | 0 (0.0%) | 0 (0.0%) |
| 5 Years | 0 (0.0%) | 0 (0.0%) |
| 6 to 11 Years | 5 (83.3%) | 11 (68.8%) |
| 12 to 14 Years | 0 (0.0%) | 0 (0.0%) |
| 15 Years | 0 (0.0%) | 0 (0.0%) |
| 16 and 17 Years | 0 (0.0%) | 0 (0.0%) |
| 18 to 24 Years | 0 (0.0%) | 0 (0.0%) |
| 25 to 34 Years | 0 (0.0%) | 3 (20.0%) |
| 35 to 44 Years | 0 (0.0%) | 4 (50.0%) |
| 45 to 54 Years | 0 (0.0%) | 0 (0.0%) |
| 55 to 64 Years | 5 (41.7%) | 0 (0.0%) |
| 65 to 74 Years | 4 (36.4%) | 0 (0.0%) |
| 75 Years and over | 0 (0.0%) | 3 (27.3%) |
| Total | 14 (13.1%) | 21 (15.9%) |
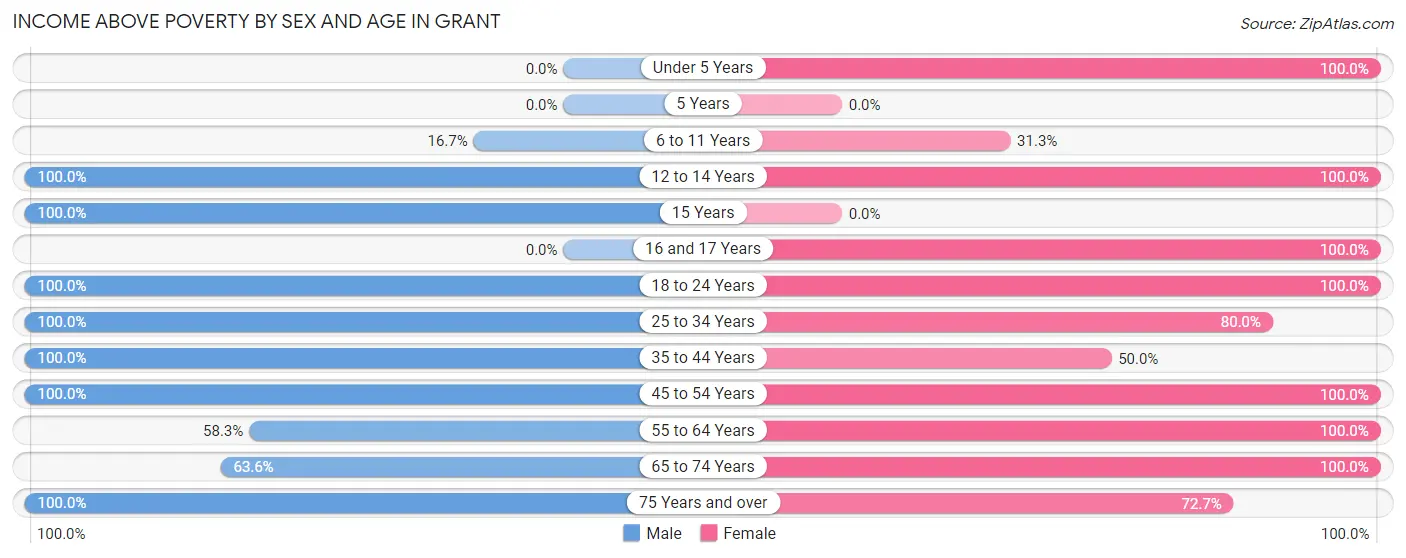
Income Above Poverty by Sex and Age in Grant
According to the poverty statistics in Grant, males aged 12 to 14 years and females aged under 5 years are the age groups that are most secure financially, with 100.0% of males and 100.0% of females in these age groups living above the poverty line.
| Age Bracket | Male | Female |
| Under 5 Years | 0 (0.0%) | 10 (100.0%) |
| 5 Years | 0 (0.0%) | 0 (0.0%) |
| 6 to 11 Years | 1 (16.7%) | 5 (31.2%) |
| 12 to 14 Years | 12 (100.0%) | 3 (100.0%) |
| 15 Years | 4 (100.0%) | 0 (0.0%) |
| 16 and 17 Years | 0 (0.0%) | 4 (100.0%) |
| 18 to 24 Years | 11 (100.0%) | 9 (100.0%) |
| 25 to 34 Years | 8 (100.0%) | 12 (80.0%) |
| 35 to 44 Years | 19 (100.0%) | 4 (50.0%) |
| 45 to 54 Years | 13 (100.0%) | 24 (100.0%) |
| 55 to 64 Years | 7 (58.3%) | 16 (100.0%) |
| 65 to 74 Years | 7 (63.6%) | 16 (100.0%) |
| 75 Years and over | 11 (100.0%) | 8 (72.7%) |
| Total | 93 (86.9%) | 111 (84.1%) |
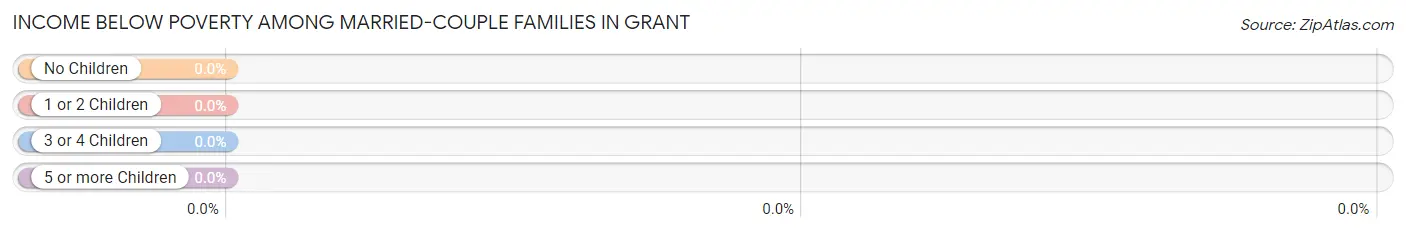
Income Below Poverty Among Married-Couple Families in Grant
| Children | Above Poverty | Below Poverty |
| No Children | 21 (100.0%) | 0 (0.0%) |
| 1 or 2 Children | 21 (100.0%) | 0 (0.0%) |
| 3 or 4 Children | 2 (100.0%) | 0 (0.0%) |
| 5 or more Children | 0 (0.0%) | 0 (0.0%) |
| Total | 44 (100.0%) | 0 (0.0%) |
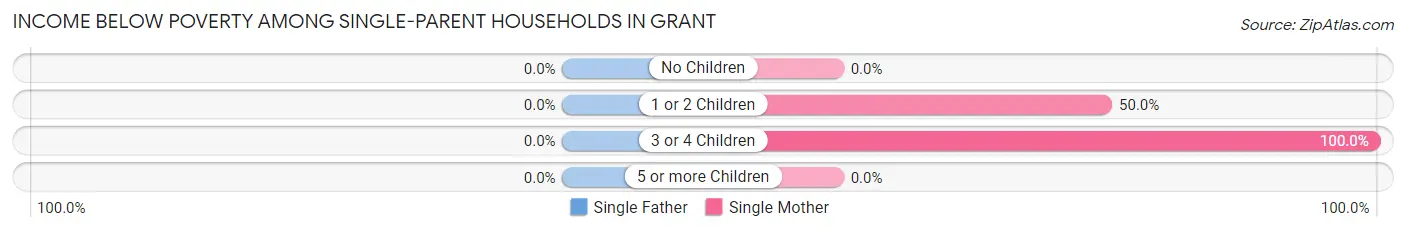
Income Below Poverty Among Single-Parent Households in Grant
| Children | Single Father | Single Mother |
| No Children | 0 (0.0%) | 0 (0.0%) |
| 1 or 2 Children | 0 (0.0%) | 3 (50.0%) |
| 3 or 4 Children | 0 (0.0%) | 4 (100.0%) |
| 5 or more Children | 0 (0.0%) | 0 (0.0%) |
| Total | 0 (0.0%) | 7 (53.8%) |
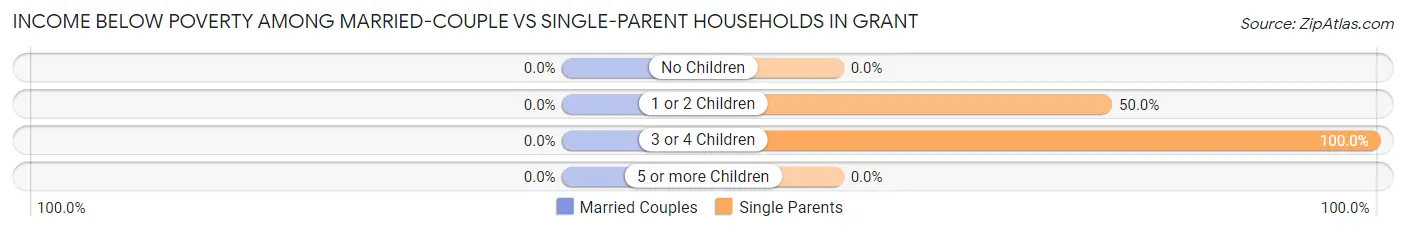
Income Below Poverty Among Married-Couple vs Single-Parent Households in Grant
| Children | Married-Couple Families | Single-Parent Households |
| No Children | 0 (0.0%) | 0 (0.0%) |
| 1 or 2 Children | 0 (0.0%) | 3 (50.0%) |
| 3 or 4 Children | 0 (0.0%) | 4 (100.0%) |
| 5 or more Children | 0 (0.0%) | 0 (0.0%) |
| Total | 0 (0.0%) | 7 (53.8%) |
Employment Characteristics in Grant
Employment by Class of Employer in Grant
Among the 95 employed individuals in Grant, private company employees (54 | 56.8%), not-for-profit organizations (24 | 25.3%), and local government employees (12 | 12.6%) make up the most common classes of employment.
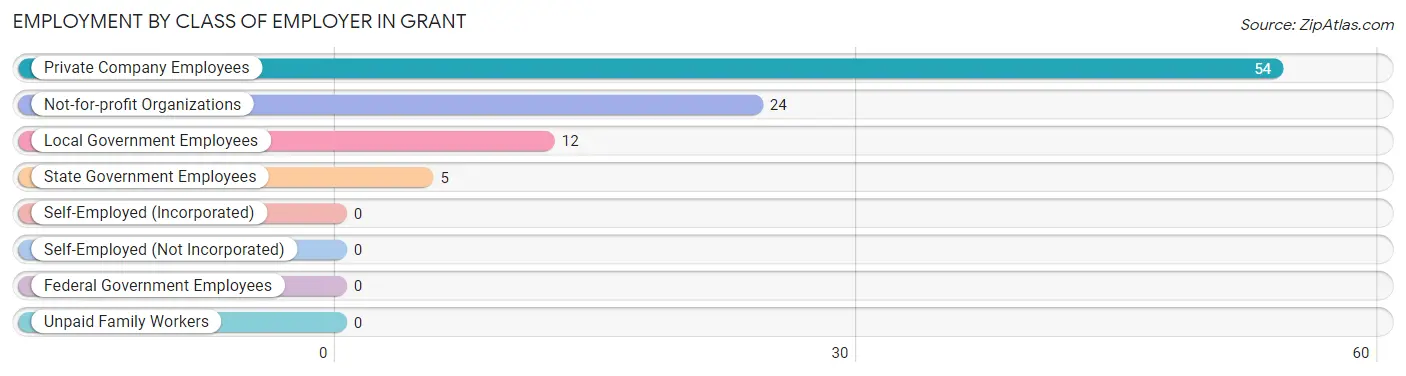
| Employer Class | # Employees | % Employees |
| Private Company Employees | 54 | 56.8% |
| Self-Employed (Incorporated) | 0 | 0.0% |
| Self-Employed (Not Incorporated) | 0 | 0.0% |
| Not-for-profit Organizations | 24 | 25.3% |
| Local Government Employees | 12 | 12.6% |
| State Government Employees | 5 | 5.3% |
| Federal Government Employees | 0 | 0.0% |
| Unpaid Family Workers | 0 | 0.0% |
| Total | 95 | 100.0% |
Employment Status by Age in Grant
According to the labor force statistics for Grant, out of the total population over 16 years of age (188), 59.0% or 111 individuals are in the labor force, with 14.4% or 16 of them unemployed. The age group with the highest labor force participation rate is 16 to 19 years, with 100.0% or 4 individuals in the labor force. Within the labor force, the 16 to 19 years age range has the highest percentage of unemployed individuals, with 100.0% or 4 of them being unemployed.
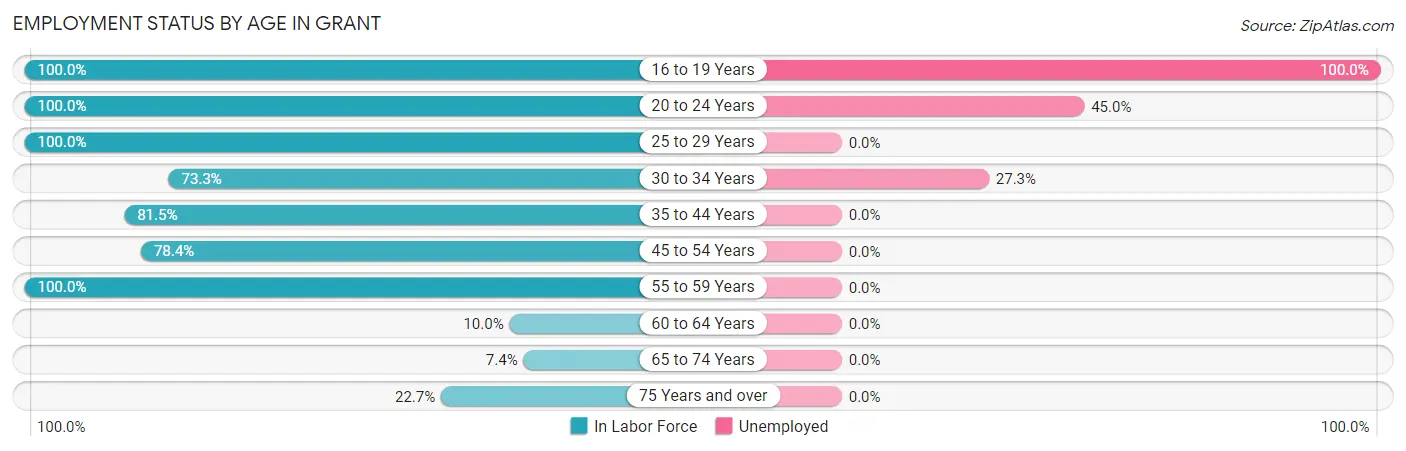
| Age Bracket | In Labor Force | Unemployed |
| 16 to 19 Years | 4 (100.0%) | 4 (100.0%) |
| 20 to 24 Years | 20 (100.0%) | 9 (45.0%) |
| 25 to 29 Years | 8 (100.0%) | 0 (0.0%) |
| 30 to 34 Years | 11 (73.3%) | 3 (27.3%) |
| 35 to 44 Years | 22 (81.5%) | 0 (0.0%) |
| 45 to 54 Years | 29 (78.4%) | 0 (0.0%) |
| 55 to 59 Years | 8 (100.0%) | 0 (0.0%) |
| 60 to 64 Years | 2 (10.0%) | 0 (0.0%) |
| 65 to 74 Years | 2 (7.4%) | 0 (0.0%) |
| 75 Years and over | 5 (22.7%) | 0 (0.0%) |
| Total | 111 (59.0%) | 16 (14.4%) |
Employment Status by Educational Attainment in Grant
According to labor force statistics for Grant, 69.6% of individuals (80) out of the total population between 25 and 64 years of age (115) are in the labor force, with 3.8% or 3 of them being unemployed. The group with the highest labor force participation rate are those with the educational attainment of college / associate degree, with 90.5% or 38 individuals in the labor force. Within the labor force, individuals with high school diploma education have the highest percentage of unemployment, with 8.8% or 3 of them being unemployed.
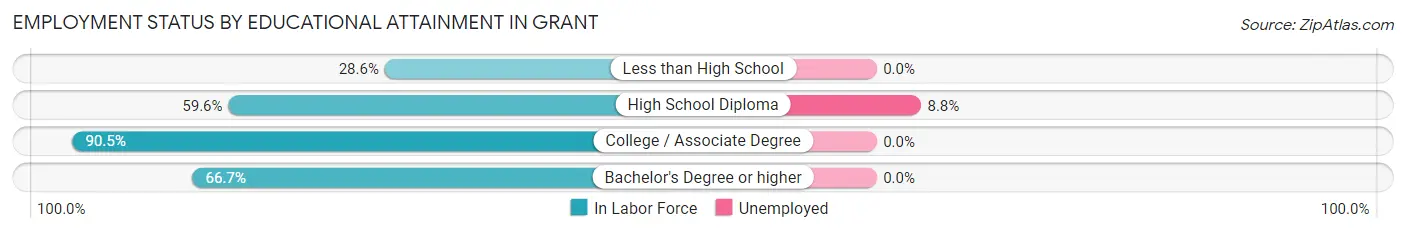
| Educational Attainment | In Labor Force | Unemployed |
| Less than High School | 2 (28.6%) | 0 (0.0%) |
| High School Diploma | 34 (59.6%) | 5 (8.8%) |
| College / Associate Degree | 38 (90.5%) | 0 (0.0%) |
| Bachelor's Degree or higher | 6 (66.7%) | 0 (0.0%) |
| Total | 80 (69.6%) | 4 (3.8%) |
Employment Occupations by Sex in Grant
Management, Business, Science and Arts Occupations
The most common Management, Business, Science and Arts occupations in Grant are Management (11 | 11.6%), Health Diagnosing & Treating (10 | 10.5%), Computers, Engineering & Science (4 | 4.2%), Life, Physical & Social Science (4 | 4.2%), and Business & Financial (3 | 3.2%).
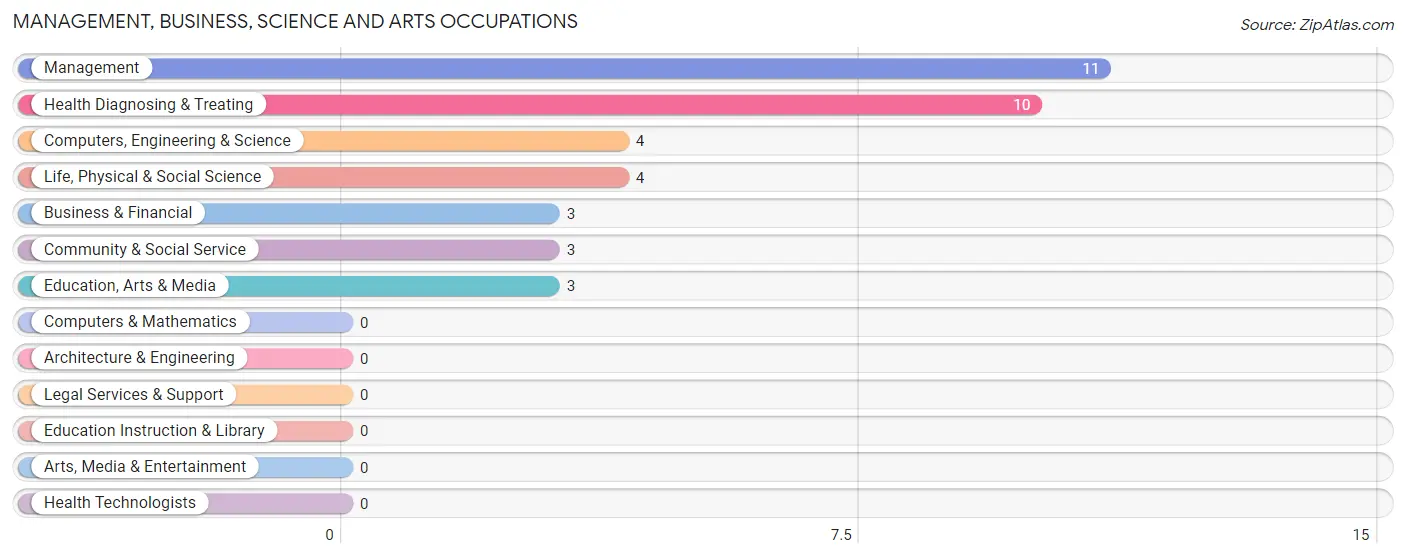
Management, Business, Science and Arts Occupations by Sex
Within the Management, Business, Science and Arts occupations in Grant, the most male-oriented occupations are Computers, Engineering & Science (100.0%), Life, Physical & Social Science (100.0%), and Management (63.6%), while the most female-oriented occupations are Business & Financial (100.0%), Community & Social Service (100.0%), and Education, Arts & Media (100.0%).
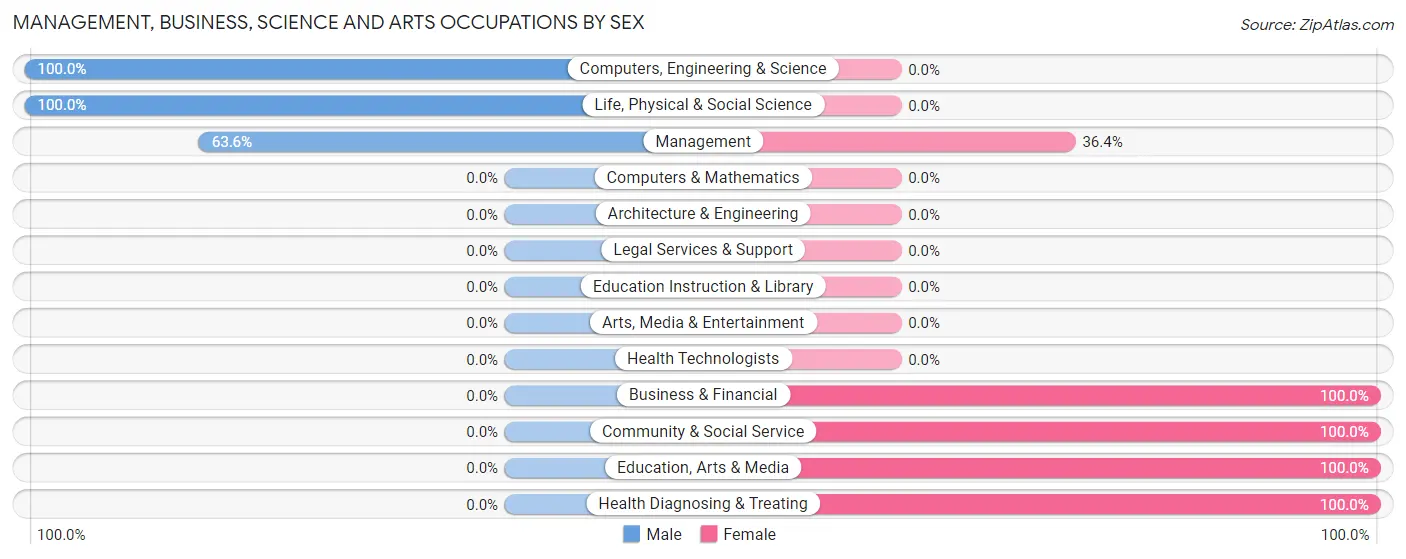
| Occupation | Male | Female |
| Management | 7 (63.6%) | 4 (36.4%) |
| Business & Financial | 0 (0.0%) | 3 (100.0%) |
| Computers, Engineering & Science | 4 (100.0%) | 0 (0.0%) |
| Computers & Mathematics | 0 (0.0%) | 0 (0.0%) |
| Architecture & Engineering | 0 (0.0%) | 0 (0.0%) |
| Life, Physical & Social Science | 4 (100.0%) | 0 (0.0%) |
| Community & Social Service | 0 (0.0%) | 3 (100.0%) |
| Education, Arts & Media | 0 (0.0%) | 3 (100.0%) |
| Legal Services & Support | 0 (0.0%) | 0 (0.0%) |
| Education Instruction & Library | 0 (0.0%) | 0 (0.0%) |
| Arts, Media & Entertainment | 0 (0.0%) | 0 (0.0%) |
| Health Diagnosing & Treating | 0 (0.0%) | 10 (100.0%) |
| Health Technologists | 0 (0.0%) | 0 (0.0%) |
| Total (Category) | 11 (35.5%) | 20 (64.5%) |
| Total (Overall) | 38 (40.0%) | 57 (60.0%) |
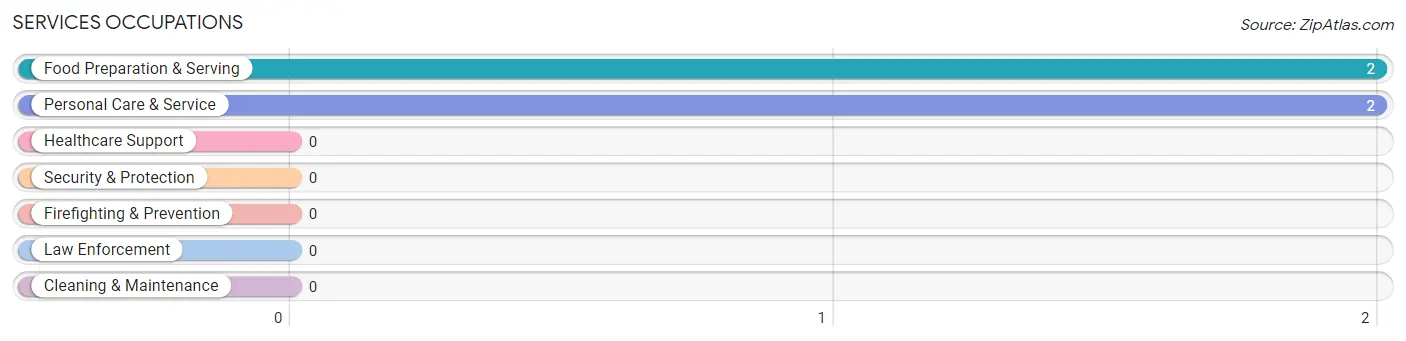
Services Occupations
The most common Services occupations in Grant are Food Preparation & Serving (2 | 2.1%), and Personal Care & Service (2 | 2.1%).
Services Occupations by Sex
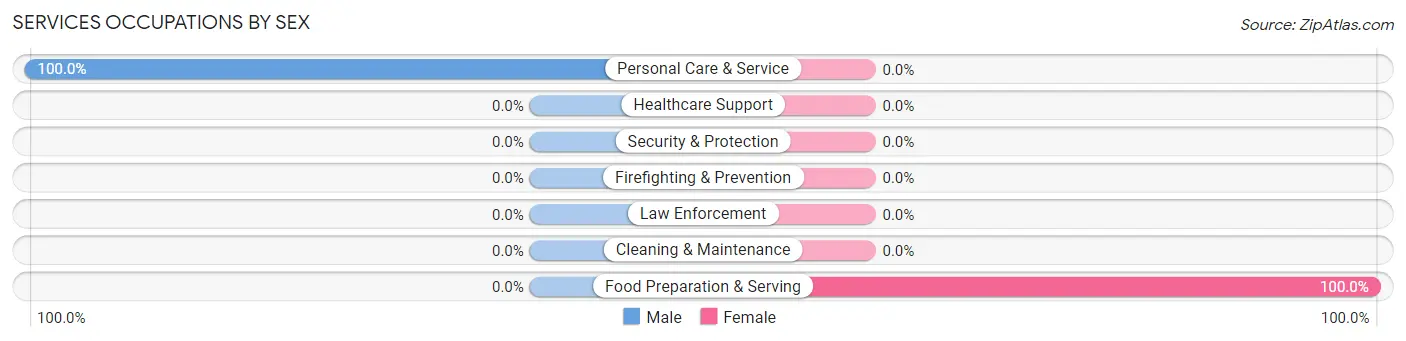
| Occupation | Male | Female |
| Healthcare Support | 0 (0.0%) | 0 (0.0%) |
| Security & Protection | 0 (0.0%) | 0 (0.0%) |
| Firefighting & Prevention | 0 (0.0%) | 0 (0.0%) |
| Law Enforcement | 0 (0.0%) | 0 (0.0%) |
| Food Preparation & Serving | 0 (0.0%) | 2 (100.0%) |
| Cleaning & Maintenance | 0 (0.0%) | 0 (0.0%) |
| Personal Care & Service | 2 (100.0%) | 0 (0.0%) |
| Total (Category) | 2 (50.0%) | 2 (50.0%) |
| Total (Overall) | 38 (40.0%) | 57 (60.0%) |
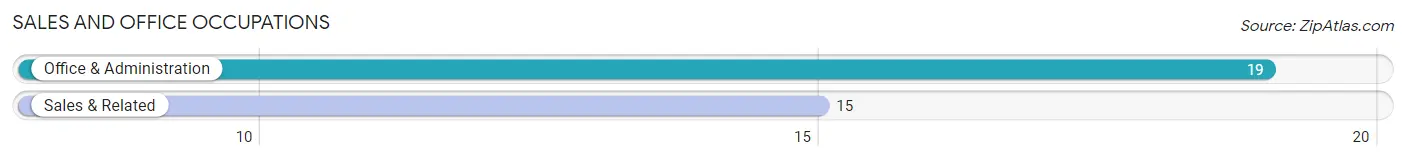
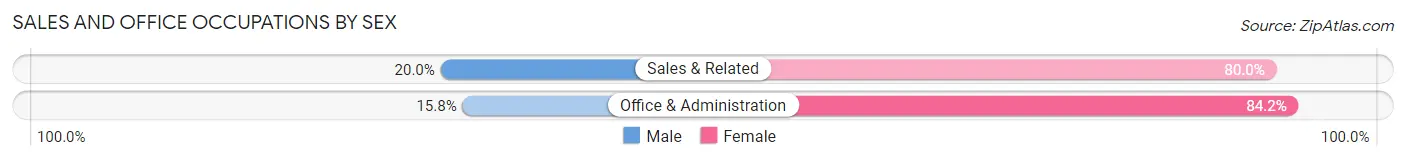
Sales and Office Occupations
The most common Sales and Office occupations in Grant are Office & Administration (19 | 20.0%), and Sales & Related (15 | 15.8%).
Sales and Office Occupations by Sex
| Occupation | Male | Female |
| Sales & Related | 3 (20.0%) | 12 (80.0%) |
| Office & Administration | 3 (15.8%) | 16 (84.2%) |
| Total (Category) | 6 (17.6%) | 28 (82.4%) |
| Total (Overall) | 38 (40.0%) | 57 (60.0%) |
Natural Resources, Construction and Maintenance Occupations
Natural Resources, Construction and Maintenance Occupations by Sex
| Occupation | Male | Female |
| Farming, Fishing & Forestry | 0 (0.0%) | 0 (0.0%) |
| Construction & Extraction | 0 (0.0%) | 0 (0.0%) |
| Installation, Maintenance & Repair | 0 (0.0%) | 0 (0.0%) |
| Total (Category) | 0 (0.0%) | 0 (0.0%) |
| Total (Overall) | 38 (40.0%) | 57 (60.0%) |
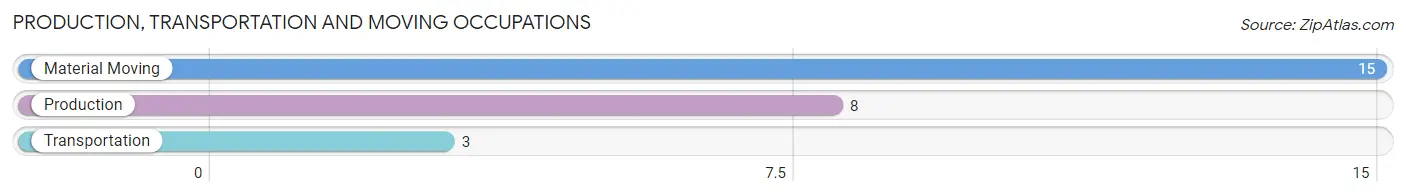
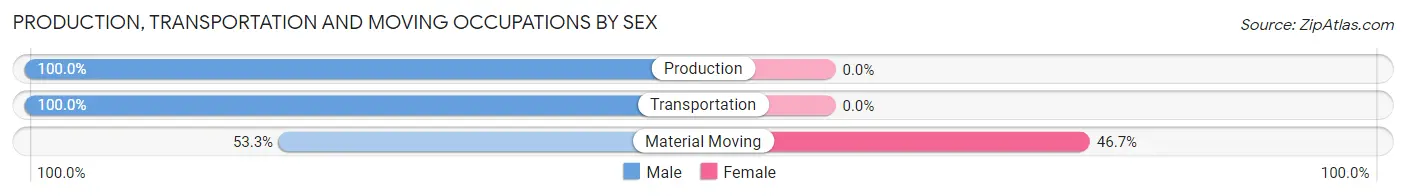
Production, Transportation and Moving Occupations
The most common Production, Transportation and Moving occupations in Grant are Material Moving (15 | 15.8%), Production (8 | 8.4%), and Transportation (3 | 3.2%).
Production, Transportation and Moving Occupations by Sex
| Occupation | Male | Female |
| Production | 8 (100.0%) | 0 (0.0%) |
| Transportation | 3 (100.0%) | 0 (0.0%) |
| Material Moving | 8 (53.3%) | 7 (46.7%) |
| Total (Category) | 19 (73.1%) | 7 (26.9%) |
| Total (Overall) | 38 (40.0%) | 57 (60.0%) |
Employment Industries by Sex in Grant
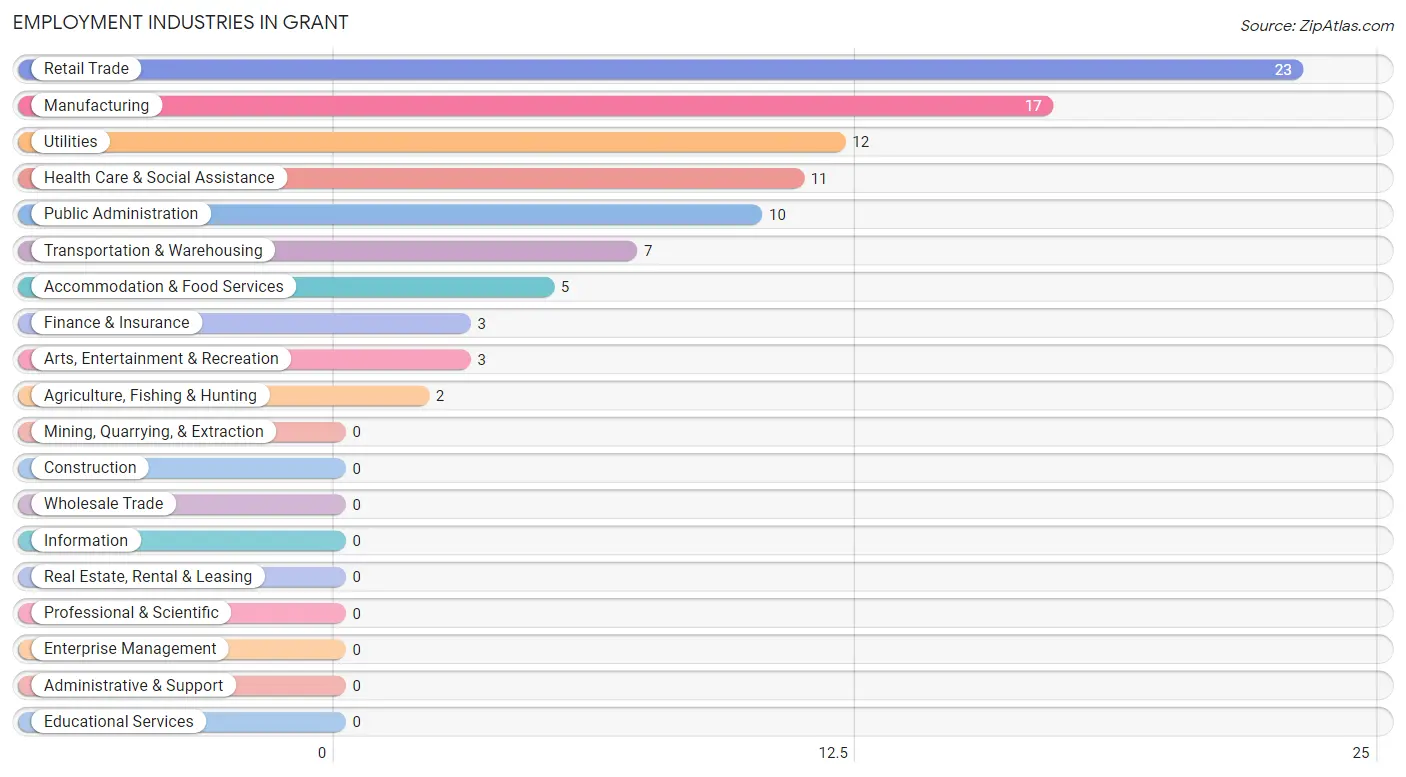
Employment Industries in Grant
The major employment industries in Grant include Retail Trade (23 | 24.2%), Manufacturing (17 | 17.9%), Utilities (12 | 12.6%), Health Care & Social Assistance (11 | 11.6%), and Public Administration (10 | 10.5%).
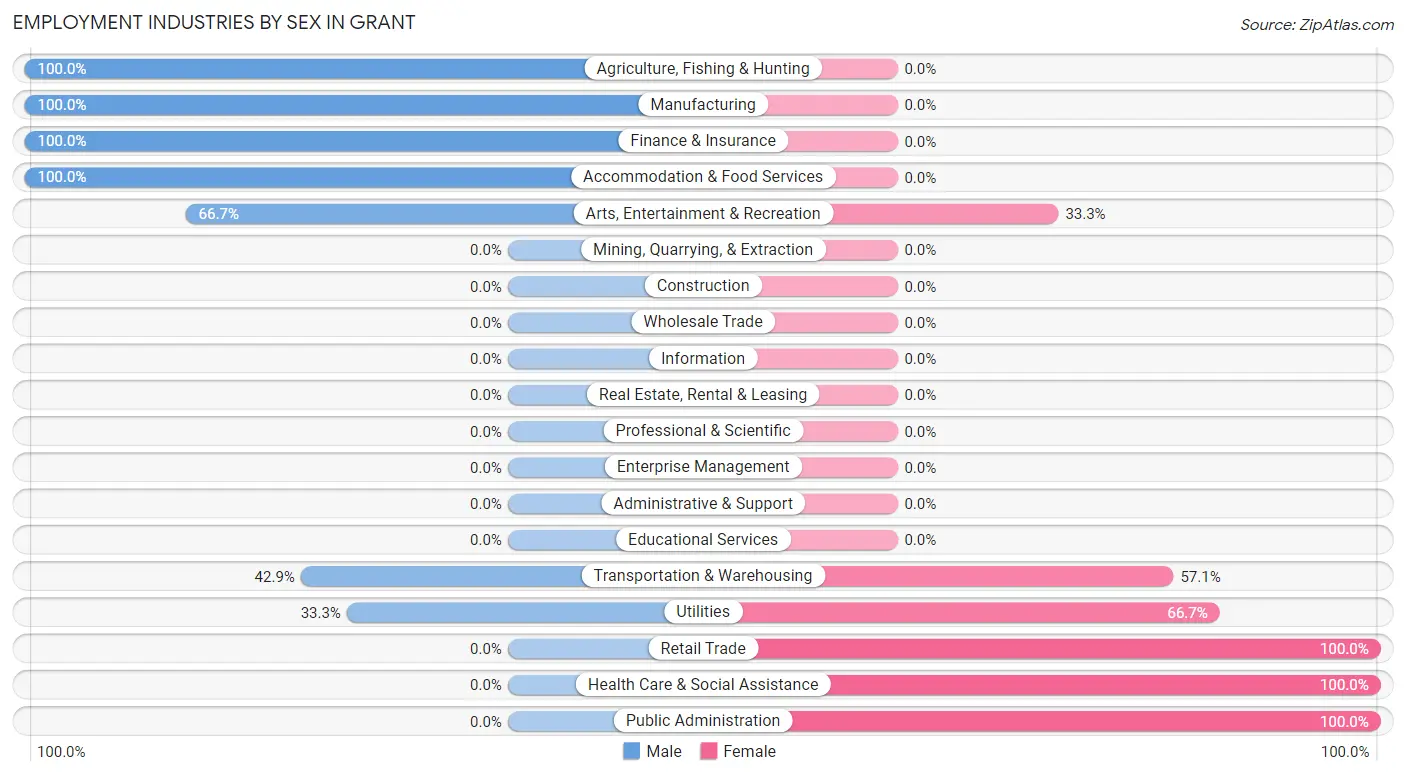
Employment Industries by Sex in Grant
The Grant industries that see more men than women are Agriculture, Fishing & Hunting (100.0%), Manufacturing (100.0%), and Finance & Insurance (100.0%), whereas the industries that tend to have a higher number of women are Retail Trade (100.0%), Health Care & Social Assistance (100.0%), and Public Administration (100.0%).
| Industry | Male | Female |
| Agriculture, Fishing & Hunting | 2 (100.0%) | 0 (0.0%) |
| Mining, Quarrying, & Extraction | 0 (0.0%) | 0 (0.0%) |
| Construction | 0 (0.0%) | 0 (0.0%) |
| Manufacturing | 17 (100.0%) | 0 (0.0%) |
| Wholesale Trade | 0 (0.0%) | 0 (0.0%) |
| Retail Trade | 0 (0.0%) | 23 (100.0%) |
| Transportation & Warehousing | 3 (42.9%) | 4 (57.1%) |
| Utilities | 4 (33.3%) | 8 (66.7%) |
| Information | 0 (0.0%) | 0 (0.0%) |
| Finance & Insurance | 3 (100.0%) | 0 (0.0%) |
| Real Estate, Rental & Leasing | 0 (0.0%) | 0 (0.0%) |
| Professional & Scientific | 0 (0.0%) | 0 (0.0%) |
| Enterprise Management | 0 (0.0%) | 0 (0.0%) |
| Administrative & Support | 0 (0.0%) | 0 (0.0%) |
| Educational Services | 0 (0.0%) | 0 (0.0%) |
| Health Care & Social Assistance | 0 (0.0%) | 11 (100.0%) |
| Arts, Entertainment & Recreation | 2 (66.7%) | 1 (33.3%) |
| Accommodation & Food Services | 5 (100.0%) | 0 (0.0%) |
| Public Administration | 0 (0.0%) | 10 (100.0%) |
| Total | 38 (40.0%) | 57 (60.0%) |
Education in Grant
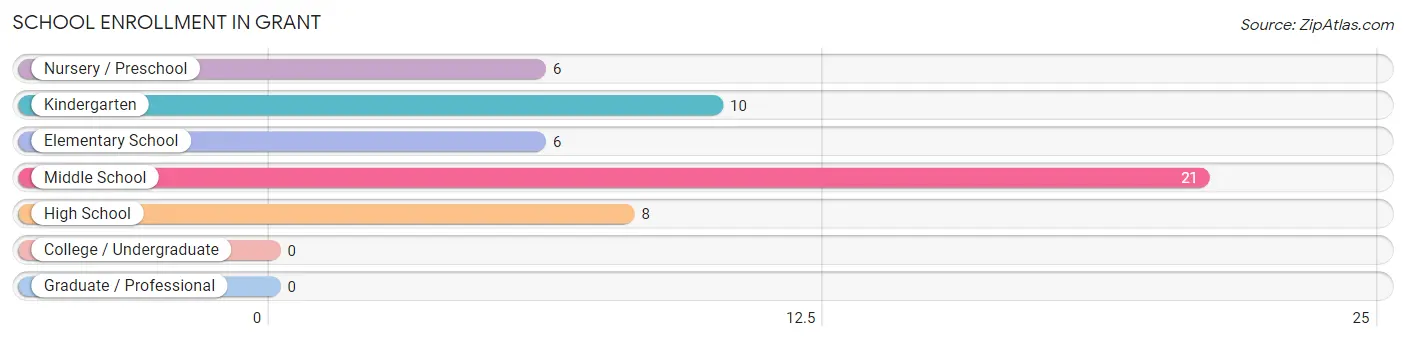
School Enrollment in Grant
The most common levels of schooling among the 51 students in Grant are middle school (21 | 41.2%), kindergarten (10 | 19.6%), and high school (8 | 15.7%).
| School Level | # Students | % Students |
| Nursery / Preschool | 6 | 11.8% |
| Kindergarten | 10 | 19.6% |
| Elementary School | 6 | 11.8% |
| Middle School | 21 | 41.2% |
| High School | 8 | 15.7% |
| College / Undergraduate | 0 | 0.0% |
| Graduate / Professional | 0 | 0.0% |
| Total | 51 | 100.0% |
School Enrollment by Age by Funding Source in Grant
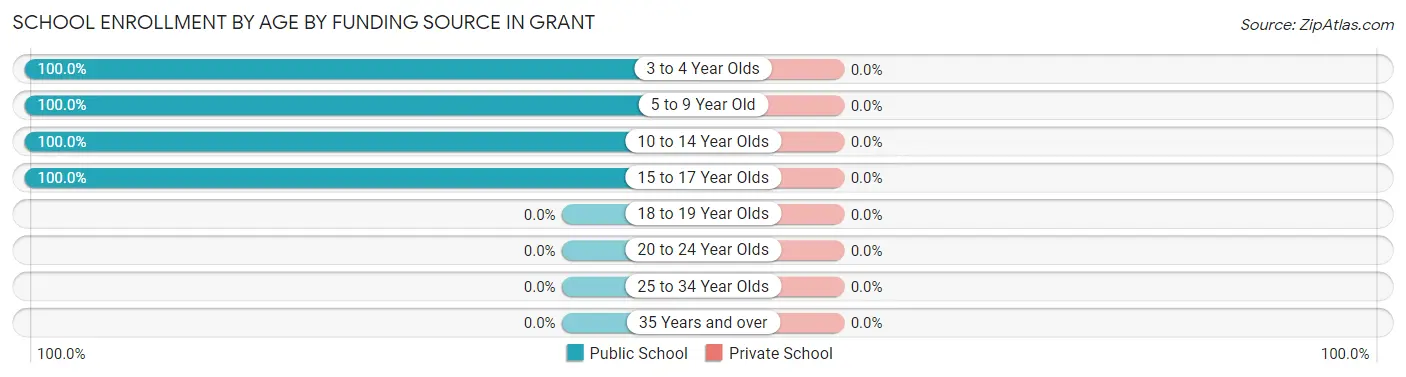
| Age Bracket | Public School | Private School |
| 3 to 4 Year Olds | 6 (100.0%) | 0 (0.0%) |
| 5 to 9 Year Old | 16 (100.0%) | 0 (0.0%) |
| 10 to 14 Year Olds | 21 (100.0%) | 0 (0.0%) |
| 15 to 17 Year Olds | 8 (100.0%) | 0 (0.0%) |
| 18 to 19 Year Olds | 0 (0.0%) | 0 (0.0%) |
| 20 to 24 Year Olds | 0 (0.0%) | 0 (0.0%) |
| 25 to 34 Year Olds | 0 (0.0%) | 0 (0.0%) |
| 35 Years and over | 0 (0.0%) | 0 (0.0%) |
| Total | 51 (100.0%) | 0 (0.0%) |
Educational Attainment by Field of Study in Grant
Business (6 | 46.2%), bio, nature & agricultural (4 | 30.8%), and education (3 | 23.1%) are the most common fields of study among 13 individuals in Grant who have obtained a bachelor's degree or higher.
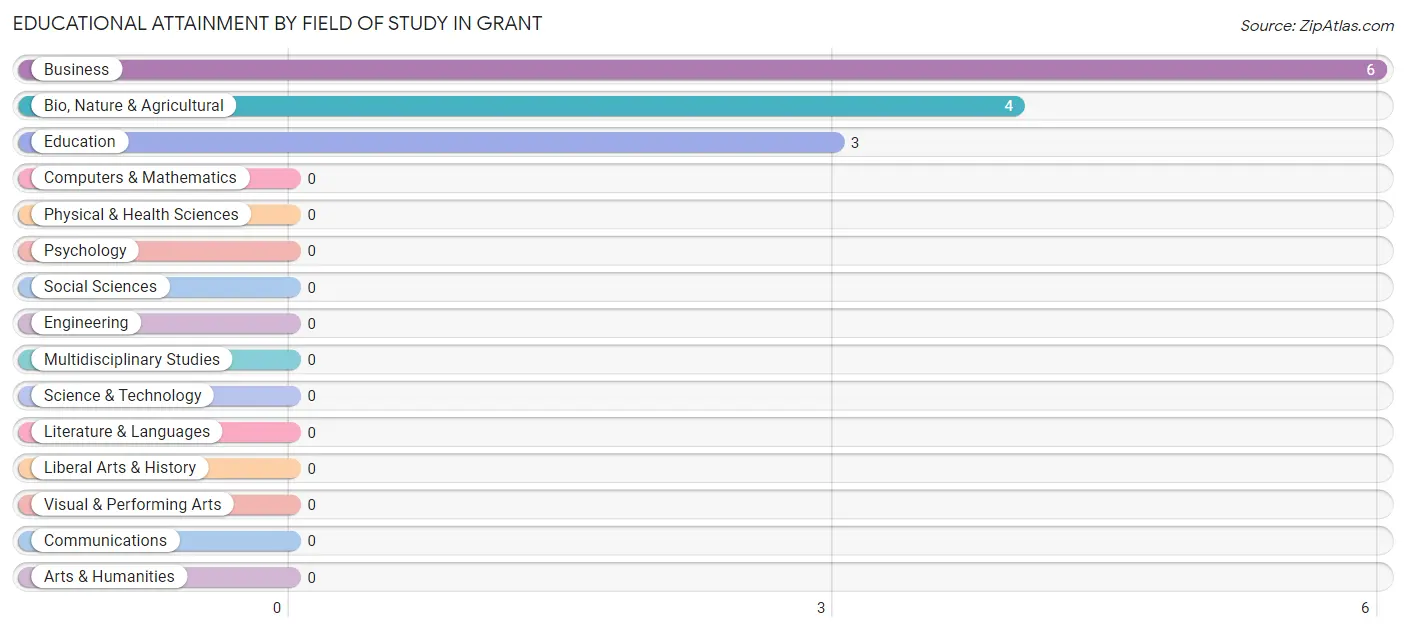
| Field of Study | # Graduates | % Graduates |
| Computers & Mathematics | 0 | 0.0% |
| Bio, Nature & Agricultural | 4 | 30.8% |
| Physical & Health Sciences | 0 | 0.0% |
| Psychology | 0 | 0.0% |
| Social Sciences | 0 | 0.0% |
| Engineering | 0 | 0.0% |
| Multidisciplinary Studies | 0 | 0.0% |
| Science & Technology | 0 | 0.0% |
| Business | 6 | 46.2% |
| Education | 3 | 23.1% |
| Literature & Languages | 0 | 0.0% |
| Liberal Arts & History | 0 | 0.0% |
| Visual & Performing Arts | 0 | 0.0% |
| Communications | 0 | 0.0% |
| Arts & Humanities | 0 | 0.0% |
| Total | 13 | 100.0% |
Transportation & Commute in Grant
Vehicle Availability by Sex in Grant
The most prevalent vehicle ownership categories in Grant are males with 2 vehicles (11, accounting for 28.9%) and females with 2 vehicles (20, making up 19.3%).
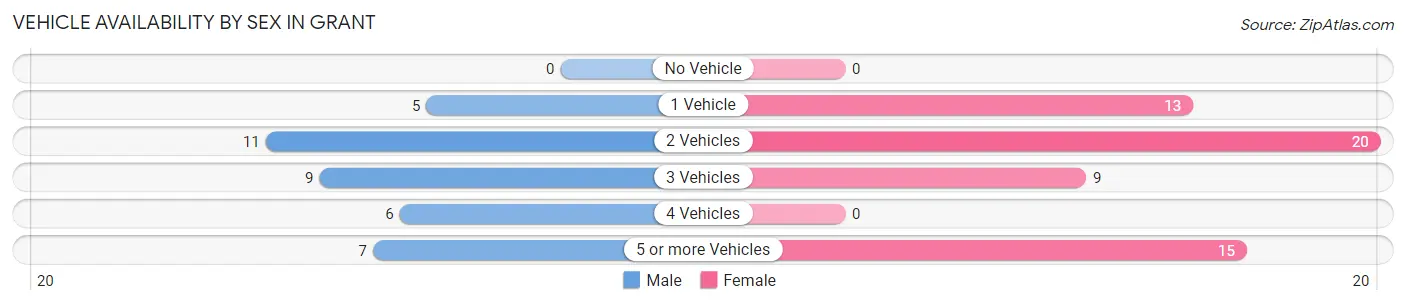
| Vehicles Available | Male | Female |
| No Vehicle | 0 (0.0%) | 0 (0.0%) |
| 1 Vehicle | 5 (13.2%) | 13 (22.8%) |
| 2 Vehicles | 11 (28.9%) | 20 (35.1%) |
| 3 Vehicles | 9 (23.7%) | 9 (15.8%) |
| 4 Vehicles | 6 (15.8%) | 0 (0.0%) |
| 5 or more Vehicles | 7 (18.4%) | 15 (26.3%) |
| Total | 38 (100.0%) | 57 (100.0%) |
Commute Time in Grant
The most frequently occuring commute durations in Grant are 10 to 14 minutes (29 commuters, 31.2%), 60 to 89 minutes (18 commuters, 19.4%), and 30 to 34 minutes (15 commuters, 16.1%).
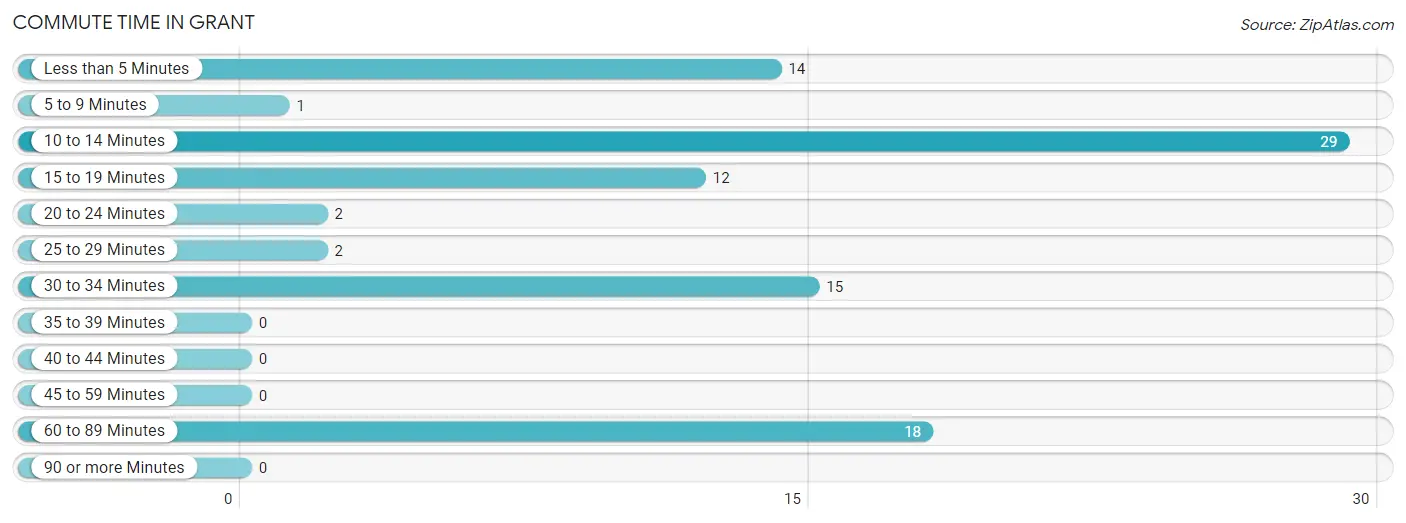
| Commute Time | # Commuters | % Commuters |
| Less than 5 Minutes | 14 | 15.0% |
| 5 to 9 Minutes | 1 | 1.1% |
| 10 to 14 Minutes | 29 | 31.2% |
| 15 to 19 Minutes | 12 | 12.9% |
| 20 to 24 Minutes | 2 | 2.1% |
| 25 to 29 Minutes | 2 | 2.1% |
| 30 to 34 Minutes | 15 | 16.1% |
| 35 to 39 Minutes | 0 | 0.0% |
| 40 to 44 Minutes | 0 | 0.0% |
| 45 to 59 Minutes | 0 | 0.0% |
| 60 to 89 Minutes | 18 | 19.4% |
| 90 or more Minutes | 0 | 0.0% |
Commute Time by Sex in Grant
The most common commute times in Grant are 15 to 19 minutes (12 commuters, 33.3%) for males and 10 to 14 minutes (20 commuters, 35.1%) for females.
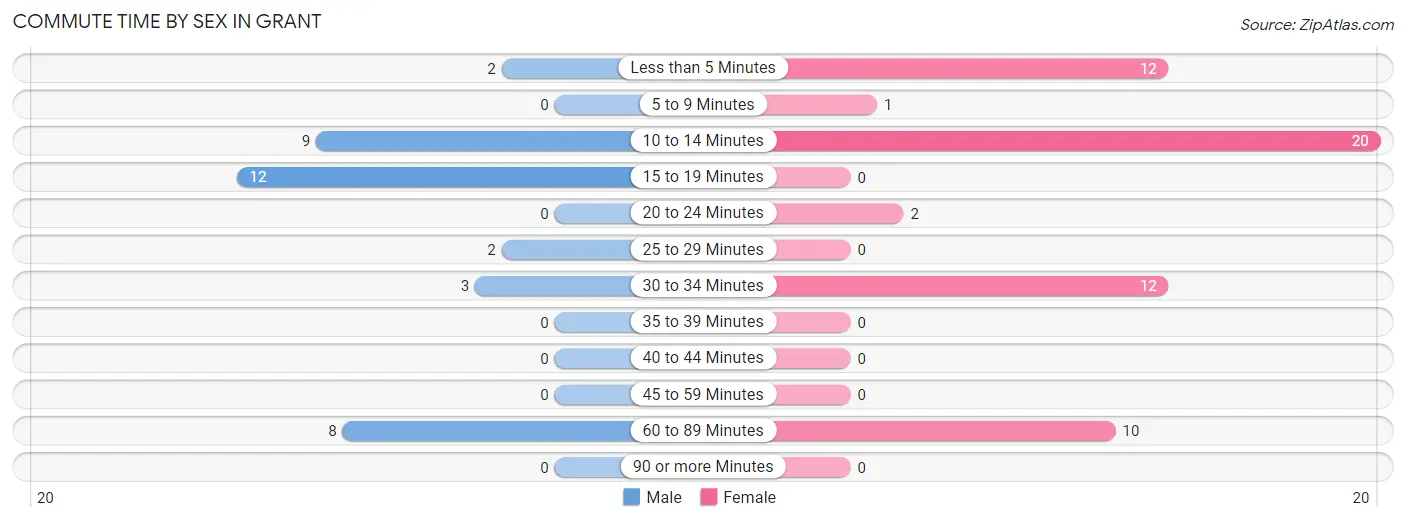
| Commute Time | Male | Female |
| Less than 5 Minutes | 2 (5.6%) | 12 (21.0%) |
| 5 to 9 Minutes | 0 (0.0%) | 1 (1.8%) |
| 10 to 14 Minutes | 9 (25.0%) | 20 (35.1%) |
| 15 to 19 Minutes | 12 (33.3%) | 0 (0.0%) |
| 20 to 24 Minutes | 0 (0.0%) | 2 (3.5%) |
| 25 to 29 Minutes | 2 (5.6%) | 0 (0.0%) |
| 30 to 34 Minutes | 3 (8.3%) | 12 (21.0%) |
| 35 to 39 Minutes | 0 (0.0%) | 0 (0.0%) |
| 40 to 44 Minutes | 0 (0.0%) | 0 (0.0%) |
| 45 to 59 Minutes | 0 (0.0%) | 0 (0.0%) |
| 60 to 89 Minutes | 8 (22.2%) | 10 (17.5%) |
| 90 or more Minutes | 0 (0.0%) | 0 (0.0%) |
Time of Departure to Work by Sex in Grant
The most frequent times of departure to work in Grant are 4:00 PM to 11:59 PM (11, 30.6%) for males and 7:30 AM to 7:59 AM (21, 36.8%) for females.
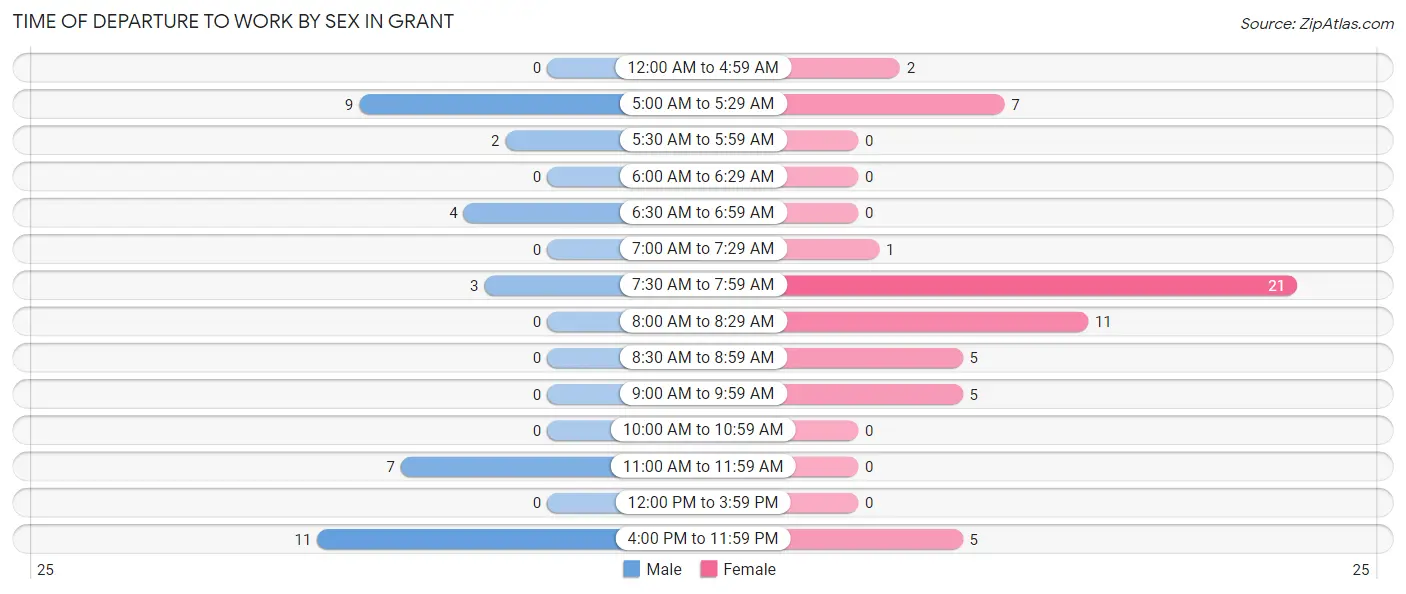
| Time of Departure | Male | Female |
| 12:00 AM to 4:59 AM | 0 (0.0%) | 2 (3.5%) |
| 5:00 AM to 5:29 AM | 9 (25.0%) | 7 (12.3%) |
| 5:30 AM to 5:59 AM | 2 (5.6%) | 0 (0.0%) |
| 6:00 AM to 6:29 AM | 0 (0.0%) | 0 (0.0%) |
| 6:30 AM to 6:59 AM | 4 (11.1%) | 0 (0.0%) |
| 7:00 AM to 7:29 AM | 0 (0.0%) | 1 (1.8%) |
| 7:30 AM to 7:59 AM | 3 (8.3%) | 21 (36.8%) |
| 8:00 AM to 8:29 AM | 0 (0.0%) | 11 (19.3%) |
| 8:30 AM to 8:59 AM | 0 (0.0%) | 5 (8.8%) |
| 9:00 AM to 9:59 AM | 0 (0.0%) | 5 (8.8%) |
| 10:00 AM to 10:59 AM | 0 (0.0%) | 0 (0.0%) |
| 11:00 AM to 11:59 AM | 7 (19.4%) | 0 (0.0%) |
| 12:00 PM to 3:59 PM | 0 (0.0%) | 0 (0.0%) |
| 4:00 PM to 11:59 PM | 11 (30.6%) | 5 (8.8%) |
| Total | 36 (100.0%) | 57 (100.0%) |
Housing Occupancy in Grant
Occupancy by Ownership in Grant
Of the total 94 dwellings in Grant, owner-occupied units account for 75 (79.8%), while renter-occupied units make up 19 (20.2%).
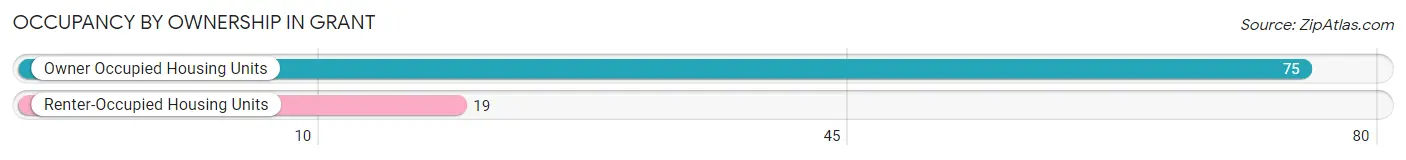
| Occupancy | # Housing Units | % Housing Units |
| Owner Occupied Housing Units | 75 | 79.8% |
| Renter-Occupied Housing Units | 19 | 20.2% |
| Total Occupied Housing Units | 94 | 100.0% |
Occupancy by Household Size in Grant
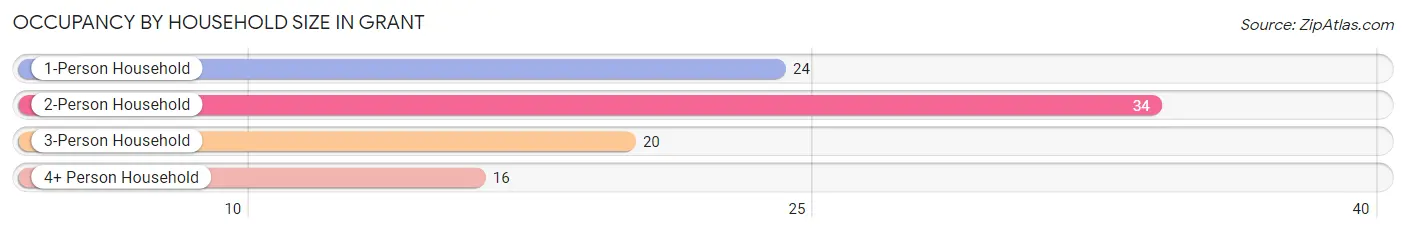
| Household Size | # Housing Units | % Housing Units |
| 1-Person Household | 24 | 25.5% |
| 2-Person Household | 34 | 36.2% |
| 3-Person Household | 20 | 21.3% |
| 4+ Person Household | 16 | 17.0% |
| Total Housing Units | 94 | 100.0% |
Occupancy by Ownership by Household Size in Grant
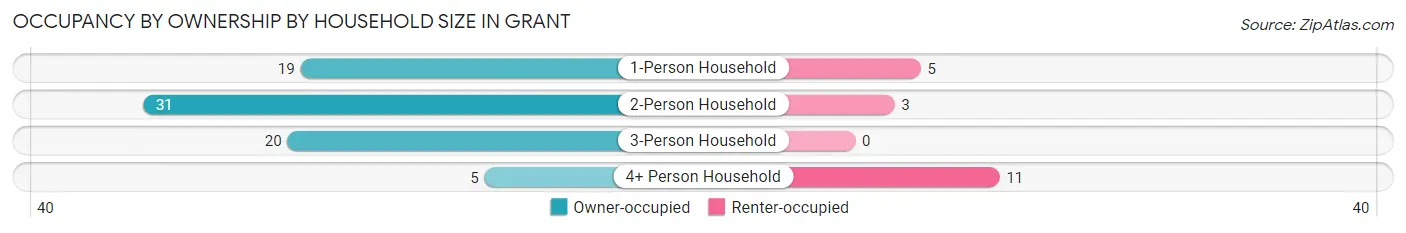
| Household Size | Owner-occupied | Renter-occupied |
| 1-Person Household | 19 (79.2%) | 5 (20.8%) |
| 2-Person Household | 31 (91.2%) | 3 (8.8%) |
| 3-Person Household | 20 (100.0%) | 0 (0.0%) |
| 4+ Person Household | 5 (31.2%) | 11 (68.8%) |
| Total Housing Units | 75 (79.8%) | 19 (20.2%) |
Occupancy by Educational Attainment in Grant
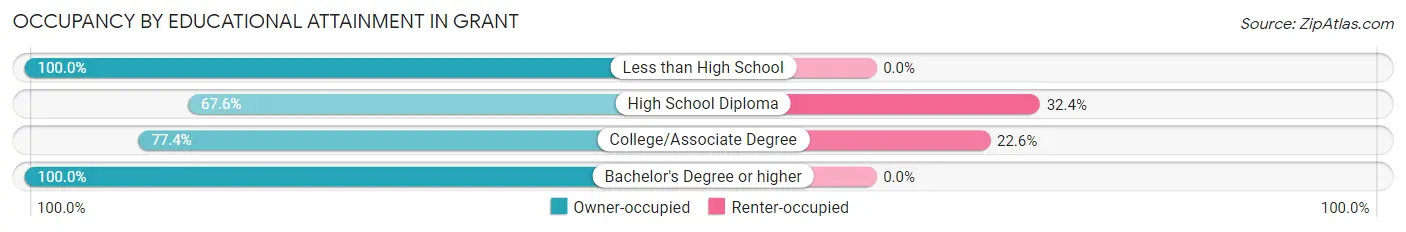
| Household Size | Owner-occupied | Renter-occupied |
| Less than High School | 12 (100.0%) | 0 (0.0%) |
| High School Diploma | 25 (67.6%) | 12 (32.4%) |
| College/Associate Degree | 24 (77.4%) | 7 (22.6%) |
| Bachelor's Degree or higher | 14 (100.0%) | 0 (0.0%) |
Occupancy by Age of Householder in Grant
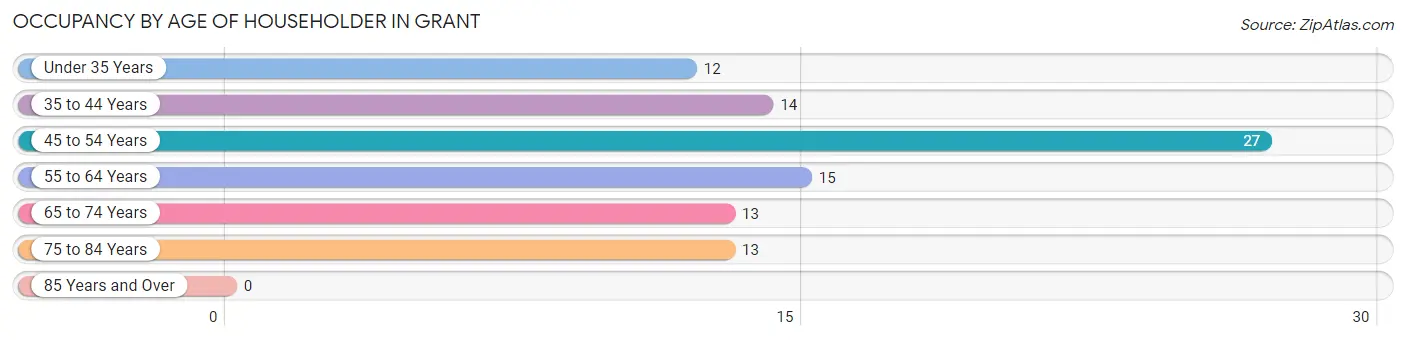
| Age Bracket | # Households | % Households |
| Under 35 Years | 12 | 12.8% |
| 35 to 44 Years | 14 | 14.9% |
| 45 to 54 Years | 27 | 28.7% |
| 55 to 64 Years | 15 | 16.0% |
| 65 to 74 Years | 13 | 13.8% |
| 75 to 84 Years | 13 | 13.8% |
| 85 Years and Over | 0 | 0.0% |
| Total | 94 | 100.0% |
Housing Finances in Grant
Median Income by Occupancy in Grant
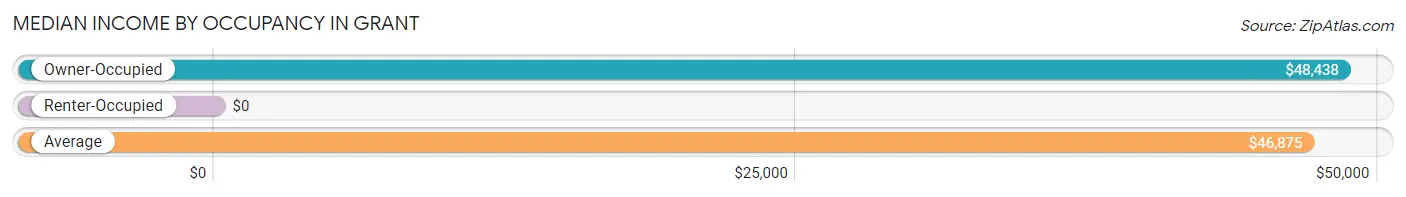
| Occupancy Type | # Households | Median Income |
| Owner-Occupied | 75 (79.8%) | $48,438 |
| Renter-Occupied | 19 (20.2%) | $0 |
| Average | 94 (100.0%) | $46,875 |
Occupancy by Householder Income Bracket in Grant
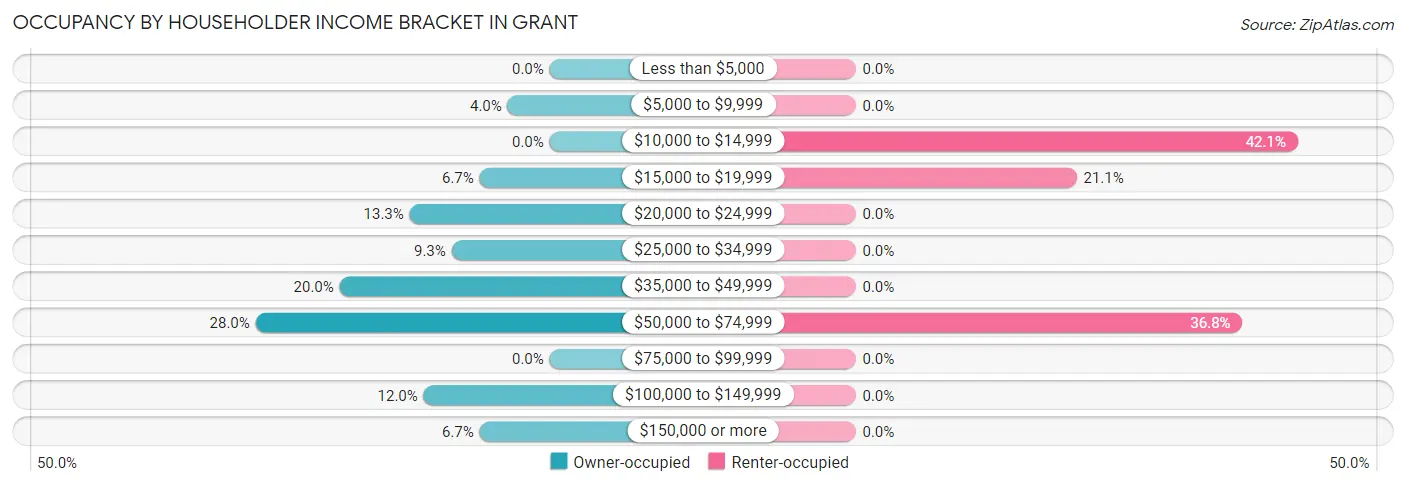
| Income Bracket | Owner-occupied | Renter-occupied |
| Less than $5,000 | 0 (0.0%) | 0 (0.0%) |
| $5,000 to $9,999 | 3 (4.0%) | 0 (0.0%) |
| $10,000 to $14,999 | 0 (0.0%) | 8 (42.1%) |
| $15,000 to $19,999 | 5 (6.7%) | 4 (21.0%) |
| $20,000 to $24,999 | 10 (13.3%) | 0 (0.0%) |
| $25,000 to $34,999 | 7 (9.3%) | 0 (0.0%) |
| $35,000 to $49,999 | 15 (20.0%) | 0 (0.0%) |
| $50,000 to $74,999 | 21 (28.0%) | 7 (36.8%) |
| $75,000 to $99,999 | 0 (0.0%) | 0 (0.0%) |
| $100,000 to $149,999 | 9 (12.0%) | 0 (0.0%) |
| $150,000 or more | 5 (6.7%) | 0 (0.0%) |
| Total | 75 (100.0%) | 19 (100.0%) |
Monthly Housing Cost Tiers in Grant
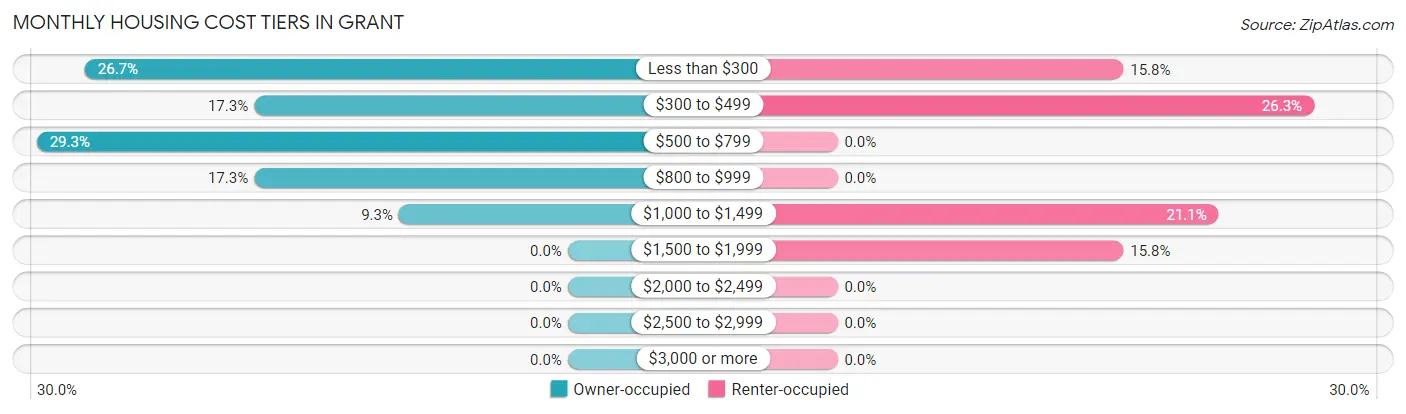
| Monthly Cost | Owner-occupied | Renter-occupied |
| Less than $300 | 20 (26.7%) | 3 (15.8%) |
| $300 to $499 | 13 (17.3%) | 5 (26.3%) |
| $500 to $799 | 22 (29.3%) | 0 (0.0%) |
| $800 to $999 | 13 (17.3%) | 0 (0.0%) |
| $1,000 to $1,499 | 7 (9.3%) | 4 (21.0%) |
| $1,500 to $1,999 | 0 (0.0%) | 3 (15.8%) |
| $2,000 to $2,499 | 0 (0.0%) | 0 (0.0%) |
| $2,500 to $2,999 | 0 (0.0%) | 0 (0.0%) |
| $3,000 or more | 0 (0.0%) | 0 (0.0%) |
| Total | 75 (100.0%) | 19 (100.0%) |
Physical Housing Characteristics in Grant
Housing Structures in Grant
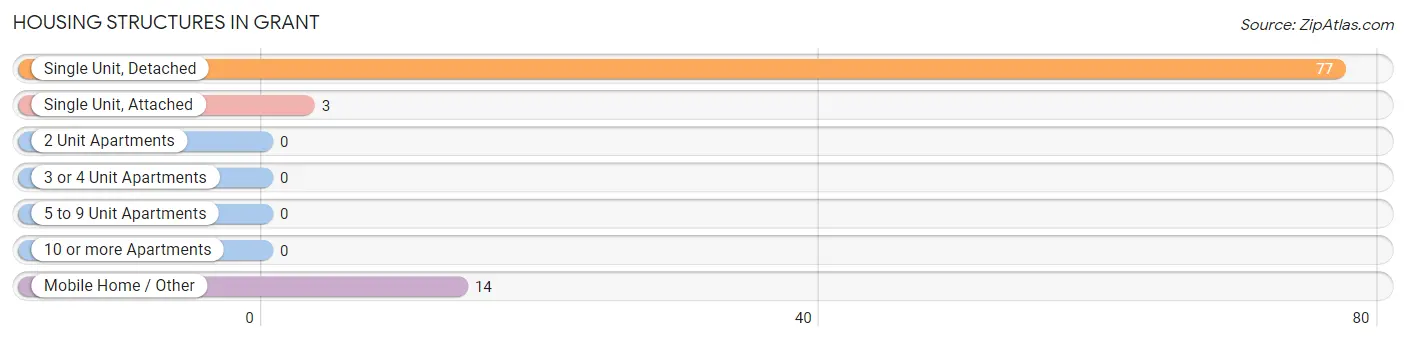
| Structure Type | # Housing Units | % Housing Units |
| Single Unit, Detached | 77 | 81.9% |
| Single Unit, Attached | 3 | 3.2% |
| 2 Unit Apartments | 0 | 0.0% |
| 3 or 4 Unit Apartments | 0 | 0.0% |
| 5 to 9 Unit Apartments | 0 | 0.0% |
| 10 or more Apartments | 0 | 0.0% |
| Mobile Home / Other | 14 | 14.9% |
| Total | 94 | 100.0% |
Housing Structures by Occupancy in Grant
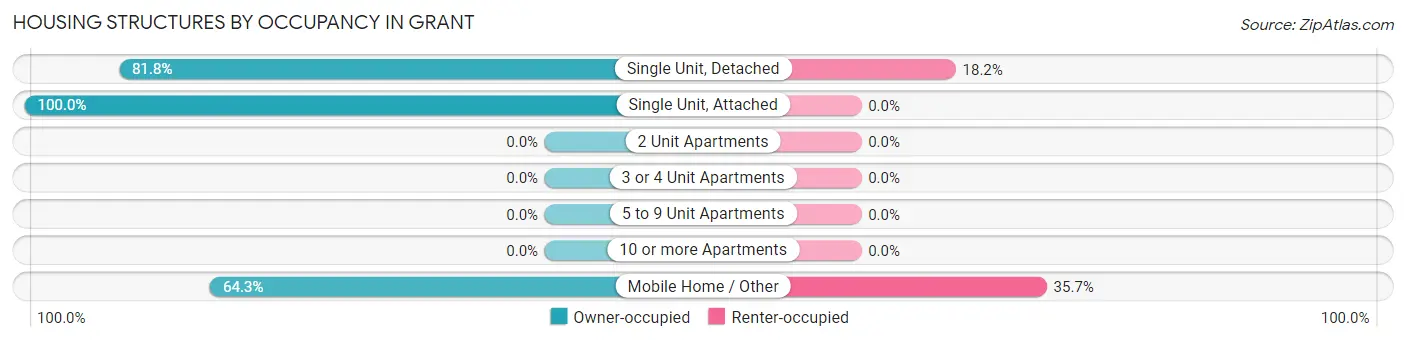
| Structure Type | Owner-occupied | Renter-occupied |
| Single Unit, Detached | 63 (81.8%) | 14 (18.2%) |
| Single Unit, Attached | 3 (100.0%) | 0 (0.0%) |
| 2 Unit Apartments | 0 (0.0%) | 0 (0.0%) |
| 3 or 4 Unit Apartments | 0 (0.0%) | 0 (0.0%) |
| 5 to 9 Unit Apartments | 0 (0.0%) | 0 (0.0%) |
| 10 or more Apartments | 0 (0.0%) | 0 (0.0%) |
| Mobile Home / Other | 9 (64.3%) | 5 (35.7%) |
| Total | 75 (79.8%) | 19 (20.2%) |
Housing Structures by Number of Rooms in Grant
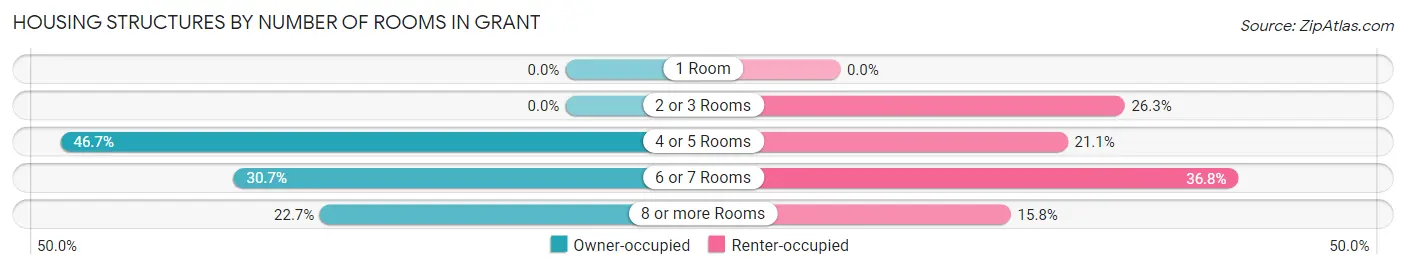
| Number of Rooms | Owner-occupied | Renter-occupied |
| 1 Room | 0 (0.0%) | 0 (0.0%) |
| 2 or 3 Rooms | 0 (0.0%) | 5 (26.3%) |
| 4 or 5 Rooms | 35 (46.7%) | 4 (21.0%) |
| 6 or 7 Rooms | 23 (30.7%) | 7 (36.8%) |
| 8 or more Rooms | 17 (22.7%) | 3 (15.8%) |
| Total | 75 (100.0%) | 19 (100.0%) |
Housing Structure by Heating Type in Grant
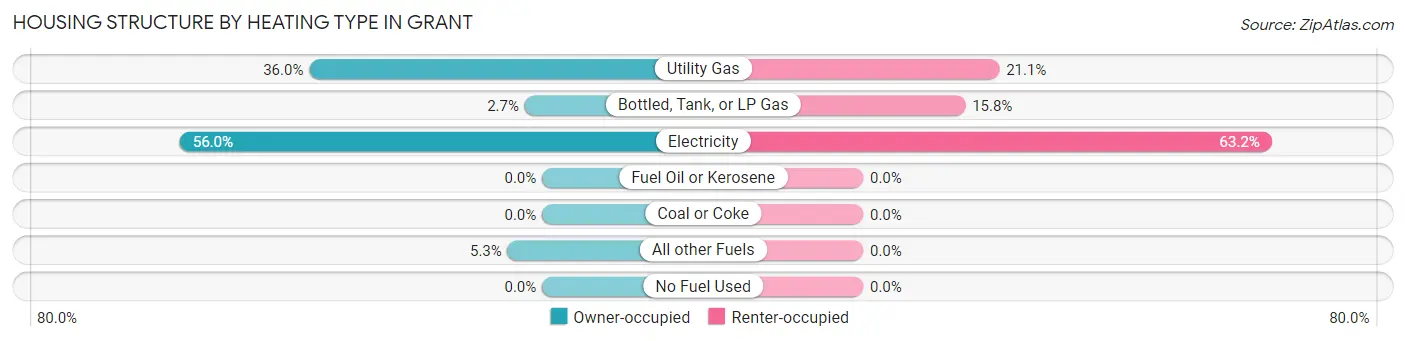
| Heating Type | Owner-occupied | Renter-occupied |
| Utility Gas | 27 (36.0%) | 4 (21.0%) |
| Bottled, Tank, or LP Gas | 2 (2.7%) | 3 (15.8%) |
| Electricity | 42 (56.0%) | 12 (63.2%) |
| Fuel Oil or Kerosene | 0 (0.0%) | 0 (0.0%) |
| Coal or Coke | 0 (0.0%) | 0 (0.0%) |
| All other Fuels | 4 (5.3%) | 0 (0.0%) |
| No Fuel Used | 0 (0.0%) | 0 (0.0%) |
| Total | 75 (100.0%) | 19 (100.0%) |
Household Vehicle Usage in Grant
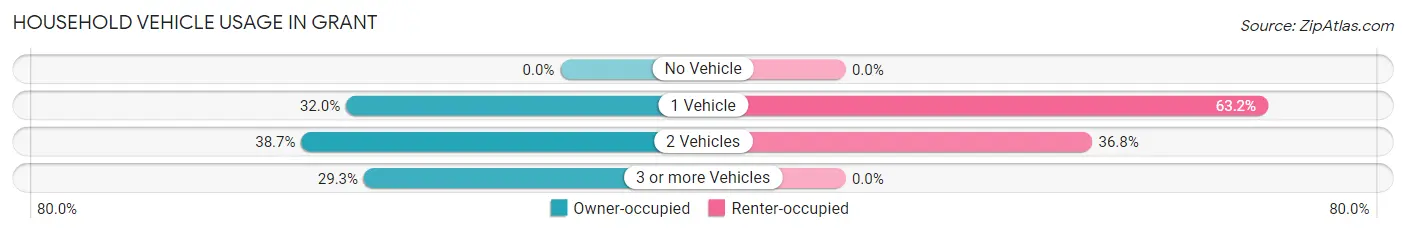
| Vehicles per Household | Owner-occupied | Renter-occupied |
| No Vehicle | 0 (0.0%) | 0 (0.0%) |
| 1 Vehicle | 24 (32.0%) | 12 (63.2%) |
| 2 Vehicles | 29 (38.7%) | 7 (36.8%) |
| 3 or more Vehicles | 22 (29.3%) | 0 (0.0%) |
| Total | 75 (100.0%) | 19 (100.0%) |
Real Estate & Mortgages in Grant
Real Estate and Mortgage Overview in Grant
| Characteristic | Without Mortgage | With Mortgage |
| Housing Units | 37 | 38 |
| Median Property Value | $64,200 | $87,800 |
| Median Household Income | $30,625 | $2 |
| Monthly Housing Costs | $285 | $0 |
| Real Estate Taxes | $199 | $6 |
Property Value by Mortgage Status in Grant
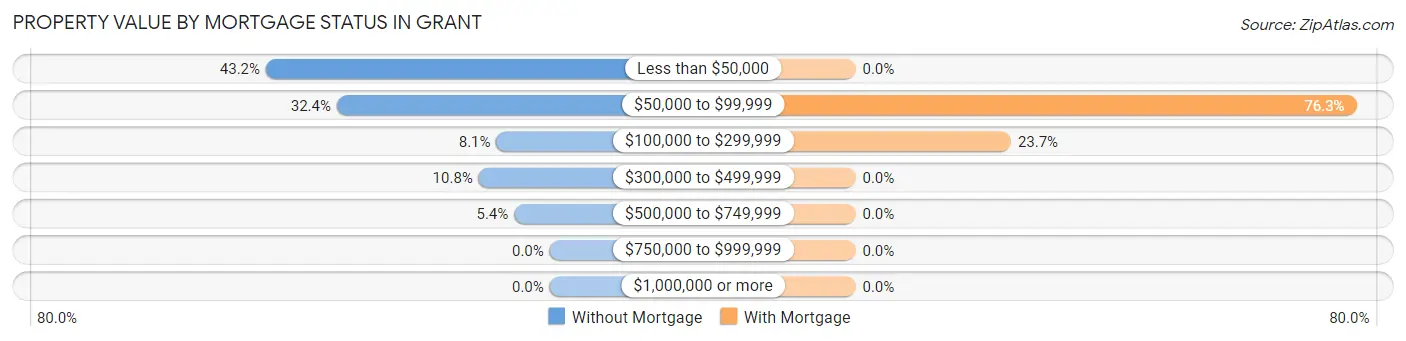
| Property Value | Without Mortgage | With Mortgage |
| Less than $50,000 | 16 (43.2%) | 0 (0.0%) |
| $50,000 to $99,999 | 12 (32.4%) | 29 (76.3%) |
| $100,000 to $299,999 | 3 (8.1%) | 9 (23.7%) |
| $300,000 to $499,999 | 4 (10.8%) | 0 (0.0%) |
| $500,000 to $749,999 | 2 (5.4%) | 0 (0.0%) |
| $750,000 to $999,999 | 0 (0.0%) | 0 (0.0%) |
| $1,000,000 or more | 0 (0.0%) | 0 (0.0%) |
| Total | 37 (100.0%) | 38 (100.0%) |
Household Income by Mortgage Status in Grant
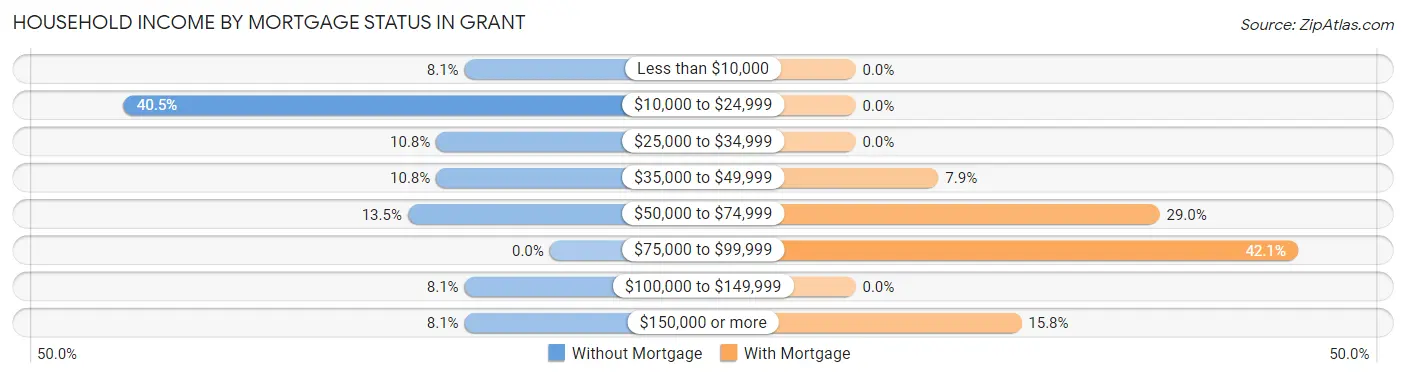
| Household Income | Without Mortgage | With Mortgage |
| Less than $10,000 | 3 (8.1%) | 0 (0.0%) |
| $10,000 to $24,999 | 15 (40.5%) | 0 (0.0%) |
| $25,000 to $34,999 | 4 (10.8%) | 0 (0.0%) |
| $35,000 to $49,999 | 4 (10.8%) | 3 (7.9%) |
| $50,000 to $74,999 | 5 (13.5%) | 11 (28.9%) |
| $75,000 to $99,999 | 0 (0.0%) | 16 (42.1%) |
| $100,000 to $149,999 | 3 (8.1%) | 0 (0.0%) |
| $150,000 or more | 3 (8.1%) | 6 (15.8%) |
| Total | 37 (100.0%) | 38 (100.0%) |
Property Value to Household Income Ratio in Grant
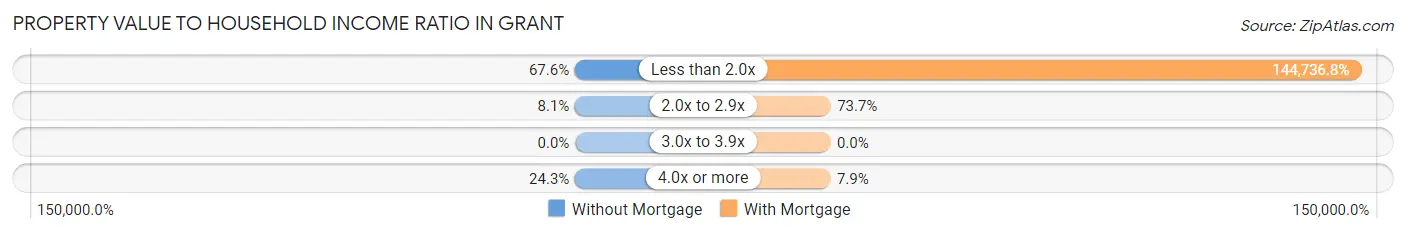
| Value-to-Income Ratio | Without Mortgage | With Mortgage |
| Less than 2.0x | 25 (67.6%) | 55,000 (144,736.8%) |
| 2.0x to 2.9x | 3 (8.1%) | 28 (73.7%) |
| 3.0x to 3.9x | 0 (0.0%) | 0 (0.0%) |
| 4.0x or more | 9 (24.3%) | 3 (7.9%) |
| Total | 37 (100.0%) | 38 (100.0%) |
Real Estate Taxes by Mortgage Status in Grant
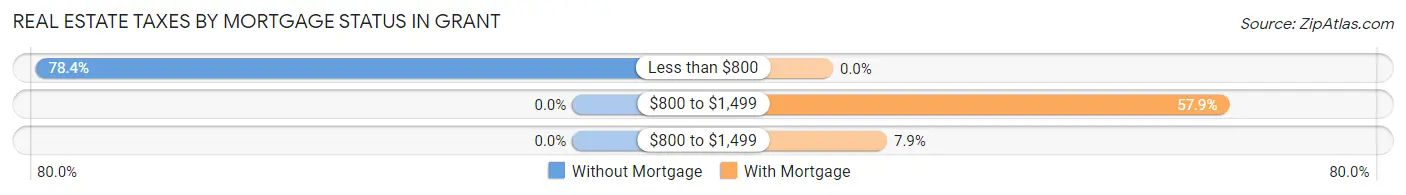
| Property Taxes | Without Mortgage | With Mortgage |
| Less than $800 | 29 (78.4%) | 0 (0.0%) |
| $800 to $1,499 | 0 (0.0%) | 22 (57.9%) |
| $800 to $1,499 | 0 (0.0%) | 3 (7.9%) |
| Total | 37 (100.0%) | 38 (100.0%) |
Health & Disability in Grant
Health Insurance Coverage by Age in Grant
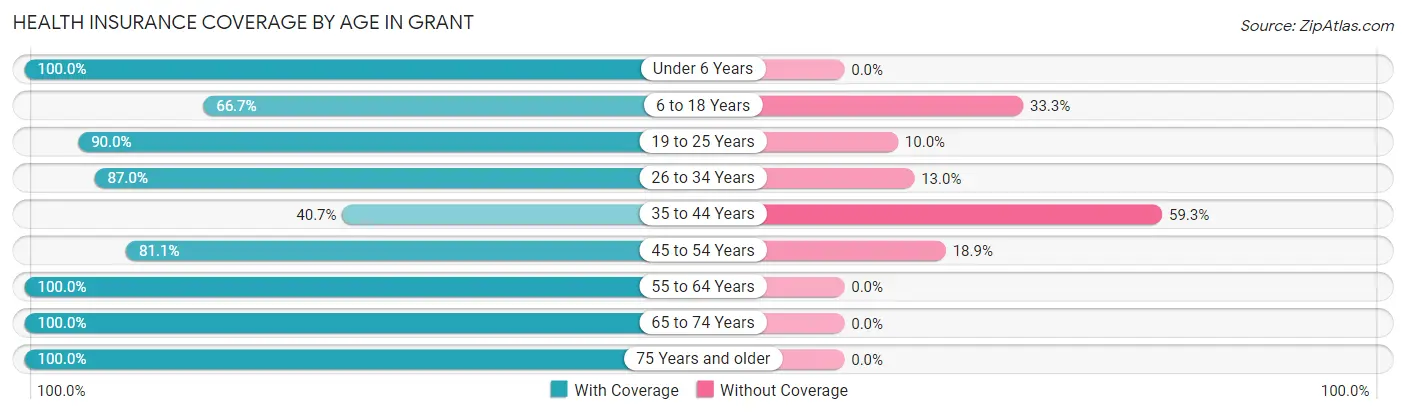
| Age Bracket | With Coverage | Without Coverage |
| Under 6 Years | 18 (100.0%) | 0 (0.0%) |
| 6 to 18 Years | 30 (66.7%) | 15 (33.3%) |
| 19 to 25 Years | 18 (90.0%) | 2 (10.0%) |
| 26 to 34 Years | 20 (87.0%) | 3 (13.0%) |
| 35 to 44 Years | 11 (40.7%) | 16 (59.3%) |
| 45 to 54 Years | 30 (81.1%) | 7 (18.9%) |
| 55 to 64 Years | 28 (100.0%) | 0 (0.0%) |
| 65 to 74 Years | 27 (100.0%) | 0 (0.0%) |
| 75 Years and older | 22 (100.0%) | 0 (0.0%) |
| Total | 204 (82.6%) | 43 (17.4%) |
Health Insurance Coverage by Citizenship Status in Grant
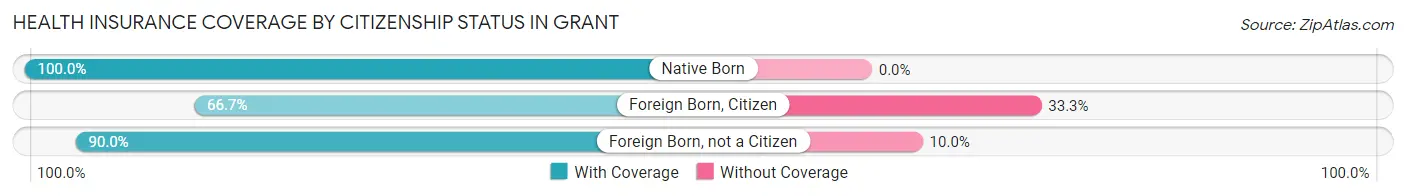
| Citizenship Status | With Coverage | Without Coverage |
| Native Born | 18 (100.0%) | 0 (0.0%) |
| Foreign Born, Citizen | 30 (66.7%) | 15 (33.3%) |
| Foreign Born, not a Citizen | 18 (90.0%) | 2 (10.0%) |
Health Insurance Coverage by Household Income in Grant
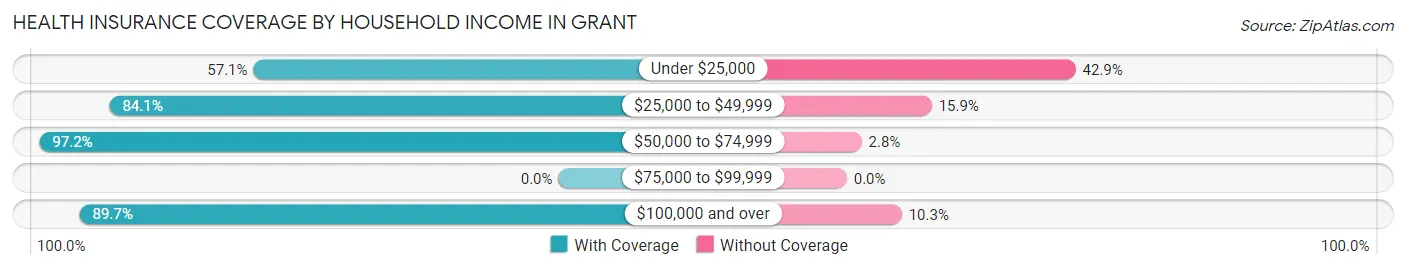
| Household Income | With Coverage | Without Coverage |
| Under $25,000 | 36 (57.1%) | 27 (42.9%) |
| $25,000 to $49,999 | 37 (84.1%) | 7 (15.9%) |
| $50,000 to $74,999 | 70 (97.2%) | 2 (2.8%) |
| $75,000 to $99,999 | 0 (0.0%) | 0 (0.0%) |
| $100,000 and over | 61 (89.7%) | 7 (10.3%) |
Public vs Private Health Insurance Coverage by Age in Grant
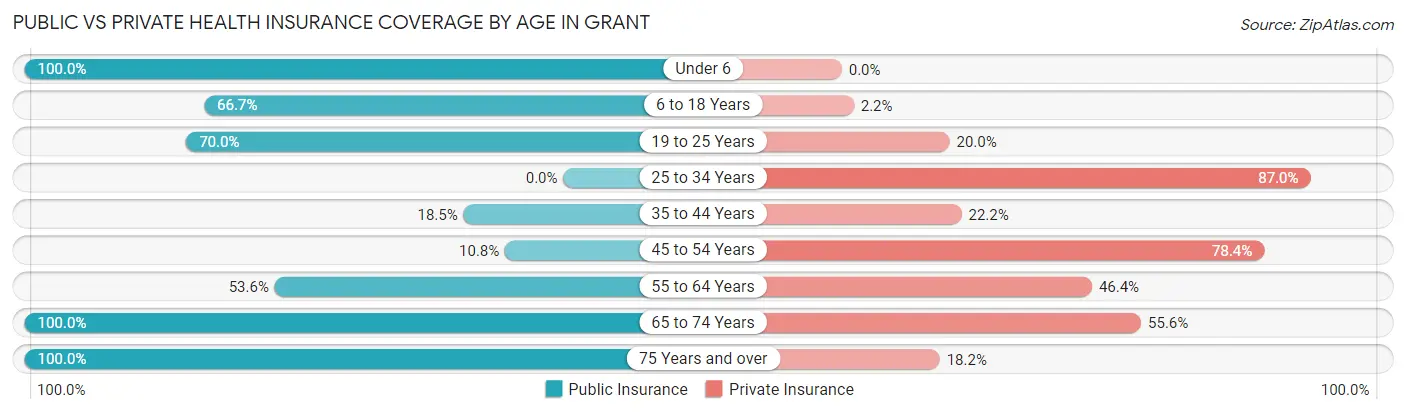
| Age Bracket | Public Insurance | Private Insurance |
| Under 6 | 18 (100.0%) | 0 (0.0%) |
| 6 to 18 Years | 30 (66.7%) | 1 (2.2%) |
| 19 to 25 Years | 14 (70.0%) | 4 (20.0%) |
| 25 to 34 Years | 0 (0.0%) | 20 (87.0%) |
| 35 to 44 Years | 5 (18.5%) | 6 (22.2%) |
| 45 to 54 Years | 4 (10.8%) | 29 (78.4%) |
| 55 to 64 Years | 15 (53.6%) | 13 (46.4%) |
| 65 to 74 Years | 27 (100.0%) | 15 (55.6%) |
| 75 Years and over | 22 (100.0%) | 4 (18.2%) |
| Total | 135 (54.7%) | 92 (37.2%) |
Disability Status by Sex by Age in Grant
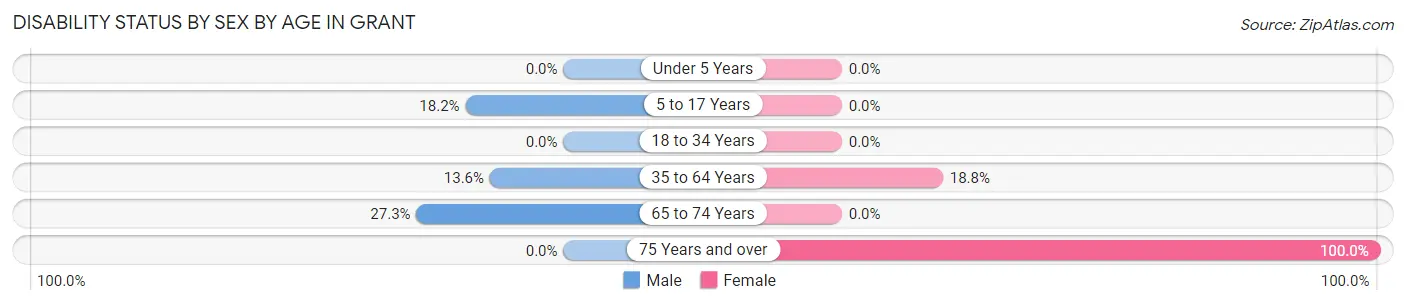
| Age Bracket | Male | Female |
| Under 5 Years | 0 (0.0%) | 0 (0.0%) |
| 5 to 17 Years | 4 (18.2%) | 0 (0.0%) |
| 18 to 34 Years | 0 (0.0%) | 0 (0.0%) |
| 35 to 64 Years | 6 (13.6%) | 9 (18.8%) |
| 65 to 74 Years | 3 (27.3%) | 0 (0.0%) |
| 75 Years and over | 0 (0.0%) | 11 (100.0%) |
Disability Class by Sex by Age in Grant
Disability Class: Hearing Difficulty
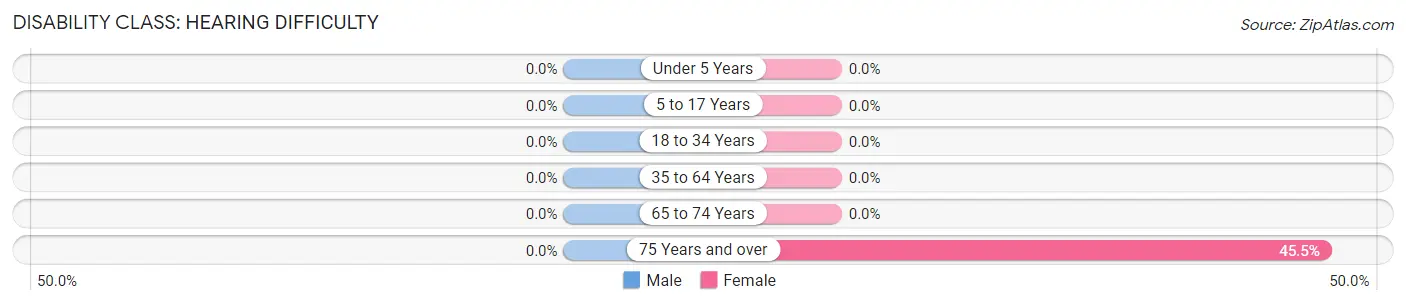
| Age Bracket | Male | Female |
| Under 5 Years | 0 (0.0%) | 0 (0.0%) |
| 5 to 17 Years | 0 (0.0%) | 0 (0.0%) |
| 18 to 34 Years | 0 (0.0%) | 0 (0.0%) |
| 35 to 64 Years | 0 (0.0%) | 0 (0.0%) |
| 65 to 74 Years | 0 (0.0%) | 0 (0.0%) |
| 75 Years and over | 0 (0.0%) | 5 (45.5%) |
Disability Class: Vision Difficulty
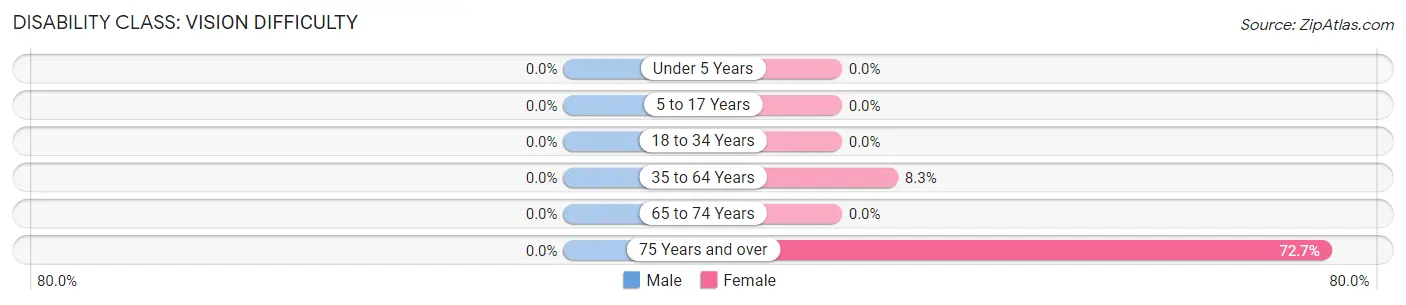
| Age Bracket | Male | Female |
| Under 5 Years | 0 (0.0%) | 0 (0.0%) |
| 5 to 17 Years | 0 (0.0%) | 0 (0.0%) |
| 18 to 34 Years | 0 (0.0%) | 0 (0.0%) |
| 35 to 64 Years | 0 (0.0%) | 4 (8.3%) |
| 65 to 74 Years | 0 (0.0%) | 0 (0.0%) |
| 75 Years and over | 0 (0.0%) | 8 (72.7%) |
Disability Class: Cognitive Difficulty
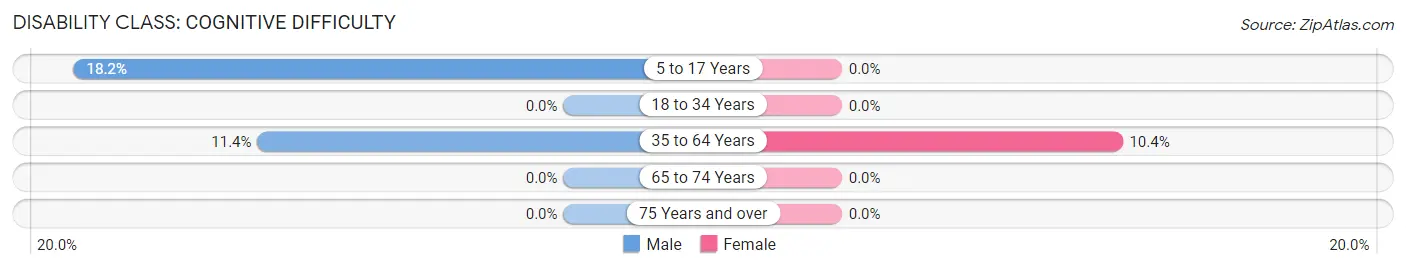
| Age Bracket | Male | Female |
| 5 to 17 Years | 4 (18.2%) | 0 (0.0%) |
| 18 to 34 Years | 0 (0.0%) | 0 (0.0%) |
| 35 to 64 Years | 5 (11.4%) | 5 (10.4%) |
| 65 to 74 Years | 0 (0.0%) | 0 (0.0%) |
| 75 Years and over | 0 (0.0%) | 0 (0.0%) |
Disability Class: Ambulatory Difficulty
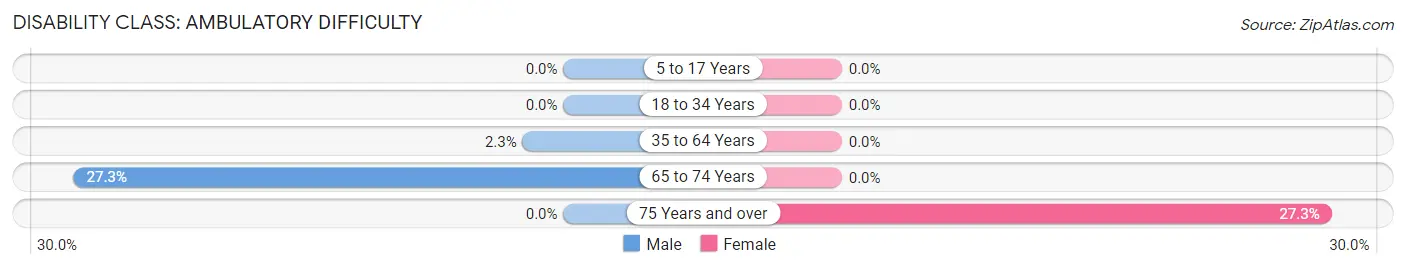
| Age Bracket | Male | Female |
| 5 to 17 Years | 0 (0.0%) | 0 (0.0%) |
| 18 to 34 Years | 0 (0.0%) | 0 (0.0%) |
| 35 to 64 Years | 1 (2.3%) | 0 (0.0%) |
| 65 to 74 Years | 3 (27.3%) | 0 (0.0%) |
| 75 Years and over | 0 (0.0%) | 3 (27.3%) |
Disability Class: Self-Care Difficulty
| Age Bracket | Male | Female |
| 5 to 17 Years | 0 (0.0%) | 0 (0.0%) |
| 18 to 34 Years | 0 (0.0%) | 0 (0.0%) |
| 35 to 64 Years | 0 (0.0%) | 0 (0.0%) |
| 65 to 74 Years | 0 (0.0%) | 0 (0.0%) |
| 75 Years and over | 0 (0.0%) | 0 (0.0%) |
Technology Access in Grant
Computing Device Access in Grant
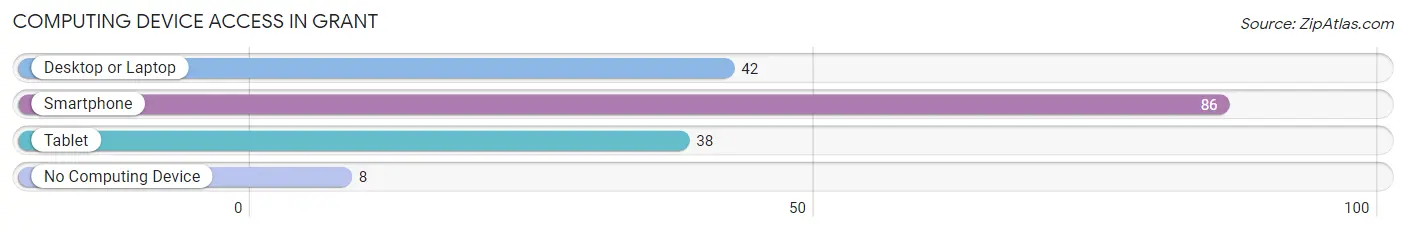
| Device Type | # Households | % Households |
| Desktop or Laptop | 42 | 44.7% |
| Smartphone | 86 | 91.5% |
| Tablet | 38 | 40.4% |
| No Computing Device | 8 | 8.5% |
| Total | 94 | 100.0% |
Internet Access in Grant
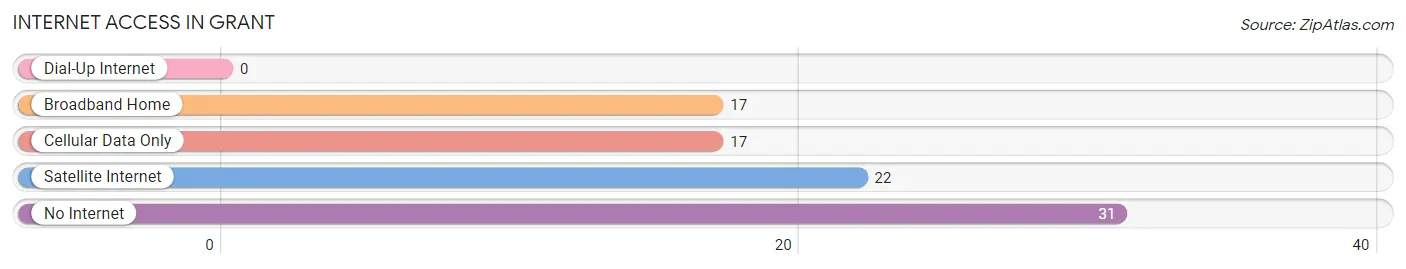
| Internet Type | # Households | % Households |
| Dial-Up Internet | 0 | 0.0% |
| Broadband Home | 17 | 18.1% |
| Cellular Data Only | 17 | 18.1% |
| Satellite Internet | 22 | 23.4% |
| No Internet | 31 | 33.0% |
| Total | 94 | 100.0% |
Grant Summary
History
Grant, Oklahoma is a small town located in the southwestern part of the state. It was founded in 1891 by the Choctaw Nation and named after General Ulysses S. Grant. The town was originally a trading post and was the first settlement in the area. The town grew quickly and by the early 1900s, it had become a thriving community with a population of over 1,000 people.
The town was a major stop on the Atchison, Topeka and Santa Fe Railway, which connected it to other towns in the area. This allowed for the growth of the local economy and the development of the town. The town was also home to a number of businesses, including a bank, a hotel, a general store, and a post office.
In the early 1900s, Grant was a major center for the oil industry. The town was home to several oil wells and refineries, and the local economy was heavily dependent on the oil industry. The town also had a number of other businesses, including a cotton gin, a lumber mill, and a flour mill.
The town was also home to a number of churches, including the First Baptist Church, the First Methodist Church, and the First Presbyterian Church. These churches provided a place for the community to come together and worship.
The town was also home to a number of schools, including the Grant High School, which was established in 1910. The school was the first high school in the area and provided education to the children of the town.
The town was also home to a number of other organizations, including the Grant Chamber of Commerce, which was established in 1912. The Chamber of Commerce was responsible for promoting the town and its businesses.
Geography
Grant is located in the southwestern part of Oklahoma, in the county of Grant. The town is situated on the banks of the Washita River, which flows through the town. The town is surrounded by rolling hills and is located in a region of the state known as the Red Bed Plains.
The town is located approximately 30 miles from the state capital of Oklahoma City. It is also located approximately 50 miles from the Texas border.
The town has a total area of 1.2 square miles, all of which is land. The town has a population of approximately 1,000 people.
Economy
The economy of Grant is largely based on the oil industry. The town is home to several oil wells and refineries, and the local economy is heavily dependent on the oil industry. The town also has a number of other businesses, including a cotton gin, a lumber mill, and a flour mill.
The town is also home to a number of other businesses, including a bank, a hotel, a general store, and a post office. The town is also home to a number of churches, which provide a place for the community to come together and worship.
Demographics
As of the 2010 census, the population of Grant was 1,000 people. The racial makeup of the town was 95.2% White, 0.7% African American, 0.2% Native American, 0.2% Asian, 0.1% Pacific Islander, 0.2% from other races, and 3.0% from two or more races. Hispanic or Latino of any race were 1.2% of the population.
The median income for a household in the town was $30,000, and the median income for a family was $35,000. The per capita income for the town was $15,000. About 10.2% of families and 12.2% of the population were below the poverty line, including 16.7% of those under age 18 and 8.3% of those age 65 or over.
Common Questions
What is the Total Population of Grant?
Total Population of Grant is 247.
What is the Total Male Population of Grant?
Total Male Population of Grant is 110.
What is the Total Female Population of Grant?
Total Female Population of Grant is 137.
What is the Ratio of Males per 100 Females in Grant?
There are 80.29 Males per 100 Females in Grant.
What is the Ratio of Females per 100 Males in Grant?
There are 124.55 Females per 100 Males in Grant.
What is the Median Population Age in Grant?
Median Population Age in Grant is 41.5 Years.
What is the Average Family Size in Grant
Average Family Size in Grant is 3.4 People.
What is the Average Household Size in Grant
Average Household Size in Grant is 2.6 People.
What is Per Capita Income in Grant?
Per Capita income in Grant is $20,475.
What is the Median Family Income in Grant?
Median Family Income in Grant is $47,813.
What is the Median Household income in Grant?
Median Household Income in Grant is $46,875.
What is Income or Wage Gap in Grant?
Income or Wage Gap in Grant is 5.8%.
Women in Grant earn 94.2 cents for every dollar earned by a man.
What is Inequality or Gini Index in Grant?
Inequality or Gini Index in Grant is 0.40.
How Large is the Labor Force in Grant?
There are 111 People in the Labor Forcein in Grant.
What is the Percentage of People in the Labor Force in Grant?
59.0% of People are in the Labor Force in Grant.
What is the Unemployment Rate in Grant?
Unemployment Rate in Grant is 14.4%.