Zip Codes with the Highest Percentage of Population with a Degree in Computers and Mathematics in Dayton, OH

RELATED REPORTS & OPTIONS

Computers and Mathematics
Population
Families and Households
Female Fertility
Female Fertility (Unmarried)
Race (Community Size)
Race (Percentage)
Ancestry (Community Size)
AfricanAlbanianAlsatianAmericanApacheArabArgentineanArmenianAustralianAustrianBasqueBelgianBhutaneseBlackfeetBolivianBrazilianBritishBulgarianBurmeseCajunCanadianCape VerdeanCelticCentral AmericanCentral American IndianCherokeeChileanChippewaChoctawColombianCosta RicanCreekCroatianCubanCzechCzechoslovakianDanishDominicanDutchEastern EuropeanEcuadorianEgyptianEnglishEstonianEthiopianEuropeanFilipinoFinnishFrenchFrench CanadianGermanGhanaianGreekGuamanian / ChamorroGuatemalanHaitianHonduranHungarianIcelanderIndian (Asian)InupiatIranianIraqiIrishIroquoisItalianJamaicanJapaneseKenyanKoreanLaotianLatvianLebaneseLiberianLithuanianLuxembourgerMacedonianMalteseMexicanMexican American IndianMoroccanNative HawaiianNavajoNicaraguanNigerianNorthern EuropeanNorwegianOkinawanPakistaniPalestinianPanamanianPennsylvania GermanPeruvianPolishPortuguesePotawatomiPuerto RicanRomanianRussianSalvadoranSamoanScandinavianScotch-IrishScottishSeminoleSenegaleseSerbianSiouxSlavicSlovakSloveneSouth AfricanSouth AmericanSpaniardSpanishSri LankanSubsaharan AfricanSudaneseSwedishSwissSyrianThaiTrinidadian and TobagonianTurkishUkrainianVenezuelanWelshWest IndianYugoslavian
Ancestry (Percentage)
AfricanAlbanianAlsatianAmericanApacheArabArgentineanArmenianAustralianAustrianBasqueBelgianBhutaneseBlackfeetBolivianBrazilianBritishBulgarianBurmeseCajunCanadianCape VerdeanCelticCentral AmericanCentral American IndianCherokeeChileanChippewaChoctawColombianCosta RicanCreekCroatianCubanCzechCzechoslovakianDanishDominicanDutchEastern EuropeanEcuadorianEgyptianEnglishEstonianEthiopianEuropeanFilipinoFinnishFrenchFrench CanadianGermanGhanaianGreekGuamanian / ChamorroGuatemalanHaitianHonduranHungarianIcelanderIndian (Asian)InupiatIranianIraqiIrishIroquoisItalianJamaicanJapaneseKenyanKoreanLaotianLatvianLebaneseLiberianLithuanianLuxembourgerMacedonianMalteseMexicanMexican American IndianMoroccanNative HawaiianNavajoNicaraguanNigerianNorthern EuropeanNorwegianOkinawanPakistaniPalestinianPanamanianPennsylvania GermanPeruvianPolishPortuguesePotawatomiPuerto RicanRomanianRussianSalvadoranSamoanScandinavianScotch-IrishScottishSeminoleSenegaleseSerbianSiouxSlavicSlovakSloveneSouth AfricanSouth AmericanSpaniardSpanishSri LankanSubsaharan AfricanSudaneseSwedishSwissSyrianThaiTrinidadian and TobagonianTurkishUkrainianVenezuelanWelshWest IndianYugoslavian
Immigrant Origin (Total)
AfricaArgentinaAsiaAustraliaBelarusBosnia and HerzegovinaBrazilBulgariaCambodiaCameroonCanadaCaribbeanCentral AmericaChinaColombiaCongoCosta RicaCubaDominican RepublicEastern AfricaEastern AsiaEastern EuropeEcuadorEgyptEl SalvadorEnglandEthiopiaEuropeFranceGermanyGhanaGreeceGuatemalaGuyanaHaitiHondurasHong KongHungaryIndiaIndonesiaIranIraqIrelandIsraelItalyJamaicaJapanJordanKenyaKoreaKuwaitLatin AmericaLebanonLiberiaMalaysiaMexicoMiddle AfricaMoldovaMoroccoNetherlandsNigeriaNorthern AfricaNorthern EuropeNorwayOceaniaPakistanPanamaPeruPhilippinesPolandPortugalRomaniaRussiaSaudi ArabiaScotlandSenegalSingaporeSouth AfricaSouth AmericaSouth Central AsiaSouth Eastern AsiaSouthern EuropeSpainSudanTaiwanThailandTrinidad and TobagoTurkeyUkraineUzbekistanVenezuelaVietnamWestern AfricaWestern AsiaWestern EuropeZaire
Immigrant Origin (Percentage)
AfricaArgentinaAsiaAustraliaBelarusBosnia and HerzegovinaBrazilBulgariaCambodiaCameroonCanadaCaribbeanCentral AmericaChinaColombiaCongoCosta RicaCubaDominican RepublicEastern AfricaEastern AsiaEastern EuropeEcuadorEgyptEl SalvadorEnglandEthiopiaEuropeFranceGermanyGhanaGreeceGuatemalaGuyanaHaitiHondurasHong KongHungaryIndiaIndonesiaIranIraqIrelandIsraelItalyJamaicaJapanJordanKenyaKoreaKuwaitLatin AmericaLebanonLiberiaMalaysiaMexicoMiddle AfricaMoldovaMoroccoNetherlandsNigeriaNorthern AfricaNorthern EuropeNorwayOceaniaPakistanPanamaPeruPhilippinesPolandPortugalRomaniaRussiaSaudi ArabiaScotlandSenegalSingaporeSouth AfricaSouth AmericaSouth Central AsiaSouth Eastern AsiaSouthern EuropeSpainSudanTaiwanThailandTrinidad and TobagoTurkeyUkraineUzbekistanVenezuelaVietnamWestern AfricaWestern AsiaWestern EuropeZaire
Income
Income (Families)
Income (Households)
Poverty
Poverty (Families)
Unemployment
Employment Occupations
Employment Industries
Employer Class
Commute Time
Commute Means
School Enrollment
Education by Degree Field
Occupancy
Finances
Physical Characteristics
Dayton
Compare Zip Codes
Comparison Subject

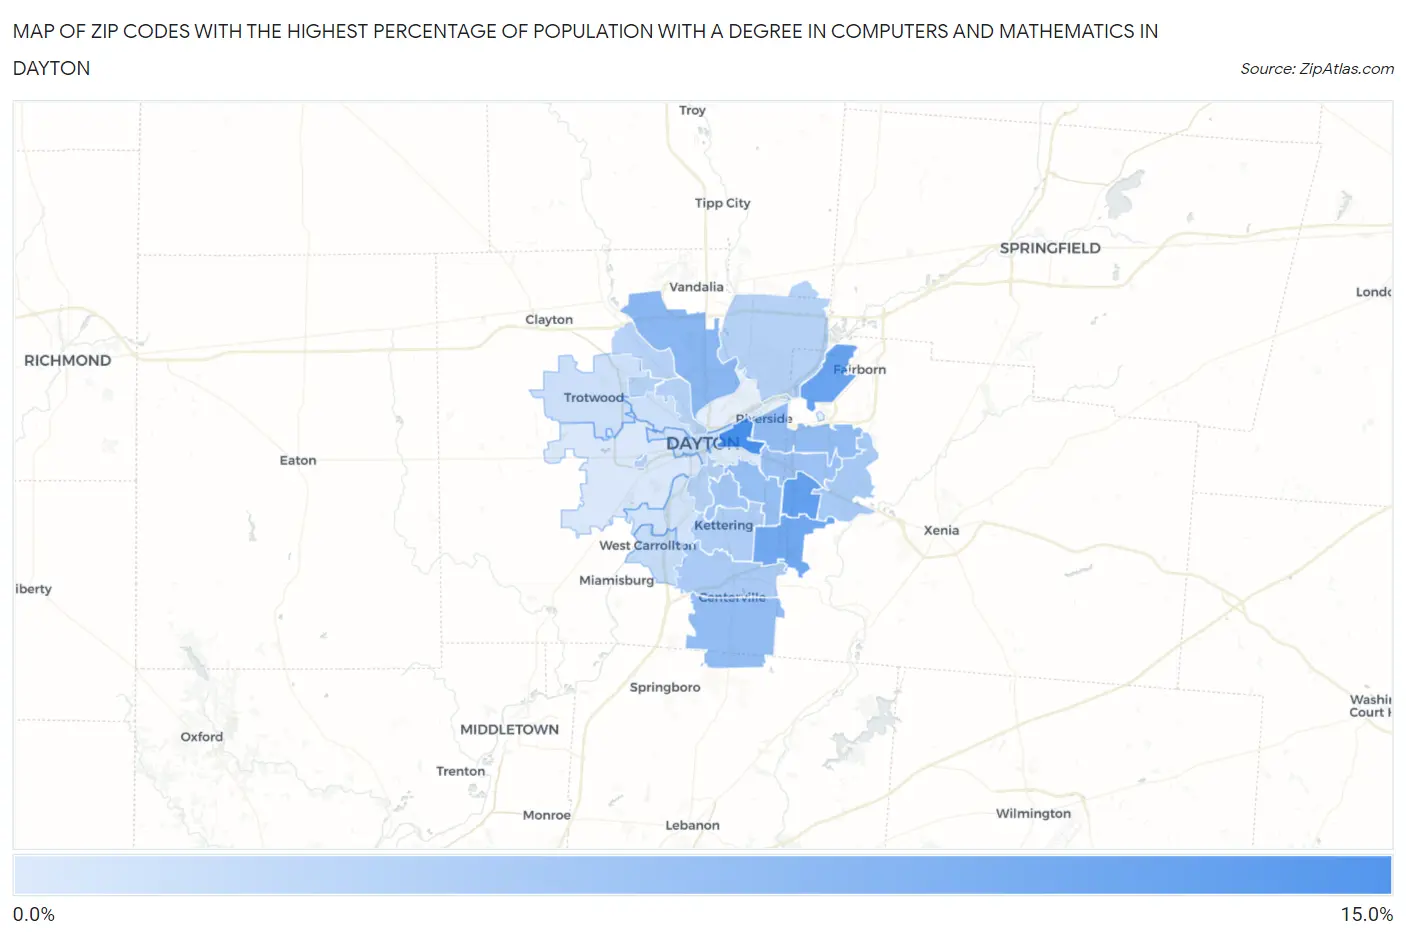
Map of Zip Codes with the Highest Percentage of Population with a Degree in Computers and Mathematics in Dayton

0.0%
15.0%
Zip Codes with the Highest Percentage of Population with a Degree in Computers and Mathematics in Dayton Map

Zip Codes with the Highest Percentage of Population with a Degree in Computers and Mathematics in Dayton, OH

Zip Code % Graduates vs State vs National
1.4540310.2%4.1%(+6.03)#594.9%(+5.27)#1,703
2.454308.4%4.1%(+4.28)#844.9%(+3.52)#2,593
3.454338.1%4.1%(+3.93)#934.9%(+3.17)#2,851
4.454407.6%4.1%(+3.45)#994.9%(+2.69)#3,262
5.454146.1%4.1%(+1.98)#1574.9%(+1.22)#5,088
6.454315.5%4.1%(+1.38)#1964.9%(+0.622)#6,271
7.454585.5%4.1%(+1.34)#1994.9%(+0.580)#6,359
8.454205.3%4.1%(+1.19)#2134.9%(+0.435)#6,690
9.454325.1%4.1%(+0.916)#2324.9%(+0.156)#7,332
10.454194.6%4.1%(+0.418)#2864.9%(-0.343)#8,694
11.454344.4%4.1%(+0.218)#3094.9%(-0.542)#9,343
12.454594.2%4.1%(+0.022)#3324.9%(-0.738)#9,973
13.454293.9%4.1%(-0.218)#3584.9%(-0.978)#10,751
14.454283.7%4.1%(-0.384)#3834.9%(-1.14)#11,371
15.454093.7%4.1%(-0.446)#3924.9%(-1.21)#11,589
16.454243.5%4.1%(-0.638)#4124.9%(-1.40)#12,308
17.454163.5%4.1%(-0.674)#4184.9%(-1.43)#12,440
18.454053.5%4.1%(-0.676)#4204.9%(-1.44)#12,451
19.454153.3%4.1%(-0.824)#4464.9%(-1.58)#12,989
20.454492.5%4.1%(-1.59)#5414.9%(-2.35)#15,751
21.454022.2%4.1%(-1.91)#5924.9%(-2.67)#16,895
22.454262.2%4.1%(-1.95)#5964.9%(-2.71)#17,034
23.454062.2%4.1%(-1.96)#6004.9%(-2.72)#17,071
24.454391.9%4.1%(-2.26)#6404.9%(-3.02)#17,998
25.454171.3%4.1%(-2.81)#7054.9%(-3.57)#19,655
26.454101.2%4.1%(-2.91)#7144.9%(-3.67)#19,925

Common Questions

What are the Top 10 Zip Codes with the Highest Percentage of Population with a Degree in Computers and Mathematics in Dayton, OH?
Top 10 Zip Codes with the Highest Percentage of Population with a Degree in Computers and Mathematics in Dayton, OH are:
#1
10.2%
#2
8.4%
#3
8.1%
#4
7.6%
#5
6.1%
#6
5.5%
#7
5.5%
#8
5.3%
#9
5.1%
#10
4.6%
What zip code has the Highest Percentage of Population with a Degree in Computers and Mathematics in Dayton, OH?
45403 has the Highest Percentage of Population with a Degree in Computers and Mathematics in Dayton, OH with 10.2%.
What is the Percentage of Population with a Degree in Computers and Mathematics in Dayton, OH?
Percentage of Population with a Degree in Computers and Mathematics in Dayton is 3.6%.
What is the Percentage of Population with a Degree in Computers and Mathematics in Ohio?
Percentage of Population with a Degree in Computers and Mathematics in Ohio is 4.1%.
What is the Percentage of Population with a Degree in Computers and Mathematics in the United States?
Percentage of Population with a Degree in Computers and Mathematics in the United States is 4.9%.