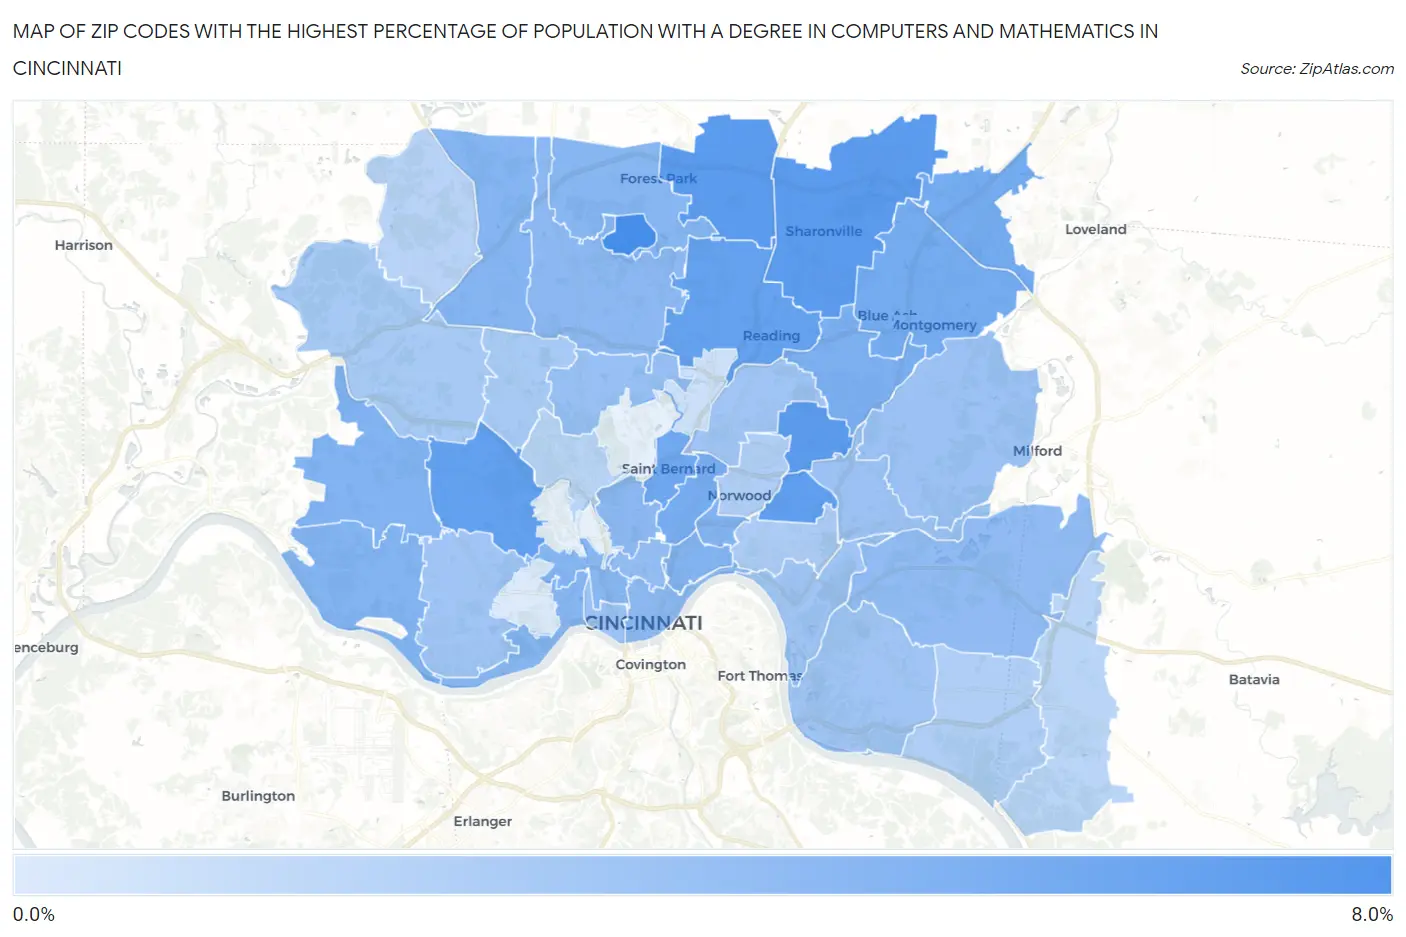
Zip Codes with the Highest Percentage of Population with a Degree in Computers and Mathematics in Cincinnati, OH
RELATED REPORTS & OPTIONS
Computers and Mathematics
Cincinnati
Compare Zip Codes
Map of Zip Codes with the Highest Percentage of Population with a Degree in Computers and Mathematics in Cincinnati
0.0%
8.0%
Zip Codes with the Highest Percentage of Population with a Degree in Computers and Mathematics in Cincinnati, OH
| Zip Code | % Graduates | vs State | vs National | |
| 1. | 45218 | 7.9% | 4.1%(+3.72)#94 | 4.9%(+2.96)#3,024 |
| 2. | 45241 | 6.9% | 4.1%(+2.79)#116 | 4.9%(+2.03)#3,917 |
| 3. | 45246 | 6.9% | 4.1%(+2.74)#118 | 4.9%(+1.98)#3,969 |
| 4. | 45213 | 6.8% | 4.1%(+2.64)#122 | 4.9%(+1.88)#4,106 |
| 5. | 45209 | 6.6% | 4.1%(+2.45)#125 | 4.9%(+1.69)#4,347 |
| 6. | 45211 | 6.4% | 4.1%(+2.28)#137 | 4.9%(+1.52)#4,584 |
| 7. | 45215 | 6.3% | 4.1%(+2.17)#144 | 4.9%(+1.41)#4,765 |
| 8. | 45217 | 5.7% | 4.1%(+1.61)#181 | 4.9%(+0.852)#5,783 |
| 9. | 45249 | 5.6% | 4.1%(+1.44)#191 | 4.9%(+0.681)#6,126 |
| 10. | 45242 | 5.5% | 4.1%(+1.38)#195 | 4.9%(+0.624)#6,266 |
| 11. | 45229 | 5.4% | 4.1%(+1.26)#205 | 4.9%(+0.498)#6,529 |
| 12. | 45236 | 5.2% | 4.1%(+1.06)#221 | 4.9%(+0.304)#6,994 |
| 13. | 45248 | 4.9% | 4.1%(+0.790)#244 | 4.9%(+0.030)#7,631 |
| 14. | 45207 | 4.8% | 4.1%(+0.713)#255 | 4.9%(-0.047)#7,858 |
| 15. | 45233 | 4.8% | 4.1%(+0.705)#256 | 4.9%(-0.055)#7,876 |
| 16. | 45206 | 4.8% | 4.1%(+0.698)#257 | 4.9%(-0.062)#7,895 |
| 17. | 45251 | 4.7% | 4.1%(+0.550)#273 | 4.9%(-0.211)#8,321 |
| 18. | 45214 | 4.6% | 4.1%(+0.466)#280 | 4.9%(-0.294)#8,564 |
| 19. | 45240 | 4.6% | 4.1%(+0.459)#284 | 4.9%(-0.301)#8,587 |
| 20. | 45204 | 4.6% | 4.1%(+0.417)#287 | 4.9%(-0.343)#8,697 |
| 21. | 45202 | 4.4% | 4.1%(+0.263)#304 | 4.9%(-0.497)#9,208 |
| 22. | 45231 | 4.4% | 4.1%(+0.241)#305 | 4.9%(-0.519)#9,274 |
| 23. | 45220 | 4.4% | 4.1%(+0.218)#308 | 4.9%(-0.542)#9,340 |
| 24. | 45244 | 4.2% | 4.1%(+0.056)#327 | 4.9%(-0.704)#9,872 |
| 25. | 45219 | 4.0% | 4.1%(-0.145)#350 | 4.9%(-0.906)#10,499 |
| 26. | 45224 | 3.8% | 4.1%(-0.286)#367 | 4.9%(-1.05)#10,990 |
| 27. | 45227 | 3.7% | 4.1%(-0.432)#389 | 4.9%(-1.19)#11,537 |
| 28. | 45203 | 3.7% | 4.1%(-0.451)#393 | 4.9%(-1.21)#11,603 |
| 29. | 45243 | 3.7% | 4.1%(-0.461)#394 | 4.9%(-1.22)#11,637 |
| 30. | 45237 | 3.4% | 4.1%(-0.736)#431 | 4.9%(-1.50)#12,672 |
| 31. | 45230 | 3.4% | 4.1%(-0.741)#434 | 4.9%(-1.50)#12,684 |
| 32. | 45238 | 3.4% | 4.1%(-0.762)#439 | 4.9%(-1.52)#12,746 |
| 33. | 45226 | 3.3% | 4.1%(-0.815)#445 | 4.9%(-1.57)#12,951 |
| 34. | 45239 | 3.1% | 4.1%(-1.08)#470 | 4.9%(-1.84)#13,885 |
| 35. | 45247 | 3.0% | 4.1%(-1.14)#478 | 4.9%(-1.90)#14,105 |
| 36. | 45208 | 2.8% | 4.1%(-1.33)#494 | 4.9%(-2.09)#14,782 |
| 37. | 45212 | 2.6% | 4.1%(-1.49)#531 | 4.9%(-2.25)#15,351 |
| 38. | 45255 | 2.6% | 4.1%(-1.52)#536 | 4.9%(-2.28)#15,488 |
| 39. | 45252 | 2.3% | 4.1%(-1.85)#580 | 4.9%(-2.61)#16,658 |
| 40. | 45223 | 2.1% | 4.1%(-2.05)#613 | 4.9%(-2.81)#17,356 |
| 41. | 45245 | 2.1% | 4.1%(-2.07)#615 | 4.9%(-2.83)#17,396 |
| 42. | 45216 | 1.2% | 4.1%(-2.89)#712 | 4.9%(-3.65)#19,876 |
| 43. | 45205 | 0.46% | 4.1%(-3.68)#796 | 4.9%(-4.44)#21,537 |
1
Common Questions
What are the Top 10 Zip Codes with the Highest Percentage of Population with a Degree in Computers and Mathematics in Cincinnati, OH?
Top 10 Zip Codes with the Highest Percentage of Population with a Degree in Computers and Mathematics in Cincinnati, OH are:
What zip code has the Highest Percentage of Population with a Degree in Computers and Mathematics in Cincinnati, OH?
45218 has the Highest Percentage of Population with a Degree in Computers and Mathematics in Cincinnati, OH with 7.9%.
What is the Percentage of Population with a Degree in Computers and Mathematics in Cincinnati, OH?
Percentage of Population with a Degree in Computers and Mathematics in Cincinnati is 4.3%.
What is the Percentage of Population with a Degree in Computers and Mathematics in Ohio?
Percentage of Population with a Degree in Computers and Mathematics in Ohio is 4.1%.
What is the Percentage of Population with a Degree in Computers and Mathematics in the United States?
Percentage of Population with a Degree in Computers and Mathematics in the United States is 4.9%.