Zip Codes with the Highest Percentage of Population with a Degree in Computers and Mathematics in New Mexico
RELATED REPORTS & OPTIONS
Computers and Mathematics
New Mexico
Compare Zip Codes
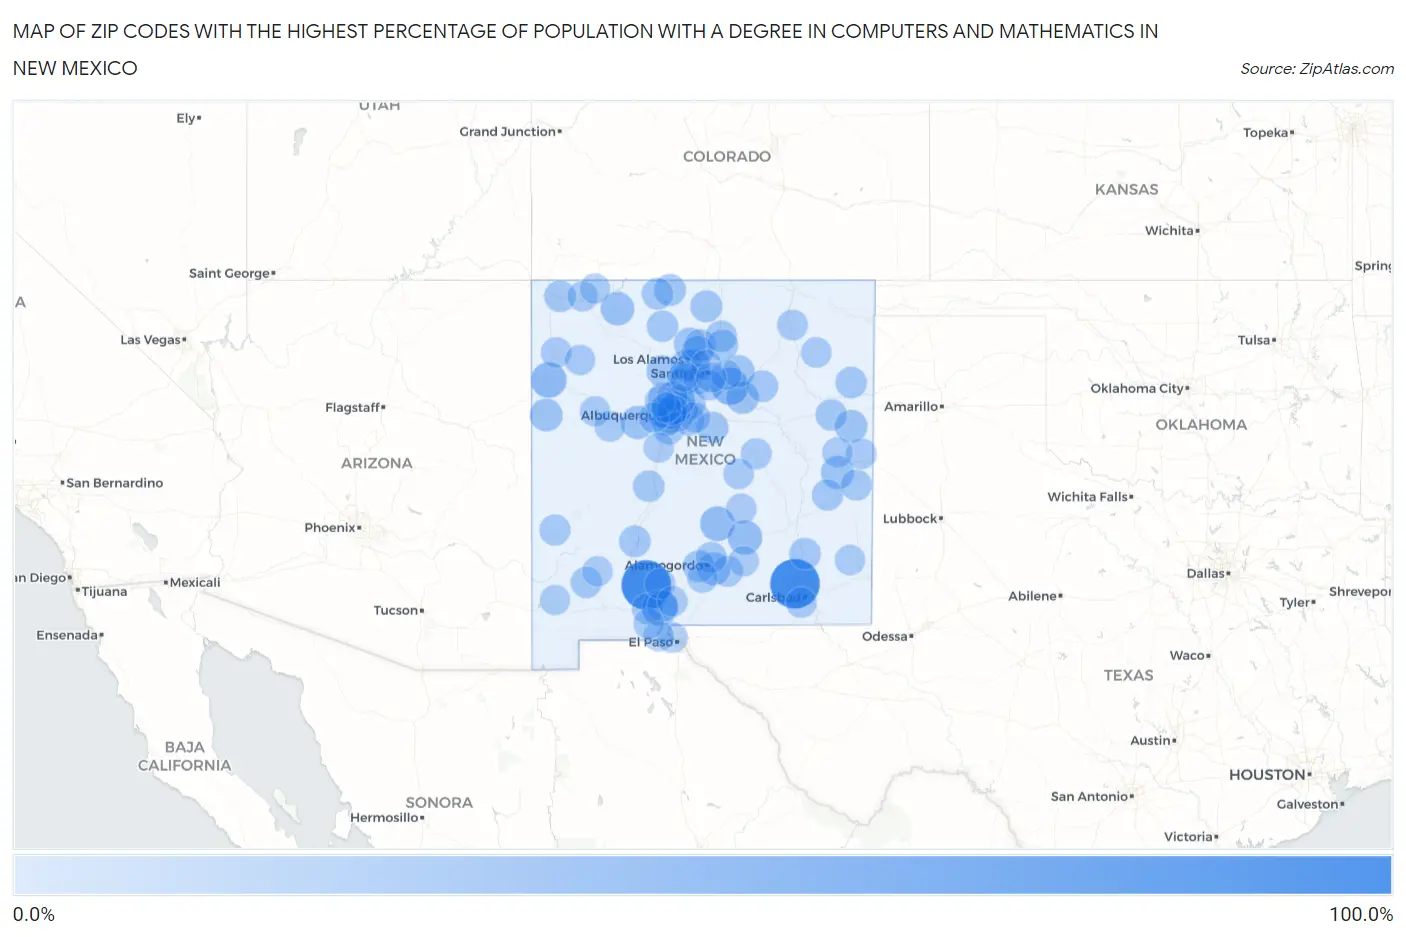
Map of Zip Codes with the Highest Percentage of Population with a Degree in Computers and Mathematics in New Mexico
0.0%
100.0%
Zip Codes with the Highest Percentage of Population with a Degree in Computers and Mathematics in New Mexico
| Zip Code | % Graduates | vs State | vs National | |
| 1. | 87940 | 100.0% | 3.7%(+96.3)#1 | 4.9%(+95.1)#9 |
| 2. | 88254 | 100.0% | 3.7%(+96.3)#2 | 4.9%(+95.1)#21 |
| 3. | 87538 | 36.0% | 3.7%(+32.3)#3 | 4.9%(+31.1)#160 |
| 4. | 88046 | 31.1% | 3.7%(+27.4)#4 | 4.9%(+26.2)#211 |
| 5. | 87317 | 28.6% | 3.7%(+24.9)#5 | 4.9%(+23.7)#242 |
| 6. | 88341 | 24.2% | 3.7%(+20.5)#6 | 4.9%(+19.3)#319 |
| 7. | 88336 | 22.9% | 3.7%(+19.2)#7 | 4.9%(+18.0)#369 |
| 8. | 87412 | 17.4% | 3.7%(+13.7)#8 | 4.9%(+12.5)#597 |
| 9. | 87026 | 16.7% | 3.7%(+13.0)#9 | 4.9%(+11.8)#638 |
| 10. | 88118 | 16.7% | 3.7%(+13.0)#10 | 4.9%(+11.8)#653 |
| 11. | 87327 | 15.0% | 3.7%(+11.3)#11 | 4.9%(+10.1)#787 |
| 12. | 88325 | 14.8% | 3.7%(+11.1)#12 | 4.9%(+9.91)#811 |
| 13. | 87569 | 14.3% | 3.7%(+10.6)#13 | 4.9%(+9.39)#870 |
| 14. | 88120 | 13.6% | 3.7%(+9.93)#14 | 4.9%(+8.74)#953 |
| 15. | 87537 | 13.1% | 3.7%(+9.38)#15 | 4.9%(+8.19)#1,040 |
| 16. | 87547 | 12.3% | 3.7%(+8.57)#16 | 4.9%(+7.38)#1,174 |
| 17. | 87731 | 11.0% | 3.7%(+7.33)#17 | 4.9%(+6.14)#1,448 |
| 18. | 87520 | 10.4% | 3.7%(+6.68)#18 | 4.9%(+5.49)#1,617 |
| 19. | 87577 | 9.9% | 3.7%(+6.23)#19 | 4.9%(+5.04)#1,782 |
| 20. | 88330 | 9.8% | 3.7%(+6.12)#20 | 4.9%(+4.93)#1,826 |
| 21. | 87024 | 9.8% | 3.7%(+6.10)#21 | 4.9%(+4.91)#1,835 |
| 22. | 87035 | 9.3% | 3.7%(+5.62)#22 | 4.9%(+4.43)#2,052 |
| 23. | 87544 | 9.3% | 3.7%(+5.56)#23 | 4.9%(+4.37)#2,089 |
| 24. | 88232 | 9.2% | 3.7%(+5.54)#24 | 4.9%(+4.35)#2,096 |
| 25. | 87566 | 9.1% | 3.7%(+5.38)#25 | 4.9%(+4.20)#2,179 |
| 26. | 87421 | 9.1% | 3.7%(+5.38)#26 | 4.9%(+4.20)#2,184 |
| 27. | 87935 | 9.0% | 3.7%(+5.32)#27 | 4.9%(+4.14)#2,232 |
| 28. | 87532 | 9.0% | 3.7%(+5.31)#28 | 4.9%(+4.12)#2,248 |
| 29. | 87528 | 8.7% | 3.7%(+4.97)#29 | 4.9%(+3.78)#2,438 |
| 30. | 87701 | 8.4% | 3.7%(+4.74)#30 | 4.9%(+3.56)#2,570 |
| 31. | 88426 | 8.3% | 3.7%(+4.63)#31 | 4.9%(+3.44)#2,637 |
| 32. | 87068 | 8.1% | 3.7%(+4.41)#32 | 4.9%(+3.23)#2,804 |
| 33. | 87801 | 8.1% | 3.7%(+4.35)#33 | 4.9%(+3.17)#2,854 |
| 34. | 87553 | 8.0% | 3.7%(+4.29)#34 | 4.9%(+3.11)#2,894 |
| 35. | 87059 | 7.8% | 3.7%(+4.14)#35 | 4.9%(+2.95)#3,028 |
| 36. | 88401 | 7.8% | 3.7%(+4.07)#36 | 4.9%(+2.88)#3,084 |
| 37. | 88043 | 7.6% | 3.7%(+3.90)#37 | 4.9%(+2.71)#3,238 |
| 38. | 87113 | 7.4% | 3.7%(+3.73)#38 | 4.9%(+2.54)#3,403 |
| 39. | 88116 | 7.4% | 3.7%(+3.66)#39 | 4.9%(+2.47)#3,464 |
| 40. | 87017 | 7.4% | 3.7%(+3.66)#40 | 4.9%(+2.47)#3,465 |
| 41. | 87047 | 7.2% | 3.7%(+3.50)#41 | 4.9%(+2.31)#3,625 |
| 42. | 88317 | 6.9% | 3.7%(+3.23)#42 | 4.9%(+2.04)#3,907 |
| 43. | 87521 | 6.8% | 3.7%(+3.11)#43 | 4.9%(+1.92)#4,044 |
| 44. | 88337 | 6.5% | 3.7%(+2.78)#44 | 4.9%(+1.59)#4,492 |
| 45. | 88130 | 6.4% | 3.7%(+2.74)#45 | 4.9%(+1.55)#4,536 |
| 46. | 88005 | 6.3% | 3.7%(+2.56)#46 | 4.9%(+1.37)#4,832 |
| 47. | 87008 | 6.2% | 3.7%(+2.48)#47 | 4.9%(+1.29)#4,964 |
| 48. | 88039 | 6.1% | 3.7%(+2.43)#48 | 4.9%(+1.25)#5,044 |
| 49. | 87108 | 6.1% | 3.7%(+2.37)#49 | 4.9%(+1.18)#5,159 |
| 50. | 87106 | 5.5% | 3.7%(+1.75)#50 | 4.9%(+0.557)#6,396 |
| 51. | 88353 | 5.3% | 3.7%(+1.56)#51 | 4.9%(+0.369)#6,854 |
| 52. | 87052 | 5.2% | 3.7%(+1.50)#52 | 4.9%(+0.314)#6,970 |
| 53. | 87123 | 5.0% | 3.7%(+1.27)#53 | 4.9%(+0.087)#7,499 |
| 54. | 87747 | 5.0% | 3.7%(+1.27)#54 | 4.9%(+0.083)#7,508 |
| 55. | 88001 | 4.8% | 3.7%(+1.12)#55 | 4.9%(-0.072)#7,923 |
| 56. | 87041 | 4.8% | 3.7%(+1.06)#56 | 4.9%(-0.132)#8,093 |
| 57. | 87112 | 4.7% | 3.7%(+1.02)#57 | 4.9%(-0.172)#8,211 |
| 58. | 87034 | 4.6% | 3.7%(+0.924)#58 | 4.9%(-0.264)#8,483 |
| 59. | 87122 | 4.6% | 3.7%(+0.919)#59 | 4.9%(-0.269)#8,496 |
| 60. | 87507 | 4.5% | 3.7%(+0.764)#60 | 4.9%(-0.424)#8,965 |
| 61. | 87144 | 4.4% | 3.7%(+0.739)#61 | 4.9%(-0.449)#9,041 |
| 62. | 87743 | 4.3% | 3.7%(+0.642)#62 | 4.9%(-0.546)#9,368 |
| 63. | 88101 | 4.3% | 3.7%(+0.603)#63 | 4.9%(-0.585)#9,512 |
| 64. | 87015 | 4.2% | 3.7%(+0.509)#64 | 4.9%(-0.678)#9,788 |
| 65. | 88318 | 4.2% | 3.7%(+0.504)#65 | 4.9%(-0.683)#9,801 |
| 66. | 88012 | 4.2% | 3.7%(+0.502)#66 | 4.9%(-0.686)#9,812 |
| 67. | 87325 | 4.1% | 3.7%(+0.392)#67 | 4.9%(-0.796)#10,145 |
| 68. | 88310 | 4.0% | 3.7%(+0.322)#68 | 4.9%(-0.866)#10,375 |
| 69. | 87104 | 4.0% | 3.7%(+0.320)#69 | 4.9%(-0.868)#10,382 |
| 70. | 87111 | 3.9% | 3.7%(+0.240)#70 | 4.9%(-0.948)#10,639 |
| 71. | 88220 | 3.9% | 3.7%(+0.220)#71 | 4.9%(-0.968)#10,701 |
| 72. | 87506 | 3.9% | 3.7%(+0.191)#72 | 4.9%(-0.997)#10,816 |
| 73. | 87043 | 3.9% | 3.7%(+0.170)#73 | 4.9%(-1.02)#10,881 |
| 74. | 88063 | 3.8% | 3.7%(+0.135)#74 | 4.9%(-1.05)#11,043 |
| 75. | 87110 | 3.8% | 3.7%(+0.075)#75 | 4.9%(-1.11)#11,260 |
| 76. | 87313 | 3.5% | 3.7%(-0.166)#76 | 4.9%(-1.35)#12,136 |
| 77. | 87508 | 3.5% | 3.7%(-0.199)#77 | 4.9%(-1.39)#12,269 |
| 78. | 87105 | 3.5% | 3.7%(-0.240)#78 | 4.9%(-1.43)#12,421 |
| 79. | 88008 | 3.4% | 3.7%(-0.297)#79 | 4.9%(-1.48)#12,631 |
| 80. | 88011 | 3.3% | 3.7%(-0.360)#80 | 4.9%(-1.55)#12,848 |
| 81. | 87120 | 3.3% | 3.7%(-0.409)#81 | 4.9%(-1.60)#13,027 |
| 82. | 88044 | 3.3% | 3.7%(-0.417)#82 | 4.9%(-1.60)#13,051 |
| 83. | 88124 | 3.3% | 3.7%(-0.445)#83 | 4.9%(-1.63)#13,150 |
| 84. | 88316 | 3.3% | 3.7%(-0.450)#84 | 4.9%(-1.64)#13,168 |
| 85. | 87004 | 3.2% | 3.7%(-0.462)#85 | 4.9%(-1.65)#13,214 |
| 86. | 88260 | 3.2% | 3.7%(-0.515)#86 | 4.9%(-1.70)#13,415 |
| 87. | 87109 | 3.1% | 3.7%(-0.574)#87 | 4.9%(-1.76)#13,618 |
| 88. | 87121 | 3.0% | 3.7%(-0.672)#88 | 4.9%(-1.86)#13,968 |
| 89. | 87124 | 2.9% | 3.7%(-0.803)#89 | 4.9%(-1.99)#14,414 |
| 90. | 87083 | 2.8% | 3.7%(-0.889)#90 | 4.9%(-2.08)#14,729 |
| 91. | 87552 | 2.8% | 3.7%(-0.956)#91 | 4.9%(-2.14)#14,987 |
| 92. | 87114 | 2.7% | 3.7%(-0.971)#92 | 4.9%(-2.16)#15,039 |
| 93. | 87020 | 2.7% | 3.7%(-1.01)#93 | 4.9%(-2.19)#15,172 |
| 94. | 87505 | 2.6% | 3.7%(-1.06)#94 | 4.9%(-2.25)#15,375 |
| 95. | 87002 | 2.6% | 3.7%(-1.09)#95 | 4.9%(-2.28)#15,467 |
| 96. | 88045 | 2.6% | 3.7%(-1.10)#96 | 4.9%(-2.29)#15,523 |
| 97. | 88041 | 2.6% | 3.7%(-1.13)#97 | 4.9%(-2.31)#15,605 |
| 98. | 87401 | 2.5% | 3.7%(-1.19)#98 | 4.9%(-2.38)#15,843 |
| 99. | 87410 | 2.5% | 3.7%(-1.21)#99 | 4.9%(-2.40)#15,909 |
| 100. | 88339 | 2.5% | 3.7%(-1.24)#100 | 4.9%(-2.42)#16,032 |
Common Questions
What are the Top 10 Zip Codes with the Highest Percentage of Population with a Degree in Computers and Mathematics in New Mexico?
Top 10 Zip Codes with the Highest Percentage of Population with a Degree in Computers and Mathematics in New Mexico are:
What zip code has the Highest Percentage of Population with a Degree in Computers and Mathematics in New Mexico?
87940 has the Highest Percentage of Population with a Degree in Computers and Mathematics in New Mexico with 100.0%.
What is the Percentage of Population with a Degree in Computers and Mathematics in the State of New Mexico?
Percentage of Population with a Degree in Computers and Mathematics in New Mexico is 3.7%.
What is the Percentage of Population with a Degree in Computers and Mathematics in the United States?
Percentage of Population with a Degree in Computers and Mathematics in the United States is 4.9%.