Zip Codes with the Highest Percentage of Population with a Degree in Computers and Mathematics in Arizona
RELATED REPORTS & OPTIONS
Computers and Mathematics
Arizona
Compare Zip Codes
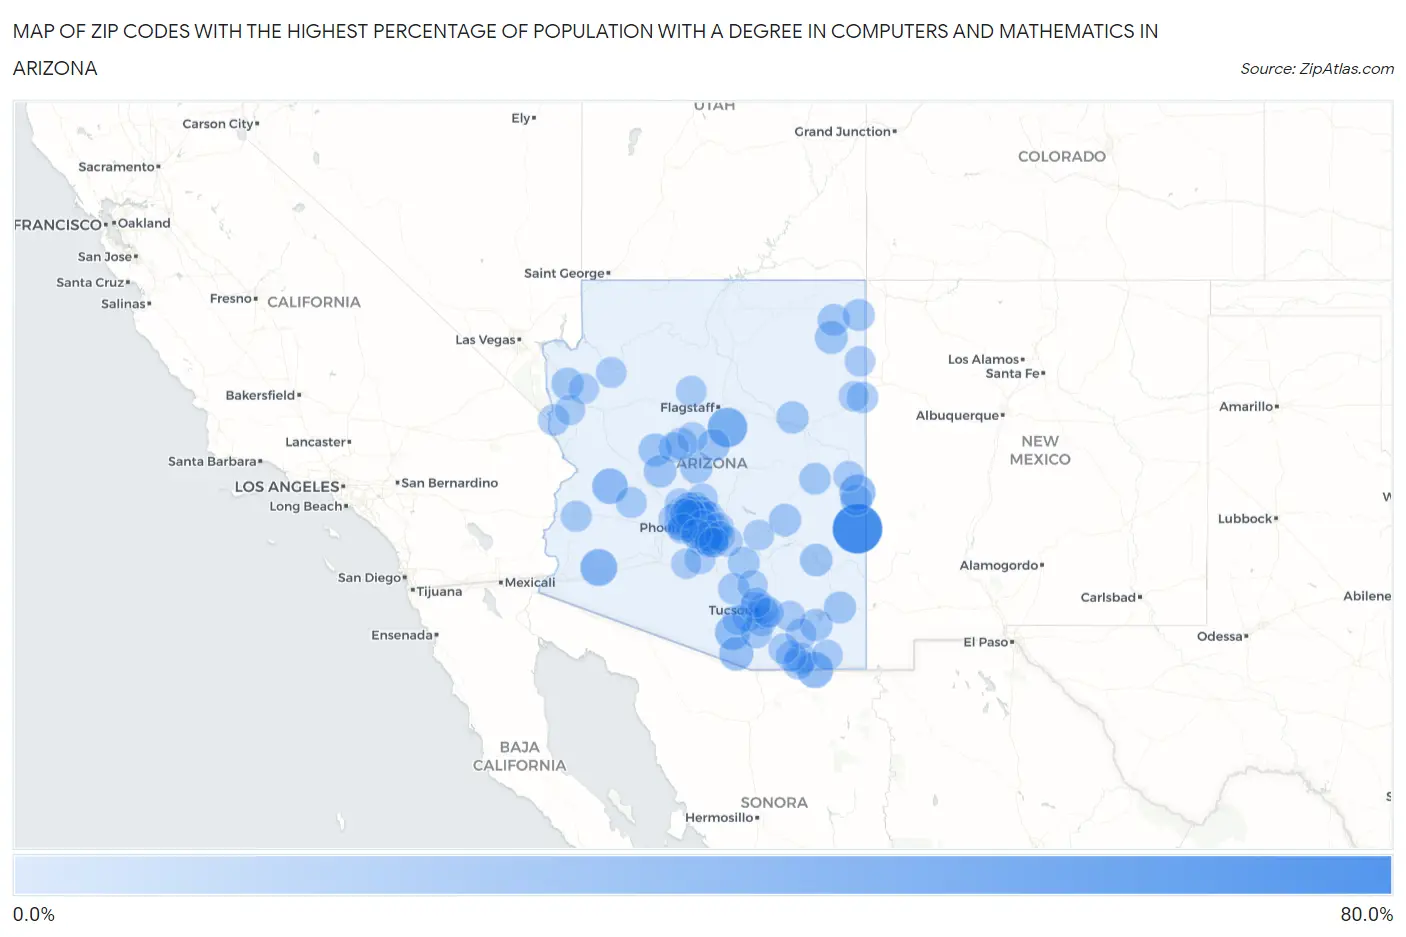
Map of Zip Codes with the Highest Percentage of Population with a Degree in Computers and Mathematics in Arizona
0.0%
80.0%
Zip Codes with the Highest Percentage of Population with a Degree in Computers and Mathematics in Arizona
| Zip Code | % Graduates | vs State | vs National | |
| 1. | 85922 | 79.6% | 4.5%(+75.1)#1 | 4.9%(+74.7)#28 |
| 2. | 86038 | 40.0% | 4.5%(+35.5)#2 | 4.9%(+35.1)#132 |
| 3. | 85347 | 29.9% | 4.5%(+25.4)#3 | 4.9%(+25.0)#231 |
| 4. | 85620 | 26.9% | 4.5%(+22.4)#4 | 4.9%(+22.0)#267 |
| 5. | 85932 | 26.3% | 4.5%(+21.8)#5 | 4.9%(+21.4)#278 |
| 6. | 85357 | 25.0% | 4.5%(+20.5)#6 | 4.9%(+20.1)#301 |
| 7. | 85736 | 23.0% | 4.5%(+18.5)#7 | 4.9%(+18.1)#364 |
| 8. | 85601 | 19.0% | 4.5%(+14.5)#8 | 4.9%(+14.1)#506 |
| 9. | 86338 | 15.0% | 4.5%(+10.6)#9 | 4.9%(+10.1)#786 |
| 10. | 86503 | 14.3% | 4.5%(+9.81)#10 | 4.9%(+9.39)#862 |
| 11. | 86332 | 14.1% | 4.5%(+9.59)#11 | 4.9%(+9.17)#901 |
| 12. | 85543 | 13.3% | 4.5%(+8.86)#12 | 4.9%(+8.44)#1,002 |
| 13. | 85606 | 13.2% | 4.5%(+8.70)#13 | 4.9%(+8.28)#1,024 |
| 14. | 86032 | 13.1% | 4.5%(+8.60)#14 | 4.9%(+8.18)#1,043 |
| 15. | 86441 | 12.7% | 4.5%(+8.21)#15 | 4.9%(+7.79)#1,095 |
| 16. | 86335 | 12.5% | 4.5%(+8.04)#16 | 4.9%(+7.62)#1,124 |
| 17. | 86333 | 12.3% | 4.5%(+7.78)#17 | 4.9%(+7.36)#1,177 |
| 18. | 85550 | 12.1% | 4.5%(+7.61)#18 | 4.9%(+7.19)#1,202 |
| 19. | 85605 | 11.9% | 4.5%(+7.47)#19 | 4.9%(+7.05)#1,224 |
| 20. | 86538 | 11.8% | 4.5%(+7.34)#20 | 4.9%(+6.92)#1,254 |
| 21. | 86544 | 11.5% | 4.5%(+7.06)#21 | 4.9%(+6.64)#1,320 |
| 22. | 86315 | 11.1% | 4.5%(+6.67)#22 | 4.9%(+6.25)#1,411 |
| 23. | 85132 | 10.5% | 4.5%(+5.98)#23 | 4.9%(+5.56)#1,598 |
| 24. | 85929 | 10.3% | 4.5%(+5.82)#24 | 4.9%(+5.40)#1,653 |
| 25. | 85650 | 10.2% | 4.5%(+5.73)#25 | 4.9%(+5.31)#1,690 |
| 26. | 85027 | 10.1% | 4.5%(+5.64)#26 | 4.9%(+5.22)#1,712 |
| 27. | 85615 | 10.1% | 4.5%(+5.62)#27 | 4.9%(+5.20)#1,715 |
| 28. | 85920 | 9.8% | 4.5%(+5.37)#28 | 4.9%(+4.95)#1,814 |
| 29. | 85629 | 9.8% | 4.5%(+5.34)#29 | 4.9%(+4.92)#1,831 |
| 30. | 85145 | 9.5% | 4.5%(+5.06)#30 | 4.9%(+4.64)#1,944 |
| 31. | 85085 | 9.5% | 4.5%(+4.98)#31 | 4.9%(+4.56)#1,991 |
| 32. | 86426 | 9.2% | 4.5%(+4.69)#32 | 4.9%(+4.27)#2,137 |
| 33. | 85023 | 9.2% | 4.5%(+4.68)#33 | 4.9%(+4.26)#2,151 |
| 34. | 86508 | 9.1% | 4.5%(+4.62)#34 | 4.9%(+4.20)#2,197 |
| 35. | 85281 | 8.8% | 4.5%(+4.37)#35 | 4.9%(+3.95)#2,339 |
| 36. | 85708 | 8.7% | 4.5%(+4.23)#36 | 4.9%(+3.82)#2,416 |
| 37. | 85054 | 8.5% | 4.5%(+3.99)#37 | 4.9%(+3.57)#2,564 |
| 38. | 85346 | 8.3% | 4.5%(+3.79)#38 | 4.9%(+3.38)#2,694 |
| 39. | 85224 | 8.1% | 4.5%(+3.67)#39 | 4.9%(+3.25)#2,791 |
| 40. | 85757 | 8.0% | 4.5%(+3.56)#40 | 4.9%(+3.14)#2,876 |
| 41. | 85226 | 7.9% | 4.5%(+3.41)#41 | 4.9%(+2.99)#2,990 |
| 42. | 85320 | 7.5% | 4.5%(+3.00)#42 | 4.9%(+2.58)#3,363 |
| 43. | 85613 | 7.1% | 4.5%(+2.67)#43 | 4.9%(+2.25)#3,683 |
| 44. | 85138 | 7.1% | 4.5%(+2.59)#44 | 4.9%(+2.17)#3,757 |
| 45. | 85284 | 7.0% | 4.5%(+2.52)#45 | 4.9%(+2.10)#3,840 |
| 46. | 85303 | 6.9% | 4.5%(+2.47)#46 | 4.9%(+2.05)#3,899 |
| 47. | 85630 | 6.8% | 4.5%(+2.31)#47 | 4.9%(+1.89)#4,092 |
| 48. | 85611 | 6.8% | 4.5%(+2.29)#48 | 4.9%(+1.87)#4,117 |
| 49. | 86504 | 6.8% | 4.5%(+2.28)#49 | 4.9%(+1.86)#4,128 |
| 50. | 86434 | 6.8% | 4.5%(+2.28)#50 | 4.9%(+1.86)#4,130 |
| 51. | 86331 | 6.7% | 4.5%(+2.27)#51 | 4.9%(+1.85)#4,151 |
| 52. | 85295 | 6.7% | 4.5%(+2.26)#52 | 4.9%(+1.84)#4,160 |
| 53. | 85260 | 6.7% | 4.5%(+2.19)#53 | 4.9%(+1.77)#4,262 |
| 54. | 85705 | 6.7% | 4.5%(+2.18)#54 | 4.9%(+1.76)#4,267 |
| 55. | 86046 | 6.5% | 4.5%(+2.03)#55 | 4.9%(+1.61)#4,462 |
| 56. | 85756 | 6.4% | 4.5%(+1.95)#56 | 4.9%(+1.53)#4,559 |
| 57. | 85938 | 6.4% | 4.5%(+1.94)#57 | 4.9%(+1.52)#4,586 |
| 58. | 85296 | 6.4% | 4.5%(+1.93)#58 | 4.9%(+1.51)#4,597 |
| 59. | 85602 | 6.3% | 4.5%(+1.85)#59 | 4.9%(+1.43)#4,722 |
| 60. | 85210 | 6.3% | 4.5%(+1.82)#60 | 4.9%(+1.41)#4,774 |
| 61. | 85378 | 6.3% | 4.5%(+1.79)#61 | 4.9%(+1.38)#4,822 |
| 62. | 85050 | 6.2% | 4.5%(+1.73)#62 | 4.9%(+1.31)#4,942 |
| 63. | 85040 | 6.1% | 4.5%(+1.66)#63 | 4.9%(+1.25)#5,048 |
| 64. | 85712 | 6.1% | 4.5%(+1.59)#64 | 4.9%(+1.18)#5,179 |
| 65. | 85392 | 6.0% | 4.5%(+1.53)#65 | 4.9%(+1.11)#5,288 |
| 66. | 85331 | 6.0% | 4.5%(+1.53)#66 | 4.9%(+1.11)#5,291 |
| 67. | 85617 | 6.0% | 4.5%(+1.53)#67 | 4.9%(+1.11)#5,301 |
| 68. | 85282 | 6.0% | 4.5%(+1.49)#68 | 4.9%(+1.07)#5,353 |
| 69. | 85259 | 5.9% | 4.5%(+1.45)#69 | 4.9%(+1.03)#5,419 |
| 70. | 85383 | 5.9% | 4.5%(+1.45)#70 | 4.9%(+1.03)#5,431 |
| 71. | 85009 | 5.9% | 4.5%(+1.43)#71 | 4.9%(+1.01)#5,477 |
| 72. | 85083 | 5.9% | 4.5%(+1.41)#72 | 4.9%(+0.988)#5,517 |
| 73. | 85730 | 5.8% | 4.5%(+1.35)#73 | 4.9%(+0.926)#5,640 |
| 74. | 85355 | 5.8% | 4.5%(+1.28)#74 | 4.9%(+0.859)#5,770 |
| 75. | 85254 | 5.7% | 4.5%(+1.22)#75 | 4.9%(+0.798)#5,885 |
| 76. | 85037 | 5.7% | 4.5%(+1.19)#76 | 4.9%(+0.776)#5,938 |
| 77. | 86409 | 5.6% | 4.5%(+1.17)#77 | 4.9%(+0.750)#5,991 |
| 78. | 86301 | 5.6% | 4.5%(+1.15)#78 | 4.9%(+0.733)#6,015 |
| 79. | 85539 | 5.6% | 4.5%(+1.14)#79 | 4.9%(+0.721)#6,036 |
| 80. | 85297 | 5.6% | 4.5%(+1.12)#80 | 4.9%(+0.705)#6,065 |
| 81. | 85205 | 5.6% | 4.5%(+1.08)#81 | 4.9%(+0.663)#6,169 |
| 82. | 85207 | 5.5% | 4.5%(+1.01)#82 | 4.9%(+0.595)#6,320 |
| 83. | 85140 | 5.5% | 4.5%(+1.01)#83 | 4.9%(+0.592)#6,328 |
| 84. | 85310 | 5.4% | 4.5%(+0.955)#84 | 4.9%(+0.536)#6,443 |
| 85. | 85139 | 5.4% | 4.5%(+0.938)#85 | 4.9%(+0.519)#6,481 |
| 86. | 85286 | 5.4% | 4.5%(+0.925)#86 | 4.9%(+0.506)#6,511 |
| 87. | 85053 | 5.4% | 4.5%(+0.898)#87 | 4.9%(+0.479)#6,571 |
| 88. | 85251 | 5.3% | 4.5%(+0.830)#88 | 4.9%(+0.411)#6,741 |
| 89. | 85249 | 5.3% | 4.5%(+0.820)#89 | 4.9%(+0.401)#6,765 |
| 90. | 86413 | 5.3% | 4.5%(+0.806)#90 | 4.9%(+0.387)#6,806 |
| 91. | 86506 | 5.3% | 4.5%(+0.788)#91 | 4.9%(+0.369)#6,848 |
| 92. | 85382 | 5.3% | 4.5%(+0.777)#92 | 4.9%(+0.358)#6,879 |
| 93. | 85739 | 5.2% | 4.5%(+0.762)#93 | 4.9%(+0.343)#6,912 |
| 94. | 85225 | 5.2% | 4.5%(+0.739)#94 | 4.9%(+0.320)#6,958 |
| 95. | 85212 | 5.2% | 4.5%(+0.677)#95 | 4.9%(+0.258)#7,080 |
| 96. | 85704 | 5.1% | 4.5%(+0.614)#96 | 4.9%(+0.195)#7,236 |
| 97. | 85353 | 5.1% | 4.5%(+0.579)#97 | 4.9%(+0.160)#7,322 |
| 98. | 85735 | 5.1% | 4.5%(+0.578)#98 | 4.9%(+0.159)#7,324 |
| 99. | 85042 | 5.0% | 4.5%(+0.565)#99 | 4.9%(+0.146)#7,358 |
| 100. | 85298 | 5.0% | 4.5%(+0.546)#100 | 4.9%(+0.127)#7,399 |
Common Questions
What are the Top 10 Zip Codes with the Highest Percentage of Population with a Degree in Computers and Mathematics in Arizona?
Top 10 Zip Codes with the Highest Percentage of Population with a Degree in Computers and Mathematics in Arizona are:
What zip code has the Highest Percentage of Population with a Degree in Computers and Mathematics in Arizona?
85922 has the Highest Percentage of Population with a Degree in Computers and Mathematics in Arizona with 79.6%.
What is the Percentage of Population with a Degree in Computers and Mathematics in the State of Arizona?
Percentage of Population with a Degree in Computers and Mathematics in Arizona is 4.5%.
What is the Percentage of Population with a Degree in Computers and Mathematics in the United States?
Percentage of Population with a Degree in Computers and Mathematics in the United States is 4.9%.