Zip Codes with the Highest Percentage of Population with a Degree in Arts and Humanities in New Jersey
RELATED REPORTS & OPTIONS
Arts and Humanities
New Jersey
Compare Zip Codes
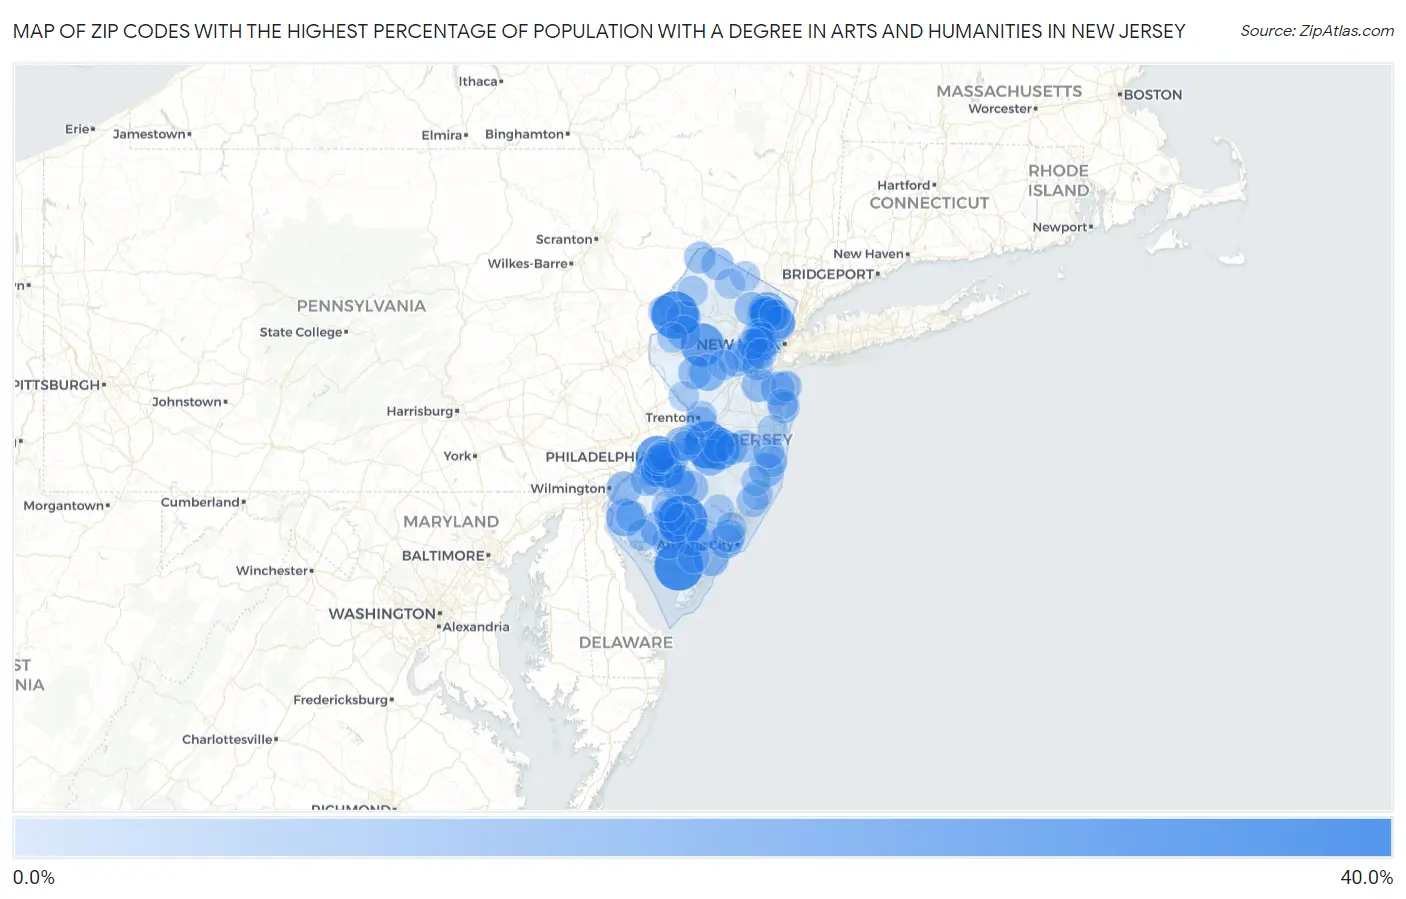
Map of Zip Codes with the Highest Percentage of Population with a Degree in Arts and Humanities in New Jersey
0.0%
40.0%
Zip Codes with the Highest Percentage of Population with a Degree in Arts and Humanities in New Jersey
| Zip Code | % Graduates | vs State | vs National | |
| 1. | 08310 | 33.3% | 4.7%(+28.6)#1 | 6.0%(+27.3)#511 |
| 2. | 08314 | 32.2% | 4.7%(+27.5)#2 | 6.0%(+26.2)#572 |
| 3. | 07844 | 30.4% | 4.7%(+25.7)#3 | 6.0%(+24.4)#643 |
| 4. | 08041 | 29.8% | 4.7%(+25.1)#4 | 6.0%(+23.8)#668 |
| 5. | 08102 | 25.1% | 4.7%(+20.4)#5 | 6.0%(+19.1)#940 |
| 6. | 07979 | 24.9% | 4.7%(+20.2)#6 | 6.0%(+18.9)#985 |
| 7. | 08640 | 23.5% | 4.7%(+18.8)#7 | 6.0%(+17.5)#1,070 |
| 8. | 08059 | 19.7% | 4.7%(+14.9)#8 | 6.0%(+13.7)#1,545 |
| 9. | 07524 | 18.4% | 4.7%(+13.7)#9 | 6.0%(+12.4)#1,743 |
| 10. | 08072 | 17.8% | 4.7%(+13.1)#10 | 6.0%(+11.8)#1,890 |
| 11. | 07513 | 16.6% | 4.7%(+11.9)#11 | 6.0%(+10.7)#2,183 |
| 12. | 08821 | 16.3% | 4.7%(+11.5)#12 | 6.0%(+10.3)#2,278 |
| 13. | 08068 | 15.6% | 4.7%(+10.9)#13 | 6.0%(+9.60)#2,459 |
| 14. | 07108 | 15.6% | 4.7%(+10.9)#14 | 6.0%(+9.59)#2,462 |
| 15. | 07501 | 15.3% | 4.7%(+10.6)#15 | 6.0%(+9.29)#2,565 |
| 16. | 07606 | 14.3% | 4.7%(+9.56)#16 | 6.0%(+8.29)#2,967 |
| 17. | 08341 | 14.1% | 4.7%(+9.33)#17 | 6.0%(+8.06)#3,104 |
| 18. | 08223 | 14.0% | 4.7%(+9.25)#18 | 6.0%(+7.98)#3,142 |
| 19. | 08352 | 13.8% | 4.7%(+9.07)#19 | 6.0%(+7.80)#3,225 |
| 20. | 08067 | 13.7% | 4.7%(+9.02)#20 | 6.0%(+7.74)#3,252 |
| 21. | 08734 | 13.4% | 4.7%(+8.71)#21 | 6.0%(+7.44)#3,393 |
| 22. | 08317 | 13.4% | 4.7%(+8.71)#22 | 6.0%(+7.44)#3,397 |
| 23. | 08232 | 13.2% | 4.7%(+8.45)#23 | 6.0%(+7.18)#3,531 |
| 24. | 07721 | 13.1% | 4.7%(+8.41)#24 | 6.0%(+7.13)#3,563 |
| 25. | 07737 | 13.0% | 4.7%(+8.30)#25 | 6.0%(+7.03)#3,629 |
| 26. | 07838 | 13.0% | 4.7%(+8.24)#26 | 6.0%(+6.97)#3,663 |
| 27. | 08009 | 12.8% | 4.7%(+8.09)#27 | 6.0%(+6.82)#3,764 |
| 28. | 07865 | 12.7% | 4.7%(+7.99)#28 | 6.0%(+6.72)#3,826 |
| 29. | 08045 | 12.6% | 4.7%(+7.90)#29 | 6.0%(+6.62)#3,880 |
| 30. | 08004 | 12.3% | 4.7%(+7.57)#30 | 6.0%(+6.30)#4,111 |
| 31. | 07063 | 12.1% | 4.7%(+7.41)#31 | 6.0%(+6.14)#4,215 |
| 32. | 08010 | 12.1% | 4.7%(+7.37)#32 | 6.0%(+6.09)#4,255 |
| 33. | 08887 | 12.0% | 4.7%(+7.29)#33 | 6.0%(+6.02)#4,297 |
| 34. | 07440 | 12.0% | 4.7%(+7.28)#34 | 6.0%(+6.01)#4,303 |
| 35. | 07017 | 11.7% | 4.7%(+6.98)#35 | 6.0%(+5.71)#4,533 |
| 36. | 08063 | 11.7% | 4.7%(+6.94)#36 | 6.0%(+5.67)#4,566 |
| 37. | 08201 | 11.6% | 4.7%(+6.83)#37 | 6.0%(+5.56)#4,643 |
| 38. | 08332 | 11.6% | 4.7%(+6.83)#38 | 6.0%(+5.56)#4,645 |
| 39. | 07522 | 11.5% | 4.7%(+6.76)#39 | 6.0%(+5.49)#4,705 |
| 40. | 08083 | 11.4% | 4.7%(+6.66)#40 | 6.0%(+5.39)#4,790 |
| 41. | 08052 | 11.4% | 4.7%(+6.64)#41 | 6.0%(+5.37)#4,804 |
| 42. | 08733 | 11.3% | 4.7%(+6.56)#42 | 6.0%(+5.29)#4,886 |
| 43. | 07608 | 11.1% | 4.7%(+6.39)#43 | 6.0%(+5.12)#5,064 |
| 44. | 08360 | 11.1% | 4.7%(+6.37)#44 | 6.0%(+5.10)#5,074 |
| 45. | 07505 | 10.9% | 4.7%(+6.21)#45 | 6.0%(+4.94)#5,192 |
| 46. | 08344 | 10.9% | 4.7%(+6.20)#46 | 6.0%(+4.93)#5,202 |
| 47. | 07461 | 10.8% | 4.7%(+6.05)#47 | 6.0%(+4.78)#5,336 |
| 48. | 08326 | 10.5% | 4.7%(+5.80)#48 | 6.0%(+4.53)#5,605 |
| 49. | 08330 | 10.5% | 4.7%(+5.76)#49 | 6.0%(+4.49)#5,659 |
| 50. | 08533 | 10.5% | 4.7%(+5.74)#50 | 6.0%(+4.47)#5,679 |
| 51. | 08740 | 10.2% | 4.7%(+5.45)#51 | 6.0%(+4.18)#6,019 |
| 52. | 08641 | 10.1% | 4.7%(+5.42)#52 | 6.0%(+4.15)#6,062 |
| 53. | 07112 | 10.0% | 4.7%(+5.25)#53 | 6.0%(+3.98)#6,297 |
| 54. | 07827 | 10.0% | 4.7%(+5.24)#54 | 6.0%(+3.97)#6,305 |
| 55. | 08270 | 9.9% | 4.7%(+5.20)#55 | 6.0%(+3.93)#6,352 |
| 56. | 07050 | 9.9% | 4.7%(+5.19)#56 | 6.0%(+3.92)#6,369 |
| 57. | 08092 | 9.8% | 4.7%(+5.10)#57 | 6.0%(+3.83)#6,485 |
| 58. | 08302 | 9.8% | 4.7%(+5.09)#58 | 6.0%(+3.82)#6,507 |
| 59. | 07764 | 9.8% | 4.7%(+5.06)#59 | 6.0%(+3.79)#6,539 |
| 60. | 08090 | 9.8% | 4.7%(+5.06)#60 | 6.0%(+3.79)#6,540 |
| 61. | 07663 | 9.7% | 4.7%(+4.99)#61 | 6.0%(+3.72)#6,634 |
| 62. | 08020 | 9.7% | 4.7%(+4.99)#62 | 6.0%(+3.72)#6,637 |
| 63. | 08093 | 9.7% | 4.7%(+4.97)#63 | 6.0%(+3.70)#6,655 |
| 64. | 07033 | 9.7% | 4.7%(+4.96)#64 | 6.0%(+3.69)#6,671 |
| 65. | 07066 | 9.4% | 4.7%(+4.72)#65 | 6.0%(+3.45)#7,016 |
| 66. | 08001 | 9.4% | 4.7%(+4.67)#66 | 6.0%(+3.40)#7,090 |
| 67. | 08049 | 9.3% | 4.7%(+4.61)#67 | 6.0%(+3.34)#7,197 |
| 68. | 08322 | 9.3% | 4.7%(+4.60)#68 | 6.0%(+3.33)#7,202 |
| 69. | 08753 | 9.3% | 4.7%(+4.55)#69 | 6.0%(+3.28)#7,278 |
| 70. | 07062 | 9.2% | 4.7%(+4.47)#70 | 6.0%(+3.20)#7,421 |
| 71. | 07832 | 9.2% | 4.7%(+4.43)#71 | 6.0%(+3.16)#7,476 |
| 72. | 07111 | 9.1% | 4.7%(+4.36)#72 | 6.0%(+3.08)#7,628 |
| 73. | 07203 | 9.1% | 4.7%(+4.33)#73 | 6.0%(+3.06)#7,671 |
| 74. | 07064 | 9.0% | 4.7%(+4.30)#74 | 6.0%(+3.03)#7,710 |
| 75. | 08611 | 8.9% | 4.7%(+4.20)#75 | 6.0%(+2.93)#7,866 |
| 76. | 07018 | 8.8% | 4.7%(+4.10)#76 | 6.0%(+2.83)#8,030 |
| 77. | 07732 | 8.8% | 4.7%(+4.10)#77 | 6.0%(+2.83)#8,031 |
| 78. | 08030 | 8.8% | 4.7%(+4.08)#78 | 6.0%(+2.80)#8,091 |
| 79. | 08609 | 8.6% | 4.7%(+3.87)#79 | 6.0%(+2.60)#8,444 |
| 80. | 07860 | 8.6% | 4.7%(+3.86)#80 | 6.0%(+2.58)#8,474 |
| 81. | 08016 | 8.6% | 4.7%(+3.85)#81 | 6.0%(+2.58)#8,484 |
| 82. | 07088 | 8.6% | 4.7%(+3.83)#82 | 6.0%(+2.56)#8,522 |
| 83. | 08215 | 8.5% | 4.7%(+3.82)#83 | 6.0%(+2.55)#8,542 |
| 84. | 08109 | 8.5% | 4.7%(+3.77)#84 | 6.0%(+2.50)#8,641 |
| 85. | 07202 | 8.4% | 4.7%(+3.70)#85 | 6.0%(+2.43)#8,772 |
| 86. | 08110 | 8.4% | 4.7%(+3.68)#86 | 6.0%(+2.40)#8,818 |
| 87. | 08205 | 8.3% | 4.7%(+3.63)#87 | 6.0%(+2.35)#8,902 |
| 88. | 07757 | 8.2% | 4.7%(+3.52)#88 | 6.0%(+2.25)#9,143 |
| 89. | 08103 | 8.2% | 4.7%(+3.50)#89 | 6.0%(+2.23)#9,182 |
| 90. | 08050 | 8.2% | 4.7%(+3.50)#90 | 6.0%(+2.22)#9,186 |
| 91. | 08105 | 8.1% | 4.7%(+3.41)#91 | 6.0%(+2.14)#9,372 |
| 92. | 08046 | 8.1% | 4.7%(+3.39)#92 | 6.0%(+2.12)#9,402 |
| 93. | 08805 | 8.1% | 4.7%(+3.38)#93 | 6.0%(+2.11)#9,421 |
| 94. | 07460 | 8.1% | 4.7%(+3.34)#94 | 6.0%(+2.07)#9,531 |
| 95. | 08091 | 8.0% | 4.7%(+3.26)#95 | 6.0%(+1.99)#9,697 |
| 96. | 08720 | 8.0% | 4.7%(+3.24)#96 | 6.0%(+1.97)#9,741 |
| 97. | 07421 | 8.0% | 4.7%(+3.24)#97 | 6.0%(+1.96)#9,760 |
| 98. | 07882 | 8.0% | 4.7%(+3.24)#98 | 6.0%(+1.96)#9,761 |
| 99. | 08530 | 7.9% | 4.7%(+3.22)#99 | 6.0%(+1.95)#9,788 |
| 100. | 08758 | 7.9% | 4.7%(+3.17)#100 | 6.0%(+1.89)#9,877 |
Common Questions
What are the Top 10 Zip Codes with the Highest Percentage of Population with a Degree in Arts and Humanities in New Jersey?
Top 10 Zip Codes with the Highest Percentage of Population with a Degree in Arts and Humanities in New Jersey are:
What zip code has the Highest Percentage of Population with a Degree in Arts and Humanities in New Jersey?
08310 has the Highest Percentage of Population with a Degree in Arts and Humanities in New Jersey with 33.3%.
What is the Percentage of Population with a Degree in Arts and Humanities in the State of New Jersey?
Percentage of Population with a Degree in Arts and Humanities in New Jersey is 4.7%.
What is the Percentage of Population with a Degree in Arts and Humanities in the United States?
Percentage of Population with a Degree in Arts and Humanities in the United States is 6.0%.