Zip Codes with the Highest Percentage of Population with a Degree in Arts and Humanities in Youngstown, OH
RELATED REPORTS & OPTIONS
Arts and Humanities
Youngstown
Compare Zip Codes
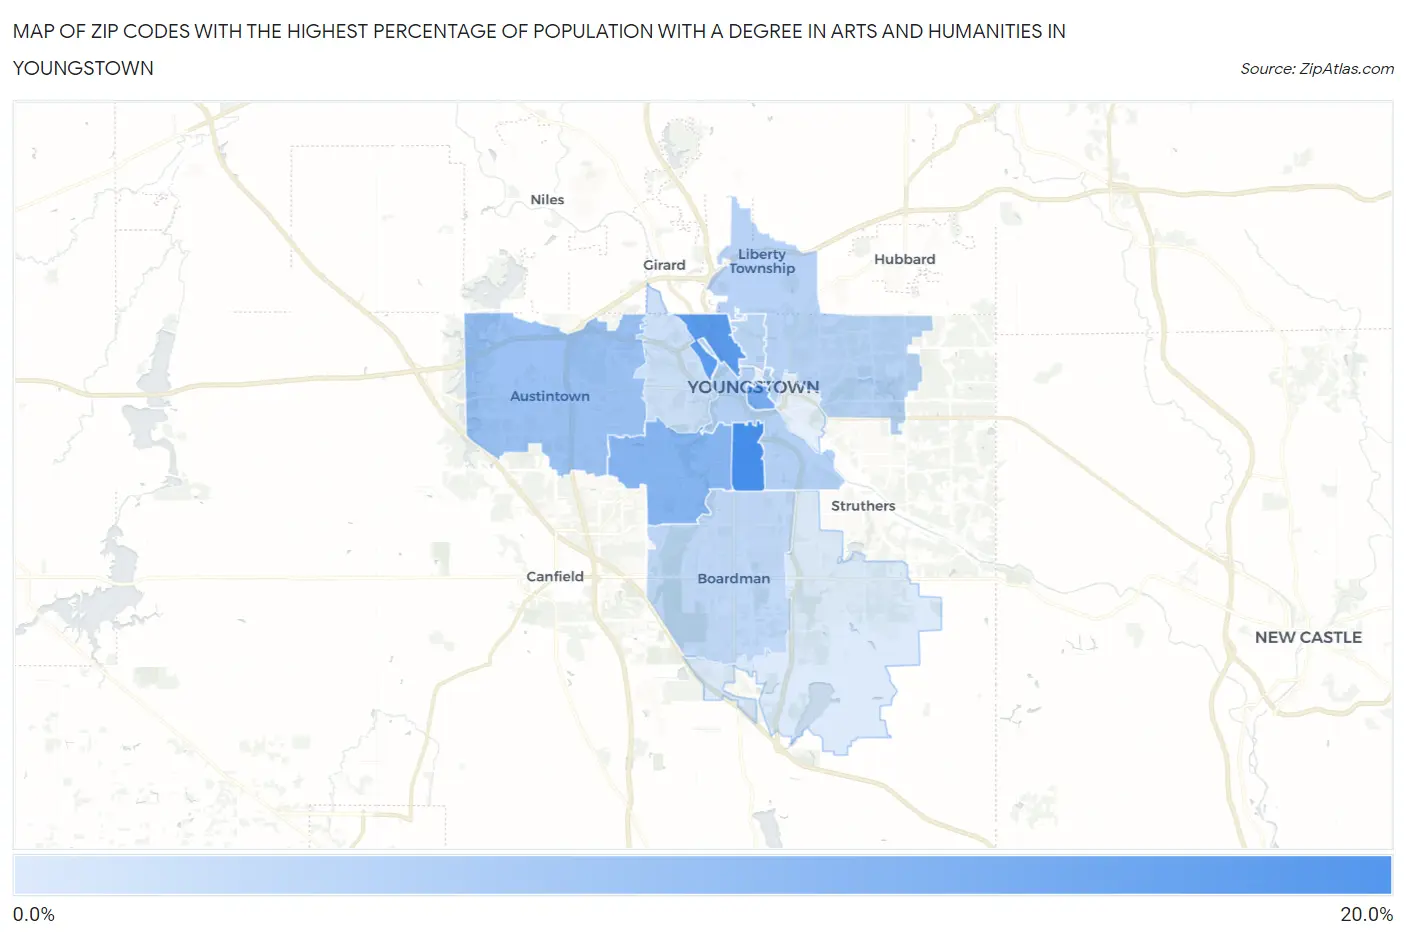
Map of Zip Codes with the Highest Percentage of Population with a Degree in Arts and Humanities in Youngstown
0.0%
20.0%
Zip Codes with the Highest Percentage of Population with a Degree in Arts and Humanities in Youngstown, OH
| Zip Code | % Graduates | vs State | vs National | |
| 1. | 44507 | 18.3% | 5.8%(+12.5)#62 | 6.0%(+12.3)#1,770 |
| 2. | 44510 | 16.7% | 5.8%(+10.9)#79 | 6.0%(+10.7)#2,145 |
| 3. | 44503 | 14.1% | 5.8%(+8.32)#117 | 6.0%(+8.11)#3,073 |
| 4. | 44511 | 12.4% | 5.8%(+6.63)#152 | 6.0%(+6.42)#4,031 |
| 5. | 44515 | 10.4% | 5.8%(+4.66)#195 | 6.0%(+4.45)#5,710 |
| 6. | 44502 | 8.4% | 5.8%(+2.62)#299 | 6.0%(+2.41)#8,793 |
| 7. | 44505 | 8.1% | 5.8%(+2.35)#319 | 6.0%(+2.14)#9,371 |
| 8. | 44504 | 7.7% | 5.8%(+1.93)#357 | 6.0%(+1.72)#10,234 |
| 9. | 44512 | 7.4% | 5.8%(+1.61)#378 | 6.0%(+1.40)#10,997 |
| 10. | 44509 | 6.3% | 5.8%(+0.480)#476 | 6.0%(+0.269)#13,878 |
| 11. | 44514 | 5.0% | 5.8%(-0.797)#633 | 6.0%(-1.01)#17,649 |
1
Common Questions
What are the Top 10 Zip Codes with the Highest Percentage of Population with a Degree in Arts and Humanities in Youngstown, OH?
Top 10 Zip Codes with the Highest Percentage of Population with a Degree in Arts and Humanities in Youngstown, OH are:
What zip code has the Highest Percentage of Population with a Degree in Arts and Humanities in Youngstown, OH?
44507 has the Highest Percentage of Population with a Degree in Arts and Humanities in Youngstown, OH with 18.3%.
What is the Percentage of Population with a Degree in Arts and Humanities in Youngstown, OH?
Percentage of Population with a Degree in Arts and Humanities in Youngstown is 10.2%.
What is the Percentage of Population with a Degree in Arts and Humanities in Ohio?
Percentage of Population with a Degree in Arts and Humanities in Ohio is 5.8%.
What is the Percentage of Population with a Degree in Arts and Humanities in the United States?
Percentage of Population with a Degree in Arts and Humanities in the United States is 6.0%.