Zip Codes with the Highest Percentage of Population with a Degree in Arts and Humanities in Alaska
RELATED REPORTS & OPTIONS
Arts and Humanities
Alaska
Compare Zip Codes
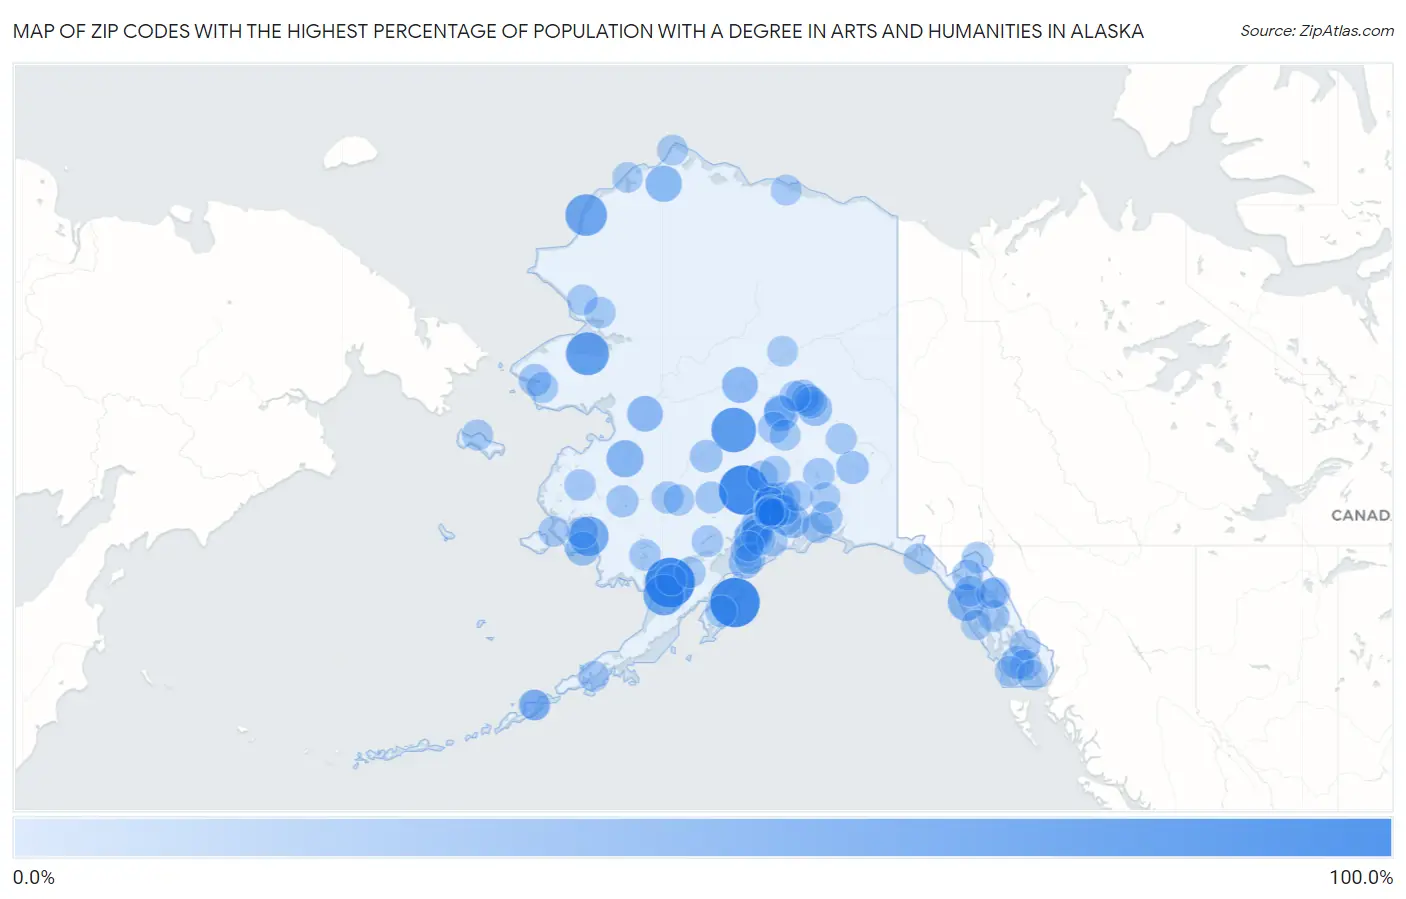
Map of Zip Codes with the Highest Percentage of Population with a Degree in Arts and Humanities in Alaska
0.0%
100.0%
Zip Codes with the Highest Percentage of Population with a Degree in Arts and Humanities in Alaska
| Zip Code | % Graduates | vs State | vs National | |
| 1. | 99667 | 100.0% | 7.7%(+92.3)#1 | 6.0%(+94.0)#58 |
| 2. | 99644 | 100.0% | 7.7%(+92.3)#2 | 6.0%(+94.0)#64 |
| 3. | 99670 | 100.0% | 7.7%(+92.3)#3 | 6.0%(+94.0)#74 |
| 4. | 99757 | 75.0% | 7.7%(+67.3)#4 | 6.0%(+69.0)#111 |
| 5. | 99736 | 66.7% | 7.7%(+59.0)#5 | 6.0%(+60.7)#132 |
| 6. | 99759 | 60.0% | 7.7%(+52.3)#6 | 6.0%(+54.0)#160 |
| 7. | 99579 | 55.6% | 7.7%(+47.9)#7 | 6.0%(+49.6)#180 |
| 8. | 99680 | 50.0% | 7.7%(+42.3)#8 | 6.0%(+44.0)#201 |
| 9. | 99590 | 37.5% | 7.7%(+29.8)#9 | 6.0%(+31.5)#410 |
| 10. | 99832 | 35.7% | 7.7%(+28.0)#10 | 6.0%(+29.7)#456 |
| 11. | 99791 | 33.3% | 7.7%(+25.7)#11 | 6.0%(+27.3)#532 |
| 12. | 99777 | 31.6% | 7.7%(+23.9)#12 | 6.0%(+25.6)#597 |
| 13. | 99748 | 30.0% | 7.7%(+22.3)#13 | 6.0%(+24.0)#662 |
| 14. | 99744 | 25.0% | 7.7%(+17.3)#14 | 6.0%(+19.0)#977 |
| 15. | 99714 | 23.8% | 7.7%(+16.1)#15 | 6.0%(+17.8)#1,045 |
| 16. | 99610 | 22.4% | 7.7%(+14.8)#16 | 6.0%(+16.4)#1,172 |
| 17. | 99693 | 22.2% | 7.7%(+14.5)#17 | 6.0%(+16.2)#1,197 |
| 18. | 99622 | 20.0% | 7.7%(+12.3)#18 | 6.0%(+14.0)#1,486 |
| 19. | 99703 | 18.5% | 7.7%(+10.8)#19 | 6.0%(+12.5)#1,734 |
| 20. | 99919 | 17.7% | 7.7%(+10.0)#20 | 6.0%(+11.7)#1,916 |
| 21. | 99586 | 16.9% | 7.7%(+9.18)#21 | 6.0%(+10.9)#2,110 |
| 22. | 99663 | 15.7% | 7.7%(+8.05)#22 | 6.0%(+9.73)#2,413 |
| 23. | 99627 | 15.2% | 7.7%(+7.47)#23 | 6.0%(+9.16)#2,624 |
| 24. | 99705 | 14.1% | 7.7%(+6.39)#24 | 6.0%(+8.08)#3,093 |
| 25. | 99702 | 13.4% | 7.7%(+5.75)#25 | 6.0%(+7.43)#3,400 |
| 26. | 99785 | 13.3% | 7.7%(+5.66)#26 | 6.0%(+7.34)#3,447 |
| 27. | 99686 | 13.1% | 7.7%(+5.41)#27 | 6.0%(+7.09)#3,589 |
| 28. | 99506 | 13.0% | 7.7%(+5.37)#28 | 6.0%(+7.05)#3,609 |
| 29. | 99607 | 12.5% | 7.7%(+4.82)#29 | 6.0%(+6.50)#3,987 |
| 30. | 99668 | 12.5% | 7.7%(+4.82)#30 | 6.0%(+6.50)#3,995 |
| 31. | 99611 | 11.8% | 7.7%(+4.10)#31 | 6.0%(+5.78)#4,464 |
| 32. | 99760 | 11.8% | 7.7%(+4.09)#32 | 6.0%(+5.77)#4,485 |
| 33. | 99505 | 11.7% | 7.7%(+4.00)#33 | 6.0%(+5.68)#4,558 |
| 34. | 99615 | 11.5% | 7.7%(+3.82)#34 | 6.0%(+5.50)#4,689 |
| 35. | 99503 | 11.3% | 7.7%(+3.66)#35 | 6.0%(+5.34)#4,845 |
| 36. | 99559 | 11.2% | 7.7%(+3.51)#36 | 6.0%(+5.19)#4,963 |
| 37. | 99652 | 11.1% | 7.7%(+3.43)#37 | 6.0%(+5.12)#5,014 |
| 38. | 99820 | 10.7% | 7.7%(+3.04)#38 | 6.0%(+4.72)#5,405 |
| 39. | 99653 | 10.5% | 7.7%(+2.85)#39 | 6.0%(+4.53)#5,620 |
| 40. | 99743 | 10.3% | 7.7%(+2.63)#40 | 6.0%(+4.31)#5,863 |
| 41. | 99576 | 10.0% | 7.7%(+2.35)#41 | 6.0%(+4.03)#6,194 |
| 42. | 99654 | 9.6% | 7.7%(+1.92)#42 | 6.0%(+3.60)#6,786 |
| 43. | 99508 | 9.6% | 7.7%(+1.90)#43 | 6.0%(+3.58)#6,814 |
| 44. | 99658 | 9.5% | 7.7%(+1.85)#44 | 6.0%(+3.53)#6,891 |
| 45. | 99645 | 9.5% | 7.7%(+1.84)#45 | 6.0%(+3.53)#6,913 |
| 46. | 99672 | 9.4% | 7.7%(+1.76)#46 | 6.0%(+3.45)#7,021 |
| 47. | 99504 | 9.4% | 7.7%(+1.76)#47 | 6.0%(+3.44)#7,039 |
| 48. | 99588 | 9.2% | 7.7%(+1.57)#48 | 6.0%(+3.25)#7,327 |
| 49. | 99556 | 8.9% | 7.7%(+1.21)#49 | 6.0%(+2.89)#7,937 |
| 50. | 99840 | 8.8% | 7.7%(+1.14)#50 | 6.0%(+2.82)#8,061 |
| 51. | 99752 | 8.8% | 7.7%(+1.13)#51 | 6.0%(+2.81)#8,072 |
| 52. | 99557 | 8.5% | 7.7%(+0.834)#52 | 6.0%(+2.52)#8,614 |
| 53. | 99694 | 8.4% | 7.7%(+0.706)#53 | 6.0%(+2.39)#8,842 |
| 54. | 99669 | 8.3% | 7.7%(+0.661)#54 | 6.0%(+2.34)#8,922 |
| 55. | 99683 | 8.3% | 7.7%(+0.656)#55 | 6.0%(+2.34)#8,964 |
| 56. | 99762 | 8.1% | 7.7%(+0.383)#56 | 6.0%(+2.06)#9,536 |
| 57. | 99577 | 7.9% | 7.7%(+0.257)#57 | 6.0%(+1.94)#9,801 |
| 58. | 99574 | 7.9% | 7.7%(+0.195)#58 | 6.0%(+1.88)#9,918 |
| 59. | 99603 | 7.9% | 7.7%(+0.194)#59 | 6.0%(+1.88)#9,921 |
| 60. | 99623 | 7.7% | 7.7%(+0.072)#60 | 6.0%(+1.75)#10,169 |
| 61. | 99518 | 7.7% | 7.7%(+0.060)#61 | 6.0%(+1.74)#10,192 |
| 62. | 99613 | 7.7% | 7.7%(+0.015)#62 | 6.0%(+1.70)#10,310 |
| 63. | 99755 | 7.6% | 7.7%(-0.063)#63 | 6.0%(+1.62)#10,458 |
| 64. | 99501 | 7.6% | 7.7%(-0.083)#64 | 6.0%(+1.60)#10,498 |
| 65. | 99633 | 7.5% | 7.7%(-0.150)#65 | 6.0%(+1.53)#10,658 |
| 66. | 99737 | 7.2% | 7.7%(-0.436)#66 | 6.0%(+1.25)#11,366 |
| 67. | 99515 | 7.2% | 7.7%(-0.451)#67 | 6.0%(+1.23)#11,401 |
| 68. | 99516 | 7.2% | 7.7%(-0.455)#68 | 6.0%(+1.23)#11,411 |
| 69. | 99769 | 7.1% | 7.7%(-0.534)#69 | 6.0%(+1.15)#11,597 |
| 70. | 99761 | 7.1% | 7.7%(-0.534)#70 | 6.0%(+1.15)#11,610 |
| 71. | 99827 | 7.1% | 7.7%(-0.601)#71 | 6.0%(+1.08)#11,772 |
| 72. | 99587 | 7.0% | 7.7%(-0.694)#72 | 6.0%(+0.988)#12,007 |
| 73. | 99567 | 6.9% | 7.7%(-0.771)#73 | 6.0%(+0.910)#12,199 |
| 74. | 99692 | 6.7% | 7.7%(-1.01)#74 | 6.0%(+0.671)#12,831 |
| 75. | 99676 | 6.6% | 7.7%(-1.08)#75 | 6.0%(+0.603)#13,008 |
| 76. | 99929 | 6.6% | 7.7%(-1.09)#76 | 6.0%(+0.587)#13,039 |
| 77. | 99901 | 6.5% | 7.7%(-1.21)#77 | 6.0%(+0.468)#13,362 |
| 78. | 99709 | 6.4% | 7.7%(-1.28)#78 | 6.0%(+0.399)#13,543 |
| 79. | 99734 | 6.4% | 7.7%(-1.30)#79 | 6.0%(+0.377)#13,605 |
| 80. | 99826 | 6.4% | 7.7%(-1.31)#80 | 6.0%(+0.371)#13,616 |
| 81. | 99723 | 6.2% | 7.7%(-1.44)#81 | 6.0%(+0.240)#13,993 |
| 82. | 99507 | 6.2% | 7.7%(-1.51)#82 | 6.0%(+0.175)#14,181 |
| 83. | 99689 | 6.1% | 7.7%(-1.55)#83 | 6.0%(+0.127)#14,333 |
| 84. | 99637 | 6.0% | 7.7%(-1.68)#84 | 6.0%(+0.004)#14,673 |
| 85. | 99612 | 5.9% | 7.7%(-1.79)#85 | 6.0%(-0.113)#15,007 |
| 86. | 99568 | 5.6% | 7.7%(-2.06)#86 | 6.0%(-0.378)#15,788 |
| 87. | 99502 | 5.5% | 7.7%(-2.13)#87 | 6.0%(-0.449)#16,004 |
| 88. | 99824 | 5.5% | 7.7%(-2.20)#88 | 6.0%(-0.514)#16,173 |
| 89. | 99685 | 5.4% | 7.7%(-2.26)#89 | 6.0%(-0.580)#16,362 |
| 90. | 99701 | 5.3% | 7.7%(-2.36)#90 | 6.0%(-0.681)#16,662 |
| 91. | 99674 | 5.3% | 7.7%(-2.39)#91 | 6.0%(-0.709)#16,762 |
| 92. | 99922 | 5.3% | 7.7%(-2.41)#92 | 6.0%(-0.732)#16,835 |
| 93. | 99801 | 5.0% | 7.7%(-2.67)#93 | 6.0%(-0.993)#17,573 |
| 94. | 99664 | 4.8% | 7.7%(-2.83)#94 | 6.0%(-1.15)#18,057 |
| 95. | 99573 | 4.8% | 7.7%(-2.85)#95 | 6.0%(-1.17)#18,114 |
| 96. | 99782 | 4.8% | 7.7%(-2.92)#96 | 6.0%(-1.23)#18,292 |
| 97. | 99639 | 4.7% | 7.7%(-3.00)#97 | 6.0%(-1.32)#18,535 |
| 98. | 99835 | 4.7% | 7.7%(-3.03)#98 | 6.0%(-1.34)#18,596 |
| 99. | 99926 | 4.6% | 7.7%(-3.05)#99 | 6.0%(-1.37)#18,670 |
| 100. | 99517 | 4.0% | 7.7%(-3.64)#100 | 6.0%(-1.96)#20,243 |
Common Questions
What are the Top 10 Zip Codes with the Highest Percentage of Population with a Degree in Arts and Humanities in Alaska?
Top 10 Zip Codes with the Highest Percentage of Population with a Degree in Arts and Humanities in Alaska are:
What zip code has the Highest Percentage of Population with a Degree in Arts and Humanities in Alaska?
99667 has the Highest Percentage of Population with a Degree in Arts and Humanities in Alaska with 100.0%.
What is the Percentage of Population with a Degree in Arts and Humanities in the State of Alaska?
Percentage of Population with a Degree in Arts and Humanities in Alaska is 7.7%.
What is the Percentage of Population with a Degree in Arts and Humanities in the United States?
Percentage of Population with a Degree in Arts and Humanities in the United States is 6.0%.