Zip Codes with the Highest Percentage of Population with a Degree in Arts and Humanities in Vermont
RELATED REPORTS & OPTIONS
Arts and Humanities
Vermont
Compare Zip Codes
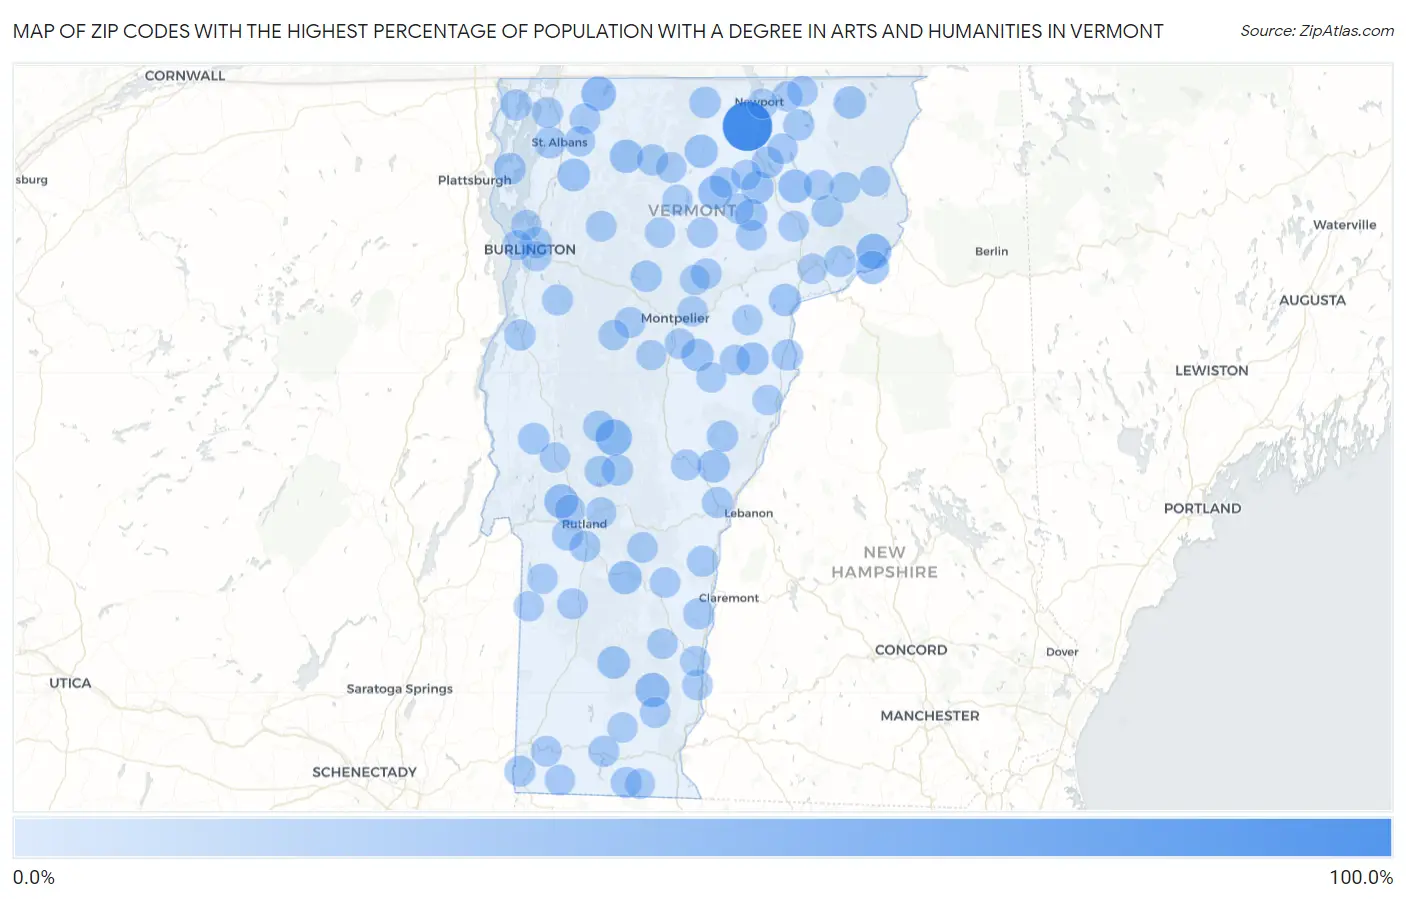
Map of Zip Codes with the Highest Percentage of Population with a Degree in Arts and Humanities in Vermont
0.0%
100.0%
Zip Codes with the Highest Percentage of Population with a Degree in Arts and Humanities in Vermont
| Zip Code | % Graduates | vs State | vs National | |
| 1. | 05825 | 100.0% | 5.9%(+94.1)#1 | 6.0%(+94.0)#75 |
| 2. | 05767 | 34.6% | 5.9%(+28.7)#2 | 6.0%(+28.6)#482 |
| 3. | 05906 | 28.6% | 5.9%(+22.7)#3 | 6.0%(+22.6)#720 |
| 4. | 05457 | 26.6% | 5.9%(+20.7)#4 | 6.0%(+20.6)#855 |
| 5. | 05353 | 25.0% | 5.9%(+19.0)#5 | 6.0%(+19.0)#983 |
| 6. | 05744 | 23.4% | 5.9%(+17.5)#6 | 6.0%(+17.4)#1,080 |
| 7. | 05826 | 22.4% | 5.9%(+16.5)#7 | 6.0%(+16.4)#1,173 |
| 8. | 05867 | 20.9% | 5.9%(+15.0)#8 | 6.0%(+14.9)#1,365 |
| 9. | 05441 | 20.4% | 5.9%(+14.5)#9 | 6.0%(+14.4)#1,433 |
| 10. | 05758 | 20.3% | 5.9%(+14.4)#10 | 6.0%(+14.3)#1,443 |
| 11. | 05847 | 20.0% | 5.9%(+14.1)#11 | 6.0%(+14.0)#1,477 |
| 12. | 05904 | 20.0% | 5.9%(+14.1)#12 | 6.0%(+14.0)#1,494 |
| 13. | 05839 | 17.1% | 5.9%(+11.2)#13 | 6.0%(+11.1)#2,053 |
| 14. | 05454 | 17.1% | 5.9%(+11.2)#14 | 6.0%(+11.1)#2,064 |
| 15. | 05076 | 17.0% | 5.9%(+11.1)#15 | 6.0%(+11.0)#2,069 |
| 16. | 05065 | 16.9% | 5.9%(+11.0)#16 | 6.0%(+10.9)#2,104 |
| 17. | 05654 | 16.7% | 5.9%(+10.8)#17 | 6.0%(+10.7)#2,153 |
| 18. | 05155 | 16.7% | 5.9%(+10.8)#18 | 6.0%(+10.7)#2,160 |
| 19. | 05907 | 16.0% | 5.9%(+10.1)#19 | 6.0%(+10.0)#2,348 |
| 20. | 05821 | 15.8% | 5.9%(+9.90)#20 | 6.0%(+9.81)#2,393 |
| 21. | 05842 | 13.1% | 5.9%(+7.20)#21 | 6.0%(+7.12)#3,578 |
| 22. | 05822 | 13.0% | 5.9%(+7.06)#22 | 6.0%(+6.97)#3,661 |
| 23. | 05778 | 12.5% | 5.9%(+6.59)#23 | 6.0%(+6.50)#3,957 |
| 24. | 05677 | 12.2% | 5.9%(+6.27)#24 | 6.0%(+6.18)#4,191 |
| 25. | 05478 | 12.2% | 5.9%(+6.26)#25 | 6.0%(+6.17)#4,199 |
| 26. | 05458 | 12.0% | 5.9%(+6.05)#26 | 6.0%(+5.96)#4,337 |
| 27. | 05859 | 11.9% | 5.9%(+5.95)#27 | 6.0%(+5.86)#4,415 |
| 28. | 05832 | 11.8% | 5.9%(+5.89)#28 | 6.0%(+5.81)#4,448 |
| 29. | 05824 | 11.4% | 5.9%(+5.44)#29 | 6.0%(+5.36)#4,820 |
| 30. | 05072 | 11.3% | 5.9%(+5.38)#30 | 6.0%(+5.29)#4,884 |
| 31. | 05748 | 10.6% | 5.9%(+4.71)#31 | 6.0%(+4.62)#5,513 |
| 32. | 05456 | 10.5% | 5.9%(+4.60)#32 | 6.0%(+4.52)#5,626 |
| 33. | 05762 | 10.4% | 5.9%(+4.54)#33 | 6.0%(+4.45)#5,706 |
| 34. | 05442 | 10.4% | 5.9%(+4.52)#34 | 6.0%(+4.44)#5,716 |
| 35. | 05440 | 10.4% | 5.9%(+4.48)#35 | 6.0%(+4.39)#5,755 |
| 36. | 05081 | 10.3% | 5.9%(+4.40)#36 | 6.0%(+4.31)#5,864 |
| 37. | 05156 | 10.2% | 5.9%(+4.31)#37 | 6.0%(+4.23)#5,959 |
| 38. | 05404 | 10.1% | 5.9%(+4.24)#38 | 6.0%(+4.15)#6,059 |
| 39. | 05777 | 9.8% | 5.9%(+3.89)#39 | 6.0%(+3.81)#6,524 |
| 40. | 05363 | 9.7% | 5.9%(+3.75)#40 | 6.0%(+3.66)#6,701 |
| 41. | 05089 | 9.6% | 5.9%(+3.69)#41 | 6.0%(+3.60)#6,787 |
| 42. | 05872 | 9.5% | 5.9%(+3.61)#42 | 6.0%(+3.53)#6,899 |
| 43. | 05260 | 9.5% | 5.9%(+3.61)#43 | 6.0%(+3.53)#6,907 |
| 44. | 05001 | 9.4% | 5.9%(+3.49)#44 | 6.0%(+3.40)#7,087 |
| 45. | 05342 | 9.3% | 5.9%(+3.37)#45 | 6.0%(+3.28)#7,276 |
| 46. | 05461 | 9.2% | 5.9%(+3.31)#46 | 6.0%(+3.23)#7,365 |
| 47. | 05759 | 9.1% | 5.9%(+3.18)#47 | 6.0%(+3.10)#7,563 |
| 48. | 05488 | 9.0% | 5.9%(+3.07)#48 | 6.0%(+2.99)#7,778 |
| 49. | 05737 | 8.9% | 5.9%(+2.95)#49 | 6.0%(+2.87)#7,966 |
| 50. | 05837 | 8.8% | 5.9%(+2.91)#50 | 6.0%(+2.83)#8,047 |
| 51. | 05836 | 8.7% | 5.9%(+2.78)#51 | 6.0%(+2.70)#8,262 |
| 52. | 05827 | 8.7% | 5.9%(+2.75)#52 | 6.0%(+2.67)#8,313 |
| 53. | 05068 | 8.6% | 5.9%(+2.70)#53 | 6.0%(+2.61)#8,421 |
| 54. | 05345 | 8.6% | 5.9%(+2.68)#54 | 6.0%(+2.60)#8,454 |
| 55. | 05483 | 8.6% | 5.9%(+2.64)#55 | 6.0%(+2.56)#8,520 |
| 56. | 05660 | 8.4% | 5.9%(+2.52)#56 | 6.0%(+2.44)#8,758 |
| 57. | 05851 | 8.4% | 5.9%(+2.45)#57 | 6.0%(+2.37)#8,873 |
| 58. | 05489 | 8.3% | 5.9%(+2.42)#58 | 6.0%(+2.34)#8,933 |
| 59. | 05739 | 8.3% | 5.9%(+2.39)#59 | 6.0%(+2.31)#9,034 |
| 60. | 05680 | 8.1% | 5.9%(+2.21)#60 | 6.0%(+2.12)#9,400 |
| 61. | 05641 | 7.8% | 5.9%(+1.93)#61 | 6.0%(+1.85)#9,957 |
| 62. | 05352 | 7.7% | 5.9%(+1.82)#62 | 6.0%(+1.73)#10,209 |
| 63. | 05905 | 7.7% | 5.9%(+1.75)#63 | 6.0%(+1.66)#10,376 |
| 64. | 05650 | 7.6% | 5.9%(+1.66)#64 | 6.0%(+1.58)#10,546 |
| 65. | 05655 | 7.5% | 5.9%(+1.63)#65 | 6.0%(+1.55)#10,613 |
| 66. | 05153 | 7.5% | 5.9%(+1.62)#66 | 6.0%(+1.53)#10,655 |
| 67. | 05652 | 7.5% | 5.9%(+1.62)#67 | 6.0%(+1.53)#10,656 |
| 68. | 05201 | 7.5% | 5.9%(+1.60)#68 | 6.0%(+1.52)#10,694 |
| 69. | 05158 | 7.4% | 5.9%(+1.53)#69 | 6.0%(+1.45)#10,860 |
| 70. | 05673 | 7.4% | 5.9%(+1.50)#70 | 6.0%(+1.42)#10,933 |
| 71. | 05143 | 7.4% | 5.9%(+1.50)#71 | 6.0%(+1.41)#10,935 |
| 72. | 05830 | 7.4% | 5.9%(+1.49)#72 | 6.0%(+1.40)#10,995 |
| 73. | 05829 | 7.3% | 5.9%(+1.42)#73 | 6.0%(+1.34)#11,134 |
| 74. | 05860 | 7.2% | 5.9%(+1.31)#74 | 6.0%(+1.23)#11,400 |
| 75. | 05774 | 7.2% | 5.9%(+1.30)#75 | 6.0%(+1.21)#11,450 |
| 76. | 05086 | 7.1% | 5.9%(+1.23)#76 | 6.0%(+1.15)#11,606 |
| 77. | 05046 | 7.1% | 5.9%(+1.19)#77 | 6.0%(+1.10)#11,725 |
| 78. | 05455 | 7.1% | 5.9%(+1.16)#78 | 6.0%(+1.08)#11,785 |
| 79. | 05056 | 7.0% | 5.9%(+1.12)#79 | 6.0%(+1.04)#11,858 |
| 80. | 05765 | 7.0% | 5.9%(+1.11)#80 | 6.0%(+1.03)#11,892 |
| 81. | 05701 | 6.9% | 5.9%(+1.01)#81 | 6.0%(+0.926)#12,165 |
| 82. | 05871 | 6.9% | 5.9%(+0.967)#82 | 6.0%(+0.883)#12,275 |
| 83. | 05446 | 6.8% | 5.9%(+0.850)#83 | 6.0%(+0.766)#12,590 |
| 84. | 05358 | 6.7% | 5.9%(+0.819)#84 | 6.0%(+0.735)#12,674 |
| 85. | 05101 | 6.7% | 5.9%(+0.814)#85 | 6.0%(+0.730)#12,691 |
| 86. | 05841 | 6.5% | 5.9%(+0.556)#86 | 6.0%(+0.472)#13,350 |
| 87. | 05661 | 6.4% | 5.9%(+0.533)#87 | 6.0%(+0.449)#13,420 |
| 88. | 05855 | 6.4% | 5.9%(+0.532)#88 | 6.0%(+0.448)#13,423 |
| 89. | 05775 | 6.3% | 5.9%(+0.438)#89 | 6.0%(+0.354)#13,665 |
| 90. | 05341 | 6.3% | 5.9%(+0.438)#90 | 6.0%(+0.354)#13,666 |
| 91. | 05403 | 6.3% | 5.9%(+0.352)#91 | 6.0%(+0.267)#13,887 |
| 92. | 05875 | 6.2% | 5.9%(+0.339)#92 | 6.0%(+0.254)#13,950 |
| 93. | 05675 | 6.2% | 5.9%(+0.274)#93 | 6.0%(+0.190)#14,139 |
| 94. | 05819 | 6.2% | 5.9%(+0.259)#94 | 6.0%(+0.175)#14,184 |
| 95. | 05648 | 6.2% | 5.9%(+0.258)#95 | 6.0%(+0.173)#14,187 |
| 96. | 05733 | 6.1% | 5.9%(+0.192)#96 | 6.0%(+0.108)#14,381 |
| 97. | 05651 | 6.1% | 5.9%(+0.189)#97 | 6.0%(+0.104)#14,395 |
| 98. | 05033 | 6.0% | 5.9%(+0.091)#98 | 6.0%(+0.007)#14,661 |
| 99. | 05663 | 6.0% | 5.9%(+0.049)#99 | 6.0%(-0.035)#14,777 |
| 100. | 05408 | 6.0% | 5.9%(+0.047)#100 | 6.0%(-0.037)#14,781 |
Common Questions
What are the Top 10 Zip Codes with the Highest Percentage of Population with a Degree in Arts and Humanities in Vermont?
Top 10 Zip Codes with the Highest Percentage of Population with a Degree in Arts and Humanities in Vermont are:
What zip code has the Highest Percentage of Population with a Degree in Arts and Humanities in Vermont?
05825 has the Highest Percentage of Population with a Degree in Arts and Humanities in Vermont with 100.0%.
What is the Percentage of Population with a Degree in Arts and Humanities in the State of Vermont?
Percentage of Population with a Degree in Arts and Humanities in Vermont is 5.9%.
What is the Percentage of Population with a Degree in Arts and Humanities in the United States?
Percentage of Population with a Degree in Arts and Humanities in the United States is 6.0%.