Grandin, ND
Grandin Map
Grandin Overview
148
TOTAL POPULATION
82
MALE POPULATION
66
FEMALE POPULATION
124.24
MALES / 100 FEMALES
80.49
FEMALES / 100 MALES
40.0
MEDIAN AGE
2.7
AVG FAMILY SIZE
2.2
AVG HOUSEHOLD SIZE
$38,247
PER CAPITA INCOME
$105,625
AVG FAMILY INCOME
$83,125
AVG HOUSEHOLD INCOME
50.0%
WAGE / INCOME GAP [ % ]
50.0¢/ $1
WAGE / INCOME GAP [ $ ]
0.31
INEQUALITY / GINI INDEX
86
LABOR FORCE [ PEOPLE ]
72.9%
PERCENT IN LABOR FORCE
2.3%
UNEMPLOYMENT RATE
Grandin Zip Codes
Grandin Area Codes
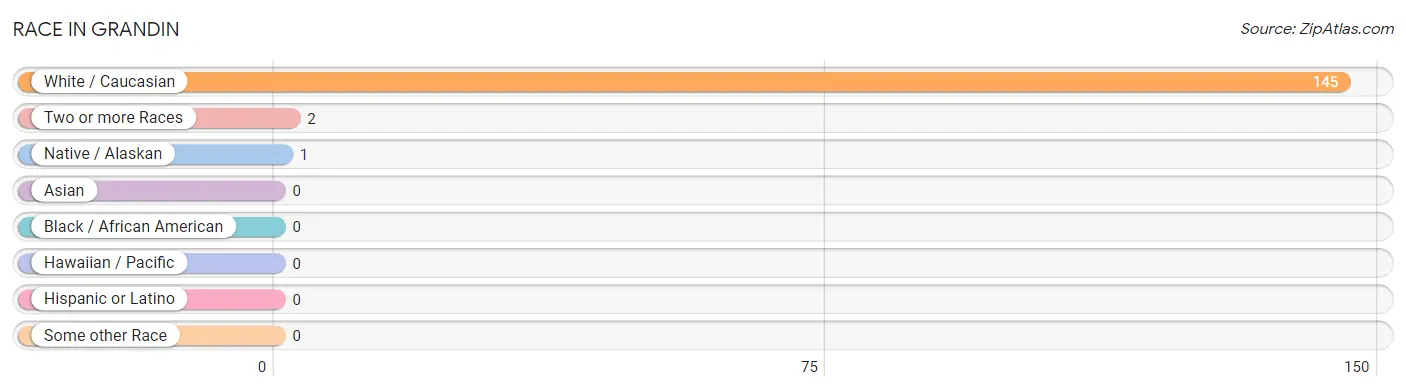
Race in Grandin
The most populous races in Grandin are White / Caucasian (145 | 98.0%), Two or more Races (2 | 1.3%), and Native / Alaskan (1 | 0.7%).
| Race | # Population | % Population |
| Asian | 0 | 0.0% |
| Black / African American | 0 | 0.0% |
| Hawaiian / Pacific | 0 | 0.0% |
| Hispanic or Latino | 0 | 0.0% |
| Native / Alaskan | 1 | 0.7% |
| White / Caucasian | 145 | 98.0% |
| Two or more Races | 2 | 1.3% |
| Some other Race | 0 | 0.0% |
| Total | 148 | 100.0% |
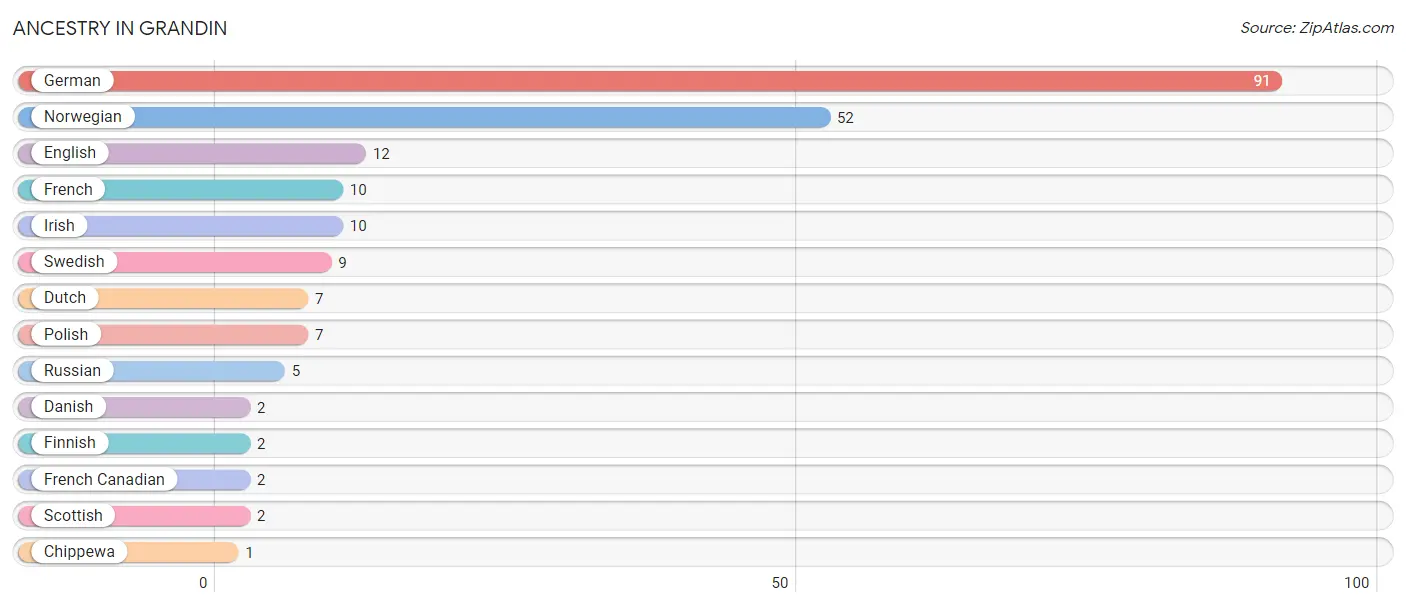
Ancestry in Grandin
The most populous ancestries reported in Grandin are German (91 | 61.5%), Norwegian (52 | 35.1%), English (12 | 8.1%), French (10 | 6.8%), and Irish (10 | 6.8%), together accounting for 118.3% of all Grandin residents.
| Ancestry | # Population | % Population |
| Chippewa | 1 | 0.7% |
| Danish | 2 | 1.3% |
| Dutch | 7 | 4.7% |
| English | 12 | 8.1% |
| Finnish | 2 | 1.3% |
| French | 10 | 6.8% |
| French Canadian | 2 | 1.3% |
| German | 91 | 61.5% |
| Irish | 10 | 6.8% |
| Norwegian | 52 | 35.1% |
| Polish | 7 | 4.7% |
| Russian | 5 | 3.4% |
| Scottish | 2 | 1.3% |
| Swedish | 9 | 6.1% | View All 14 Rows |
Immigrants in Grandin

| Immigration Origin | # Population | % Population | View All 0 Rows |
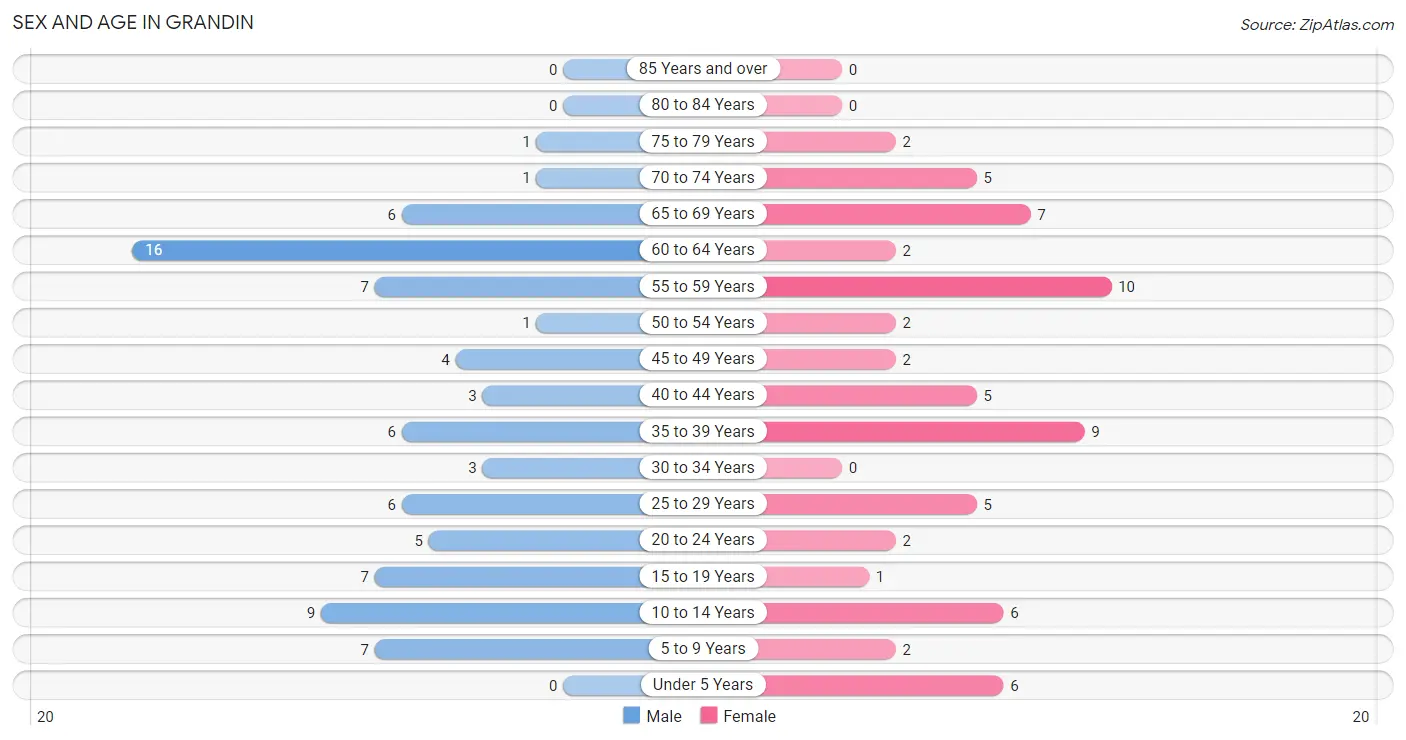
Sex and Age in Grandin
Sex and Age in Grandin
The most populous age groups in Grandin are 60 to 64 Years (16 | 19.5%) for men and 55 to 59 Years (10 | 15.1%) for women.
| Age Bracket | Male | Female |
| Under 5 Years | 0 (0.0%) | 6 (9.1%) |
| 5 to 9 Years | 7 (8.5%) | 2 (3.0%) |
| 10 to 14 Years | 9 (11.0%) | 6 (9.1%) |
| 15 to 19 Years | 7 (8.5%) | 1 (1.5%) |
| 20 to 24 Years | 5 (6.1%) | 2 (3.0%) |
| 25 to 29 Years | 6 (7.3%) | 5 (7.6%) |
| 30 to 34 Years | 3 (3.7%) | 0 (0.0%) |
| 35 to 39 Years | 6 (7.3%) | 9 (13.6%) |
| 40 to 44 Years | 3 (3.7%) | 5 (7.6%) |
| 45 to 49 Years | 4 (4.9%) | 2 (3.0%) |
| 50 to 54 Years | 1 (1.2%) | 2 (3.0%) |
| 55 to 59 Years | 7 (8.5%) | 10 (15.1%) |
| 60 to 64 Years | 16 (19.5%) | 2 (3.0%) |
| 65 to 69 Years | 6 (7.3%) | 7 (10.6%) |
| 70 to 74 Years | 1 (1.2%) | 5 (7.6%) |
| 75 to 79 Years | 1 (1.2%) | 2 (3.0%) |
| 80 to 84 Years | 0 (0.0%) | 0 (0.0%) |
| 85 Years and over | 0 (0.0%) | 0 (0.0%) |
| Total | 82 (100.0%) | 66 (100.0%) |
Families and Households in Grandin
Median Family Size in Grandin
The median family size in Grandin is 2.68 persons per family, with single female/mother families (2 | 4.3%) accounting for the largest median family size of 3.5 persons per family. On the other hand, single male/father families (2 | 4.3%) represent the smallest median family size with 2.00 persons per family.
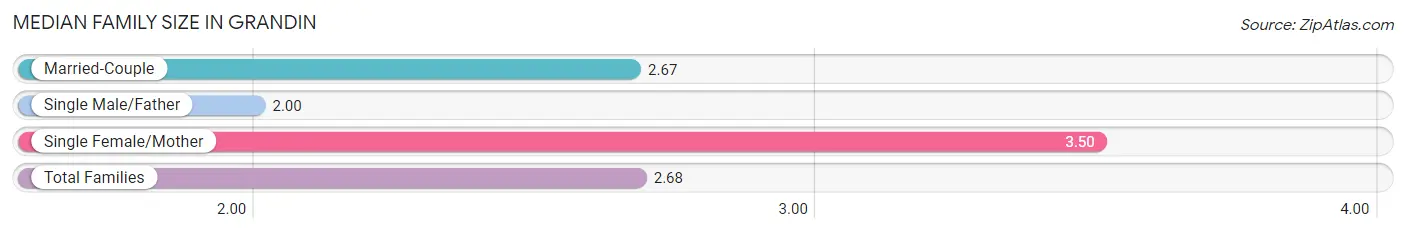
| Family Type | # Families | Family Size |
| Married-Couple | 43 (91.5%) | 2.67 |
| Single Male/Father | 2 (4.3%) | 2.00 |
| Single Female/Mother | 2 (4.3%) | 3.50 |
| Total Families | 47 (100.0%) | 2.68 |
Median Household Size in Grandin
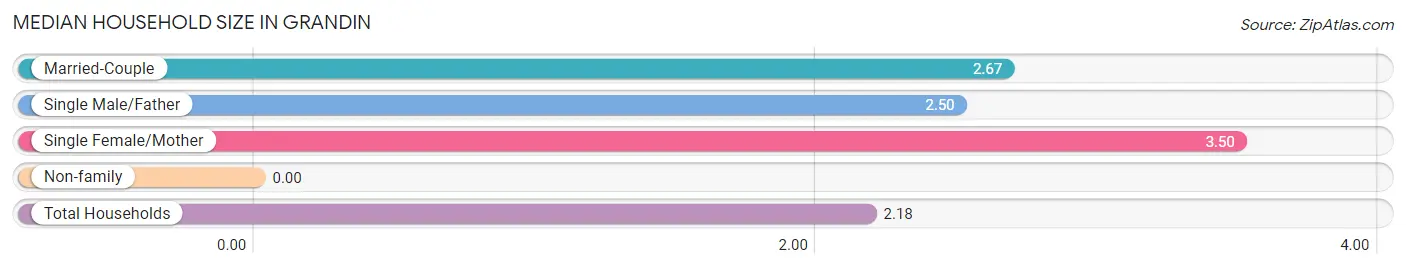
| Household Type | # Households | Household Size |
| Married-Couple | 43 (63.2%) | 2.67 |
| Single Male/Father | 2 (2.9%) | 2.50 |
| Single Female/Mother | 2 (2.9%) | 3.50 |
| Non-family | 21 (30.9%) | - |
| Total Households | 68 (100.0%) | 2.18 |
Household Size by Marriage Status in Grandin
Out of a total of 68 households in Grandin, 47 (69.1%) are family households, while 21 (30.9%) are nonfamily households. The most numerous type of family households are 2-person households, comprising 23, and the most common type of nonfamily households are 1-person households, comprising 21.
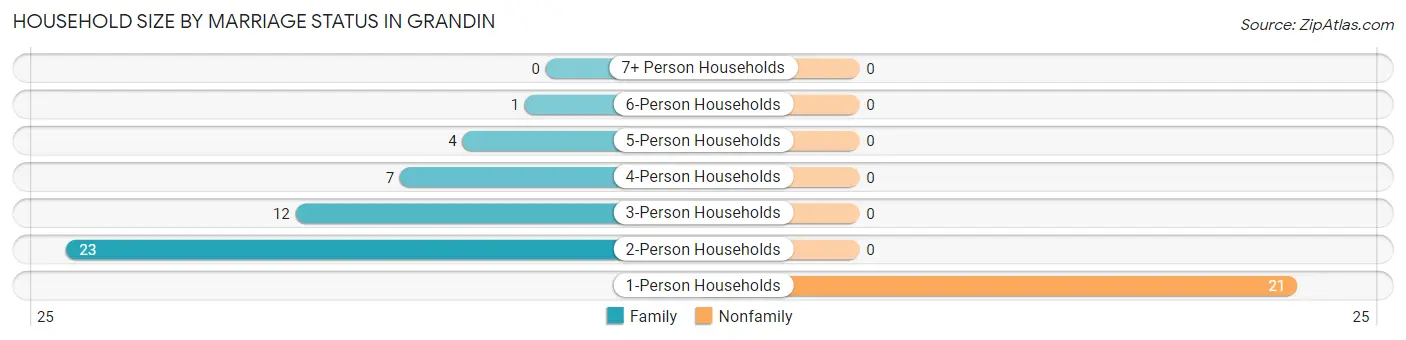
| Household Size | Family Households | Nonfamily Households |
| 1-Person Households | - | 21 (30.9%) |
| 2-Person Households | 23 (33.8%) | 0 (0.0%) |
| 3-Person Households | 12 (17.6%) | 0 (0.0%) |
| 4-Person Households | 7 (10.3%) | 0 (0.0%) |
| 5-Person Households | 4 (5.9%) | 0 (0.0%) |
| 6-Person Households | 1 (1.5%) | 0 (0.0%) |
| 7+ Person Households | 0 (0.0%) | 0 (0.0%) |
| Total | 47 (69.1%) | 21 (30.9%) |
Female Fertility in Grandin
Fertility by Age in Grandin
Average fertility rate in Grandin is 83.0 births per 1,000 women. Women in the age bracket of 35 to 50 years have the highest fertility rate with 125.0 births per 1,000 women. Women in the age bracket of 35 to 50 years acount for 100.0% of all women with births.
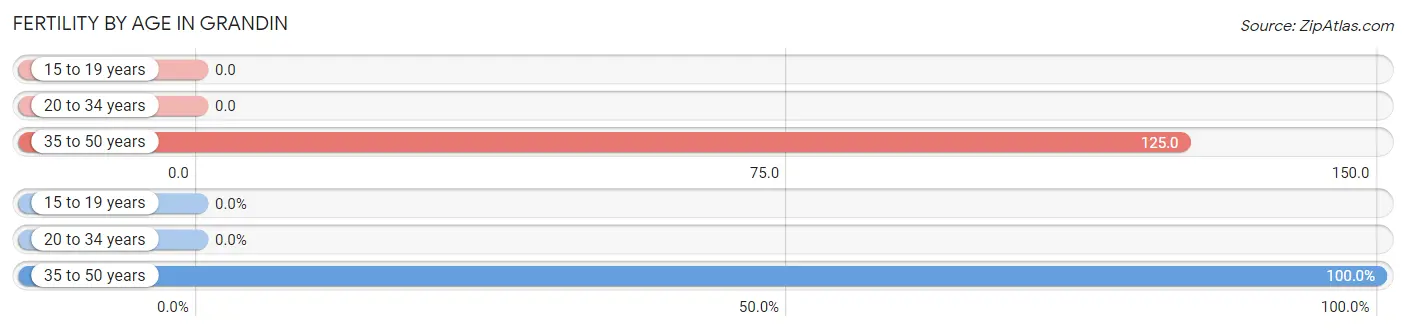
| Age Bracket | Women with Births | Births / 1,000 Women |
| 15 to 19 years | 0 (0.0%) | 0.0 |
| 20 to 34 years | 0 (0.0%) | 0.0 |
| 35 to 50 years | 2 (100.0%) | 125.0 |
| Total | 2 (100.0%) | 83.0 |
Fertility by Age by Marriage Status in Grandin
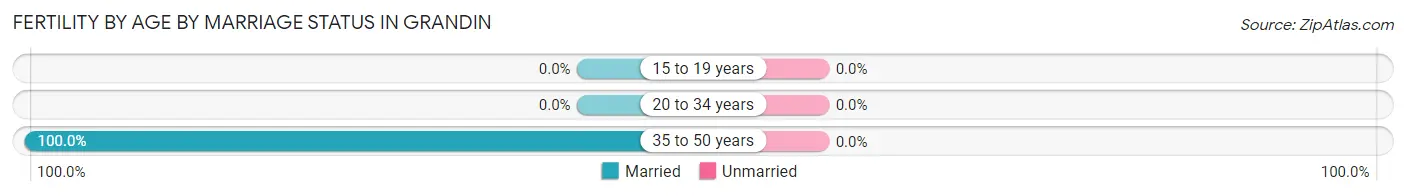
| Age Bracket | Married | Unmarried |
| 15 to 19 years | 0 (0.0%) | 0 (0.0%) |
| 20 to 34 years | 0 (0.0%) | 0 (0.0%) |
| 35 to 50 years | 2 (100.0%) | 0 (0.0%) |
| Total | 2 (100.0%) | 0 (0.0%) |
Fertility by Education in Grandin
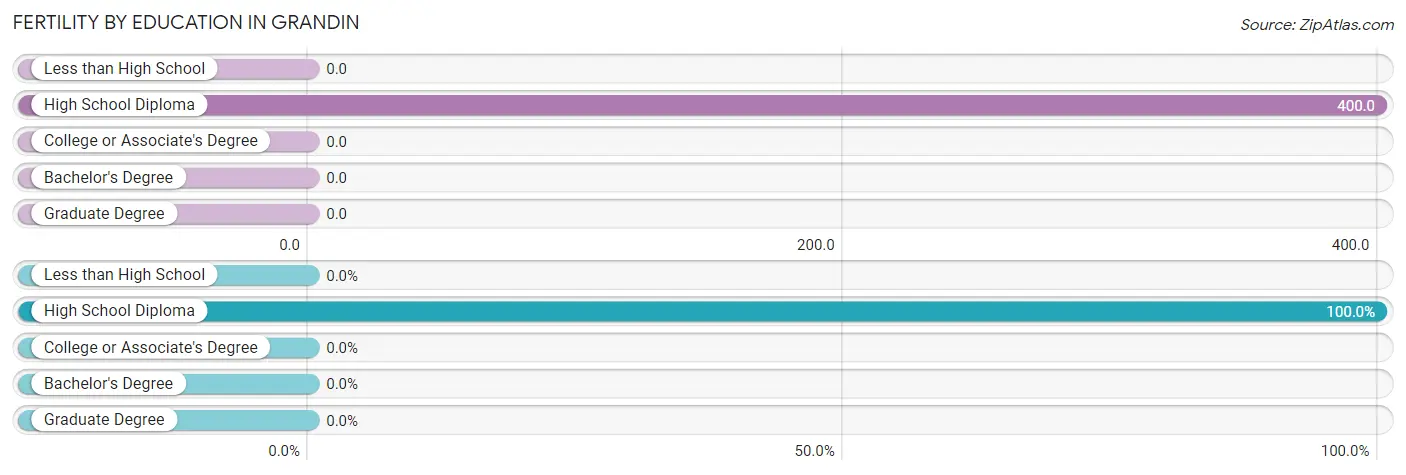
| Educational Attainment | Women with Births | Births / 1,000 Women |
| Less than High School | 0 (0.0%) | 0.0 |
| High School Diploma | 2 (100.0%) | 400.0 |
| College or Associate's Degree | 0 (0.0%) | 0.0 |
| Bachelor's Degree | 0 (0.0%) | 0.0 |
| Graduate Degree | 0 (0.0%) | 0.0 |
| Total | 2 (100.0%) | 83.0 |
Fertility by Education by Marriage Status in Grandin
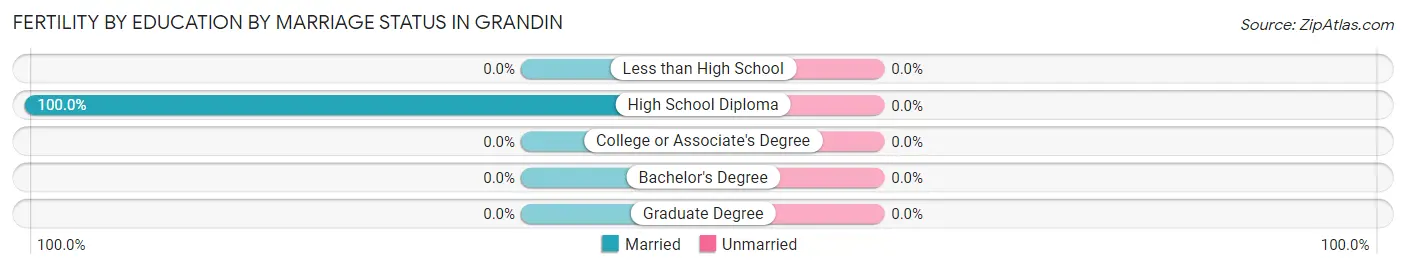
| Educational Attainment | Married | Unmarried |
| Less than High School | 0 (0.0%) | 0 (0.0%) |
| High School Diploma | 2 (100.0%) | 0 (0.0%) |
| College or Associate's Degree | 0 (0.0%) | 0 (0.0%) |
| Bachelor's Degree | 0 (0.0%) | 0 (0.0%) |
| Graduate Degree | 0 (0.0%) | 0 (0.0%) |
| Total | 2 (100.0%) | 0 (0.0%) |
Income in Grandin
Income Overview in Grandin
Per Capita Income in Grandin is $38,247, while median incomes of families and households are $105,625 and $83,125 respectively.
| Characteristic | Number | Measure |
| Per Capita Income | 148 | $38,247 |
| Median Family Income | 47 | $105,625 |
| Mean Family Income | 47 | $101,472 |
| Median Household Income | 68 | $83,125 |
| Mean Household Income | 68 | $86,722 |
| Income Deficit | 47 | $0 |
| Wage / Income Gap (%) | 148 | 50.00% |
| Wage / Income Gap ($) | 148 | 50.00¢ per $1 |
| Gini / Inequality Index | 148 | 0.31 |
Earnings by Sex in Grandin
Average Earnings in Grandin are $42,250, $53,750 for men and $26,875 for women, a difference of 50.0%.
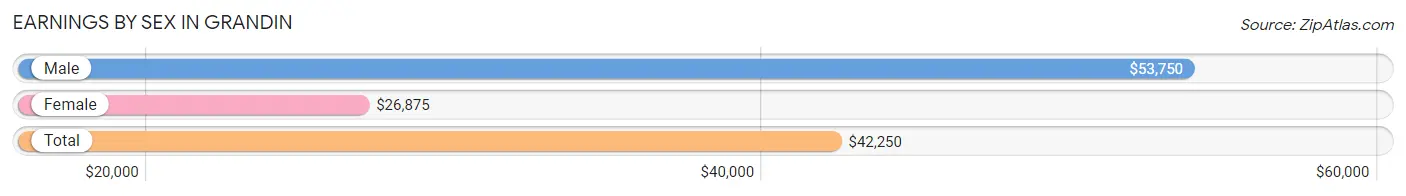
| Sex | Number | Average Earnings |
| Male | 56 (59.0%) | $53,750 |
| Female | 39 (41.0%) | $26,875 |
| Total | 95 (100.0%) | $42,250 |
Earnings by Sex by Income Bracket in Grandin
The most common earnings brackets in Grandin are $75,000 to $99,999 for men (10 | 17.9%) and $20,000 to $22,499 for women (6 | 15.4%).
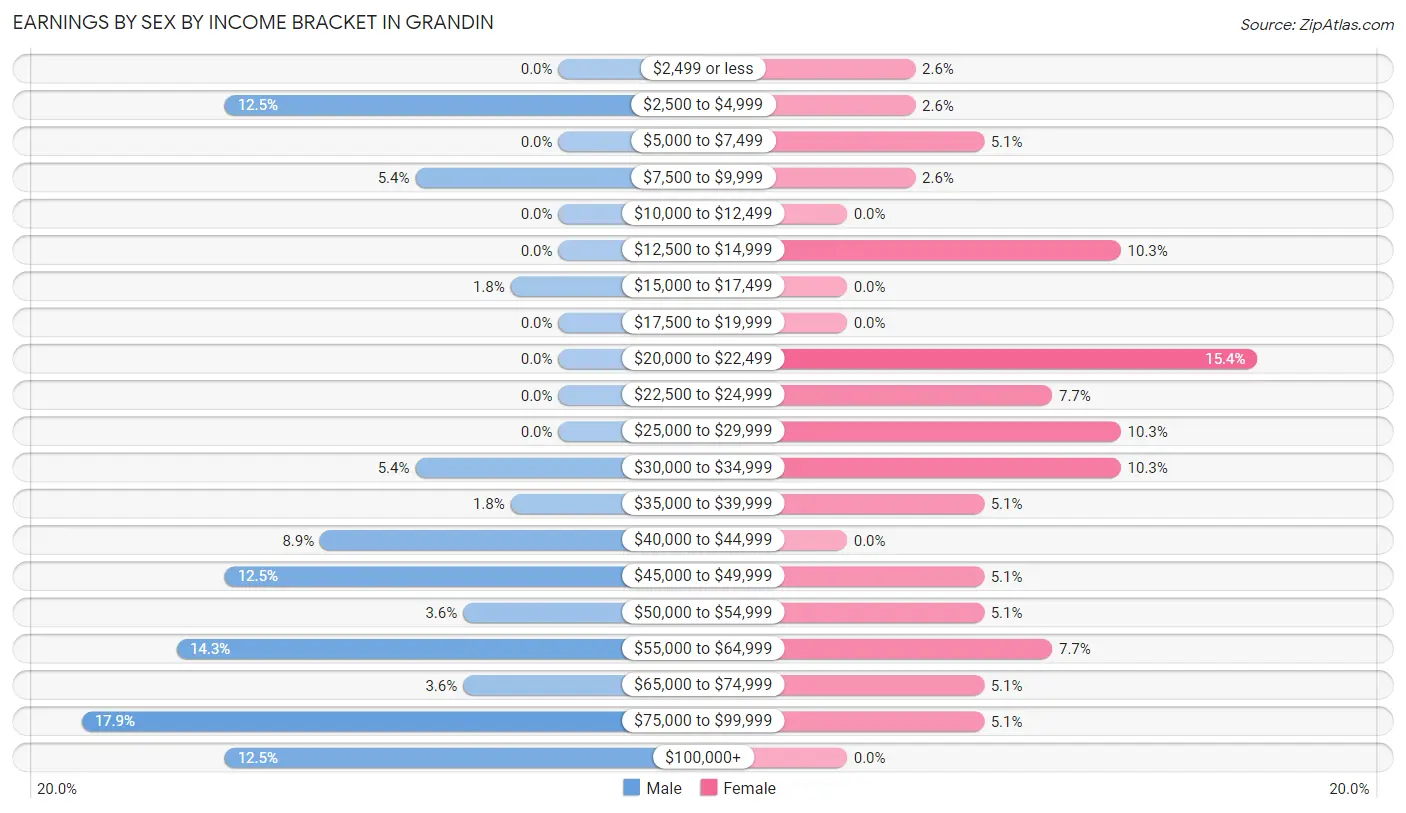
| Income | Male | Female |
| $2,499 or less | 0 (0.0%) | 1 (2.6%) |
| $2,500 to $4,999 | 7 (12.5%) | 1 (2.6%) |
| $5,000 to $7,499 | 0 (0.0%) | 2 (5.1%) |
| $7,500 to $9,999 | 3 (5.4%) | 1 (2.6%) |
| $10,000 to $12,499 | 0 (0.0%) | 0 (0.0%) |
| $12,500 to $14,999 | 0 (0.0%) | 4 (10.3%) |
| $15,000 to $17,499 | 1 (1.8%) | 0 (0.0%) |
| $17,500 to $19,999 | 0 (0.0%) | 0 (0.0%) |
| $20,000 to $22,499 | 0 (0.0%) | 6 (15.4%) |
| $22,500 to $24,999 | 0 (0.0%) | 3 (7.7%) |
| $25,000 to $29,999 | 0 (0.0%) | 4 (10.3%) |
| $30,000 to $34,999 | 3 (5.4%) | 4 (10.3%) |
| $35,000 to $39,999 | 1 (1.8%) | 2 (5.1%) |
| $40,000 to $44,999 | 5 (8.9%) | 0 (0.0%) |
| $45,000 to $49,999 | 7 (12.5%) | 2 (5.1%) |
| $50,000 to $54,999 | 2 (3.6%) | 2 (5.1%) |
| $55,000 to $64,999 | 8 (14.3%) | 3 (7.7%) |
| $65,000 to $74,999 | 2 (3.6%) | 2 (5.1%) |
| $75,000 to $99,999 | 10 (17.9%) | 2 (5.1%) |
| $100,000+ | 7 (12.5%) | 0 (0.0%) |
| Total | 56 (100.0%) | 39 (100.0%) |
Earnings by Sex by Educational Attainment in Grandin
Average earnings in Grandin are $60,833 for men and $28,750 for women, a difference of 52.7%. Men with an educational attainment of college or associate's degree enjoy the highest average annual earnings of $82,917, while those with high school diploma education earn the least with $47,188. Women with an educational attainment of bachelor's degree earn the most with the average annual earnings of $56,250, while those with college or associate's degree education have the smallest earnings of $22,250.
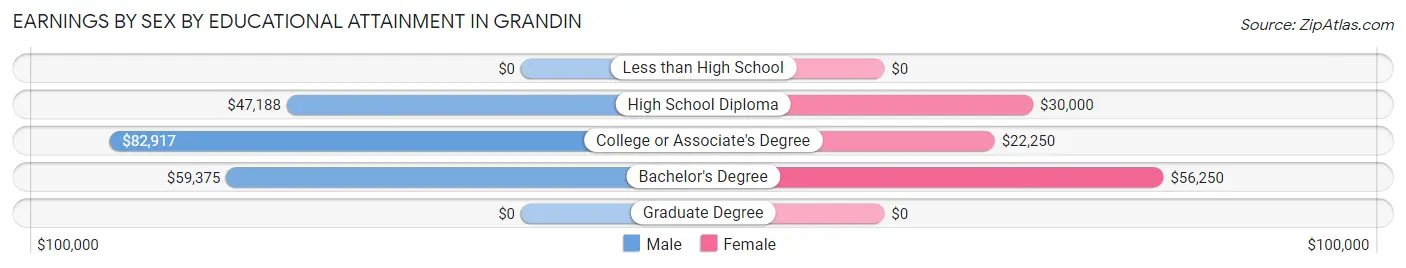
| Educational Attainment | Male Income | Female Income |
| Less than High School | - | - |
| High School Diploma | $47,188 | $30,000 |
| College or Associate's Degree | $82,917 | $22,250 |
| Bachelor's Degree | $59,375 | $56,250 |
| Graduate Degree | - | - |
| Total | $60,833 | $28,750 |
Family Income in Grandin
Family Income Brackets in Grandin
According to the Grandin family income data, there are 18 families falling into the $100,000 to $149,999 income range, which is the most common income bracket and makes up 38.3% of all families.
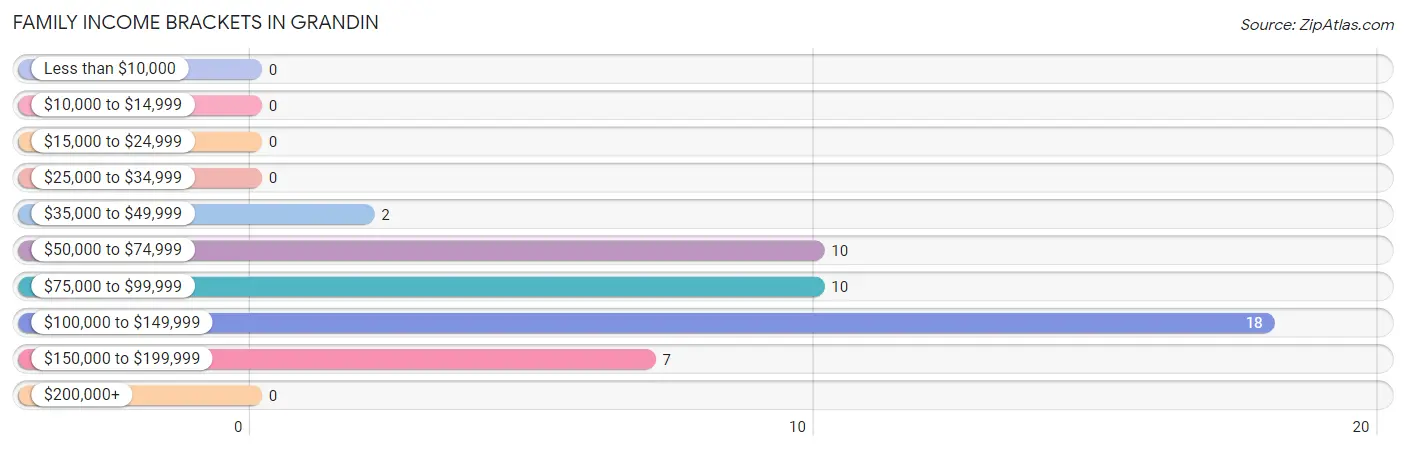
| Income Bracket | # Families | % Families |
| Less than $10,000 | 0 | 0.0% |
| $10,000 to $14,999 | 0 | 0.0% |
| $15,000 to $24,999 | 0 | 0.0% |
| $25,000 to $34,999 | 0 | 0.0% |
| $35,000 to $49,999 | 2 | 4.3% |
| $50,000 to $74,999 | 10 | 21.3% |
| $75,000 to $99,999 | 10 | 21.3% |
| $100,000 to $149,999 | 18 | 38.3% |
| $150,000 to $199,999 | 7 | 14.9% |
| $200,000+ | 0 | 0.0% |
Family Income by Famaliy Size in Grandin
3-person families (10 | 21.3%) account for the highest median family income in Grandin with $107,083 per family, while 2-person families (25 | 53.2%) have the highest median income of $41,562 per family member.
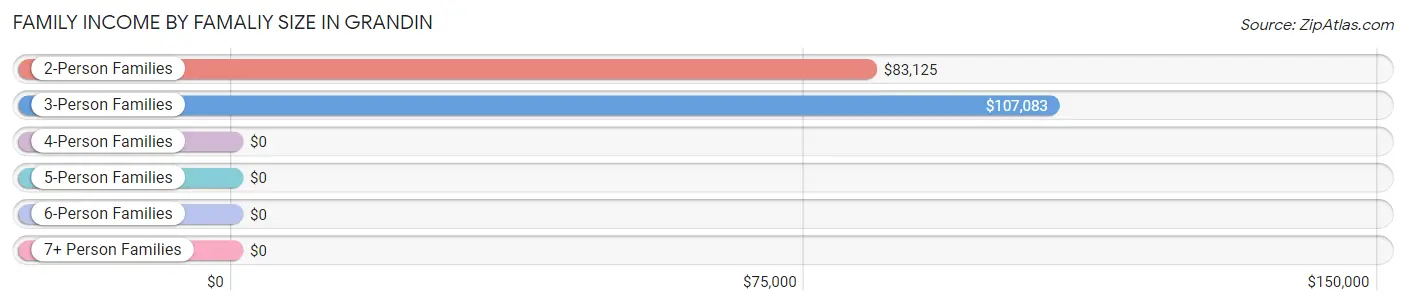
| Income Bracket | # Families | Median Income |
| 2-Person Families | 25 (53.2%) | $83,125 |
| 3-Person Families | 10 (21.3%) | $107,083 |
| 4-Person Families | 7 (14.9%) | $0 |
| 5-Person Families | 4 (8.5%) | $0 |
| 6-Person Families | 1 (2.1%) | $0 |
| 7+ Person Families | 0 (0.0%) | $0 |
| Total | 47 (100.0%) | $105,625 |
Family Income by Number of Earners in Grandin
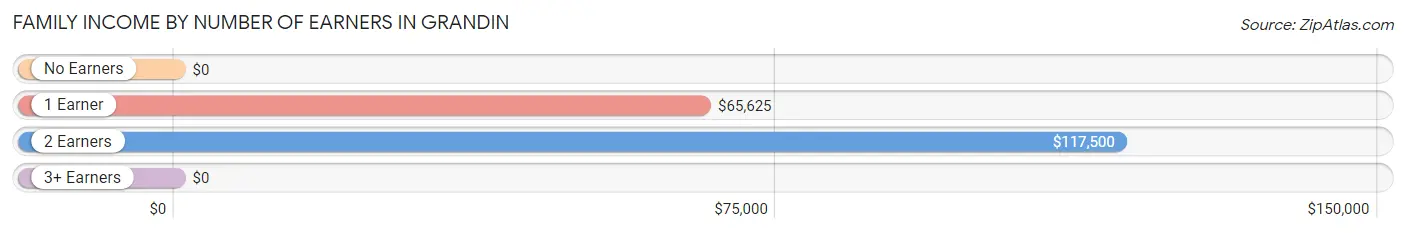
| Number of Earners | # Families | Median Income |
| No Earners | 3 (6.4%) | $0 |
| 1 Earner | 14 (29.8%) | $65,625 |
| 2 Earners | 26 (55.3%) | $117,500 |
| 3+ Earners | 4 (8.5%) | $0 |
| Total | 47 (100.0%) | $105,625 |
Household Income in Grandin
Household Income Brackets in Grandin
With 20 households falling in the category, the $100,000 to $149,999 income range is the most frequent in Grandin, accounting for 29.4% of all households.
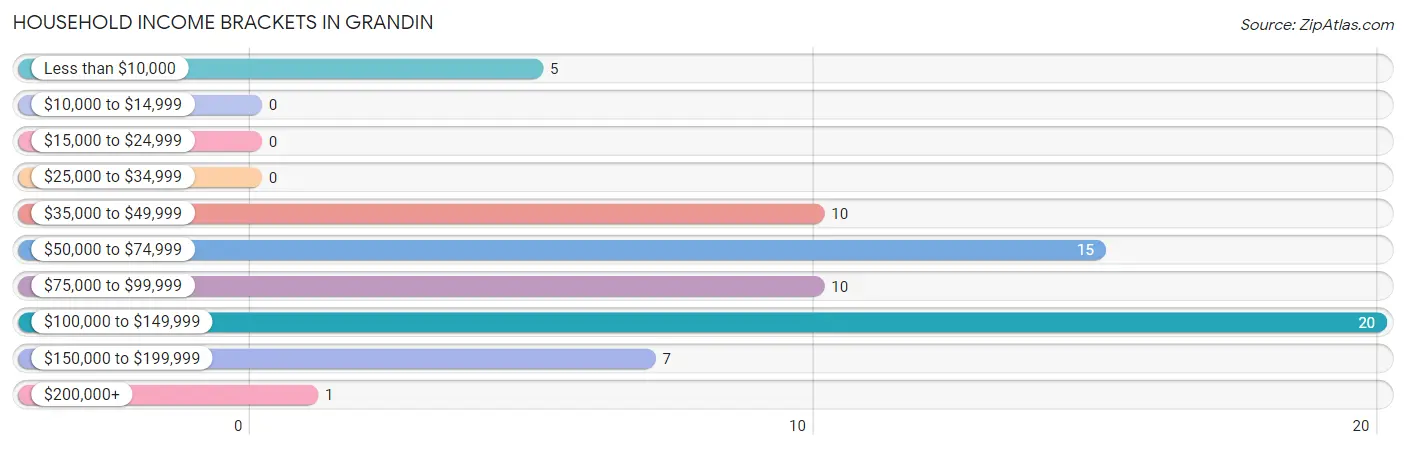
| Income Bracket | # Households | % Households |
| Less than $10,000 | 5 | 7.4% |
| $10,000 to $14,999 | 0 | 0.0% |
| $15,000 to $24,999 | 0 | 0.0% |
| $25,000 to $34,999 | 0 | 0.0% |
| $35,000 to $49,999 | 10 | 14.7% |
| $50,000 to $74,999 | 15 | 22.1% |
| $75,000 to $99,999 | 10 | 14.7% |
| $100,000 to $149,999 | 20 | 29.4% |
| $150,000 to $199,999 | 7 | 10.3% |
| $200,000+ | 1 | 1.5% |
Household Income by Householder Age in Grandin
The median household income in Grandin is $83,125, with the highest median household income of $105,250 found in the 25 to 44 years age bracket for the primary householder. A total of 23 households (33.8%) fall into this category. Meanwhile, the 15 to 24 years age bracket for the primary householder has the lowest median household income of $0, with 5 households (7.3%) in this group.
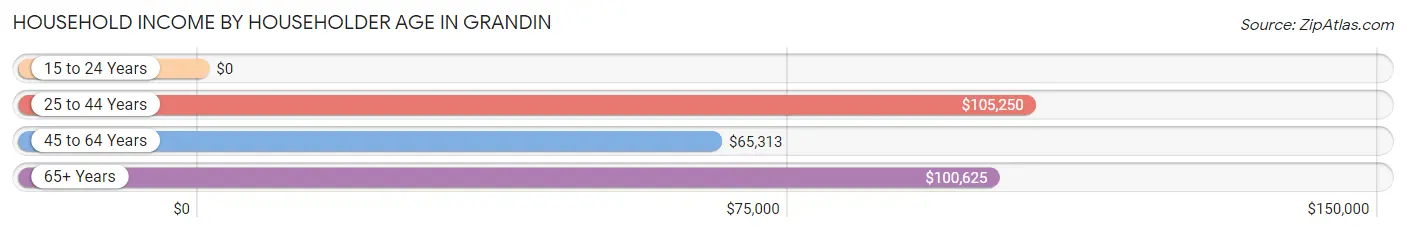
| Income Bracket | # Households | Median Income |
| 15 to 24 Years | 5 (7.3%) | $0 |
| 25 to 44 Years | 23 (33.8%) | $105,250 |
| 45 to 64 Years | 25 (36.8%) | $65,313 |
| 65+ Years | 15 (22.1%) | $100,625 |
| Total | 68 (100.0%) | $83,125 |
Poverty in Grandin
Income Below Poverty by Sex and Age in Grandin
With 6.1% poverty level for males and 1.5% for females among the residents of Grandin, 55 to 64 year old males and 35 to 44 year old females are the most vulnerable to poverty, with 5 males (21.7%) and 1 females (7.1%) in their respective age groups living below the poverty level.
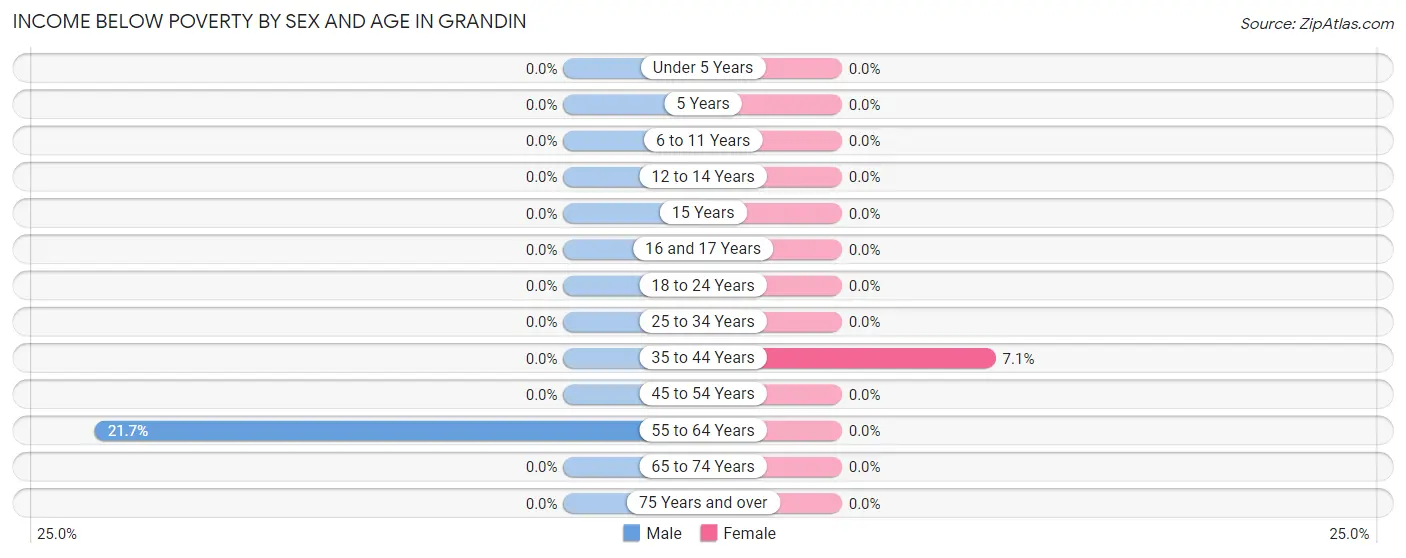
| Age Bracket | Male | Female |
| Under 5 Years | 0 (0.0%) | 0 (0.0%) |
| 5 Years | 0 (0.0%) | 0 (0.0%) |
| 6 to 11 Years | 0 (0.0%) | 0 (0.0%) |
| 12 to 14 Years | 0 (0.0%) | 0 (0.0%) |
| 15 Years | 0 (0.0%) | 0 (0.0%) |
| 16 and 17 Years | 0 (0.0%) | 0 (0.0%) |
| 18 to 24 Years | 0 (0.0%) | 0 (0.0%) |
| 25 to 34 Years | 0 (0.0%) | 0 (0.0%) |
| 35 to 44 Years | 0 (0.0%) | 1 (7.1%) |
| 45 to 54 Years | 0 (0.0%) | 0 (0.0%) |
| 55 to 64 Years | 5 (21.7%) | 0 (0.0%) |
| 65 to 74 Years | 0 (0.0%) | 0 (0.0%) |
| 75 Years and over | 0 (0.0%) | 0 (0.0%) |
| Total | 5 (6.1%) | 1 (1.5%) |
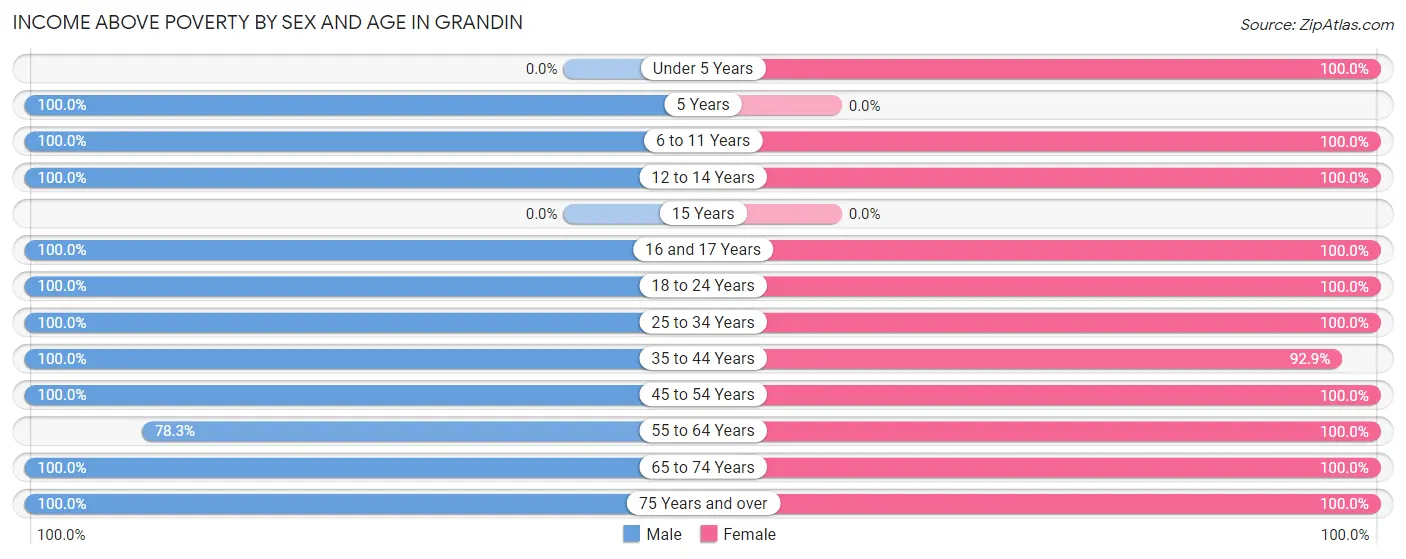
Income Above Poverty by Sex and Age in Grandin
According to the poverty statistics in Grandin, males aged 5 years and females aged under 5 years are the age groups that are most secure financially, with 100.0% of males and 100.0% of females in these age groups living above the poverty line.
| Age Bracket | Male | Female |
| Under 5 Years | 0 (0.0%) | 6 (100.0%) |
| 5 Years | 2 (100.0%) | 0 (0.0%) |
| 6 to 11 Years | 8 (100.0%) | 4 (100.0%) |
| 12 to 14 Years | 6 (100.0%) | 4 (100.0%) |
| 15 Years | 0 (0.0%) | 0 (0.0%) |
| 16 and 17 Years | 2 (100.0%) | 1 (100.0%) |
| 18 to 24 Years | 10 (100.0%) | 2 (100.0%) |
| 25 to 34 Years | 9 (100.0%) | 5 (100.0%) |
| 35 to 44 Years | 9 (100.0%) | 13 (92.9%) |
| 45 to 54 Years | 5 (100.0%) | 4 (100.0%) |
| 55 to 64 Years | 18 (78.3%) | 12 (100.0%) |
| 65 to 74 Years | 7 (100.0%) | 12 (100.0%) |
| 75 Years and over | 1 (100.0%) | 2 (100.0%) |
| Total | 77 (93.9%) | 65 (98.5%) |
Income Below Poverty Among Married-Couple Families in Grandin
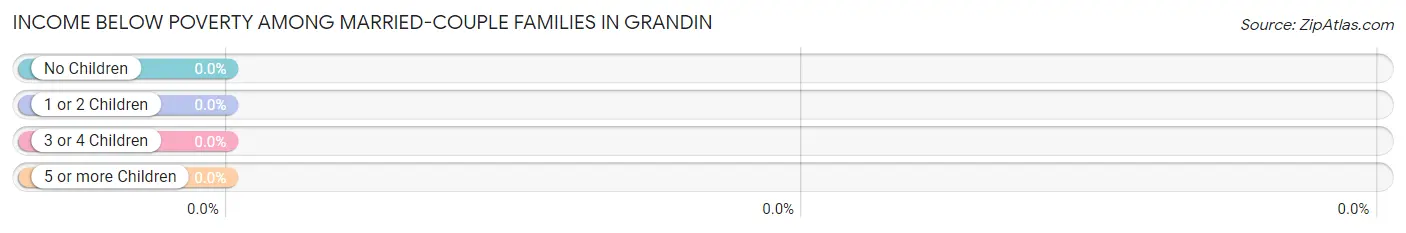
| Children | Above Poverty | Below Poverty |
| No Children | 26 (100.0%) | 0 (0.0%) |
| 1 or 2 Children | 14 (100.0%) | 0 (0.0%) |
| 3 or 4 Children | 3 (100.0%) | 0 (0.0%) |
| 5 or more Children | 0 (0.0%) | 0 (0.0%) |
| Total | 43 (100.0%) | 0 (0.0%) |
Income Below Poverty Among Single-Parent Households in Grandin
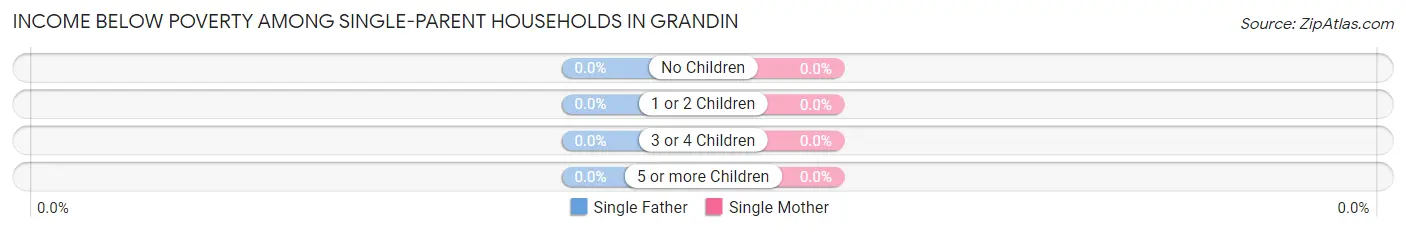
| Children | Single Father | Single Mother |
| No Children | 0 (0.0%) | 0 (0.0%) |
| 1 or 2 Children | 0 (0.0%) | 0 (0.0%) |
| 3 or 4 Children | 0 (0.0%) | 0 (0.0%) |
| 5 or more Children | 0 (0.0%) | 0 (0.0%) |
| Total | 0 (0.0%) | 0 (0.0%) |
Income Below Poverty Among Married-Couple vs Single-Parent Households in Grandin
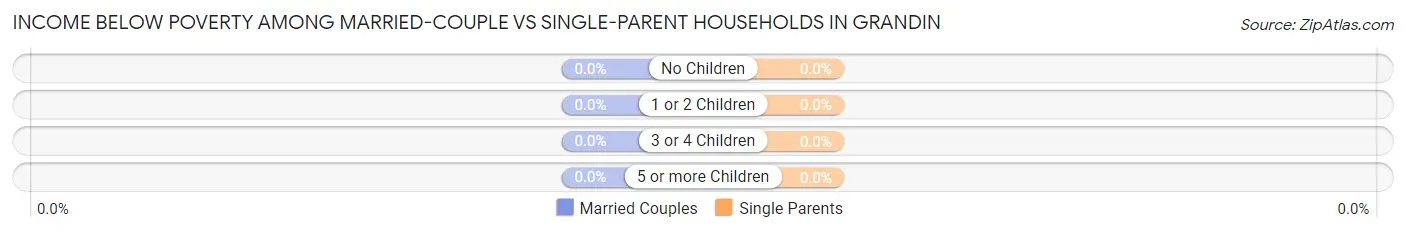
| Children | Married-Couple Families | Single-Parent Households |
| No Children | 0 (0.0%) | 0 (0.0%) |
| 1 or 2 Children | 0 (0.0%) | 0 (0.0%) |
| 3 or 4 Children | 0 (0.0%) | 0 (0.0%) |
| 5 or more Children | 0 (0.0%) | 0 (0.0%) |
| Total | 0 (0.0%) | 0 (0.0%) |
Employment Characteristics in Grandin
Employment by Class of Employer in Grandin
Among the 77 employed individuals in Grandin, private company employees (50 | 64.9%), not-for-profit organizations (11 | 14.3%), and state government employees (6 | 7.8%) make up the most common classes of employment.
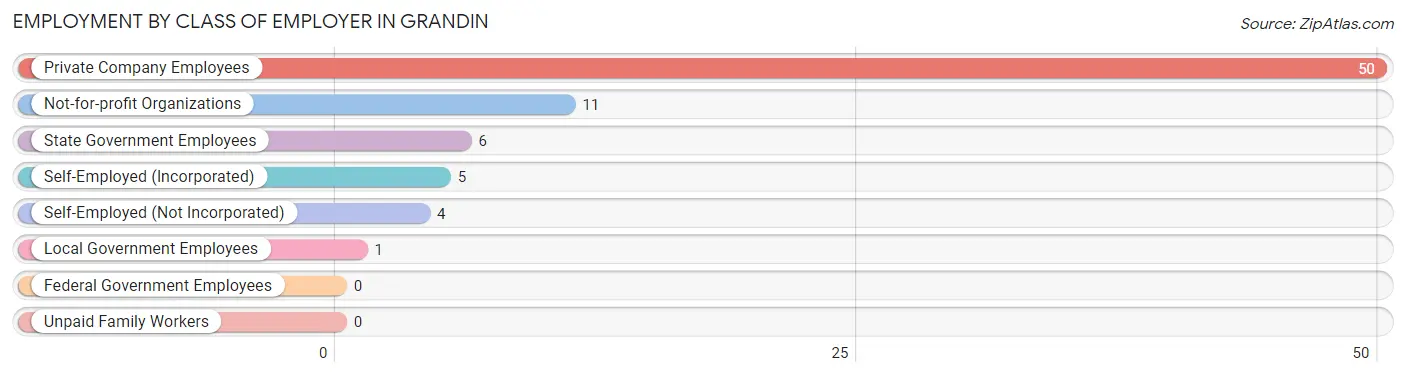
| Employer Class | # Employees | % Employees |
| Private Company Employees | 50 | 64.9% |
| Self-Employed (Incorporated) | 5 | 6.5% |
| Self-Employed (Not Incorporated) | 4 | 5.2% |
| Not-for-profit Organizations | 11 | 14.3% |
| Local Government Employees | 1 | 1.3% |
| State Government Employees | 6 | 7.8% |
| Federal Government Employees | 0 | 0.0% |
| Unpaid Family Workers | 0 | 0.0% |
| Total | 77 | 100.0% |
Employment Status by Age in Grandin
According to the labor force statistics for Grandin, out of the total population over 16 years of age (118), 72.9% or 86 individuals are in the labor force, with 2.3% or 2 of them unemployed. The age group with the highest labor force participation rate is 25 to 29 years, with 100.0% or 11 individuals in the labor force. Within the labor force, the 16 to 19 years age range has the highest percentage of unemployed individuals, with 33.3% or 2 of them being unemployed.
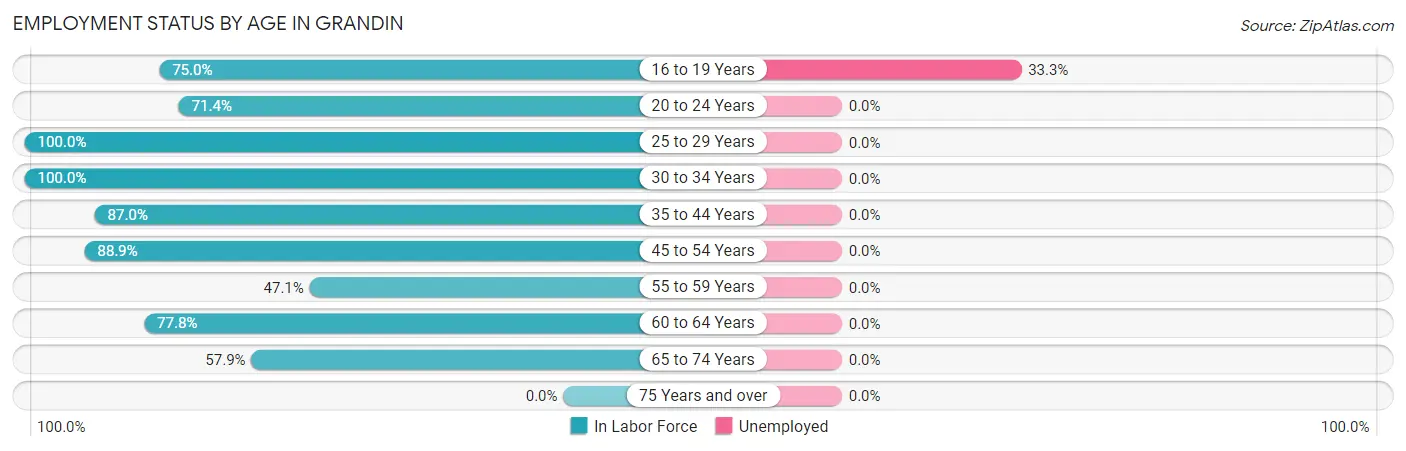
| Age Bracket | In Labor Force | Unemployed |
| 16 to 19 Years | 6 (75.0%) | 2 (33.3%) |
| 20 to 24 Years | 5 (71.4%) | 0 (0.0%) |
| 25 to 29 Years | 11 (100.0%) | 0 (0.0%) |
| 30 to 34 Years | 3 (100.0%) | 0 (0.0%) |
| 35 to 44 Years | 20 (87.0%) | 0 (0.0%) |
| 45 to 54 Years | 8 (88.9%) | 0 (0.0%) |
| 55 to 59 Years | 8 (47.1%) | 0 (0.0%) |
| 60 to 64 Years | 14 (77.8%) | 0 (0.0%) |
| 65 to 74 Years | 11 (57.9%) | 0 (0.0%) |
| 75 Years and over | 0 (0.0%) | 0 (0.0%) |
| Total | 86 (72.9%) | 2 (2.3%) |
Employment Status by Educational Attainment in Grandin
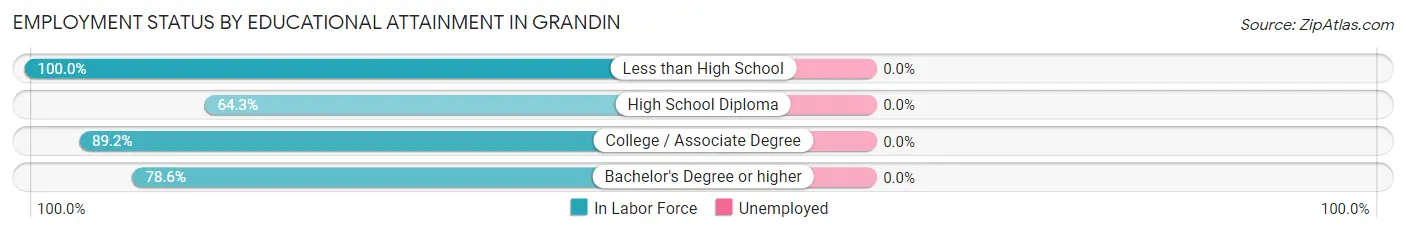
| Educational Attainment | In Labor Force | Unemployed |
| Less than High School | 2 (100.0%) | 0 (0.0%) |
| High School Diploma | 18 (64.3%) | 0 (0.0%) |
| College / Associate Degree | 33 (89.2%) | 0 (0.0%) |
| Bachelor's Degree or higher | 11 (78.6%) | 0 (0.0%) |
| Total | 64 (79.0%) | 0 (0.0%) |
Employment Occupations by Sex in Grandin
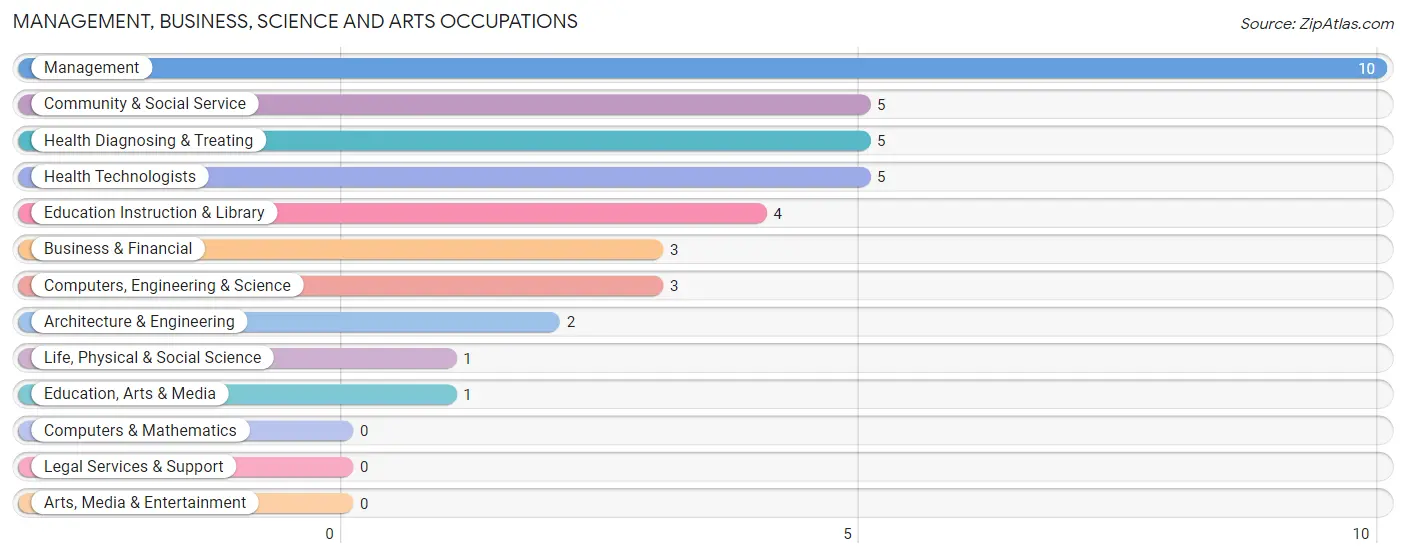
Management, Business, Science and Arts Occupations
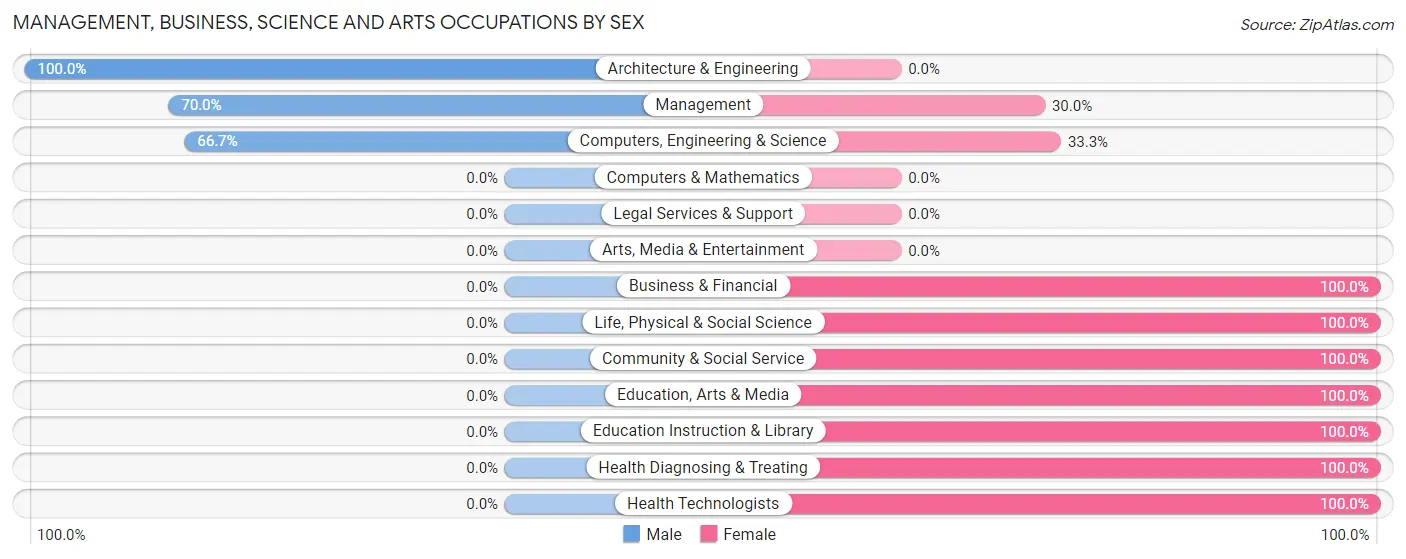
The most common Management, Business, Science and Arts occupations in Grandin are Management (10 | 11.9%), Community & Social Service (5 | 5.9%), Health Diagnosing & Treating (5 | 5.9%), Health Technologists (5 | 5.9%), and Education Instruction & Library (4 | 4.8%).
Management, Business, Science and Arts Occupations by Sex
Within the Management, Business, Science and Arts occupations in Grandin, the most male-oriented occupations are Architecture & Engineering (100.0%), Management (70.0%), and Computers, Engineering & Science (66.7%), while the most female-oriented occupations are Business & Financial (100.0%), Life, Physical & Social Science (100.0%), and Community & Social Service (100.0%).
| Occupation | Male | Female |
| Management | 7 (70.0%) | 3 (30.0%) |
| Business & Financial | 0 (0.0%) | 3 (100.0%) |
| Computers, Engineering & Science | 2 (66.7%) | 1 (33.3%) |
| Computers & Mathematics | 0 (0.0%) | 0 (0.0%) |
| Architecture & Engineering | 2 (100.0%) | 0 (0.0%) |
| Life, Physical & Social Science | 0 (0.0%) | 1 (100.0%) |
| Community & Social Service | 0 (0.0%) | 5 (100.0%) |
| Education, Arts & Media | 0 (0.0%) | 1 (100.0%) |
| Legal Services & Support | 0 (0.0%) | 0 (0.0%) |
| Education Instruction & Library | 0 (0.0%) | 4 (100.0%) |
| Arts, Media & Entertainment | 0 (0.0%) | 0 (0.0%) |
| Health Diagnosing & Treating | 0 (0.0%) | 5 (100.0%) |
| Health Technologists | 0 (0.0%) | 5 (100.0%) |
| Total (Category) | 9 (34.6%) | 17 (65.4%) |
| Total (Overall) | 49 (58.3%) | 35 (41.7%) |
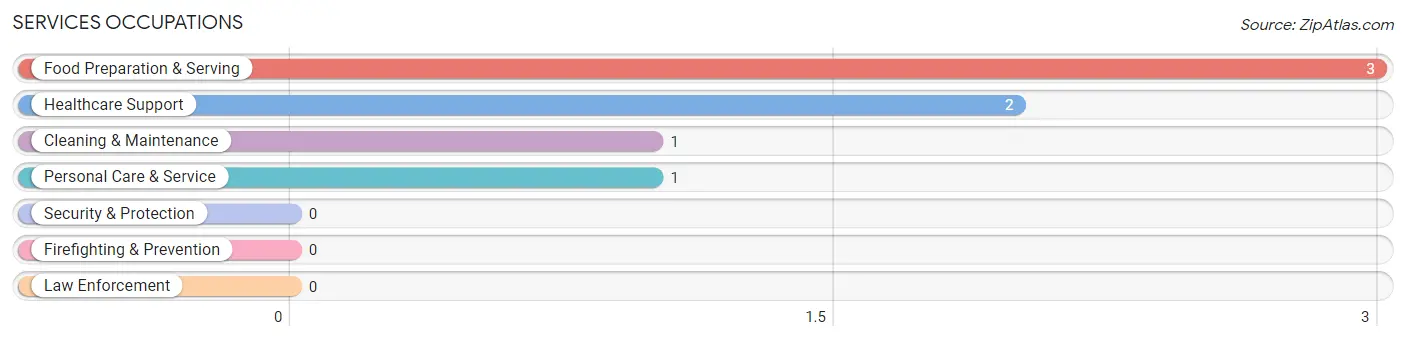
Services Occupations
The most common Services occupations in Grandin are Food Preparation & Serving (3 | 3.6%), Healthcare Support (2 | 2.4%), Cleaning & Maintenance (1 | 1.2%), and Personal Care & Service (1 | 1.2%).
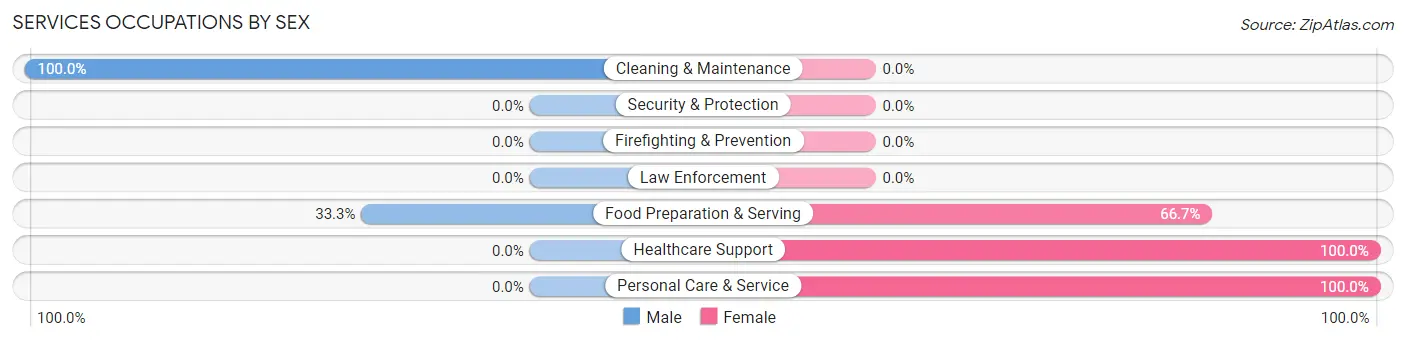
Services Occupations by Sex
Within the Services occupations in Grandin, the most male-oriented occupations are Cleaning & Maintenance (100.0%), and Food Preparation & Serving (33.3%), while the most female-oriented occupations are Healthcare Support (100.0%), Personal Care & Service (100.0%), and Food Preparation & Serving (66.7%).
| Occupation | Male | Female |
| Healthcare Support | 0 (0.0%) | 2 (100.0%) |
| Security & Protection | 0 (0.0%) | 0 (0.0%) |
| Firefighting & Prevention | 0 (0.0%) | 0 (0.0%) |
| Law Enforcement | 0 (0.0%) | 0 (0.0%) |
| Food Preparation & Serving | 1 (33.3%) | 2 (66.7%) |
| Cleaning & Maintenance | 1 (100.0%) | 0 (0.0%) |
| Personal Care & Service | 0 (0.0%) | 1 (100.0%) |
| Total (Category) | 2 (28.6%) | 5 (71.4%) |
| Total (Overall) | 49 (58.3%) | 35 (41.7%) |
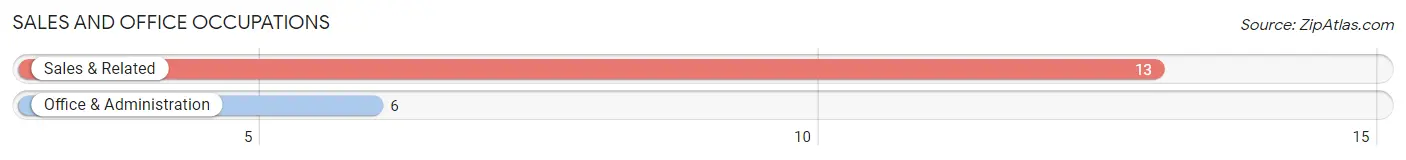
Sales and Office Occupations
The most common Sales and Office occupations in Grandin are Sales & Related (13 | 15.5%), and Office & Administration (6 | 7.1%).
Sales and Office Occupations by Sex
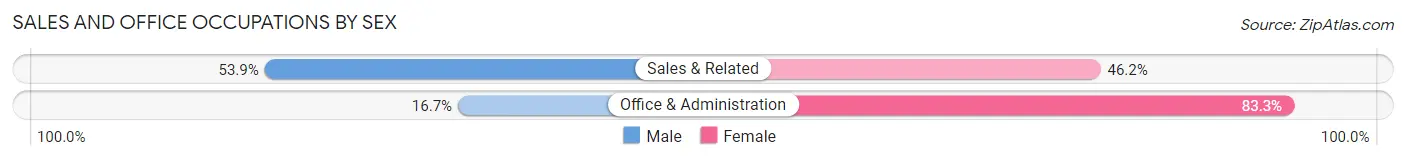
| Occupation | Male | Female |
| Sales & Related | 7 (53.8%) | 6 (46.2%) |
| Office & Administration | 1 (16.7%) | 5 (83.3%) |
| Total (Category) | 8 (42.1%) | 11 (57.9%) |
| Total (Overall) | 49 (58.3%) | 35 (41.7%) |
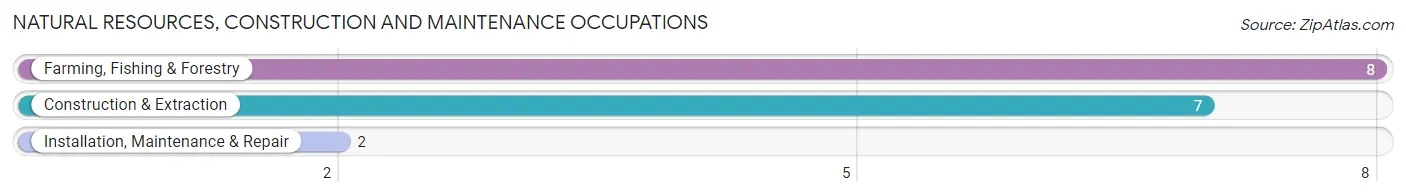
Natural Resources, Construction and Maintenance Occupations
The most common Natural Resources, Construction and Maintenance occupations in Grandin are Farming, Fishing & Forestry (8 | 9.5%), Construction & Extraction (7 | 8.3%), and Installation, Maintenance & Repair (2 | 2.4%).
Natural Resources, Construction and Maintenance Occupations by Sex
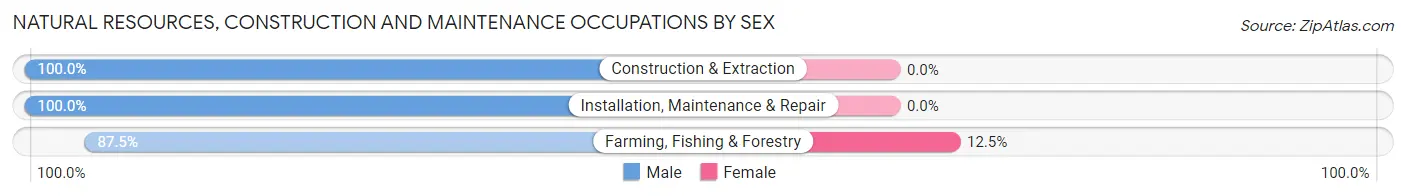
| Occupation | Male | Female |
| Farming, Fishing & Forestry | 7 (87.5%) | 1 (12.5%) |
| Construction & Extraction | 7 (100.0%) | 0 (0.0%) |
| Installation, Maintenance & Repair | 2 (100.0%) | 0 (0.0%) |
| Total (Category) | 16 (94.1%) | 1 (5.9%) |
| Total (Overall) | 49 (58.3%) | 35 (41.7%) |
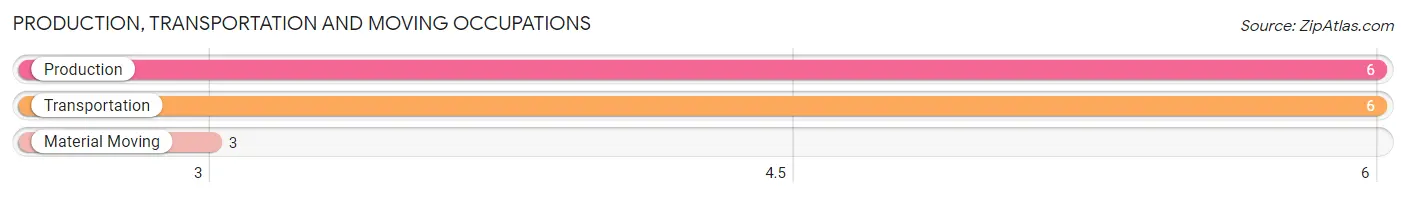
Production, Transportation and Moving Occupations
The most common Production, Transportation and Moving occupations in Grandin are Production (6 | 7.1%), Transportation (6 | 7.1%), and Material Moving (3 | 3.6%).
Production, Transportation and Moving Occupations by Sex
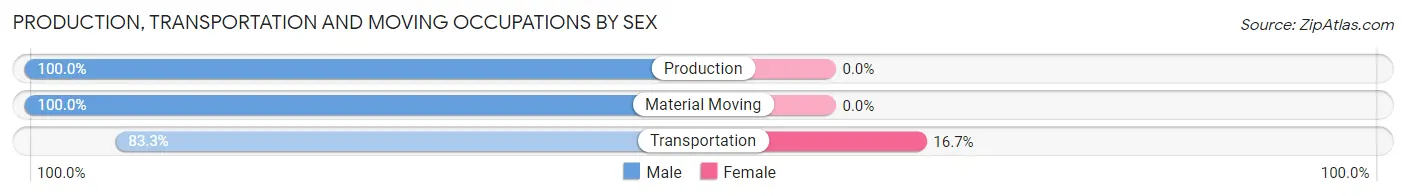
| Occupation | Male | Female |
| Production | 6 (100.0%) | 0 (0.0%) |
| Transportation | 5 (83.3%) | 1 (16.7%) |
| Material Moving | 3 (100.0%) | 0 (0.0%) |
| Total (Category) | 14 (93.3%) | 1 (6.7%) |
| Total (Overall) | 49 (58.3%) | 35 (41.7%) |
Employment Industries by Sex in Grandin
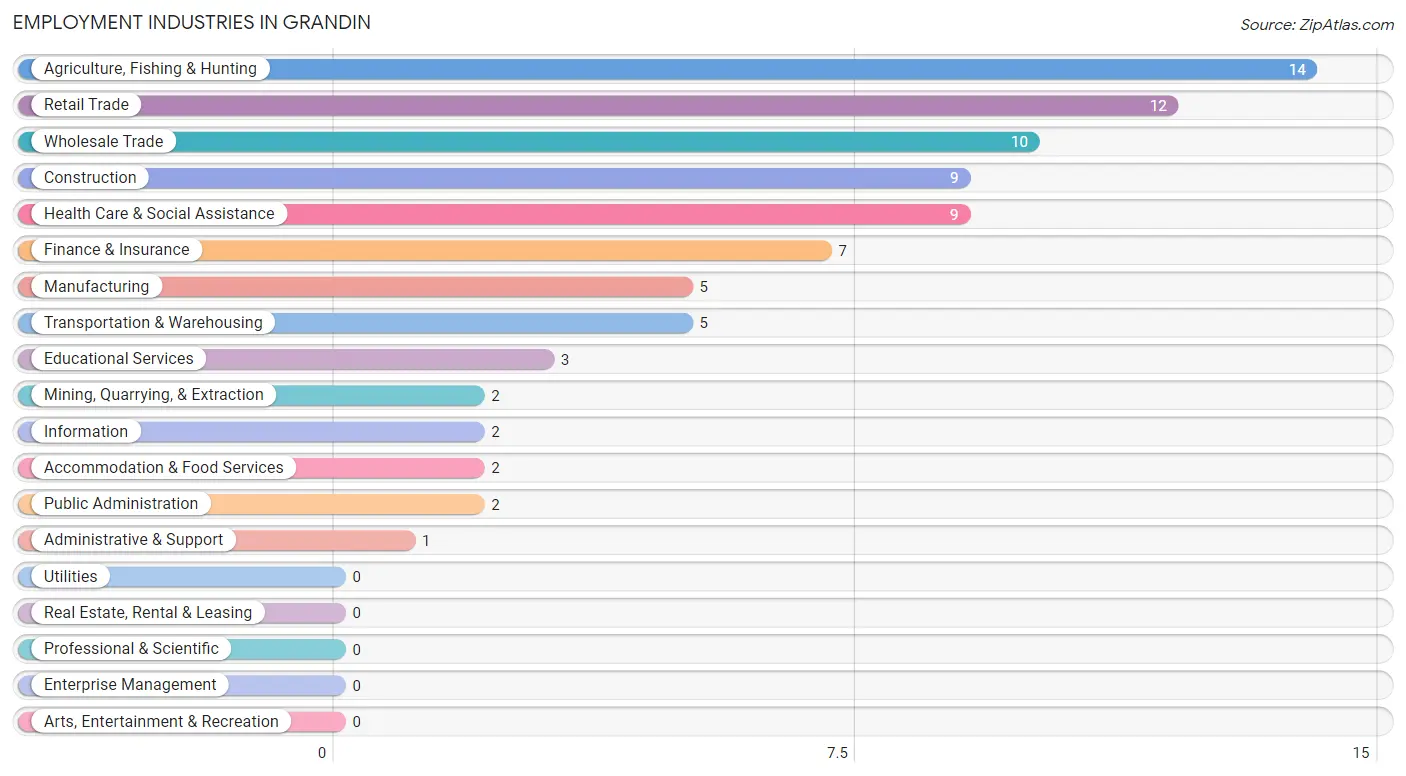
Employment Industries in Grandin
The major employment industries in Grandin include Agriculture, Fishing & Hunting (14 | 16.7%), Retail Trade (12 | 14.3%), Wholesale Trade (10 | 11.9%), Construction (9 | 10.7%), and Health Care & Social Assistance (9 | 10.7%).
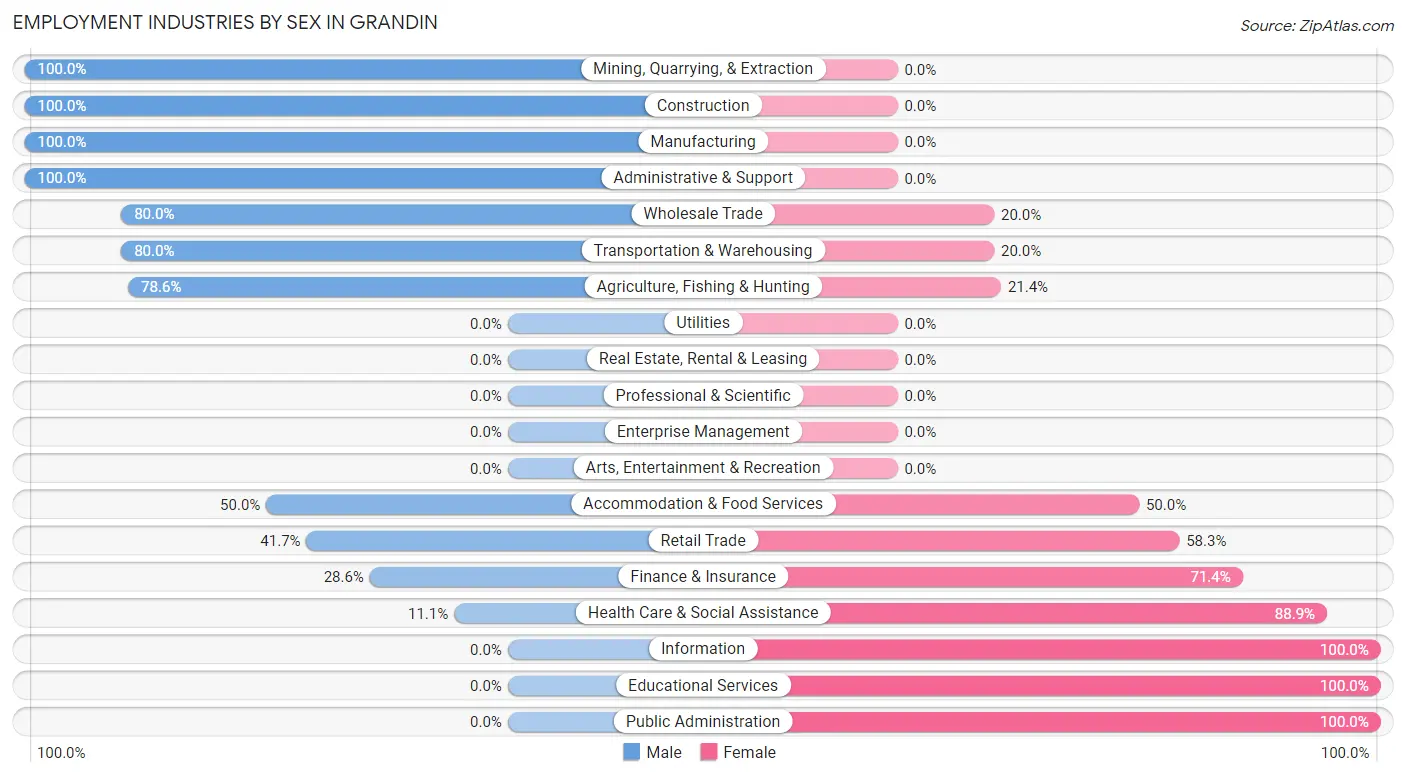
Employment Industries by Sex in Grandin
The Grandin industries that see more men than women are Mining, Quarrying, & Extraction (100.0%), Construction (100.0%), and Manufacturing (100.0%), whereas the industries that tend to have a higher number of women are Information (100.0%), Educational Services (100.0%), and Public Administration (100.0%).
| Industry | Male | Female |
| Agriculture, Fishing & Hunting | 11 (78.6%) | 3 (21.4%) |
| Mining, Quarrying, & Extraction | 2 (100.0%) | 0 (0.0%) |
| Construction | 9 (100.0%) | 0 (0.0%) |
| Manufacturing | 5 (100.0%) | 0 (0.0%) |
| Wholesale Trade | 8 (80.0%) | 2 (20.0%) |
| Retail Trade | 5 (41.7%) | 7 (58.3%) |
| Transportation & Warehousing | 4 (80.0%) | 1 (20.0%) |
| Utilities | 0 (0.0%) | 0 (0.0%) |
| Information | 0 (0.0%) | 2 (100.0%) |
| Finance & Insurance | 2 (28.6%) | 5 (71.4%) |
| Real Estate, Rental & Leasing | 0 (0.0%) | 0 (0.0%) |
| Professional & Scientific | 0 (0.0%) | 0 (0.0%) |
| Enterprise Management | 0 (0.0%) | 0 (0.0%) |
| Administrative & Support | 1 (100.0%) | 0 (0.0%) |
| Educational Services | 0 (0.0%) | 3 (100.0%) |
| Health Care & Social Assistance | 1 (11.1%) | 8 (88.9%) |
| Arts, Entertainment & Recreation | 0 (0.0%) | 0 (0.0%) |
| Accommodation & Food Services | 1 (50.0%) | 1 (50.0%) |
| Public Administration | 0 (0.0%) | 2 (100.0%) |
| Total | 49 (58.3%) | 35 (41.7%) |
Education in Grandin
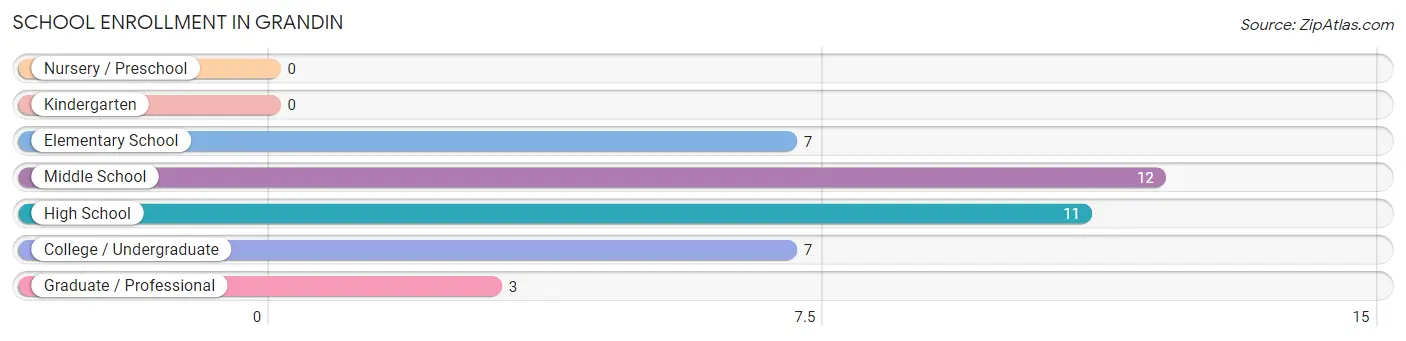
School Enrollment in Grandin
The most common levels of schooling among the 40 students in Grandin are middle school (12 | 30.0%), high school (11 | 27.5%), and elementary school (7 | 17.5%).
| School Level | # Students | % Students |
| Nursery / Preschool | 0 | 0.0% |
| Kindergarten | 0 | 0.0% |
| Elementary School | 7 | 17.5% |
| Middle School | 12 | 30.0% |
| High School | 11 | 27.5% |
| College / Undergraduate | 7 | 17.5% |
| Graduate / Professional | 3 | 7.5% |
| Total | 40 | 100.0% |
School Enrollment by Age by Funding Source in Grandin
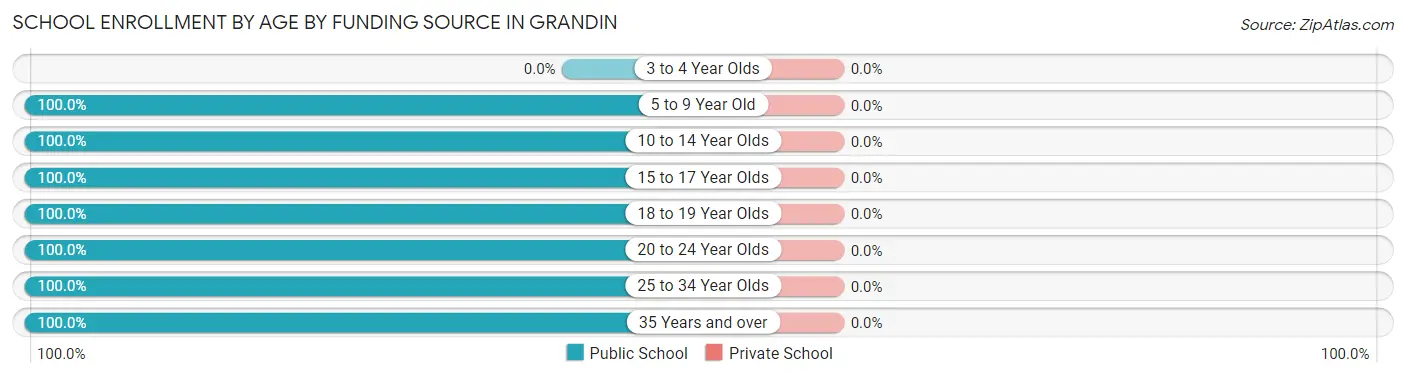
| Age Bracket | Public School | Private School |
| 3 to 4 Year Olds | 0 (0.0%) | 0 (0.0%) |
| 5 to 9 Year Old | 7 (100.0%) | 0 (0.0%) |
| 10 to 14 Year Olds | 15 (100.0%) | 0 (0.0%) |
| 15 to 17 Year Olds | 3 (100.0%) | 0 (0.0%) |
| 18 to 19 Year Olds | 5 (100.0%) | 0 (0.0%) |
| 20 to 24 Year Olds | 2 (100.0%) | 0 (0.0%) |
| 25 to 34 Year Olds | 5 (100.0%) | 0 (0.0%) |
| 35 Years and over | 3 (100.0%) | 0 (0.0%) |
| Total | 40 (100.0%) | 0 (0.0%) |
Educational Attainment by Field of Study in Grandin
Social sciences (3 | 17.6%), business (3 | 17.6%), education (3 | 17.6%), bio, nature & agricultural (2 | 11.8%), and engineering (2 | 11.8%) are the most common fields of study among 17 individuals in Grandin who have obtained a bachelor's degree or higher.
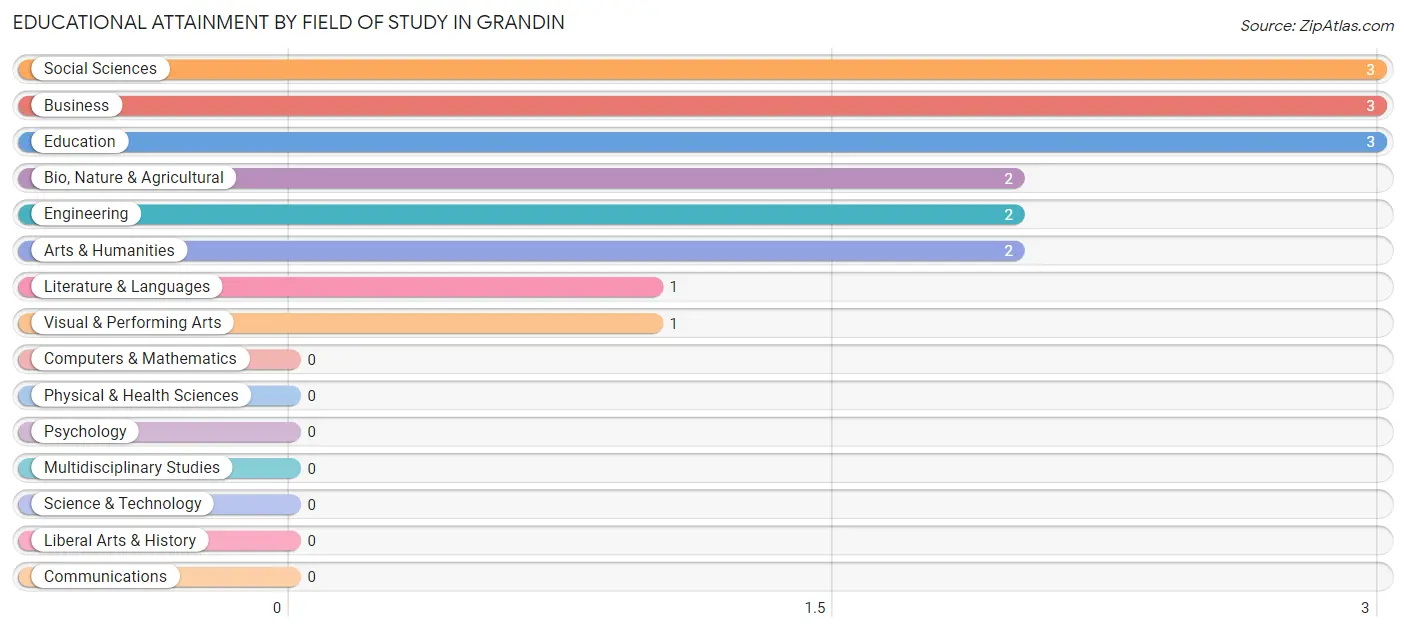
| Field of Study | # Graduates | % Graduates |
| Computers & Mathematics | 0 | 0.0% |
| Bio, Nature & Agricultural | 2 | 11.8% |
| Physical & Health Sciences | 0 | 0.0% |
| Psychology | 0 | 0.0% |
| Social Sciences | 3 | 17.6% |
| Engineering | 2 | 11.8% |
| Multidisciplinary Studies | 0 | 0.0% |
| Science & Technology | 0 | 0.0% |
| Business | 3 | 17.6% |
| Education | 3 | 17.6% |
| Literature & Languages | 1 | 5.9% |
| Liberal Arts & History | 0 | 0.0% |
| Visual & Performing Arts | 1 | 5.9% |
| Communications | 0 | 0.0% |
| Arts & Humanities | 2 | 11.8% |
| Total | 17 | 100.0% |
Transportation & Commute in Grandin
Vehicle Availability by Sex in Grandin
The most prevalent vehicle ownership categories in Grandin are males with 3 vehicles (18, accounting for 40.9%) and females with 3 vehicles (11, making up 54.5%).
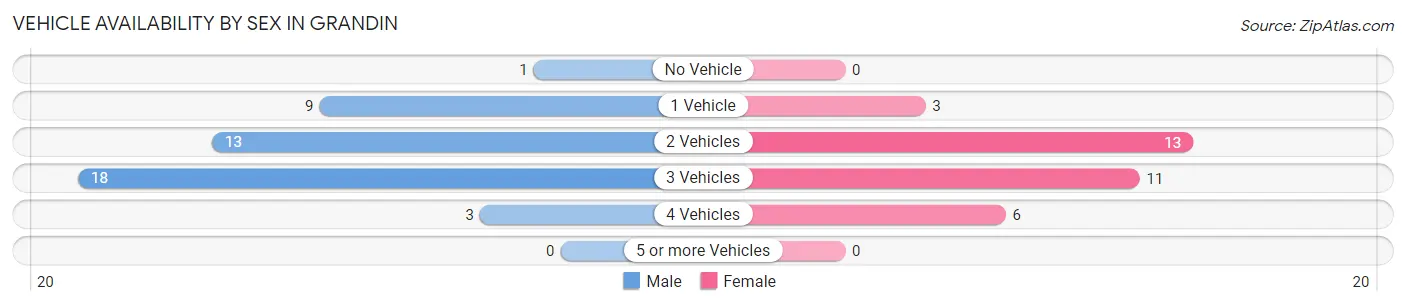
| Vehicles Available | Male | Female |
| No Vehicle | 1 (2.3%) | 0 (0.0%) |
| 1 Vehicle | 9 (20.4%) | 3 (9.1%) |
| 2 Vehicles | 13 (29.5%) | 13 (39.4%) |
| 3 Vehicles | 18 (40.9%) | 11 (33.3%) |
| 4 Vehicles | 3 (6.8%) | 6 (18.2%) |
| 5 or more Vehicles | 0 (0.0%) | 0 (0.0%) |
| Total | 44 (100.0%) | 33 (100.0%) |
Commute Time in Grandin
The most frequently occuring commute durations in Grandin are 30 to 34 minutes (18 commuters, 24.3%), 45 to 59 minutes (16 commuters, 21.6%), and 5 to 9 minutes (10 commuters, 13.5%).
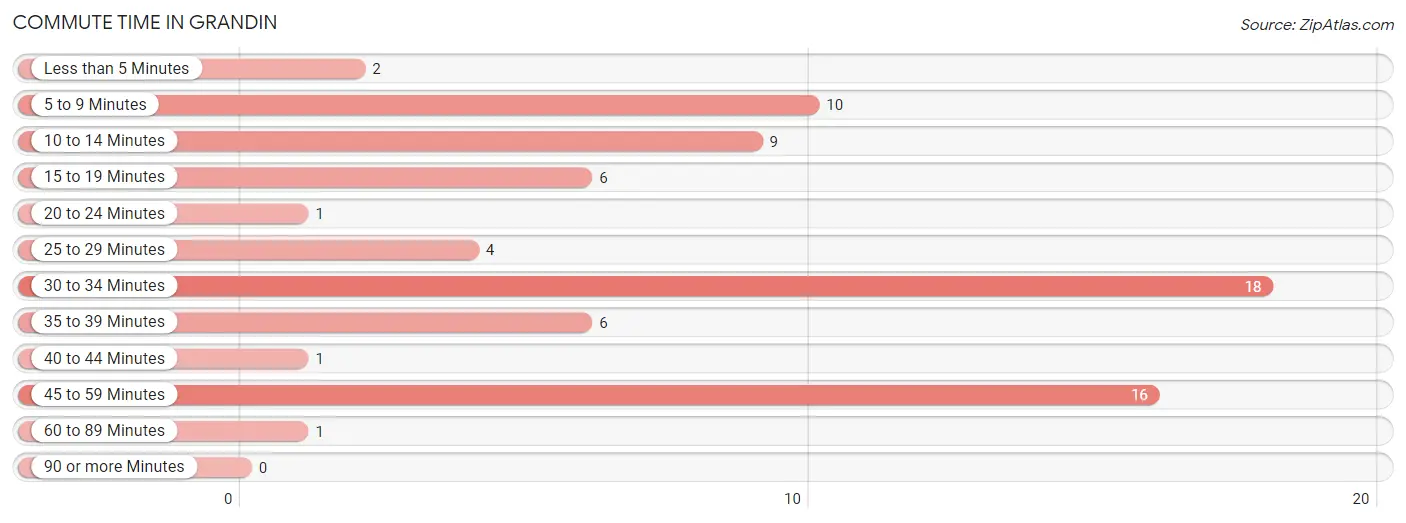
| Commute Time | # Commuters | % Commuters |
| Less than 5 Minutes | 2 | 2.7% |
| 5 to 9 Minutes | 10 | 13.5% |
| 10 to 14 Minutes | 9 | 12.2% |
| 15 to 19 Minutes | 6 | 8.1% |
| 20 to 24 Minutes | 1 | 1.3% |
| 25 to 29 Minutes | 4 | 5.4% |
| 30 to 34 Minutes | 18 | 24.3% |
| 35 to 39 Minutes | 6 | 8.1% |
| 40 to 44 Minutes | 1 | 1.3% |
| 45 to 59 Minutes | 16 | 21.6% |
| 60 to 89 Minutes | 1 | 1.3% |
| 90 or more Minutes | 0 | 0.0% |
Commute Time by Sex in Grandin
The most common commute times in Grandin are 5 to 9 minutes (9 commuters, 20.4%) for males and 30 to 34 minutes (10 commuters, 33.3%) for females.
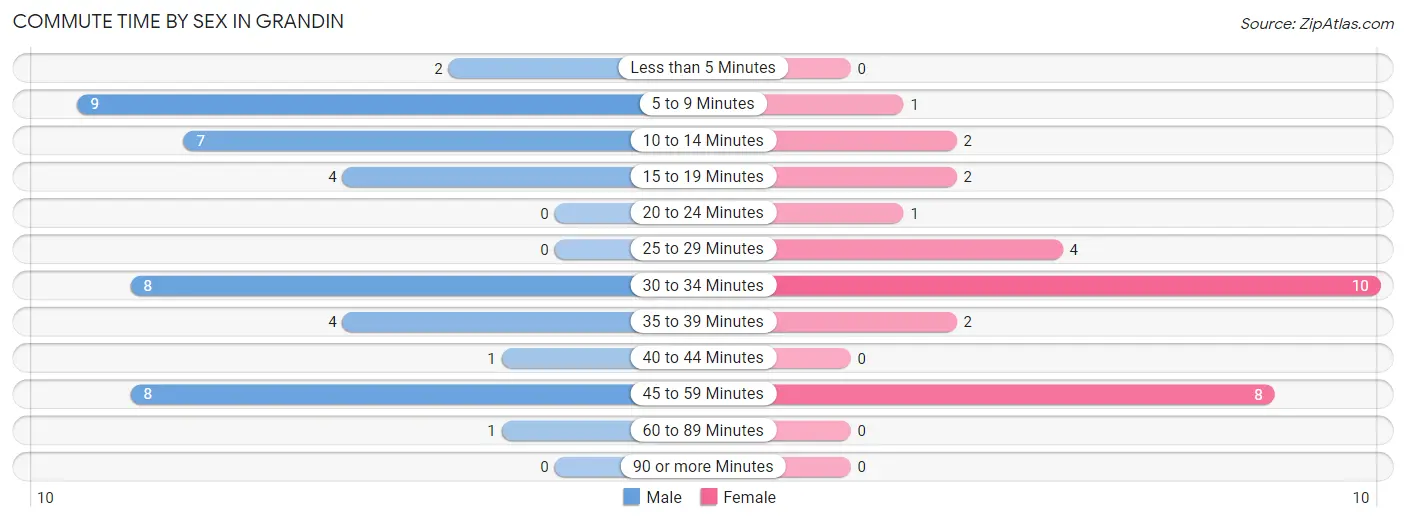
| Commute Time | Male | Female |
| Less than 5 Minutes | 2 (4.5%) | 0 (0.0%) |
| 5 to 9 Minutes | 9 (20.4%) | 1 (3.3%) |
| 10 to 14 Minutes | 7 (15.9%) | 2 (6.7%) |
| 15 to 19 Minutes | 4 (9.1%) | 2 (6.7%) |
| 20 to 24 Minutes | 0 (0.0%) | 1 (3.3%) |
| 25 to 29 Minutes | 0 (0.0%) | 4 (13.3%) |
| 30 to 34 Minutes | 8 (18.2%) | 10 (33.3%) |
| 35 to 39 Minutes | 4 (9.1%) | 2 (6.7%) |
| 40 to 44 Minutes | 1 (2.3%) | 0 (0.0%) |
| 45 to 59 Minutes | 8 (18.2%) | 8 (26.7%) |
| 60 to 89 Minutes | 1 (2.3%) | 0 (0.0%) |
| 90 or more Minutes | 0 (0.0%) | 0 (0.0%) |
Time of Departure to Work by Sex in Grandin
The most frequent times of departure to work in Grandin are 6:30 AM to 6:59 AM (12, 27.3%) for males and 7:00 AM to 7:29 AM (8, 26.7%) for females.
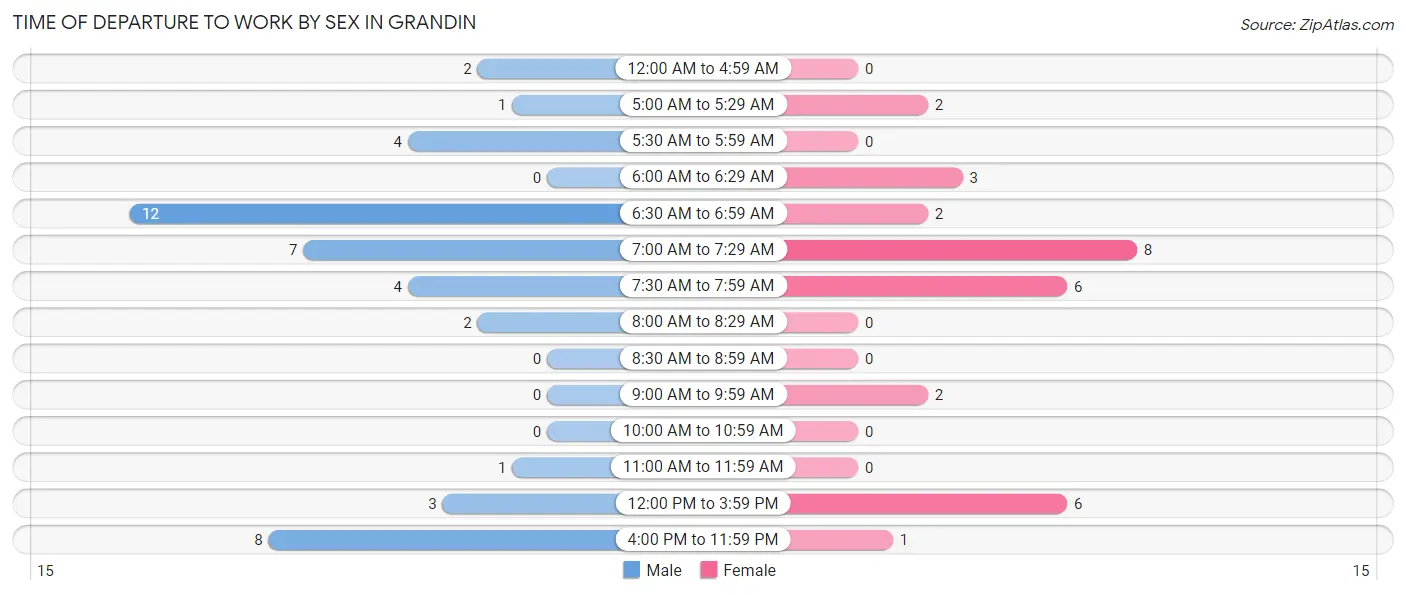
| Time of Departure | Male | Female |
| 12:00 AM to 4:59 AM | 2 (4.5%) | 0 (0.0%) |
| 5:00 AM to 5:29 AM | 1 (2.3%) | 2 (6.7%) |
| 5:30 AM to 5:59 AM | 4 (9.1%) | 0 (0.0%) |
| 6:00 AM to 6:29 AM | 0 (0.0%) | 3 (10.0%) |
| 6:30 AM to 6:59 AM | 12 (27.3%) | 2 (6.7%) |
| 7:00 AM to 7:29 AM | 7 (15.9%) | 8 (26.7%) |
| 7:30 AM to 7:59 AM | 4 (9.1%) | 6 (20.0%) |
| 8:00 AM to 8:29 AM | 2 (4.5%) | 0 (0.0%) |
| 8:30 AM to 8:59 AM | 0 (0.0%) | 0 (0.0%) |
| 9:00 AM to 9:59 AM | 0 (0.0%) | 2 (6.7%) |
| 10:00 AM to 10:59 AM | 0 (0.0%) | 0 (0.0%) |
| 11:00 AM to 11:59 AM | 1 (2.3%) | 0 (0.0%) |
| 12:00 PM to 3:59 PM | 3 (6.8%) | 6 (20.0%) |
| 4:00 PM to 11:59 PM | 8 (18.2%) | 1 (3.3%) |
| Total | 44 (100.0%) | 30 (100.0%) |
Housing Occupancy in Grandin
Occupancy by Ownership in Grandin
Of the total 68 dwellings in Grandin, owner-occupied units account for 59 (86.8%), while renter-occupied units make up 9 (13.2%).
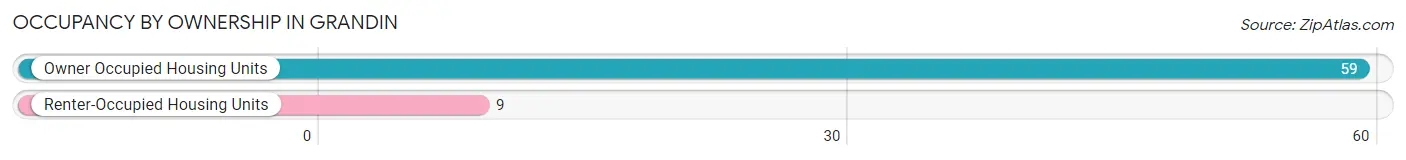
| Occupancy | # Housing Units | % Housing Units |
| Owner Occupied Housing Units | 59 | 86.8% |
| Renter-Occupied Housing Units | 9 | 13.2% |
| Total Occupied Housing Units | 68 | 100.0% |
Occupancy by Household Size in Grandin
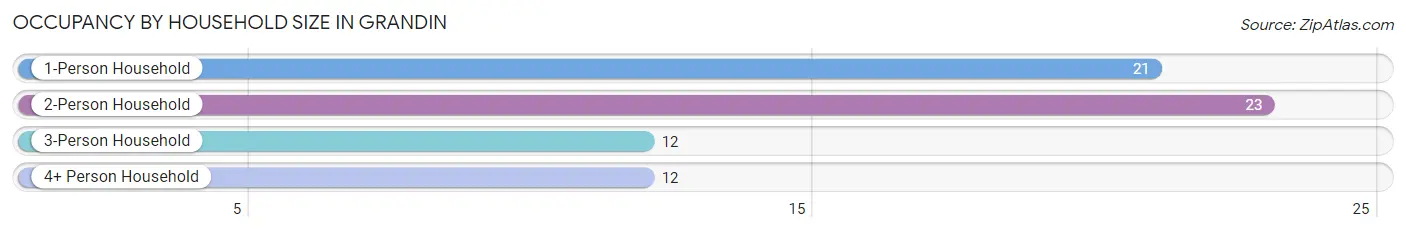
| Household Size | # Housing Units | % Housing Units |
| 1-Person Household | 21 | 30.9% |
| 2-Person Household | 23 | 33.8% |
| 3-Person Household | 12 | 17.6% |
| 4+ Person Household | 12 | 17.6% |
| Total Housing Units | 68 | 100.0% |
Occupancy by Ownership by Household Size in Grandin
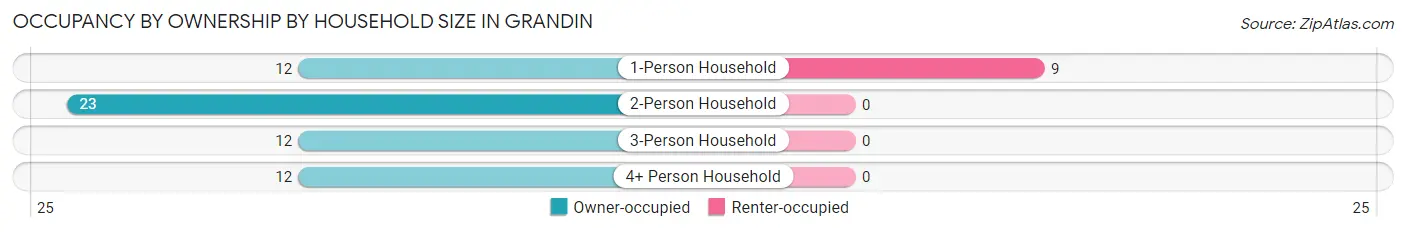
| Household Size | Owner-occupied | Renter-occupied |
| 1-Person Household | 12 (57.1%) | 9 (42.9%) |
| 2-Person Household | 23 (100.0%) | 0 (0.0%) |
| 3-Person Household | 12 (100.0%) | 0 (0.0%) |
| 4+ Person Household | 12 (100.0%) | 0 (0.0%) |
| Total Housing Units | 59 (86.8%) | 9 (13.2%) |
Occupancy by Educational Attainment in Grandin
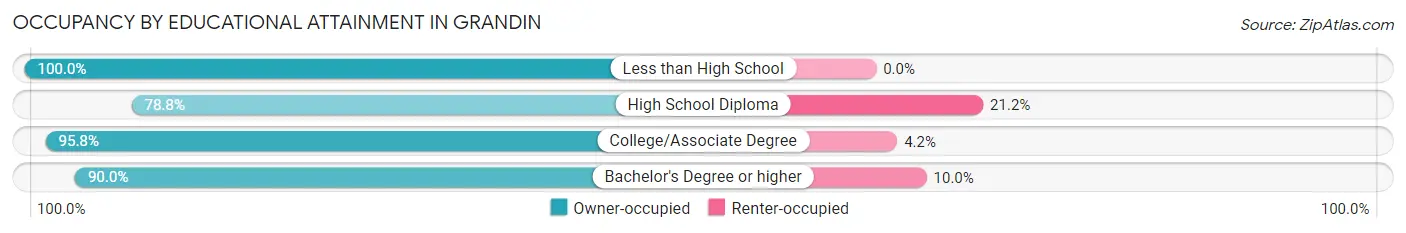
| Household Size | Owner-occupied | Renter-occupied |
| Less than High School | 1 (100.0%) | 0 (0.0%) |
| High School Diploma | 26 (78.8%) | 7 (21.2%) |
| College/Associate Degree | 23 (95.8%) | 1 (4.2%) |
| Bachelor's Degree or higher | 9 (90.0%) | 1 (10.0%) |
Occupancy by Age of Householder in Grandin
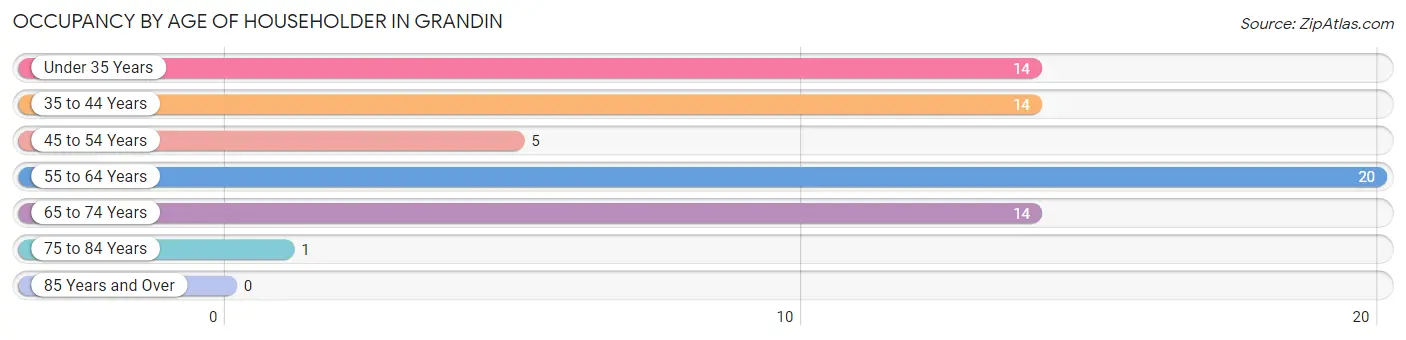
| Age Bracket | # Households | % Households |
| Under 35 Years | 14 | 20.6% |
| 35 to 44 Years | 14 | 20.6% |
| 45 to 54 Years | 5 | 7.3% |
| 55 to 64 Years | 20 | 29.4% |
| 65 to 74 Years | 14 | 20.6% |
| 75 to 84 Years | 1 | 1.5% |
| 85 Years and Over | 0 | 0.0% |
| Total | 68 | 100.0% |
Housing Finances in Grandin
Median Income by Occupancy in Grandin
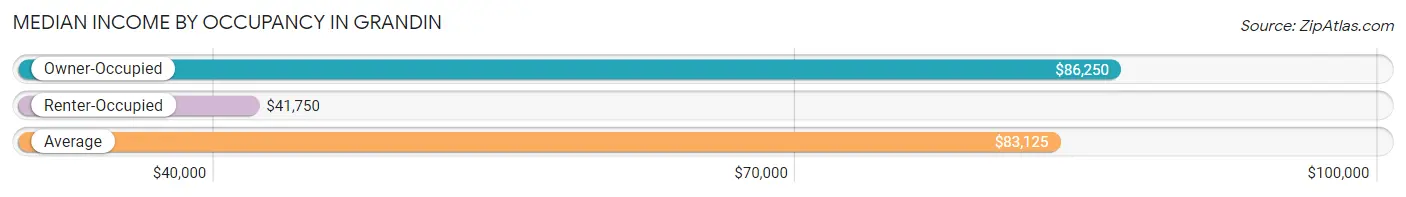
| Occupancy Type | # Households | Median Income |
| Owner-Occupied | 59 (86.8%) | $86,250 |
| Renter-Occupied | 9 (13.2%) | $41,750 |
| Average | 68 (100.0%) | $83,125 |
Occupancy by Householder Income Bracket in Grandin
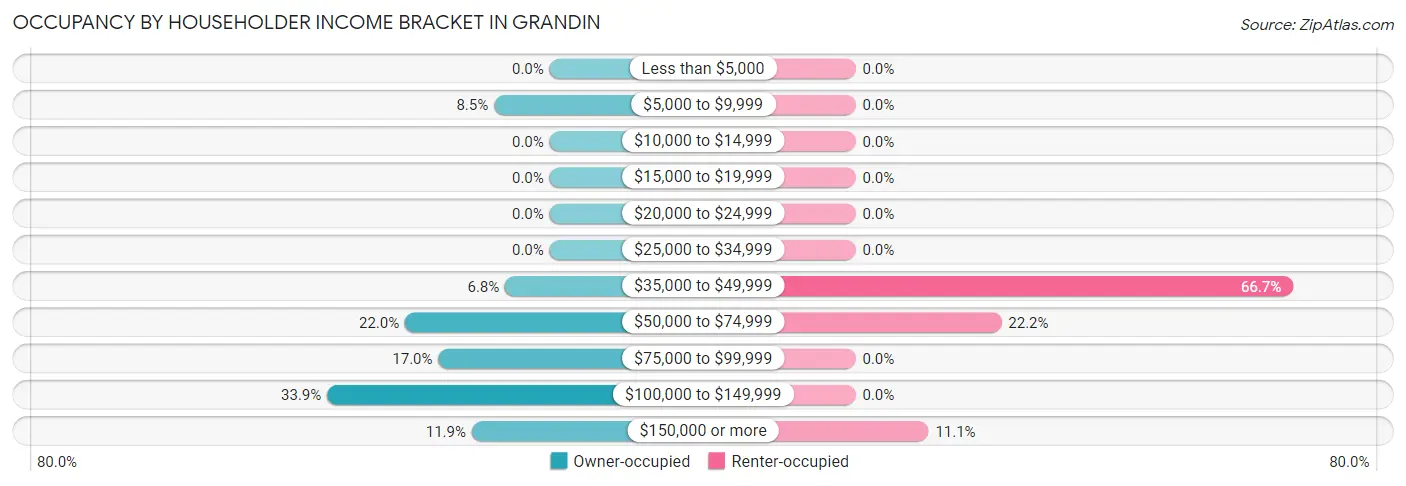
| Income Bracket | Owner-occupied | Renter-occupied |
| Less than $5,000 | 0 (0.0%) | 0 (0.0%) |
| $5,000 to $9,999 | 5 (8.5%) | 0 (0.0%) |
| $10,000 to $14,999 | 0 (0.0%) | 0 (0.0%) |
| $15,000 to $19,999 | 0 (0.0%) | 0 (0.0%) |
| $20,000 to $24,999 | 0 (0.0%) | 0 (0.0%) |
| $25,000 to $34,999 | 0 (0.0%) | 0 (0.0%) |
| $35,000 to $49,999 | 4 (6.8%) | 6 (66.7%) |
| $50,000 to $74,999 | 13 (22.0%) | 2 (22.2%) |
| $75,000 to $99,999 | 10 (17.0%) | 0 (0.0%) |
| $100,000 to $149,999 | 20 (33.9%) | 0 (0.0%) |
| $150,000 or more | 7 (11.9%) | 1 (11.1%) |
| Total | 59 (100.0%) | 9 (100.0%) |
Monthly Housing Cost Tiers in Grandin
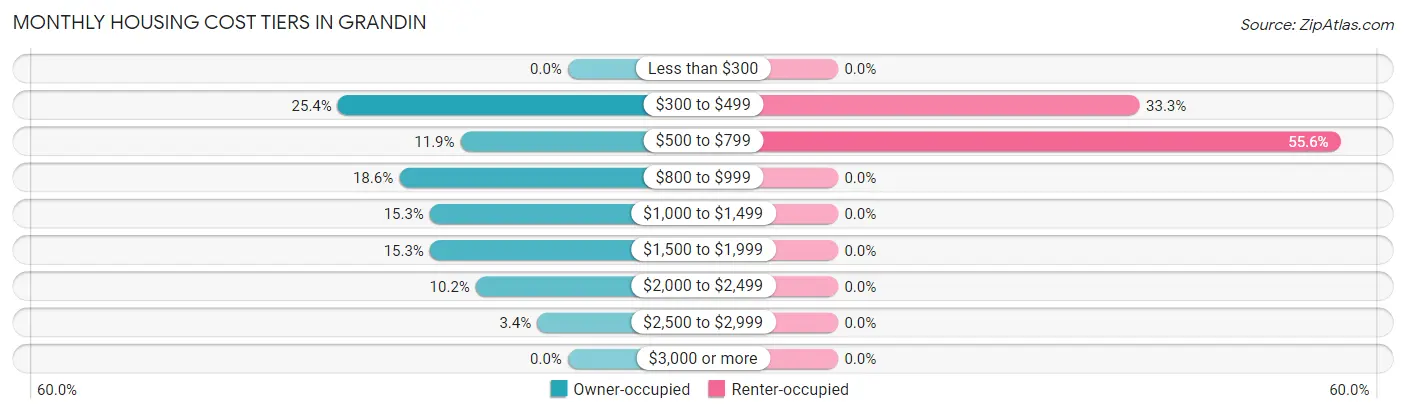
| Monthly Cost | Owner-occupied | Renter-occupied |
| Less than $300 | 0 (0.0%) | 0 (0.0%) |
| $300 to $499 | 15 (25.4%) | 3 (33.3%) |
| $500 to $799 | 7 (11.9%) | 5 (55.6%) |
| $800 to $999 | 11 (18.6%) | 0 (0.0%) |
| $1,000 to $1,499 | 9 (15.2%) | 0 (0.0%) |
| $1,500 to $1,999 | 9 (15.2%) | 0 (0.0%) |
| $2,000 to $2,499 | 6 (10.2%) | 0 (0.0%) |
| $2,500 to $2,999 | 2 (3.4%) | 0 (0.0%) |
| $3,000 or more | 0 (0.0%) | 0 (0.0%) |
| Total | 59 (100.0%) | 9 (100.0%) |
Physical Housing Characteristics in Grandin
Housing Structures in Grandin
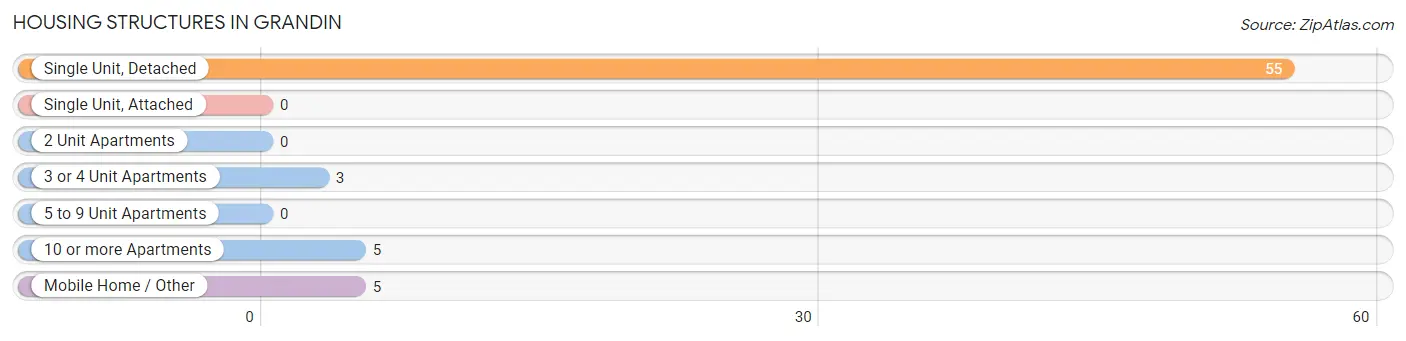
| Structure Type | # Housing Units | % Housing Units |
| Single Unit, Detached | 55 | 80.9% |
| Single Unit, Attached | 0 | 0.0% |
| 2 Unit Apartments | 0 | 0.0% |
| 3 or 4 Unit Apartments | 3 | 4.4% |
| 5 to 9 Unit Apartments | 0 | 0.0% |
| 10 or more Apartments | 5 | 7.3% |
| Mobile Home / Other | 5 | 7.3% |
| Total | 68 | 100.0% |
Housing Structures by Occupancy in Grandin
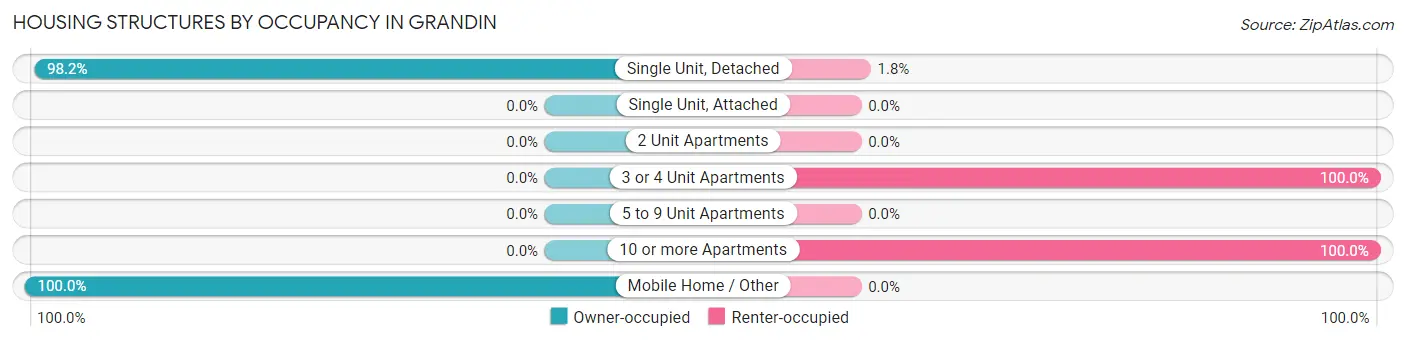
| Structure Type | Owner-occupied | Renter-occupied |
| Single Unit, Detached | 54 (98.2%) | 1 (1.8%) |
| Single Unit, Attached | 0 (0.0%) | 0 (0.0%) |
| 2 Unit Apartments | 0 (0.0%) | 0 (0.0%) |
| 3 or 4 Unit Apartments | 0 (0.0%) | 3 (100.0%) |
| 5 to 9 Unit Apartments | 0 (0.0%) | 0 (0.0%) |
| 10 or more Apartments | 0 (0.0%) | 5 (100.0%) |
| Mobile Home / Other | 5 (100.0%) | 0 (0.0%) |
| Total | 59 (86.8%) | 9 (13.2%) |
Housing Structures by Number of Rooms in Grandin
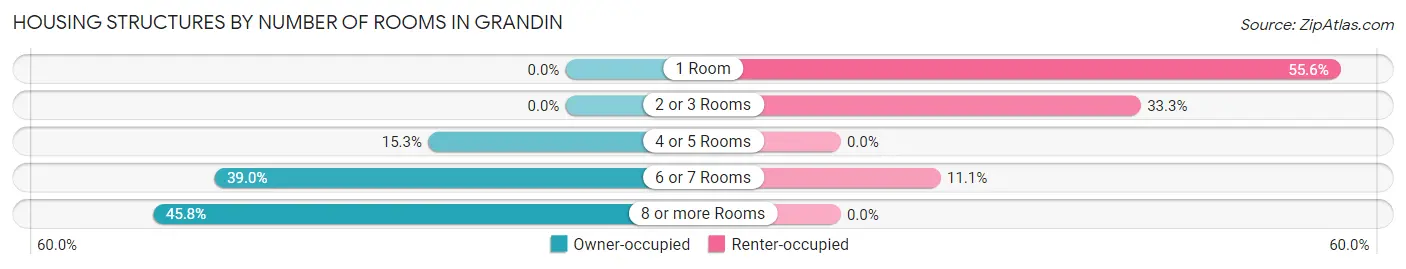
| Number of Rooms | Owner-occupied | Renter-occupied |
| 1 Room | 0 (0.0%) | 5 (55.6%) |
| 2 or 3 Rooms | 0 (0.0%) | 3 (33.3%) |
| 4 or 5 Rooms | 9 (15.2%) | 0 (0.0%) |
| 6 or 7 Rooms | 23 (39.0%) | 1 (11.1%) |
| 8 or more Rooms | 27 (45.8%) | 0 (0.0%) |
| Total | 59 (100.0%) | 9 (100.0%) |
Housing Structure by Heating Type in Grandin
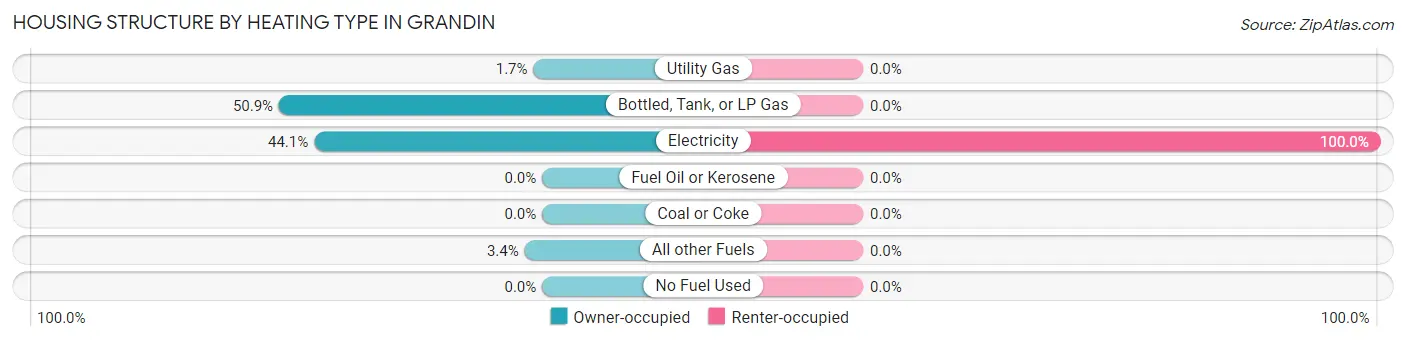
| Heating Type | Owner-occupied | Renter-occupied |
| Utility Gas | 1 (1.7%) | 0 (0.0%) |
| Bottled, Tank, or LP Gas | 30 (50.8%) | 0 (0.0%) |
| Electricity | 26 (44.1%) | 9 (100.0%) |
| Fuel Oil or Kerosene | 0 (0.0%) | 0 (0.0%) |
| Coal or Coke | 0 (0.0%) | 0 (0.0%) |
| All other Fuels | 2 (3.4%) | 0 (0.0%) |
| No Fuel Used | 0 (0.0%) | 0 (0.0%) |
| Total | 59 (100.0%) | 9 (100.0%) |
Household Vehicle Usage in Grandin
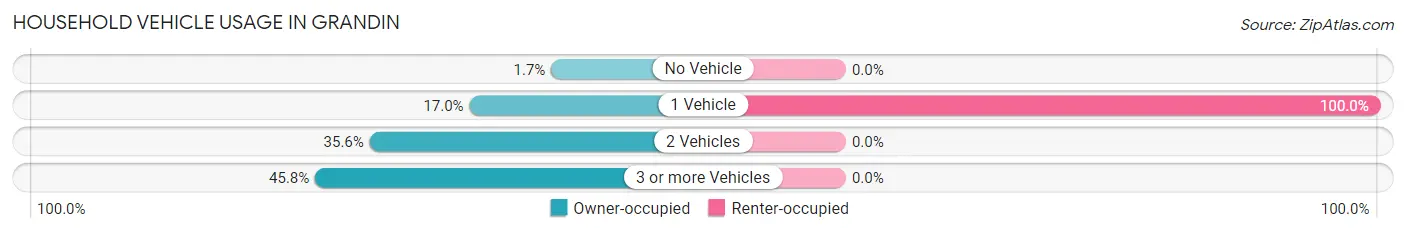
| Vehicles per Household | Owner-occupied | Renter-occupied |
| No Vehicle | 1 (1.7%) | 0 (0.0%) |
| 1 Vehicle | 10 (17.0%) | 9 (100.0%) |
| 2 Vehicles | 21 (35.6%) | 0 (0.0%) |
| 3 or more Vehicles | 27 (45.8%) | 0 (0.0%) |
| Total | 59 (100.0%) | 9 (100.0%) |
Real Estate & Mortgages in Grandin
Real Estate and Mortgage Overview in Grandin
| Characteristic | Without Mortgage | With Mortgage |
| Housing Units | 26 | 33 |
| Median Property Value | $117,200 | $192,500 |
| Median Household Income | $61,250 | $5 |
| Monthly Housing Costs | $467 | $0 |
| Real Estate Taxes | $967 | $0 |
Property Value by Mortgage Status in Grandin
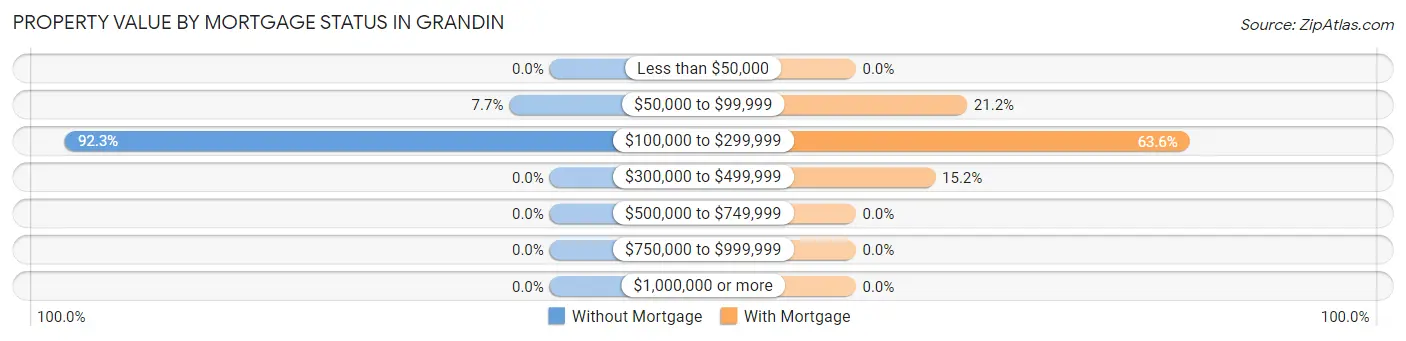
| Property Value | Without Mortgage | With Mortgage |
| Less than $50,000 | 0 (0.0%) | 0 (0.0%) |
| $50,000 to $99,999 | 2 (7.7%) | 7 (21.2%) |
| $100,000 to $299,999 | 24 (92.3%) | 21 (63.6%) |
| $300,000 to $499,999 | 0 (0.0%) | 5 (15.1%) |
| $500,000 to $749,999 | 0 (0.0%) | 0 (0.0%) |
| $750,000 to $999,999 | 0 (0.0%) | 0 (0.0%) |
| $1,000,000 or more | 0 (0.0%) | 0 (0.0%) |
| Total | 26 (100.0%) | 33 (100.0%) |
Household Income by Mortgage Status in Grandin
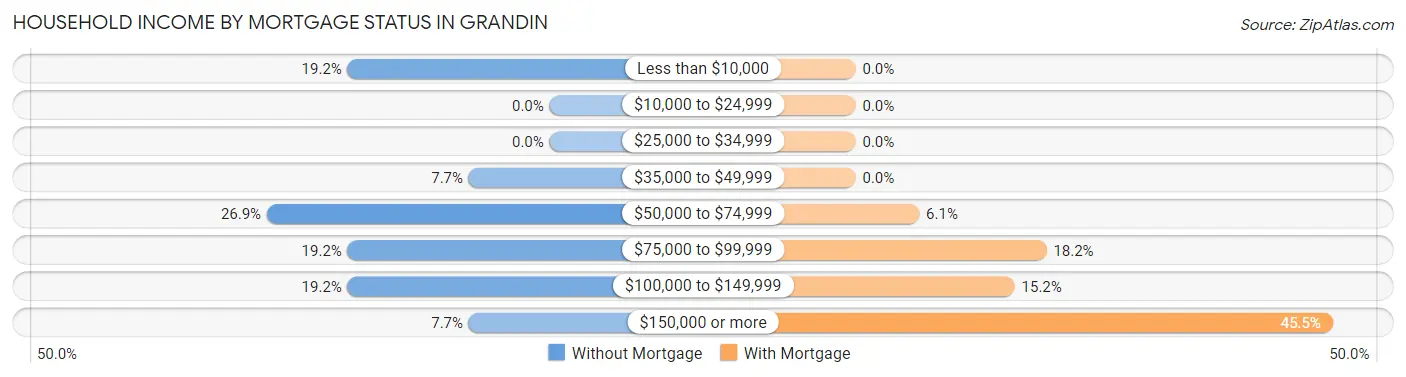
| Household Income | Without Mortgage | With Mortgage |
| Less than $10,000 | 5 (19.2%) | 0 (0.0%) |
| $10,000 to $24,999 | 0 (0.0%) | 0 (0.0%) |
| $25,000 to $34,999 | 0 (0.0%) | 0 (0.0%) |
| $35,000 to $49,999 | 2 (7.7%) | 0 (0.0%) |
| $50,000 to $74,999 | 7 (26.9%) | 2 (6.1%) |
| $75,000 to $99,999 | 5 (19.2%) | 6 (18.2%) |
| $100,000 to $149,999 | 5 (19.2%) | 5 (15.1%) |
| $150,000 or more | 2 (7.7%) | 15 (45.5%) |
| Total | 26 (100.0%) | 33 (100.0%) |
Property Value to Household Income Ratio in Grandin
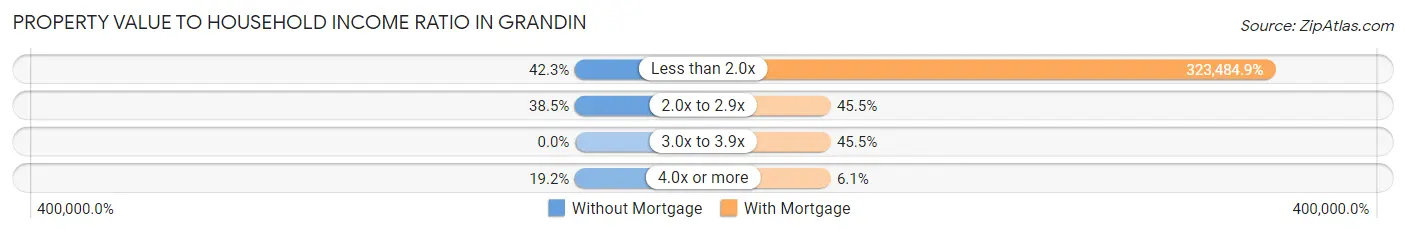
| Value-to-Income Ratio | Without Mortgage | With Mortgage |
| Less than 2.0x | 11 (42.3%) | 106,750 (323,484.9%) |
| 2.0x to 2.9x | 10 (38.5%) | 15 (45.5%) |
| 3.0x to 3.9x | 0 (0.0%) | 15 (45.5%) |
| 4.0x or more | 5 (19.2%) | 2 (6.1%) |
| Total | 26 (100.0%) | 33 (100.0%) |
Real Estate Taxes by Mortgage Status in Grandin
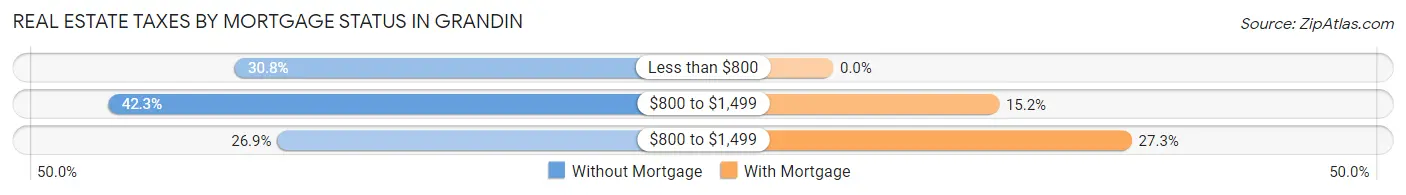
| Property Taxes | Without Mortgage | With Mortgage |
| Less than $800 | 8 (30.8%) | 0 (0.0%) |
| $800 to $1,499 | 11 (42.3%) | 5 (15.1%) |
| $800 to $1,499 | 7 (26.9%) | 9 (27.3%) |
| Total | 26 (100.0%) | 33 (100.0%) |
Health & Disability in Grandin
Health Insurance Coverage by Age in Grandin
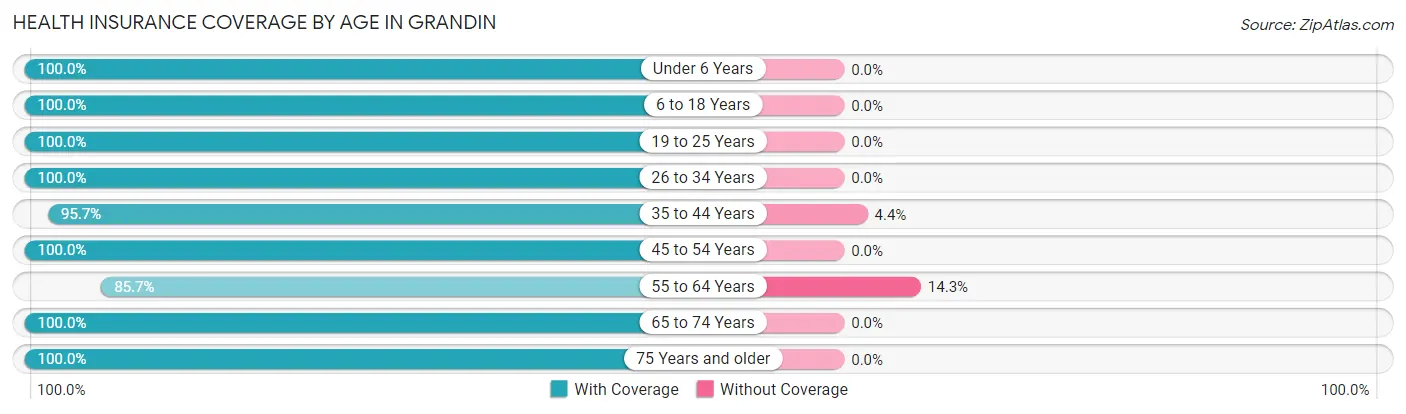
| Age Bracket | With Coverage | Without Coverage |
| Under 6 Years | 8 (100.0%) | 0 (0.0%) |
| 6 to 18 Years | 30 (100.0%) | 0 (0.0%) |
| 19 to 25 Years | 7 (100.0%) | 0 (0.0%) |
| 26 to 34 Years | 14 (100.0%) | 0 (0.0%) |
| 35 to 44 Years | 22 (95.7%) | 1 (4.3%) |
| 45 to 54 Years | 9 (100.0%) | 0 (0.0%) |
| 55 to 64 Years | 30 (85.7%) | 5 (14.3%) |
| 65 to 74 Years | 19 (100.0%) | 0 (0.0%) |
| 75 Years and older | 3 (100.0%) | 0 (0.0%) |
| Total | 142 (96.0%) | 6 (4.1%) |
Health Insurance Coverage by Citizenship Status in Grandin
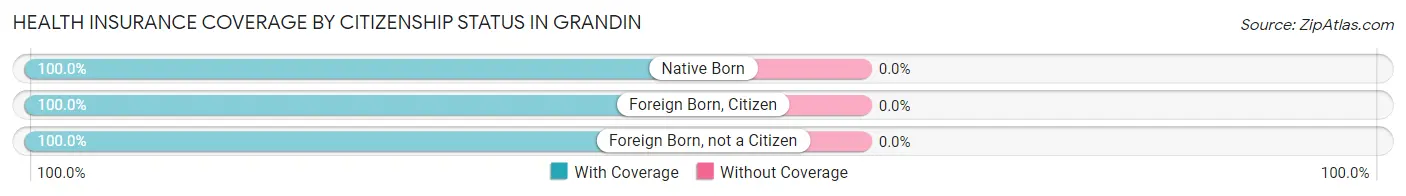
| Citizenship Status | With Coverage | Without Coverage |
| Native Born | 8 (100.0%) | 0 (0.0%) |
| Foreign Born, Citizen | 30 (100.0%) | 0 (0.0%) |
| Foreign Born, not a Citizen | 7 (100.0%) | 0 (0.0%) |
Health Insurance Coverage by Household Income in Grandin
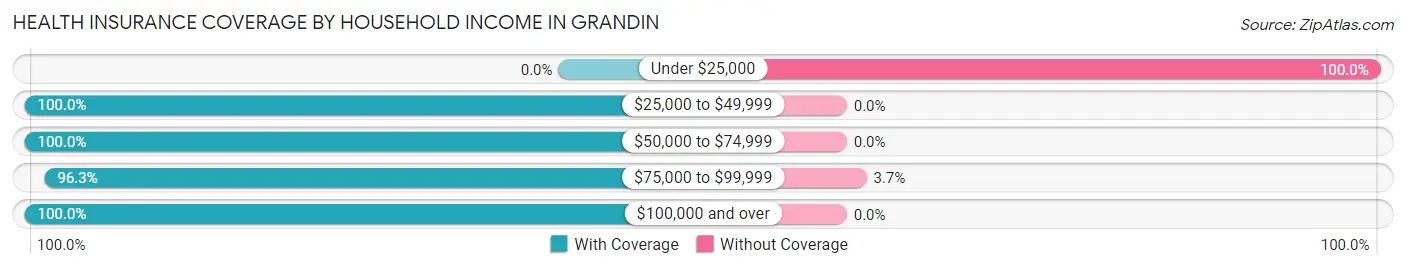
| Household Income | With Coverage | Without Coverage |
| Under $25,000 | 0 (0.0%) | 5 (100.0%) |
| $25,000 to $49,999 | 13 (100.0%) | 0 (0.0%) |
| $50,000 to $74,999 | 31 (100.0%) | 0 (0.0%) |
| $75,000 to $99,999 | 26 (96.3%) | 1 (3.7%) |
| $100,000 and over | 72 (100.0%) | 0 (0.0%) |
Public vs Private Health Insurance Coverage by Age in Grandin
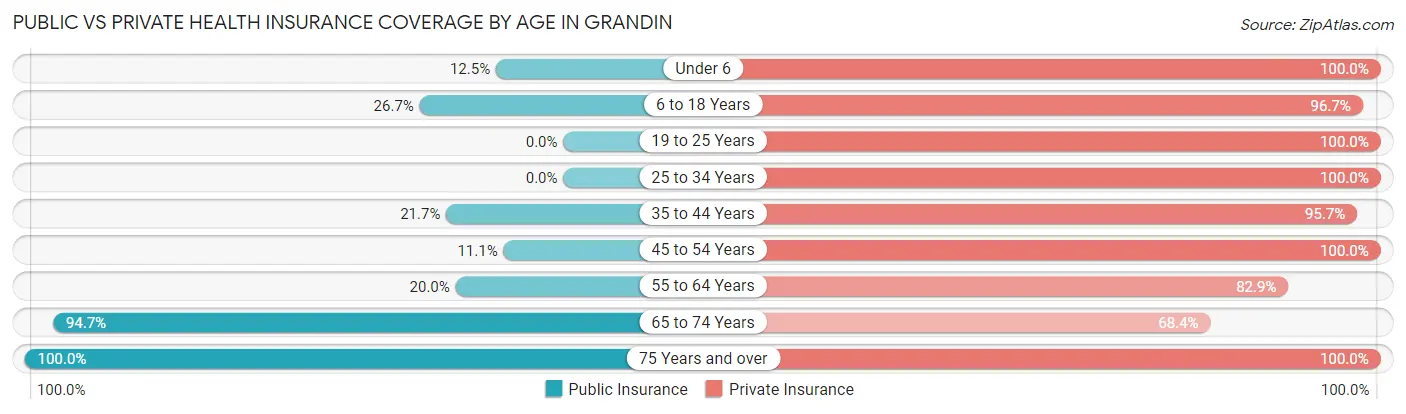
| Age Bracket | Public Insurance | Private Insurance |
| Under 6 | 1 (12.5%) | 8 (100.0%) |
| 6 to 18 Years | 8 (26.7%) | 29 (96.7%) |
| 19 to 25 Years | 0 (0.0%) | 7 (100.0%) |
| 25 to 34 Years | 0 (0.0%) | 14 (100.0%) |
| 35 to 44 Years | 5 (21.7%) | 22 (95.7%) |
| 45 to 54 Years | 1 (11.1%) | 9 (100.0%) |
| 55 to 64 Years | 7 (20.0%) | 29 (82.9%) |
| 65 to 74 Years | 18 (94.7%) | 13 (68.4%) |
| 75 Years and over | 3 (100.0%) | 3 (100.0%) |
| Total | 43 (29.0%) | 134 (90.5%) |
Disability Status by Sex by Age in Grandin
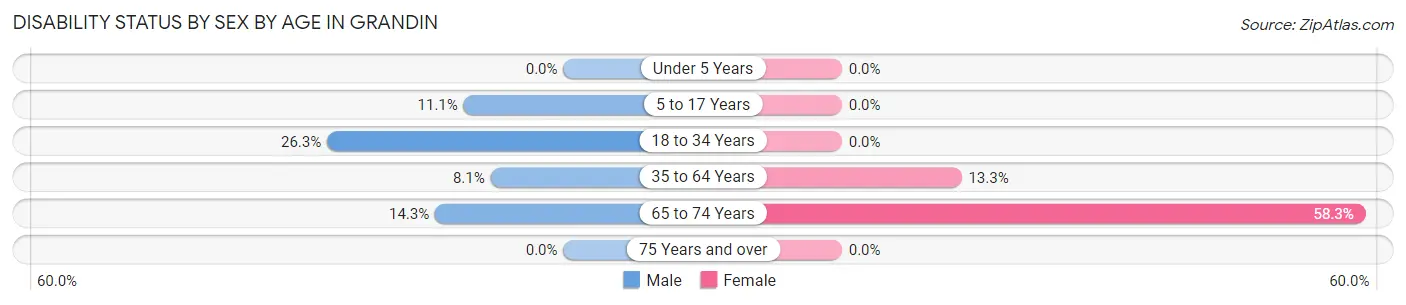
| Age Bracket | Male | Female |
| Under 5 Years | 0 (0.0%) | 0 (0.0%) |
| 5 to 17 Years | 2 (11.1%) | 0 (0.0%) |
| 18 to 34 Years | 5 (26.3%) | 0 (0.0%) |
| 35 to 64 Years | 3 (8.1%) | 4 (13.3%) |
| 65 to 74 Years | 1 (14.3%) | 7 (58.3%) |
| 75 Years and over | 0 (0.0%) | 0 (0.0%) |
Disability Class by Sex by Age in Grandin
Disability Class: Hearing Difficulty
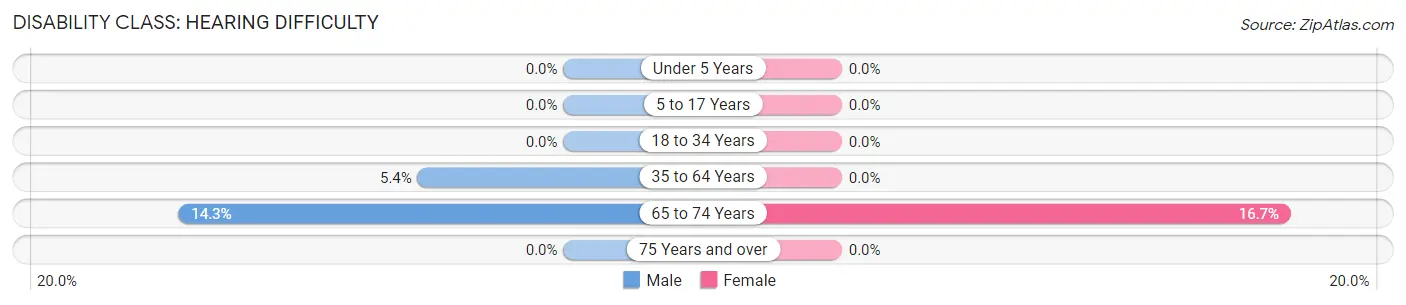
| Age Bracket | Male | Female |
| Under 5 Years | 0 (0.0%) | 0 (0.0%) |
| 5 to 17 Years | 0 (0.0%) | 0 (0.0%) |
| 18 to 34 Years | 0 (0.0%) | 0 (0.0%) |
| 35 to 64 Years | 2 (5.4%) | 0 (0.0%) |
| 65 to 74 Years | 1 (14.3%) | 2 (16.7%) |
| 75 Years and over | 0 (0.0%) | 0 (0.0%) |
Disability Class: Vision Difficulty
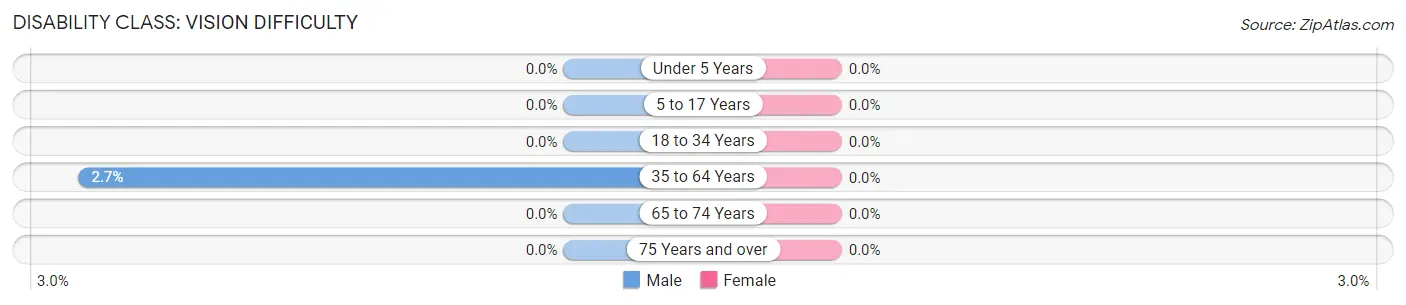
| Age Bracket | Male | Female |
| Under 5 Years | 0 (0.0%) | 0 (0.0%) |
| 5 to 17 Years | 0 (0.0%) | 0 (0.0%) |
| 18 to 34 Years | 0 (0.0%) | 0 (0.0%) |
| 35 to 64 Years | 1 (2.7%) | 0 (0.0%) |
| 65 to 74 Years | 0 (0.0%) | 0 (0.0%) |
| 75 Years and over | 0 (0.0%) | 0 (0.0%) |
Disability Class: Cognitive Difficulty
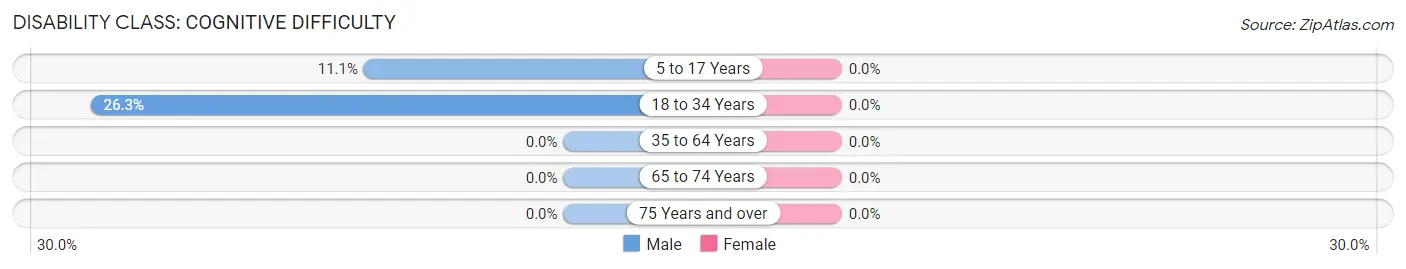
| Age Bracket | Male | Female |
| 5 to 17 Years | 2 (11.1%) | 0 (0.0%) |
| 18 to 34 Years | 5 (26.3%) | 0 (0.0%) |
| 35 to 64 Years | 0 (0.0%) | 0 (0.0%) |
| 65 to 74 Years | 0 (0.0%) | 0 (0.0%) |
| 75 Years and over | 0 (0.0%) | 0 (0.0%) |
Disability Class: Ambulatory Difficulty
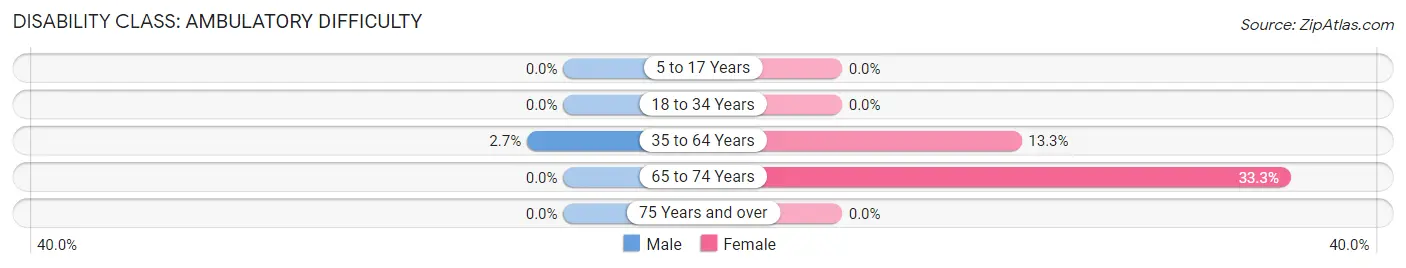
| Age Bracket | Male | Female |
| 5 to 17 Years | 0 (0.0%) | 0 (0.0%) |
| 18 to 34 Years | 0 (0.0%) | 0 (0.0%) |
| 35 to 64 Years | 1 (2.7%) | 4 (13.3%) |
| 65 to 74 Years | 0 (0.0%) | 4 (33.3%) |
| 75 Years and over | 0 (0.0%) | 0 (0.0%) |
Disability Class: Self-Care Difficulty
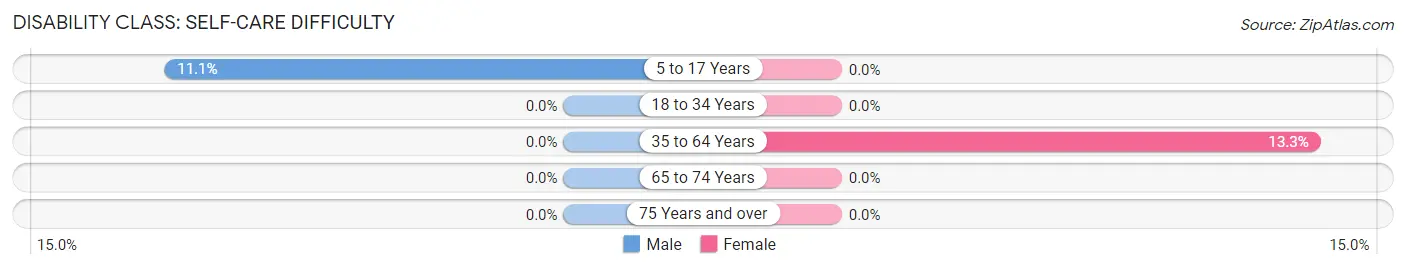
| Age Bracket | Male | Female |
| 5 to 17 Years | 2 (11.1%) | 0 (0.0%) |
| 18 to 34 Years | 0 (0.0%) | 0 (0.0%) |
| 35 to 64 Years | 0 (0.0%) | 4 (13.3%) |
| 65 to 74 Years | 0 (0.0%) | 0 (0.0%) |
| 75 Years and over | 0 (0.0%) | 0 (0.0%) |
Technology Access in Grandin
Computing Device Access in Grandin
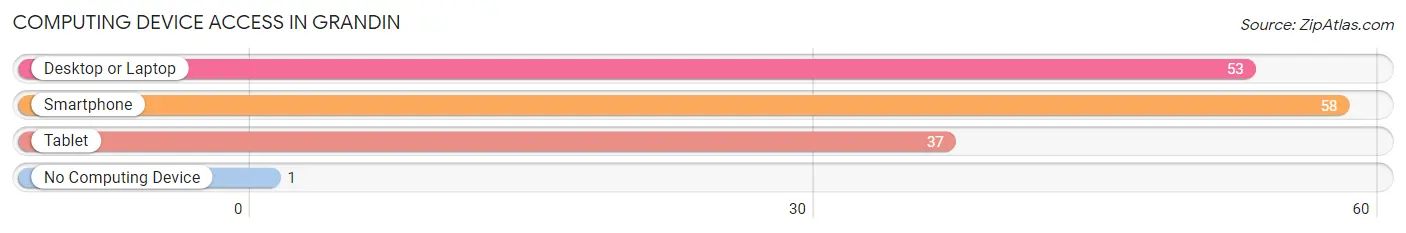
| Device Type | # Households | % Households |
| Desktop or Laptop | 53 | 77.9% |
| Smartphone | 58 | 85.3% |
| Tablet | 37 | 54.4% |
| No Computing Device | 1 | 1.5% |
| Total | 68 | 100.0% |
Internet Access in Grandin
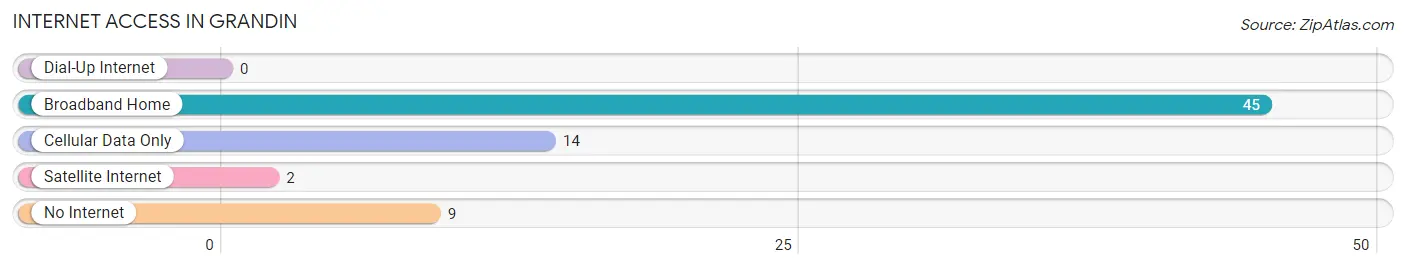
| Internet Type | # Households | % Households |
| Dial-Up Internet | 0 | 0.0% |
| Broadband Home | 45 | 66.2% |
| Cellular Data Only | 14 | 20.6% |
| Satellite Internet | 2 | 2.9% |
| No Internet | 9 | 13.2% |
| Total | 68 | 100.0% |
Grandin Summary
Grandin is a small city located in Traill County, North Dakota. It is situated on the banks of the Red River of the North, approximately 30 miles south of Grand Forks. The city was founded in 1881 and was named after Father Jean-Baptiste Grandin, a French-Canadian missionary who served the area’s Native American population.
Geography
Grandin is located in the Red River Valley, a flat, fertile region of the Great Plains. The city is situated on the banks of the Red River of the North, which forms the border between North Dakota and Minnesota. The city is surrounded by agricultural land, with the nearest major city being Grand Forks, located approximately 30 miles to the north.
Climate
Grandin has a humid continental climate, with cold winters and hot summers. The average annual temperature is around 45°F (7°C), with average highs in the summer reaching around 80°F (27°C) and average lows in the winter dropping to around 0°F (-18°C). The city receives an average of 24 inches (610 mm) of precipitation per year, with most of it falling in the form of snow in the winter months.
Demographics
As of the 2010 census, Grandin had a population of 1,093. The racial makeup of the city was 97.2% White, 0.7% Native American, 0.3% Asian, 0.2% from other races, and 1.6% from two or more races. Hispanic or Latino of any race were 0.7% of the population.
Economy
Grandin’s economy is largely based on agriculture. The city is home to several grain elevators, as well as a number of small businesses. The city is also home to a number of manufacturing companies, including a furniture factory and a plastics plant.
Education
Grandin is served by the Grandin Public School District, which includes an elementary school, a middle school, and a high school. The city is also home to a branch of the North Dakota State College of Science, which offers a variety of degree and certificate programs.
Transportation
Grandin is served by a number of highways, including US Highway 2, US Highway 81, and North Dakota State Highway 18. The city is also served by a number of local bus routes, as well as a regional bus service that connects Grandin to Grand Forks and other nearby cities.
Culture
Grandin is home to a number of cultural attractions, including the Grandin Opera House, which hosts a variety of musical and theatrical performances. The city is also home to a number of parks and recreational areas, including the Grandin City Park, which features a playground, picnic areas, and a walking path.
Grandin is a small city with a rich history and a vibrant culture. The city’s economy is largely based on agriculture, and the city is home to a number of small businesses and manufacturing companies. Grandin is also home to a number of educational and cultural attractions, making it an ideal place to live and work.
Common Questions
What is the Total Population of Grandin?
Total Population of Grandin is 148.
What is the Total Male Population of Grandin?
Total Male Population of Grandin is 82.
What is the Total Female Population of Grandin?
Total Female Population of Grandin is 66.
What is the Ratio of Males per 100 Females in Grandin?
There are 124.24 Males per 100 Females in Grandin.
What is the Ratio of Females per 100 Males in Grandin?
There are 80.49 Females per 100 Males in Grandin.
What is the Median Population Age in Grandin?
Median Population Age in Grandin is 40.0 Years.
What is the Average Family Size in Grandin
Average Family Size in Grandin is 2.7 People.
What is the Average Household Size in Grandin
Average Household Size in Grandin is 2.2 People.
What is Per Capita Income in Grandin?
Per Capita income in Grandin is $38,247.
What is the Median Family Income in Grandin?
Median Family Income in Grandin is $105,625.
What is the Median Household income in Grandin?
Median Household Income in Grandin is $83,125.
What is Income or Wage Gap in Grandin?
Income or Wage Gap in Grandin is 50.0%.
Women in Grandin earn 50.0 cents for every dollar earned by a man.
What is Inequality or Gini Index in Grandin?
Inequality or Gini Index in Grandin is 0.31.
How Large is the Labor Force in Grandin?
There are 86 People in the Labor Forcein in Grandin.
What is the Percentage of People in the Labor Force in Grandin?
72.9% of People are in the Labor Force in Grandin.
What is the Unemployment Rate in Grandin?
Unemployment Rate in Grandin is 2.3%.