Chicopee, KS
Chicopee Map
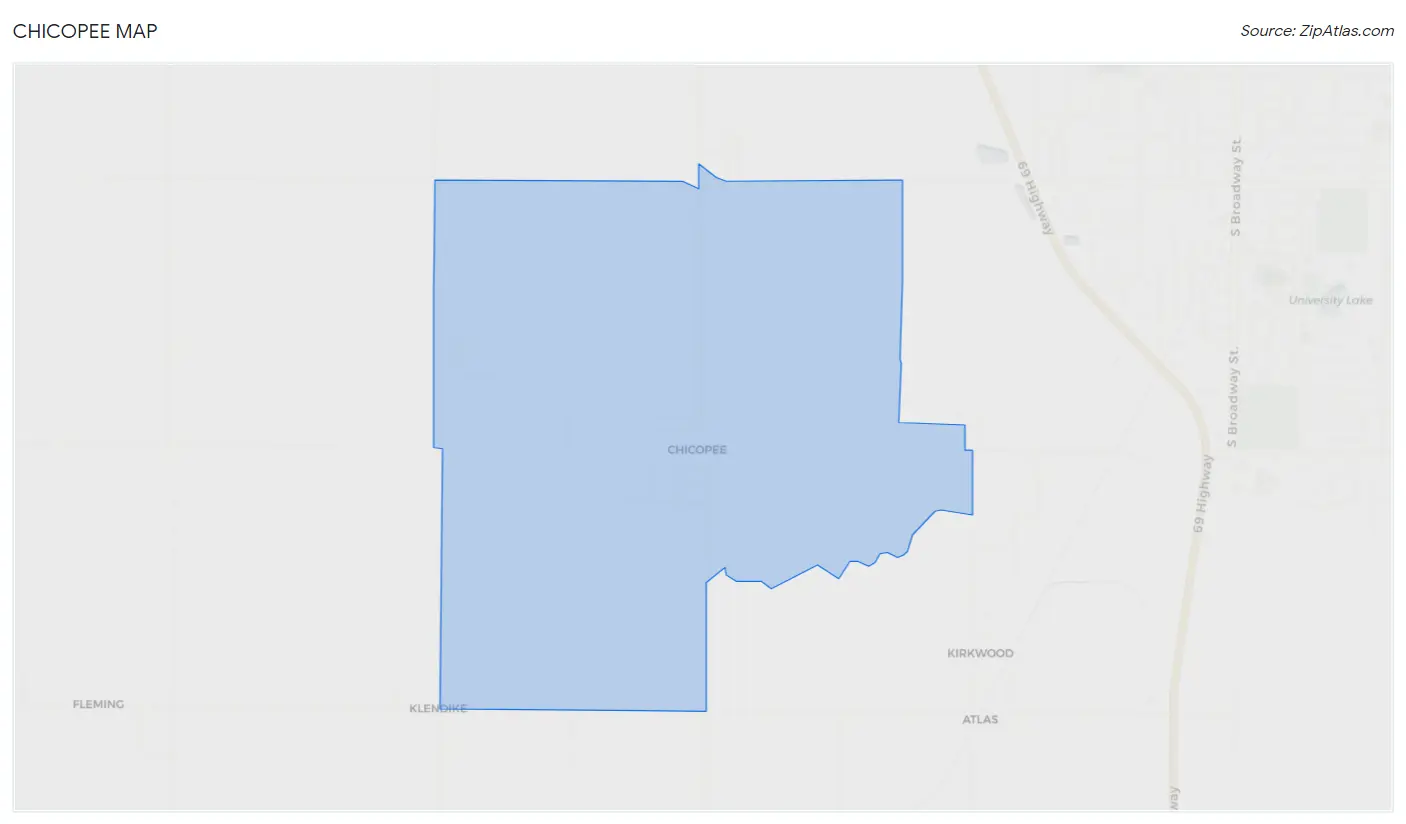
Chicopee Overview
388
TOTAL POPULATION
187
MALE POPULATION
201
FEMALE POPULATION
93.03
MALES / 100 FEMALES
107.49
FEMALES / 100 MALES
48.3
MEDIAN AGE
2.5
AVG FAMILY SIZE
2.3
AVG HOUSEHOLD SIZE
$77,178
PER CAPITA INCOME
$138,618
AVG FAMILY INCOME
$140,000
AVG HOUSEHOLD INCOME
0.31
INEQUALITY / GINI INDEX
231
LABOR FORCE [ PEOPLE ]
65.6%
PERCENT IN LABOR FORCE
Race in Chicopee
The most populous races in Chicopee are , and White / Caucasian (388 | 100.0%).
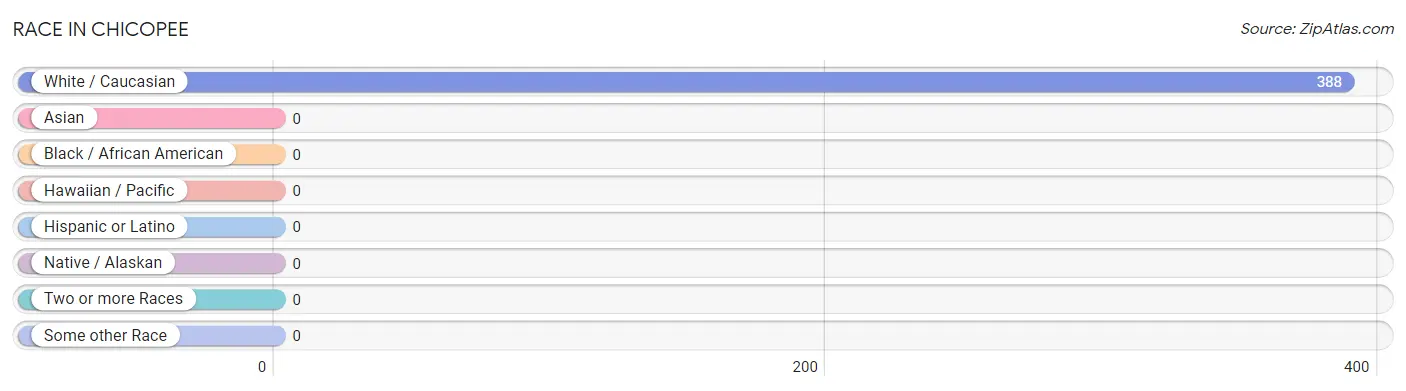
| Race | # Population | % Population |
| Asian | 0 | 0.0% |
| Black / African American | 0 | 0.0% |
| Hawaiian / Pacific | 0 | 0.0% |
| Hispanic or Latino | 0 | 0.0% |
| Native / Alaskan | 0 | 0.0% |
| White / Caucasian | 388 | 100.0% |
| Two or more Races | 0 | 0.0% |
| Some other Race | 0 | 0.0% |
| Total | 388 | 100.0% |
Ancestry in Chicopee
The most populous ancestries reported in Chicopee are English (127 | 32.7%), German (125 | 32.2%), Irish (67 | 17.3%), Italian (61 | 15.7%), and Scotch-Irish (56 | 14.4%), together accounting for 112.4% of all Chicopee residents.
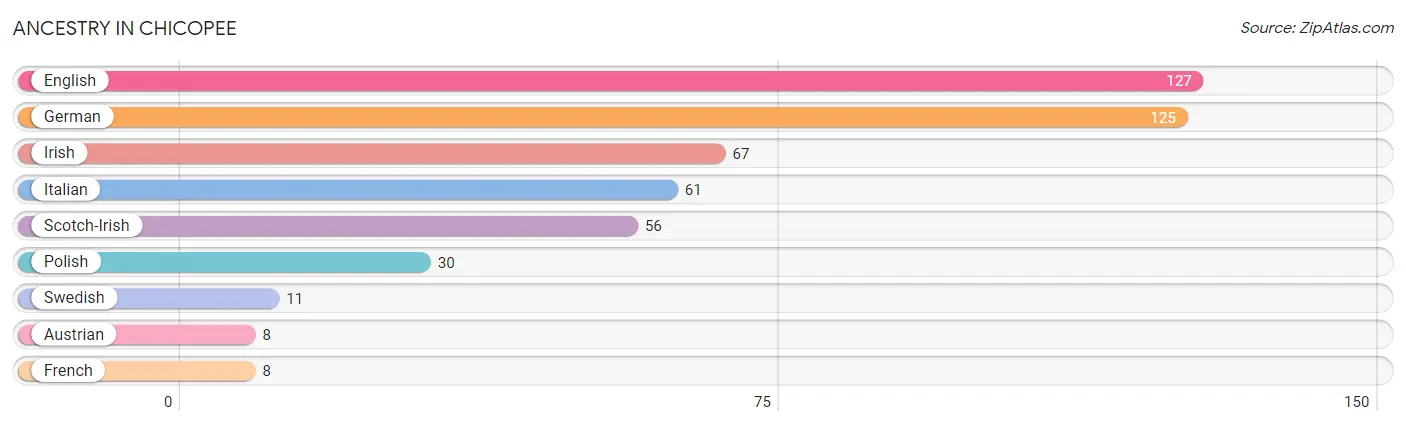
| Ancestry | # Population | % Population |
| Austrian | 8 | 2.1% |
| English | 127 | 32.7% |
| French | 8 | 2.1% |
| German | 125 | 32.2% |
| Irish | 67 | 17.3% |
| Italian | 61 | 15.7% |
| Polish | 30 | 7.7% |
| Scotch-Irish | 56 | 14.4% |
| Swedish | 11 | 2.8% | View All 9 Rows |
Immigrants in Chicopee

| Immigration Origin | # Population | % Population | View All 0 Rows |
Sex and Age in Chicopee
Sex and Age in Chicopee
The most populous age groups in Chicopee are 50 to 54 Years (40 | 21.4%) for men and 25 to 29 Years (31 | 15.4%) for women.
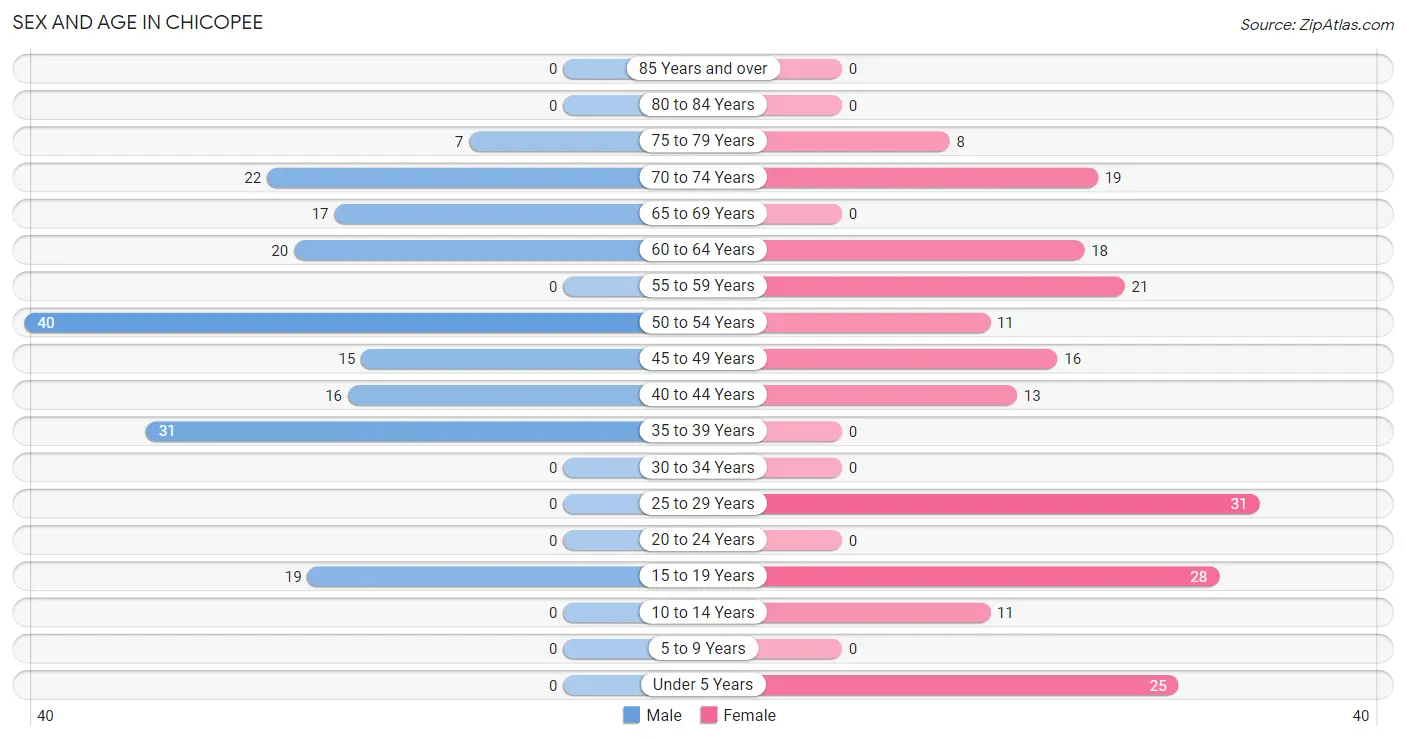
| Age Bracket | Male | Female |
| Under 5 Years | 0 (0.0%) | 25 (12.4%) |
| 5 to 9 Years | 0 (0.0%) | 0 (0.0%) |
| 10 to 14 Years | 0 (0.0%) | 11 (5.5%) |
| 15 to 19 Years | 19 (10.2%) | 28 (13.9%) |
| 20 to 24 Years | 0 (0.0%) | 0 (0.0%) |
| 25 to 29 Years | 0 (0.0%) | 31 (15.4%) |
| 30 to 34 Years | 0 (0.0%) | 0 (0.0%) |
| 35 to 39 Years | 31 (16.6%) | 0 (0.0%) |
| 40 to 44 Years | 16 (8.6%) | 13 (6.5%) |
| 45 to 49 Years | 15 (8.0%) | 16 (8.0%) |
| 50 to 54 Years | 40 (21.4%) | 11 (5.5%) |
| 55 to 59 Years | 0 (0.0%) | 21 (10.4%) |
| 60 to 64 Years | 20 (10.7%) | 18 (9.0%) |
| 65 to 69 Years | 17 (9.1%) | 0 (0.0%) |
| 70 to 74 Years | 22 (11.8%) | 19 (9.5%) |
| 75 to 79 Years | 7 (3.7%) | 8 (4.0%) |
| 80 to 84 Years | 0 (0.0%) | 0 (0.0%) |
| 85 Years and over | 0 (0.0%) | 0 (0.0%) |
| Total | 187 (100.0%) | 201 (100.0%) |
Families and Households in Chicopee
Median Family Size in Chicopee
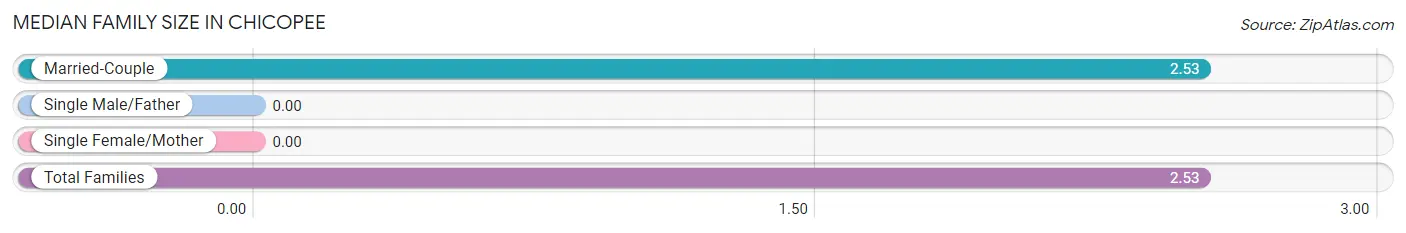
| Family Type | # Families | Family Size |
| Married-Couple | 145 (100.0%) | 2.53 |
| Single Male/Father | 0 (0.0%) | - |
| Single Female/Mother | 0 (0.0%) | - |
| Total Families | 145 (100.0%) | 2.53 |
Median Household Size in Chicopee
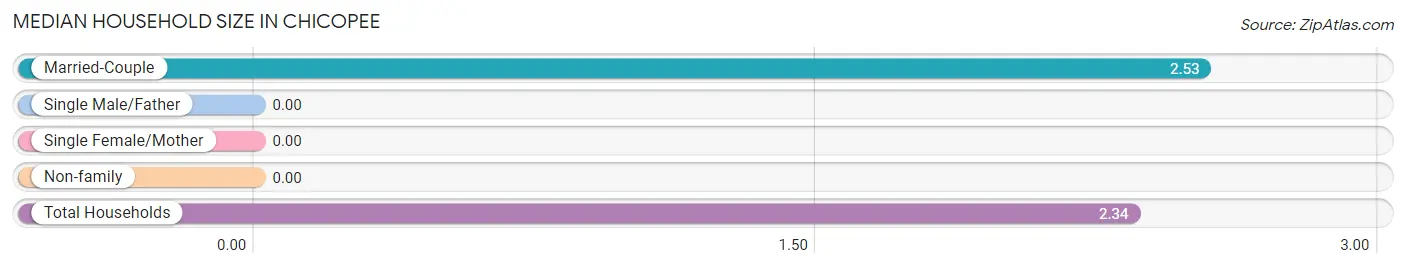
| Household Type | # Households | Household Size |
| Married-Couple | 145 (87.4%) | 2.53 |
| Single Male/Father | 0 (0.0%) | - |
| Single Female/Mother | 0 (0.0%) | - |
| Non-family | 21 (12.7%) | - |
| Total Households | 166 (100.0%) | 2.34 |
Household Size by Marriage Status in Chicopee
Out of a total of 166 households in Chicopee, 145 (87.4%) are family households, while 21 (12.7%) are nonfamily households. The most numerous type of family households are 2-person households, comprising 67, and the most common type of nonfamily households are 1-person households, comprising 21.
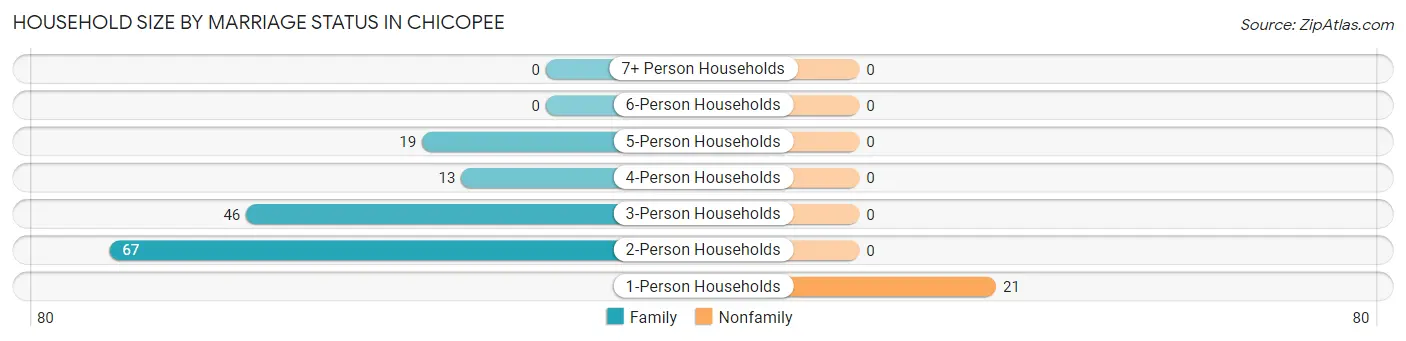
| Household Size | Family Households | Nonfamily Households |
| 1-Person Households | - | 21 (12.7%) |
| 2-Person Households | 67 (40.4%) | 0 (0.0%) |
| 3-Person Households | 46 (27.7%) | 0 (0.0%) |
| 4-Person Households | 13 (7.8%) | 0 (0.0%) |
| 5-Person Households | 19 (11.5%) | 0 (0.0%) |
| 6-Person Households | 0 (0.0%) | 0 (0.0%) |
| 7+ Person Households | 0 (0.0%) | 0 (0.0%) |
| Total | 145 (87.4%) | 21 (12.7%) |
Female Fertility in Chicopee
Fertility by Age in Chicopee
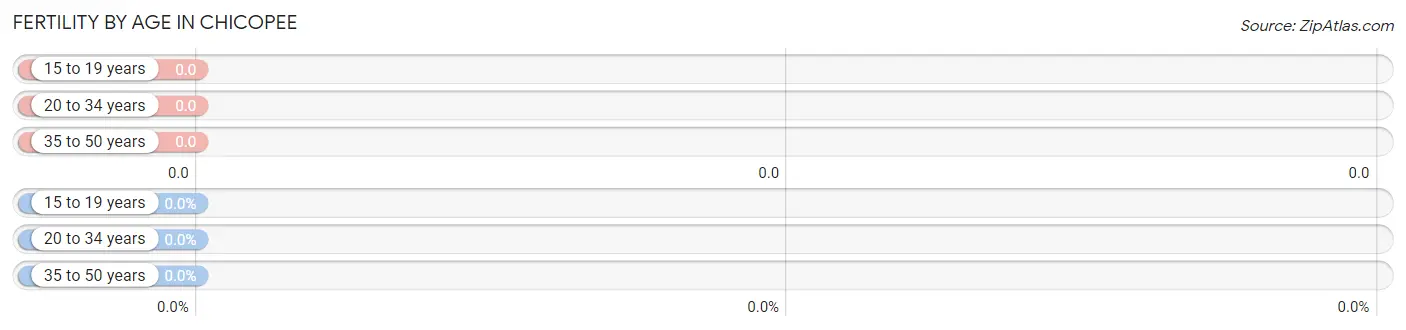
| Age Bracket | Women with Births | Births / 1,000 Women |
| 15 to 19 years | 0 (0.0%) | 0.0 |
| 20 to 34 years | 0 (0.0%) | 0.0 |
| 35 to 50 years | 0 (0.0%) | 0.0 |
| Total | 0 (0.0%) | 0.0 |
Fertility by Age by Marriage Status in Chicopee
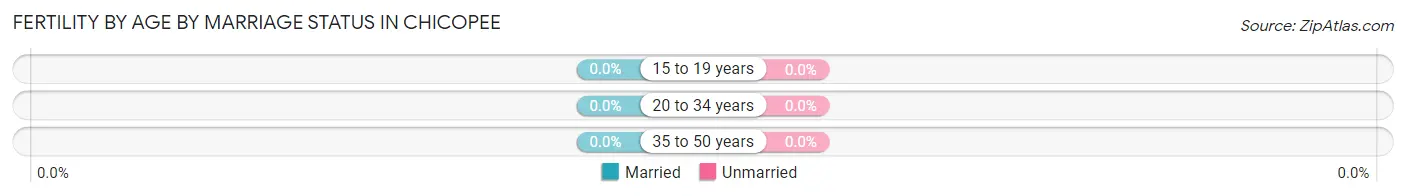
| Age Bracket | Married | Unmarried |
| 15 to 19 years | 0 (0.0%) | 0 (0.0%) |
| 20 to 34 years | 0 (0.0%) | 0 (0.0%) |
| 35 to 50 years | 0 (0.0%) | 0 (0.0%) |
| Total | 0 (0.0%) | 0 (0.0%) |
Fertility by Education in Chicopee
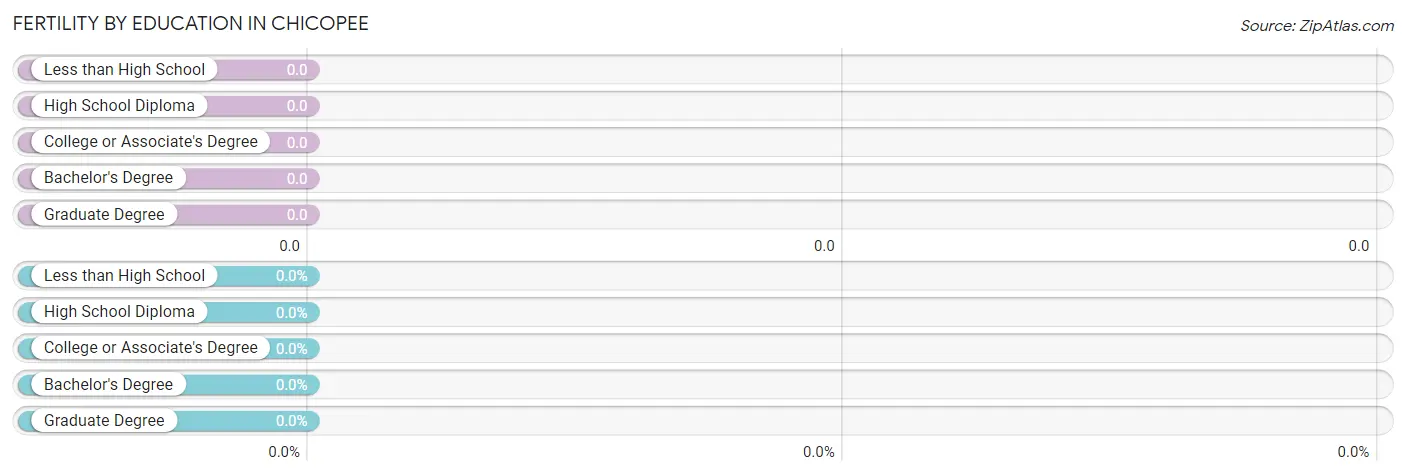
| Educational Attainment | Women with Births | Births / 1,000 Women |
| Less than High School | 0 (0.0%) | 0.0 |
| High School Diploma | 0 (0.0%) | 0.0 |
| College or Associate's Degree | 0 (0.0%) | 0.0 |
| Bachelor's Degree | 0 (0.0%) | 0.0 |
| Graduate Degree | 0 (0.0%) | 0.0 |
| Total | 0 (0.0%) | 0.0 |
Fertility by Education by Marriage Status in Chicopee
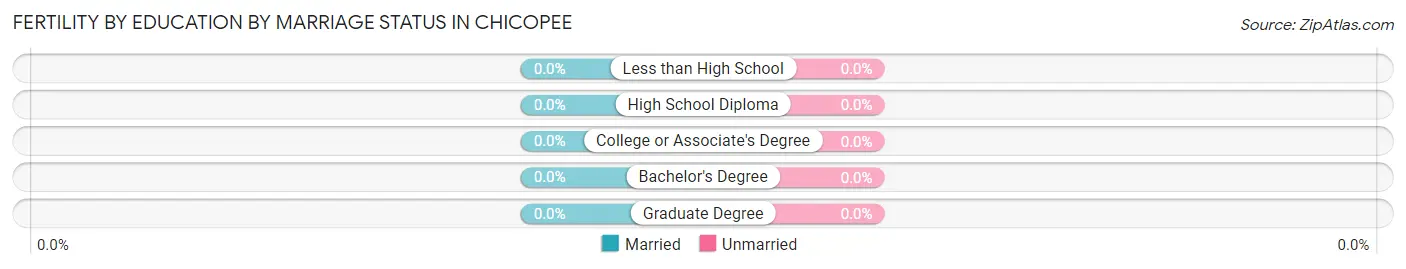
| Educational Attainment | Married | Unmarried |
| Less than High School | 0 (0.0%) | 0 (0.0%) |
| High School Diploma | 0 (0.0%) | 0 (0.0%) |
| College or Associate's Degree | 0 (0.0%) | 0 (0.0%) |
| Bachelor's Degree | 0 (0.0%) | 0 (0.0%) |
| Graduate Degree | 0 (0.0%) | 0 (0.0%) |
| Total | 0 (0.0%) | 0 (0.0%) |
Income in Chicopee
Income Overview in Chicopee
Per Capita Income in Chicopee is $77,178, while median incomes of families and households are $138,618 and $140,000 respectively.
| Characteristic | Number | Measure |
| Per Capita Income | 388 | $77,178 |
| Median Family Income | 145 | $138,618 |
| Mean Family Income | 145 | $165,363 |
| Median Household Income | 166 | $140,000 |
| Mean Household Income | 166 | $176,205 |
| Income Deficit | 145 | $0 |
| Wage / Income Gap (%) | 388 | 0.00% |
| Wage / Income Gap ($) | 388 | 100.00¢ per $1 |
| Gini / Inequality Index | 388 | 0.31 |
Earnings by Sex in Chicopee
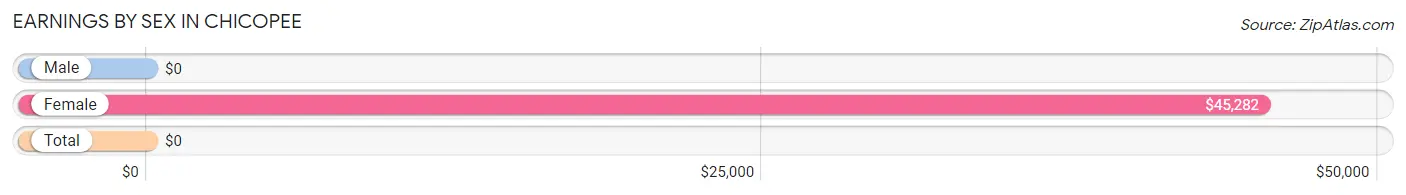
| Sex | Number | Average Earnings |
| Male | 158 (62.0%) | $0 |
| Female | 97 (38.0%) | $45,282 |
| Total | 255 (100.0%) | $0 |
Earnings by Sex by Income Bracket in Chicopee
The most common earnings brackets in Chicopee are $100,000+ for men (73 | 46.2%) and $45,000 to $49,999 for women (31 | 32.0%).
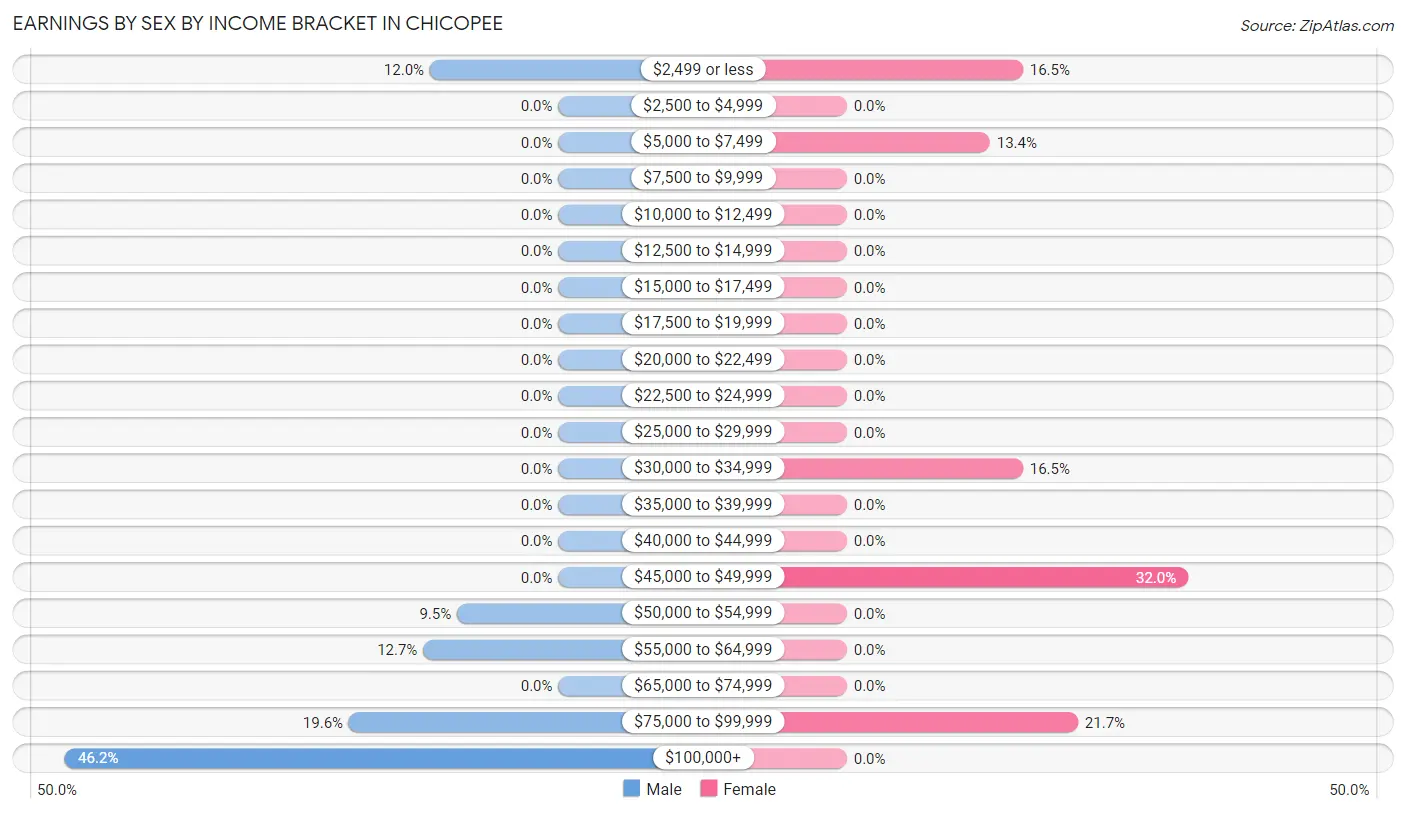
| Income | Male | Female |
| $2,499 or less | 19 (12.0%) | 16 (16.5%) |
| $2,500 to $4,999 | 0 (0.0%) | 0 (0.0%) |
| $5,000 to $7,499 | 0 (0.0%) | 13 (13.4%) |
| $7,500 to $9,999 | 0 (0.0%) | 0 (0.0%) |
| $10,000 to $12,499 | 0 (0.0%) | 0 (0.0%) |
| $12,500 to $14,999 | 0 (0.0%) | 0 (0.0%) |
| $15,000 to $17,499 | 0 (0.0%) | 0 (0.0%) |
| $17,500 to $19,999 | 0 (0.0%) | 0 (0.0%) |
| $20,000 to $22,499 | 0 (0.0%) | 0 (0.0%) |
| $22,500 to $24,999 | 0 (0.0%) | 0 (0.0%) |
| $25,000 to $29,999 | 0 (0.0%) | 0 (0.0%) |
| $30,000 to $34,999 | 0 (0.0%) | 16 (16.5%) |
| $35,000 to $39,999 | 0 (0.0%) | 0 (0.0%) |
| $40,000 to $44,999 | 0 (0.0%) | 0 (0.0%) |
| $45,000 to $49,999 | 0 (0.0%) | 31 (32.0%) |
| $50,000 to $54,999 | 15 (9.5%) | 0 (0.0%) |
| $55,000 to $64,999 | 20 (12.7%) | 0 (0.0%) |
| $65,000 to $74,999 | 0 (0.0%) | 0 (0.0%) |
| $75,000 to $99,999 | 31 (19.6%) | 21 (21.6%) |
| $100,000+ | 73 (46.2%) | 0 (0.0%) |
| Total | 158 (100.0%) | 97 (100.0%) |
Earnings by Sex by Educational Attainment in Chicopee
Average earnings in Chicopee are $122,961 for men and $45,927 for women, a difference of 62.6%. Men with an educational attainment of bachelor's degree enjoy the highest average annual earnings of $231,131, while those with bachelor's degree education earn the least with $231,131. Women with an educational attainment of bachelor's degree earn the most with the average annual earnings of $45,081, while those with bachelor's degree education have the smallest earnings of $45,081.
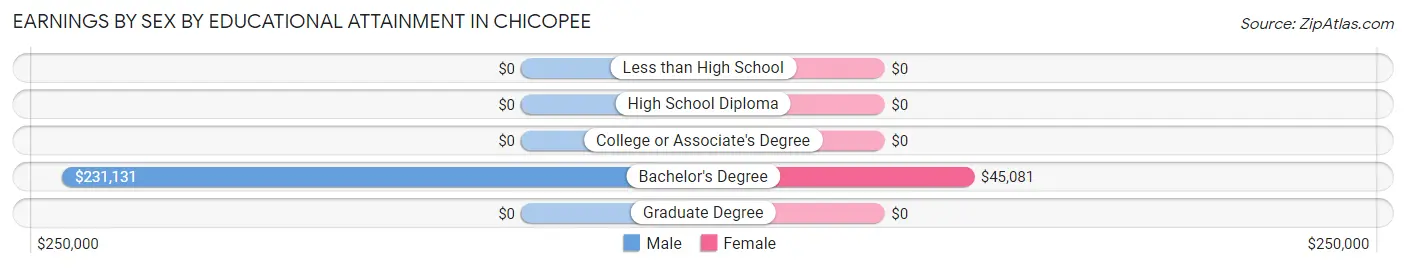
| Educational Attainment | Male Income | Female Income |
| Less than High School | - | - |
| High School Diploma | - | - |
| College or Associate's Degree | - | - |
| Bachelor's Degree | $231,131 | $45,081 |
| Graduate Degree | - | - |
| Total | $122,961 | $45,927 |
Family Income in Chicopee
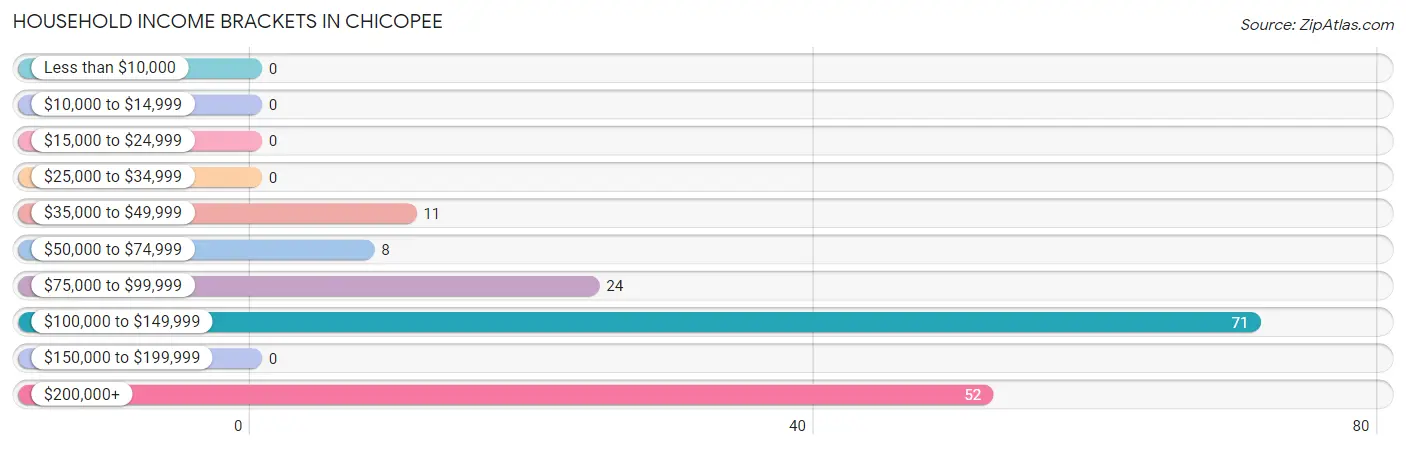
Family Income Brackets in Chicopee
According to the Chicopee family income data, there are 71 families falling into the $100,000 to $149,999 income range, which is the most common income bracket and makes up 49.0% of all families.
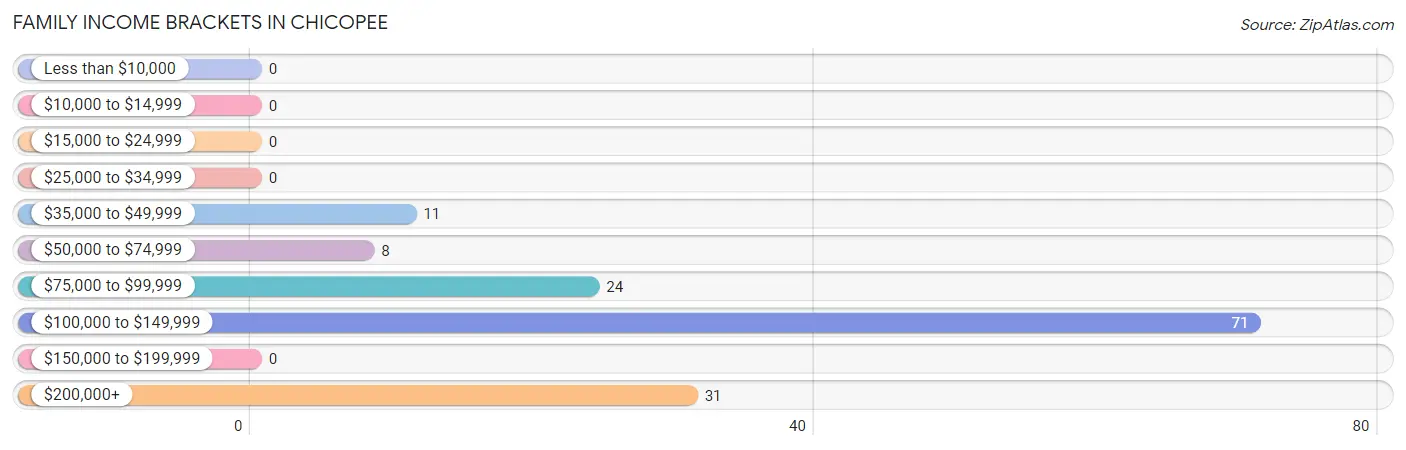
| Income Bracket | # Families | % Families |
| Less than $10,000 | 0 | 0.0% |
| $10,000 to $14,999 | 0 | 0.0% |
| $15,000 to $24,999 | 0 | 0.0% |
| $25,000 to $34,999 | 0 | 0.0% |
| $35,000 to $49,999 | 11 | 7.6% |
| $50,000 to $74,999 | 8 | 5.5% |
| $75,000 to $99,999 | 24 | 16.6% |
| $100,000 to $149,999 | 71 | 49.0% |
| $150,000 to $199,999 | 0 | 0.0% |
| $200,000+ | 31 | 21.4% |
Family Income by Famaliy Size in Chicopee
2-person families (67 | 46.2%) account for the highest median family income in Chicopee with $133,155 per family, while 2-person families (67 | 46.2%) have the highest median income of $66,578 per family member.
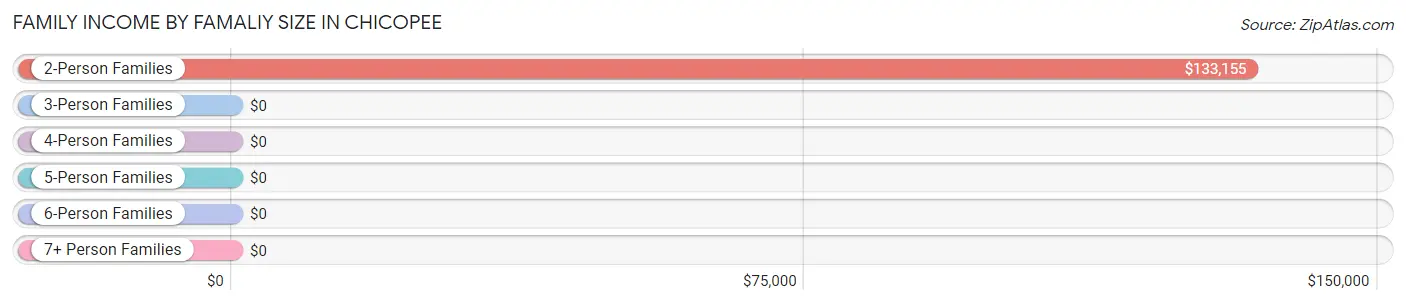
| Income Bracket | # Families | Median Income |
| 2-Person Families | 67 (46.2%) | $133,155 |
| 3-Person Families | 46 (31.7%) | $0 |
| 4-Person Families | 13 (9.0%) | $0 |
| 5-Person Families | 19 (13.1%) | $0 |
| 6-Person Families | 0 (0.0%) | $0 |
| 7+ Person Families | 0 (0.0%) | $0 |
| Total | 145 (100.0%) | $138,618 |
Family Income by Number of Earners in Chicopee
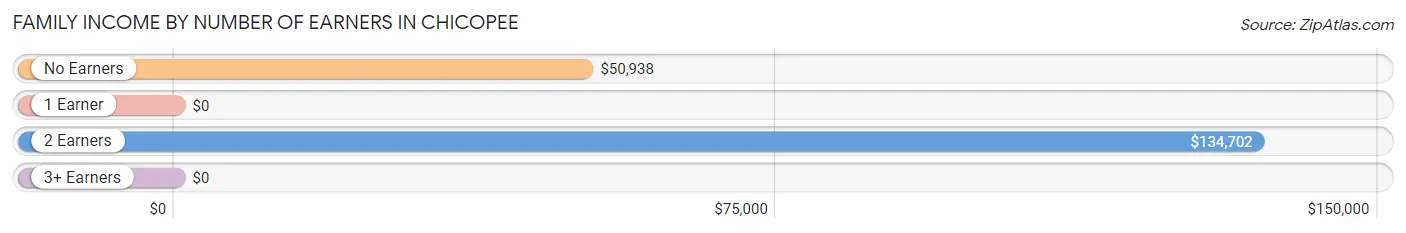
| Number of Earners | # Families | Median Income |
| No Earners | 28 (19.3%) | $50,938 |
| 1 Earner | 18 (12.4%) | $0 |
| 2 Earners | 67 (46.2%) | $134,702 |
| 3+ Earners | 32 (22.1%) | $0 |
| Total | 145 (100.0%) | $138,618 |
Household Income in Chicopee
Household Income Brackets in Chicopee
With 71 households falling in the category, the $100,000 to $149,999 income range is the most frequent in Chicopee, accounting for 42.8% of all households.
| Income Bracket | # Households | % Households |
| Less than $10,000 | 0 | 0.0% |
| $10,000 to $14,999 | 0 | 0.0% |
| $15,000 to $24,999 | 0 | 0.0% |
| $25,000 to $34,999 | 0 | 0.0% |
| $35,000 to $49,999 | 11 | 6.6% |
| $50,000 to $74,999 | 8 | 4.8% |
| $75,000 to $99,999 | 24 | 14.5% |
| $100,000 to $149,999 | 71 | 42.8% |
| $150,000 to $199,999 | 0 | 0.0% |
| $200,000+ | 52 | 31.3% |
Household Income by Householder Age in Chicopee
The median household income in Chicopee is $140,000, with the highest median household income of $50,938 found in the 65+ years age bracket for the primary householder. A total of 28 households (16.9%) fall into this category.
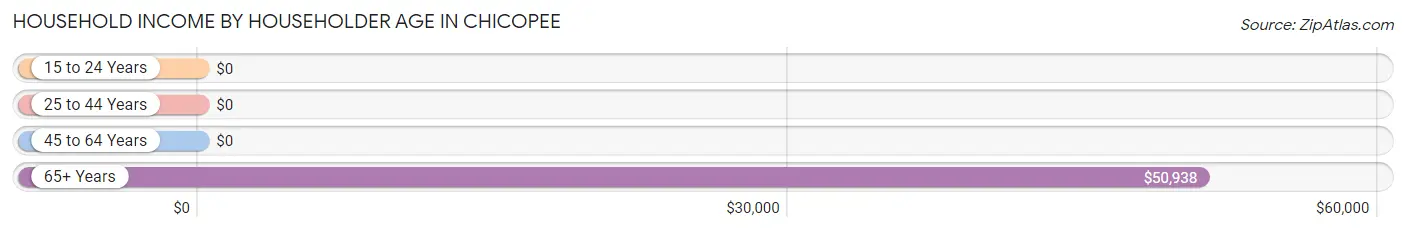
| Income Bracket | # Households | Median Income |
| 15 to 24 Years | 0 (0.0%) | $0 |
| 25 to 44 Years | 44 (26.5%) | $0 |
| 45 to 64 Years | 94 (56.6%) | $0 |
| 65+ Years | 28 (16.9%) | $50,938 |
| Total | 166 (100.0%) | $140,000 |
Poverty in Chicopee
Income Below Poverty by Sex and Age in Chicopee
| Age Bracket | Male | Female |
| Under 5 Years | 0 (0.0%) | 0 (0.0%) |
| 5 Years | 0 (0.0%) | 0 (0.0%) |
| 6 to 11 Years | 0 (0.0%) | 0 (0.0%) |
| 12 to 14 Years | 0 (0.0%) | 0 (0.0%) |
| 15 Years | 0 (0.0%) | 0 (0.0%) |
| 16 and 17 Years | 0 (0.0%) | 0 (0.0%) |
| 18 to 24 Years | 0 (0.0%) | 0 (0.0%) |
| 25 to 34 Years | 0 (0.0%) | 0 (0.0%) |
| 35 to 44 Years | 0 (0.0%) | 0 (0.0%) |
| 45 to 54 Years | 0 (0.0%) | 0 (0.0%) |
| 55 to 64 Years | 0 (0.0%) | 0 (0.0%) |
| 65 to 74 Years | 0 (0.0%) | 0 (0.0%) |
| 75 Years and over | 0 (0.0%) | 0 (0.0%) |
| Total | 0 (0.0%) | 0 (0.0%) |
Income Above Poverty by Sex and Age in Chicopee
According to the poverty statistics in Chicopee, males aged 16 and 17 years and females aged under 5 years are the age groups that are most secure financially, with 100.0% of males and 100.0% of females in these age groups living above the poverty line.
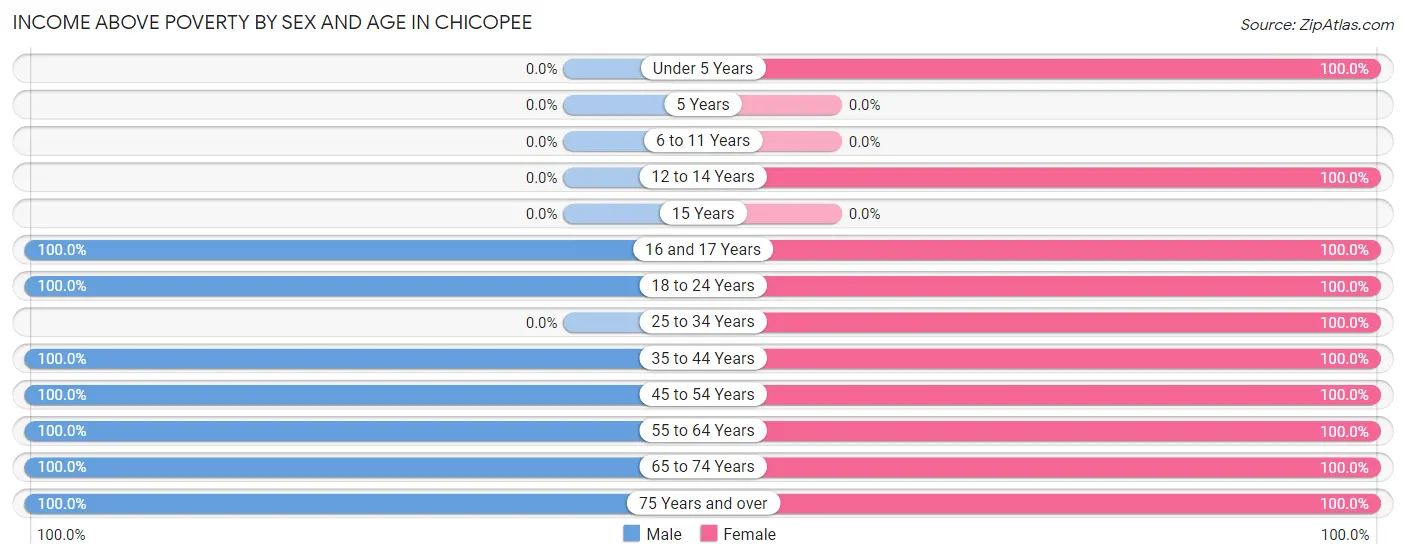
| Age Bracket | Male | Female |
| Under 5 Years | 0 (0.0%) | 25 (100.0%) |
| 5 Years | 0 (0.0%) | 0 (0.0%) |
| 6 to 11 Years | 0 (0.0%) | 0 (0.0%) |
| 12 to 14 Years | 0 (0.0%) | 11 (100.0%) |
| 15 Years | 0 (0.0%) | 0 (0.0%) |
| 16 and 17 Years | 8 (100.0%) | 16 (100.0%) |
| 18 to 24 Years | 11 (100.0%) | 12 (100.0%) |
| 25 to 34 Years | 0 (0.0%) | 31 (100.0%) |
| 35 to 44 Years | 47 (100.0%) | 13 (100.0%) |
| 45 to 54 Years | 55 (100.0%) | 27 (100.0%) |
| 55 to 64 Years | 20 (100.0%) | 39 (100.0%) |
| 65 to 74 Years | 39 (100.0%) | 19 (100.0%) |
| 75 Years and over | 7 (100.0%) | 8 (100.0%) |
| Total | 187 (100.0%) | 201 (100.0%) |
Income Below Poverty Among Married-Couple Families in Chicopee
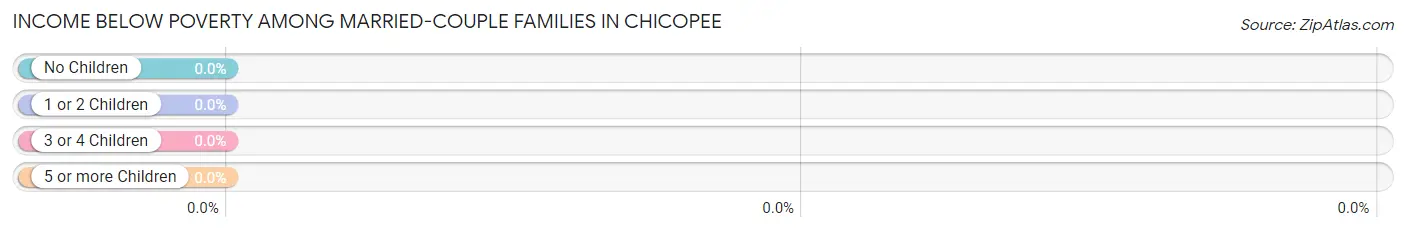
| Children | Above Poverty | Below Poverty |
| No Children | 82 (100.0%) | 0 (0.0%) |
| 1 or 2 Children | 63 (100.0%) | 0 (0.0%) |
| 3 or 4 Children | 0 (0.0%) | 0 (0.0%) |
| 5 or more Children | 0 (0.0%) | 0 (0.0%) |
| Total | 145 (100.0%) | 0 (0.0%) |
Income Below Poverty Among Single-Parent Households in Chicopee
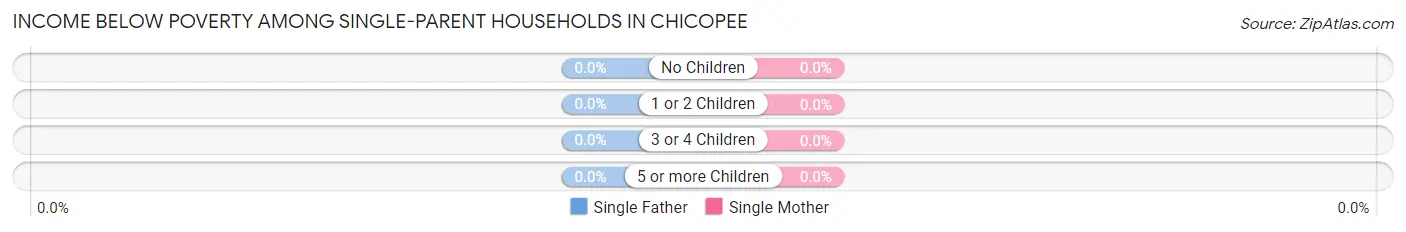
| Children | Single Father | Single Mother |
| No Children | 0 (0.0%) | 0 (0.0%) |
| 1 or 2 Children | 0 (0.0%) | 0 (0.0%) |
| 3 or 4 Children | 0 (0.0%) | 0 (0.0%) |
| 5 or more Children | 0 (0.0%) | 0 (0.0%) |
| Total | 0 (0.0%) | 0 (0.0%) |
Income Below Poverty Among Married-Couple vs Single-Parent Households in Chicopee
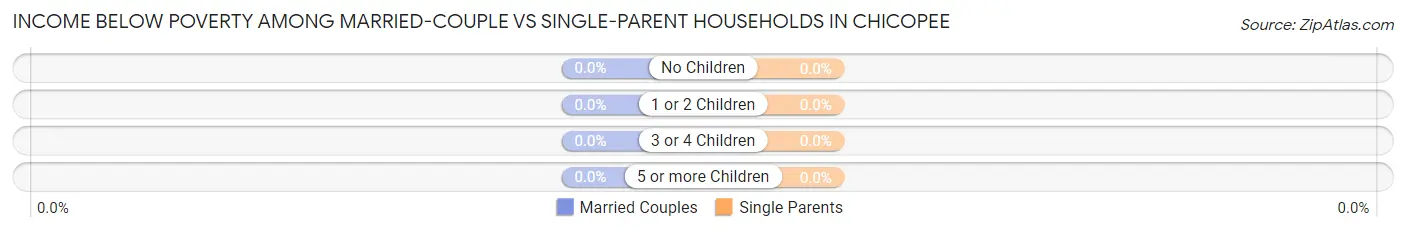
| Children | Married-Couple Families | Single-Parent Households |
| No Children | 0 (0.0%) | 0 (0.0%) |
| 1 or 2 Children | 0 (0.0%) | 0 (0.0%) |
| 3 or 4 Children | 0 (0.0%) | 0 (0.0%) |
| 5 or more Children | 0 (0.0%) | 0 (0.0%) |
| Total | 0 (0.0%) | 0 (0.0%) |
Employment Characteristics in Chicopee
Employment by Class of Employer in Chicopee
Among the 231 employed individuals in Chicopee, private company employees (162 | 70.1%), state government employees (48 | 20.8%), and self-employed (incorporated) (21 | 9.1%) make up the most common classes of employment.
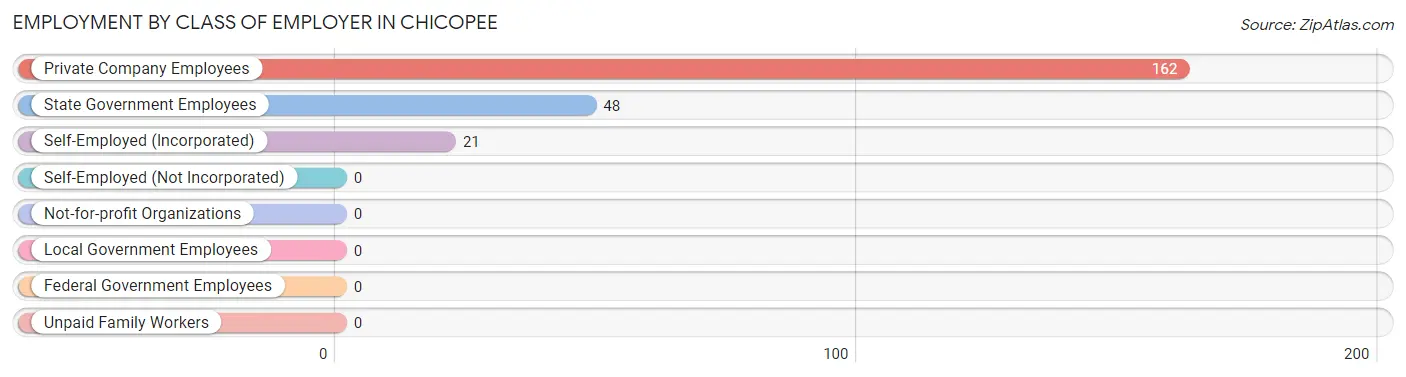
| Employer Class | # Employees | % Employees |
| Private Company Employees | 162 | 70.1% |
| Self-Employed (Incorporated) | 21 | 9.1% |
| Self-Employed (Not Incorporated) | 0 | 0.0% |
| Not-for-profit Organizations | 0 | 0.0% |
| Local Government Employees | 0 | 0.0% |
| State Government Employees | 48 | 20.8% |
| Federal Government Employees | 0 | 0.0% |
| Unpaid Family Workers | 0 | 0.0% |
| Total | 231 | 100.0% |
Employment Status by Age in Chicopee
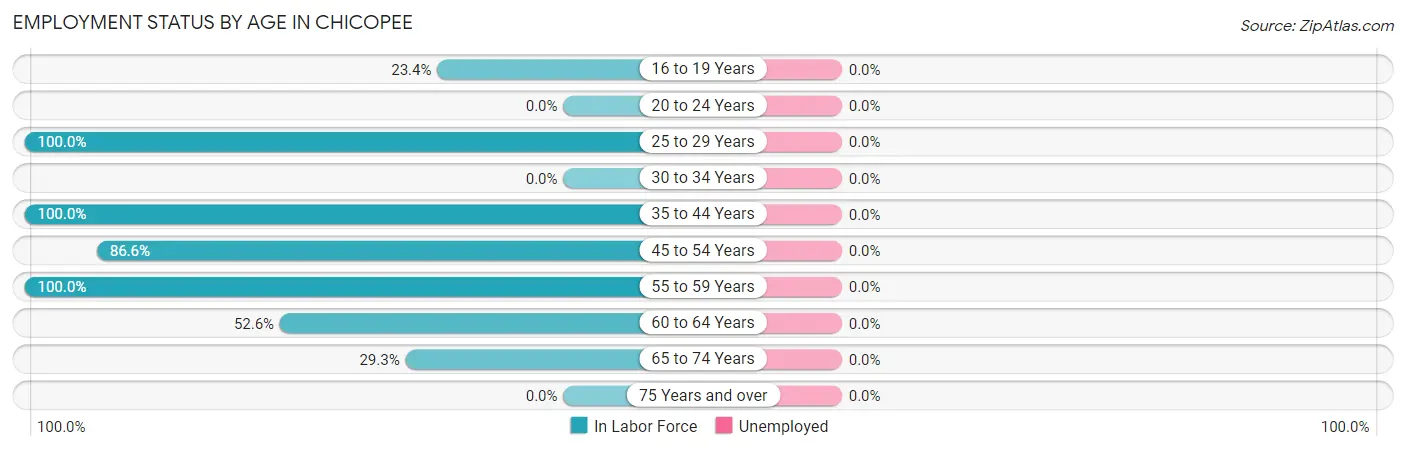
| Age Bracket | In Labor Force | Unemployed |
| 16 to 19 Years | 11 (23.4%) | 0 (0.0%) |
| 20 to 24 Years | 0 (0.0%) | 0 (0.0%) |
| 25 to 29 Years | 31 (100.0%) | 0 (0.0%) |
| 30 to 34 Years | 0 (0.0%) | 0 (0.0%) |
| 35 to 44 Years | 60 (100.0%) | 0 (0.0%) |
| 45 to 54 Years | 71 (86.6%) | 0 (0.0%) |
| 55 to 59 Years | 21 (100.0%) | 0 (0.0%) |
| 60 to 64 Years | 20 (52.6%) | 0 (0.0%) |
| 65 to 74 Years | 17 (29.3%) | 0 (0.0%) |
| 75 Years and over | 0 (0.0%) | 0 (0.0%) |
| Total | 231 (65.6%) | 0 (0.0%) |
Employment Status by Educational Attainment in Chicopee
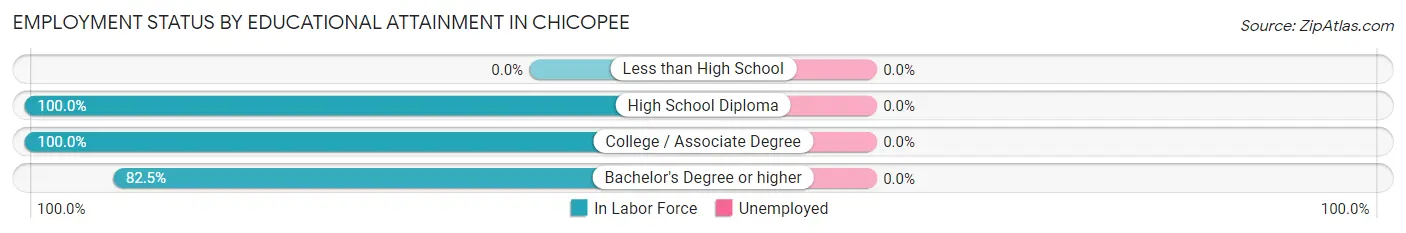
| Educational Attainment | In Labor Force | Unemployed |
| Less than High School | 0 (0.0%) | 0 (0.0%) |
| High School Diploma | 15 (100.0%) | 0 (0.0%) |
| College / Associate Degree | 51 (100.0%) | 0 (0.0%) |
| Bachelor's Degree or higher | 137 (82.5%) | 0 (0.0%) |
| Total | 203 (87.5%) | 0 (0.0%) |
Employment Occupations by Sex in Chicopee
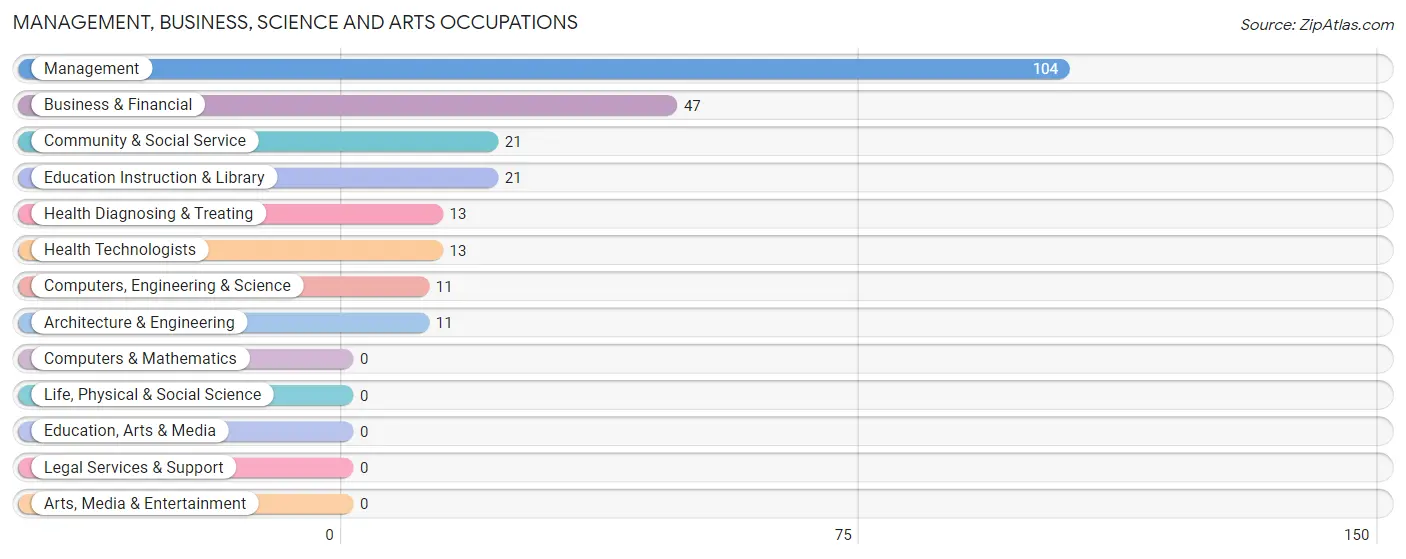
Management, Business, Science and Arts Occupations
The most common Management, Business, Science and Arts occupations in Chicopee are Management (104 | 45.0%), Business & Financial (47 | 20.3%), Community & Social Service (21 | 9.1%), Education Instruction & Library (21 | 9.1%), and Health Diagnosing & Treating (13 | 5.6%).
Management, Business, Science and Arts Occupations by Sex
Within the Management, Business, Science and Arts occupations in Chicopee, the most male-oriented occupations are Management (100.0%), Computers, Engineering & Science (100.0%), and Architecture & Engineering (100.0%), while the most female-oriented occupations are Business & Financial (100.0%), Community & Social Service (100.0%), and Education Instruction & Library (100.0%).
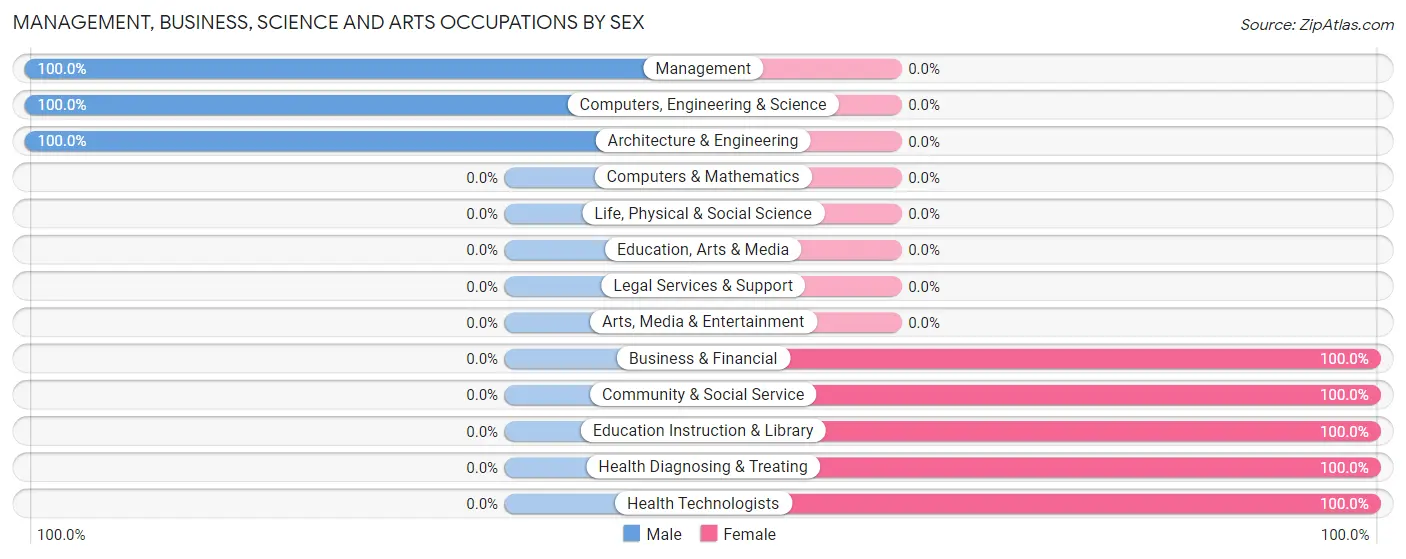
| Occupation | Male | Female |
| Management | 104 (100.0%) | 0 (0.0%) |
| Business & Financial | 0 (0.0%) | 47 (100.0%) |
| Computers, Engineering & Science | 11 (100.0%) | 0 (0.0%) |
| Computers & Mathematics | 0 (0.0%) | 0 (0.0%) |
| Architecture & Engineering | 11 (100.0%) | 0 (0.0%) |
| Life, Physical & Social Science | 0 (0.0%) | 0 (0.0%) |
| Community & Social Service | 0 (0.0%) | 21 (100.0%) |
| Education, Arts & Media | 0 (0.0%) | 0 (0.0%) |
| Legal Services & Support | 0 (0.0%) | 0 (0.0%) |
| Education Instruction & Library | 0 (0.0%) | 21 (100.0%) |
| Arts, Media & Entertainment | 0 (0.0%) | 0 (0.0%) |
| Health Diagnosing & Treating | 0 (0.0%) | 13 (100.0%) |
| Health Technologists | 0 (0.0%) | 13 (100.0%) |
| Total (Category) | 115 (58.7%) | 81 (41.3%) |
| Total (Overall) | 150 (64.9%) | 81 (35.1%) |
Services Occupations
Services Occupations by Sex
| Occupation | Male | Female |
| Healthcare Support | 0 (0.0%) | 0 (0.0%) |
| Security & Protection | 0 (0.0%) | 0 (0.0%) |
| Firefighting & Prevention | 0 (0.0%) | 0 (0.0%) |
| Law Enforcement | 0 (0.0%) | 0 (0.0%) |
| Food Preparation & Serving | 0 (0.0%) | 0 (0.0%) |
| Cleaning & Maintenance | 0 (0.0%) | 0 (0.0%) |
| Personal Care & Service | 0 (0.0%) | 0 (0.0%) |
| Total (Category) | 0 (0.0%) | 0 (0.0%) |
| Total (Overall) | 150 (64.9%) | 81 (35.1%) |
Sales and Office Occupations
The most common Sales and Office occupations in Chicopee are , and Office & Administration (15 | 6.5%).
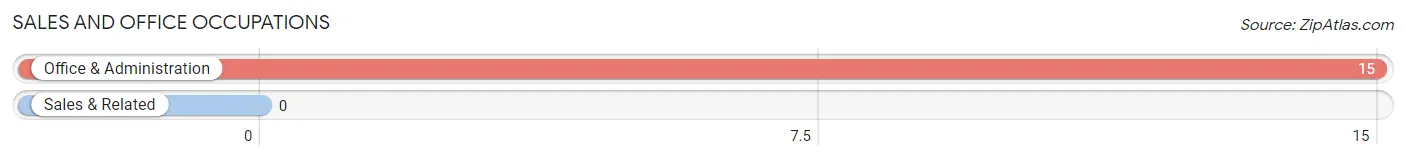
Sales and Office Occupations by Sex

| Occupation | Male | Female |
| Sales & Related | 0 (0.0%) | 0 (0.0%) |
| Office & Administration | 15 (100.0%) | 0 (0.0%) |
| Total (Category) | 15 (100.0%) | 0 (0.0%) |
| Total (Overall) | 150 (64.9%) | 81 (35.1%) |
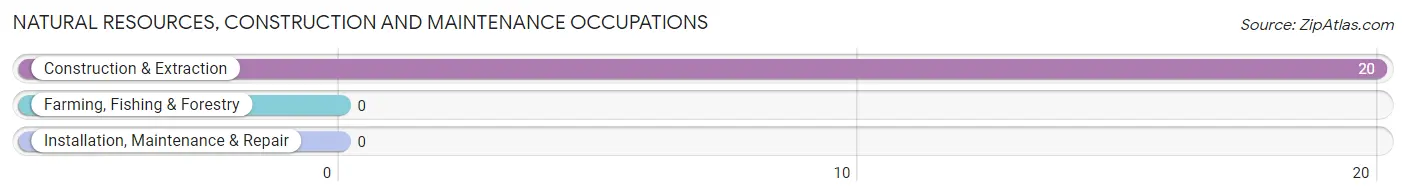
Natural Resources, Construction and Maintenance Occupations
The most common Natural Resources, Construction and Maintenance occupations in Chicopee are , and Construction & Extraction (20 | 8.7%).
Natural Resources, Construction and Maintenance Occupations by Sex
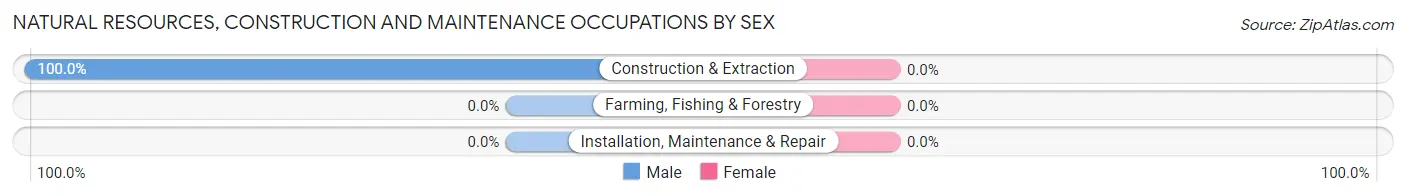
| Occupation | Male | Female |
| Farming, Fishing & Forestry | 0 (0.0%) | 0 (0.0%) |
| Construction & Extraction | 20 (100.0%) | 0 (0.0%) |
| Installation, Maintenance & Repair | 0 (0.0%) | 0 (0.0%) |
| Total (Category) | 20 (100.0%) | 0 (0.0%) |
| Total (Overall) | 150 (64.9%) | 81 (35.1%) |
Production, Transportation and Moving Occupations
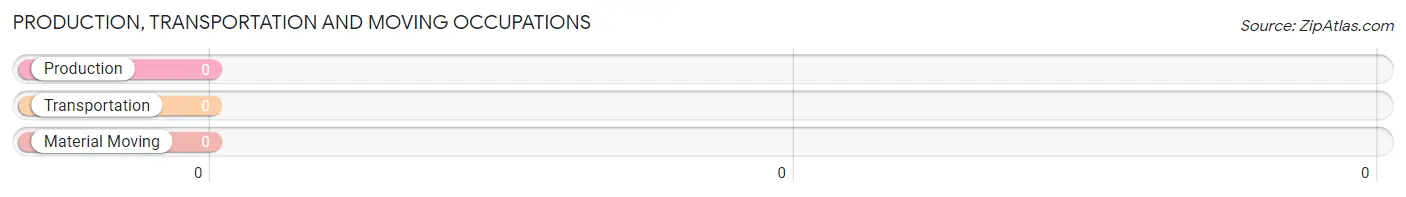
Production, Transportation and Moving Occupations by Sex
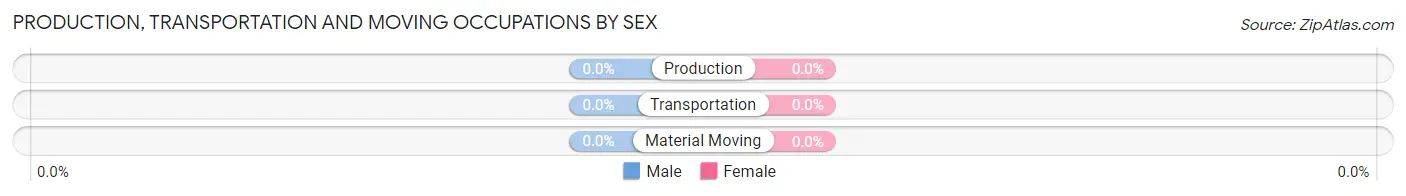
| Occupation | Male | Female |
| Production | 0 (0.0%) | 0 (0.0%) |
| Transportation | 0 (0.0%) | 0 (0.0%) |
| Material Moving | 0 (0.0%) | 0 (0.0%) |
| Total (Category) | 0 (0.0%) | 0 (0.0%) |
| Total (Overall) | 150 (64.9%) | 81 (35.1%) |
Employment Industries by Sex in Chicopee
Employment Industries in Chicopee
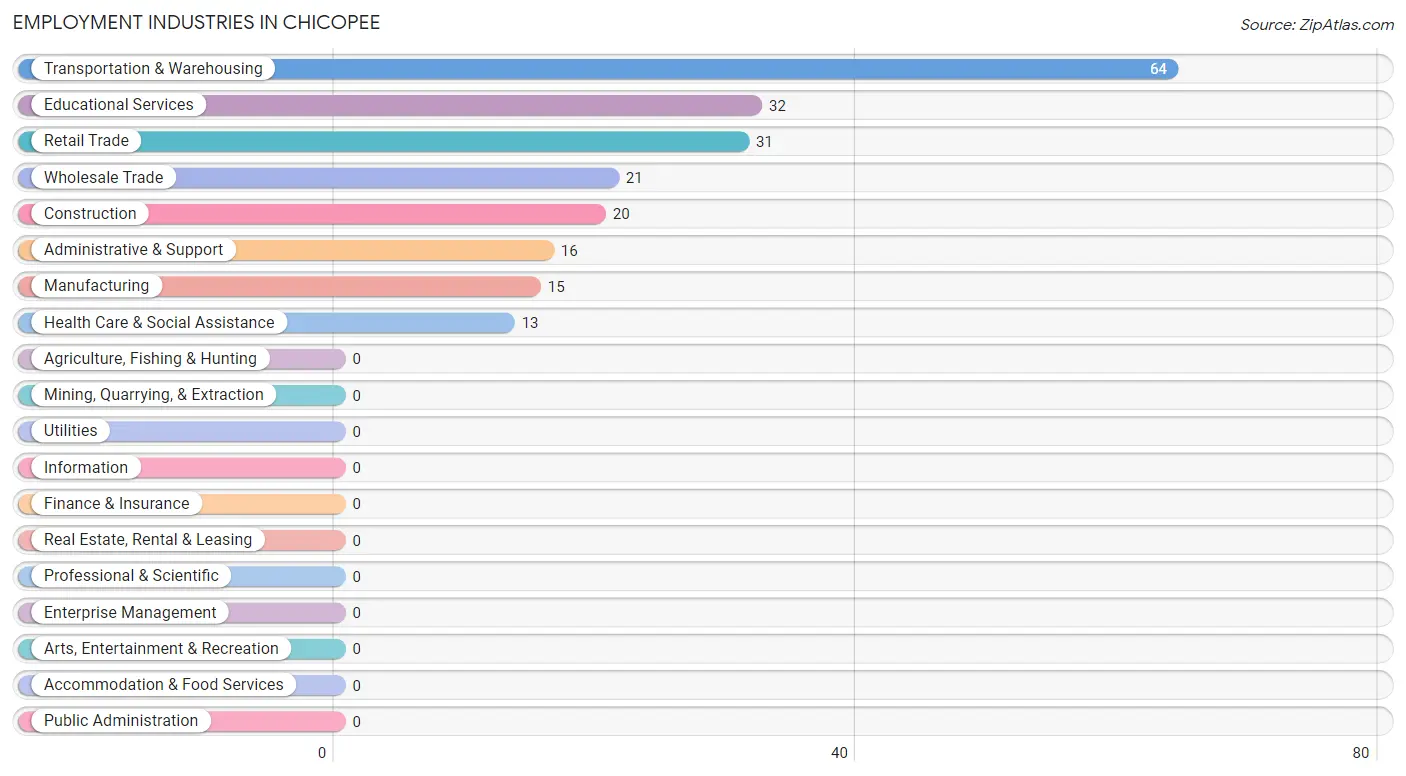
The major employment industries in Chicopee include Transportation & Warehousing (64 | 27.7%), Educational Services (32 | 13.9%), Retail Trade (31 | 13.4%), Wholesale Trade (21 | 9.1%), and Construction (20 | 8.7%).
Employment Industries by Sex in Chicopee
The Chicopee industries that see more men than women are Construction (100.0%), Manufacturing (100.0%), and Wholesale Trade (100.0%), whereas the industries that tend to have a higher number of women are Administrative & Support (100.0%), Health Care & Social Assistance (100.0%), and Educational Services (65.6%).
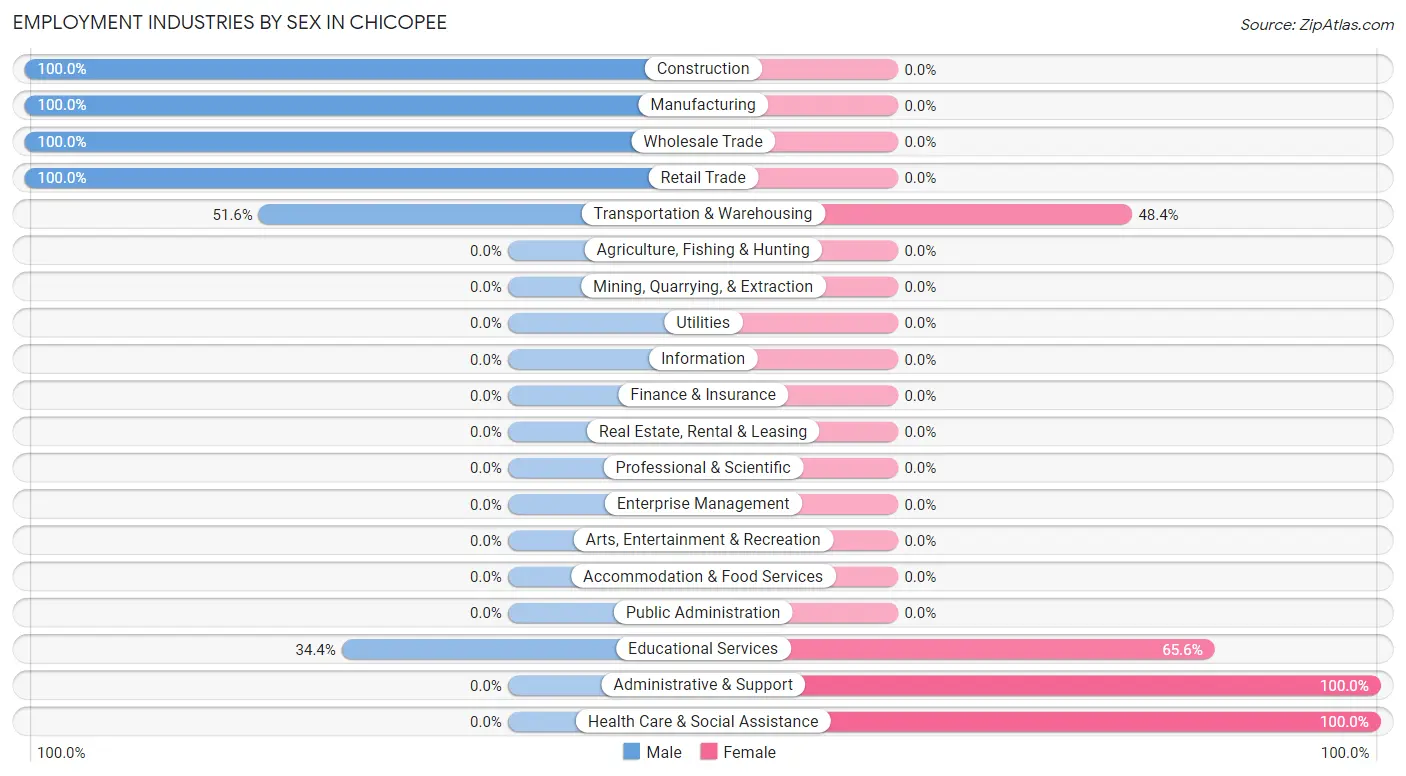
| Industry | Male | Female |
| Agriculture, Fishing & Hunting | 0 (0.0%) | 0 (0.0%) |
| Mining, Quarrying, & Extraction | 0 (0.0%) | 0 (0.0%) |
| Construction | 20 (100.0%) | 0 (0.0%) |
| Manufacturing | 15 (100.0%) | 0 (0.0%) |
| Wholesale Trade | 21 (100.0%) | 0 (0.0%) |
| Retail Trade | 31 (100.0%) | 0 (0.0%) |
| Transportation & Warehousing | 33 (51.6%) | 31 (48.4%) |
| Utilities | 0 (0.0%) | 0 (0.0%) |
| Information | 0 (0.0%) | 0 (0.0%) |
| Finance & Insurance | 0 (0.0%) | 0 (0.0%) |
| Real Estate, Rental & Leasing | 0 (0.0%) | 0 (0.0%) |
| Professional & Scientific | 0 (0.0%) | 0 (0.0%) |
| Enterprise Management | 0 (0.0%) | 0 (0.0%) |
| Administrative & Support | 0 (0.0%) | 16 (100.0%) |
| Educational Services | 11 (34.4%) | 21 (65.6%) |
| Health Care & Social Assistance | 0 (0.0%) | 13 (100.0%) |
| Arts, Entertainment & Recreation | 0 (0.0%) | 0 (0.0%) |
| Accommodation & Food Services | 0 (0.0%) | 0 (0.0%) |
| Public Administration | 0 (0.0%) | 0 (0.0%) |
| Total | 150 (64.9%) | 81 (35.1%) |
Education in Chicopee
School Enrollment in Chicopee
The most common levels of schooling among the 58 students in Chicopee are high school (47 | 81.0%), and college / undergraduate (11 | 19.0%).
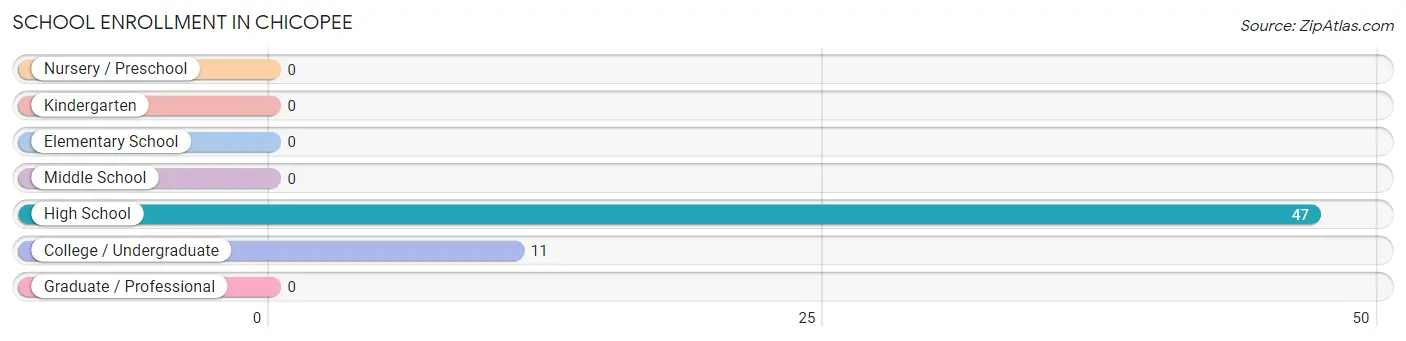
| School Level | # Students | % Students |
| Nursery / Preschool | 0 | 0.0% |
| Kindergarten | 0 | 0.0% |
| Elementary School | 0 | 0.0% |
| Middle School | 0 | 0.0% |
| High School | 47 | 81.0% |
| College / Undergraduate | 11 | 19.0% |
| Graduate / Professional | 0 | 0.0% |
| Total | 58 | 100.0% |
School Enrollment by Age by Funding Source in Chicopee
Out of a total of 58 students who are enrolled in schools in Chicopee, 11 (19.0%) attend a private institution, while the remaining 47 (81.0%) are enrolled in public schools. The age group of 10 to 14 year olds has the highest likelihood of being enrolled in private schools, with 11 (100.0% in the age bracket) enrolled. Conversely, the age group of 15 to 17 year olds has the lowest likelihood of being enrolled in a private school, with 24 (100.0% in the age bracket) attending a public institution.
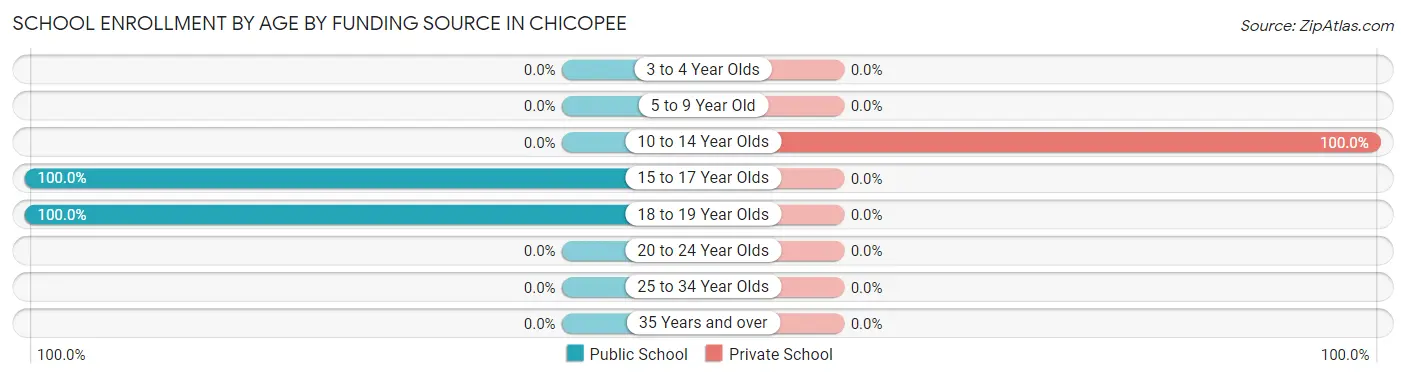
| Age Bracket | Public School | Private School |
| 3 to 4 Year Olds | 0 (0.0%) | 0 (0.0%) |
| 5 to 9 Year Old | 0 (0.0%) | 0 (0.0%) |
| 10 to 14 Year Olds | 0 (0.0%) | 11 (100.0%) |
| 15 to 17 Year Olds | 24 (100.0%) | 0 (0.0%) |
| 18 to 19 Year Olds | 23 (100.0%) | 0 (0.0%) |
| 20 to 24 Year Olds | 0 (0.0%) | 0 (0.0%) |
| 25 to 34 Year Olds | 0 (0.0%) | 0 (0.0%) |
| 35 Years and over | 0 (0.0%) | 0 (0.0%) |
| Total | 47 (81.0%) | 11 (19.0%) |
Educational Attainment by Field of Study in Chicopee
Business (68 | 26.0%), education (39 | 14.9%), arts & humanities (33 | 12.6%), science & technology (32 | 12.2%), and bio, nature & agricultural (30 | 11.5%) are the most common fields of study among 262 individuals in Chicopee who have obtained a bachelor's degree or higher.
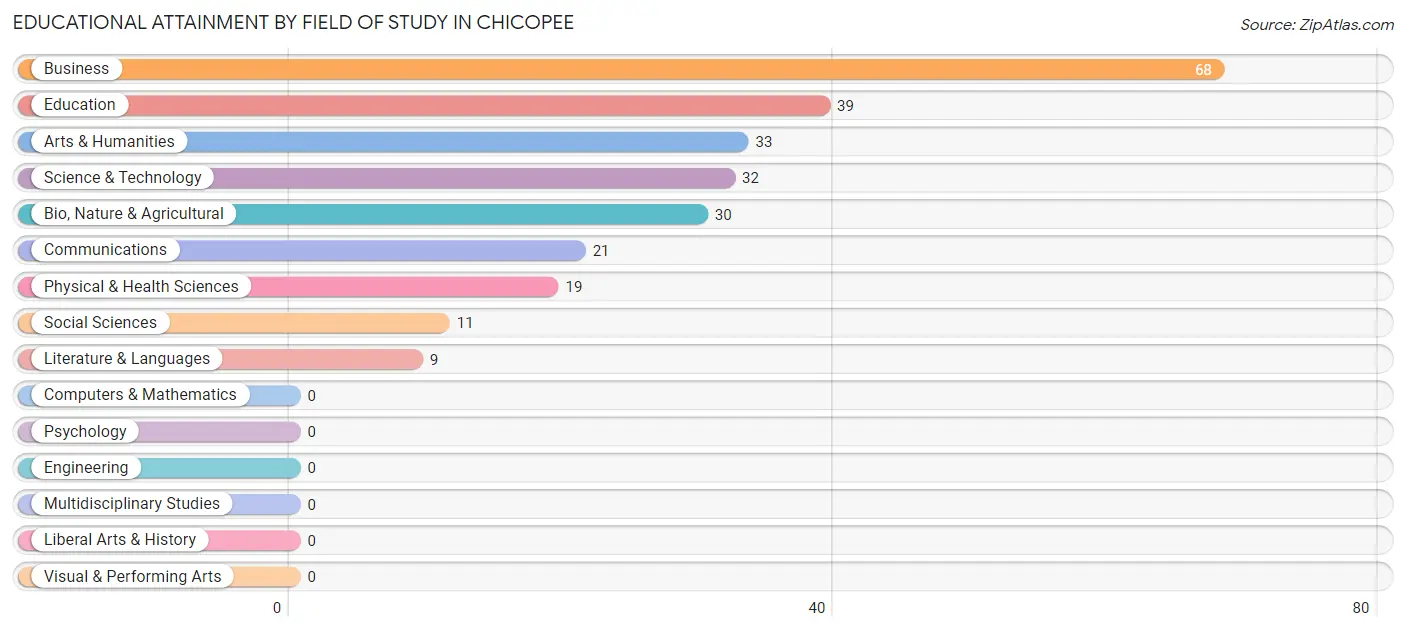
| Field of Study | # Graduates | % Graduates |
| Computers & Mathematics | 0 | 0.0% |
| Bio, Nature & Agricultural | 30 | 11.5% |
| Physical & Health Sciences | 19 | 7.2% |
| Psychology | 0 | 0.0% |
| Social Sciences | 11 | 4.2% |
| Engineering | 0 | 0.0% |
| Multidisciplinary Studies | 0 | 0.0% |
| Science & Technology | 32 | 12.2% |
| Business | 68 | 26.0% |
| Education | 39 | 14.9% |
| Literature & Languages | 9 | 3.4% |
| Liberal Arts & History | 0 | 0.0% |
| Visual & Performing Arts | 0 | 0.0% |
| Communications | 21 | 8.0% |
| Arts & Humanities | 33 | 12.6% |
| Total | 262 | 100.0% |
Transportation & Commute in Chicopee
Vehicle Availability by Sex in Chicopee
The most prevalent vehicle ownership categories in Chicopee are males with 4 vehicles (36, accounting for 24.0%) and females with 4 vehicles (34, making up 44.4%).
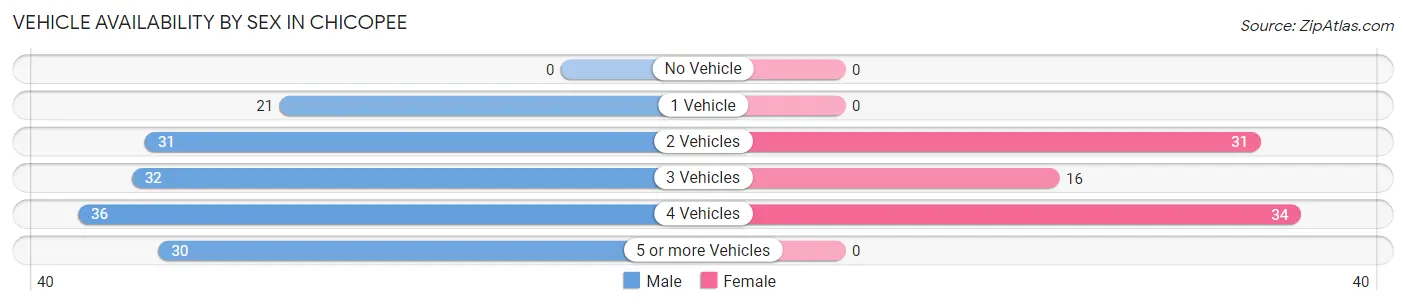
| Vehicles Available | Male | Female |
| No Vehicle | 0 (0.0%) | 0 (0.0%) |
| 1 Vehicle | 21 (14.0%) | 0 (0.0%) |
| 2 Vehicles | 31 (20.7%) | 31 (38.3%) |
| 3 Vehicles | 32 (21.3%) | 16 (19.8%) |
| 4 Vehicles | 36 (24.0%) | 34 (42.0%) |
| 5 or more Vehicles | 30 (20.0%) | 0 (0.0%) |
| Total | 150 (100.0%) | 81 (100.0%) |
Commute Time in Chicopee
The most frequently occuring commute durations in Chicopee are 15 to 19 minutes (82 commuters, 35.5%), 10 to 14 minutes (50 commuters, 21.6%), and 5 to 9 minutes (48 commuters, 20.8%).
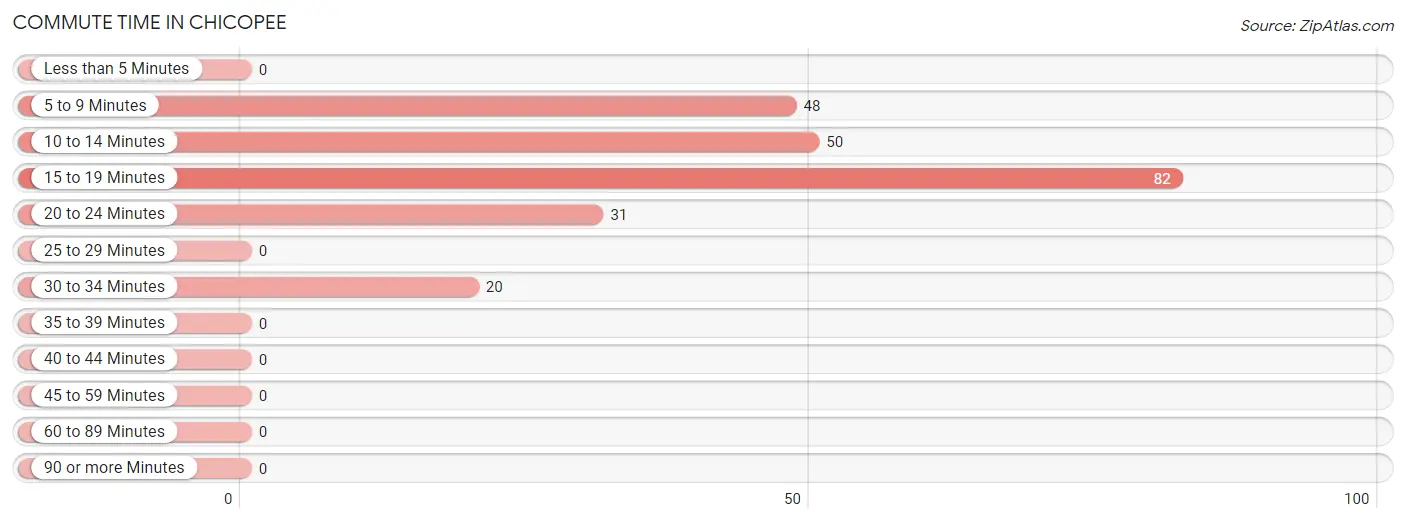
| Commute Time | # Commuters | % Commuters |
| Less than 5 Minutes | 0 | 0.0% |
| 5 to 9 Minutes | 48 | 20.8% |
| 10 to 14 Minutes | 50 | 21.6% |
| 15 to 19 Minutes | 82 | 35.5% |
| 20 to 24 Minutes | 31 | 13.4% |
| 25 to 29 Minutes | 0 | 0.0% |
| 30 to 34 Minutes | 20 | 8.7% |
| 35 to 39 Minutes | 0 | 0.0% |
| 40 to 44 Minutes | 0 | 0.0% |
| 45 to 59 Minutes | 0 | 0.0% |
| 60 to 89 Minutes | 0 | 0.0% |
| 90 or more Minutes | 0 | 0.0% |
Commute Time by Sex in Chicopee
The most common commute times in Chicopee are 15 to 19 minutes (66 commuters, 44.0%) for males and 10 to 14 minutes (34 commuters, 42.0%) for females.
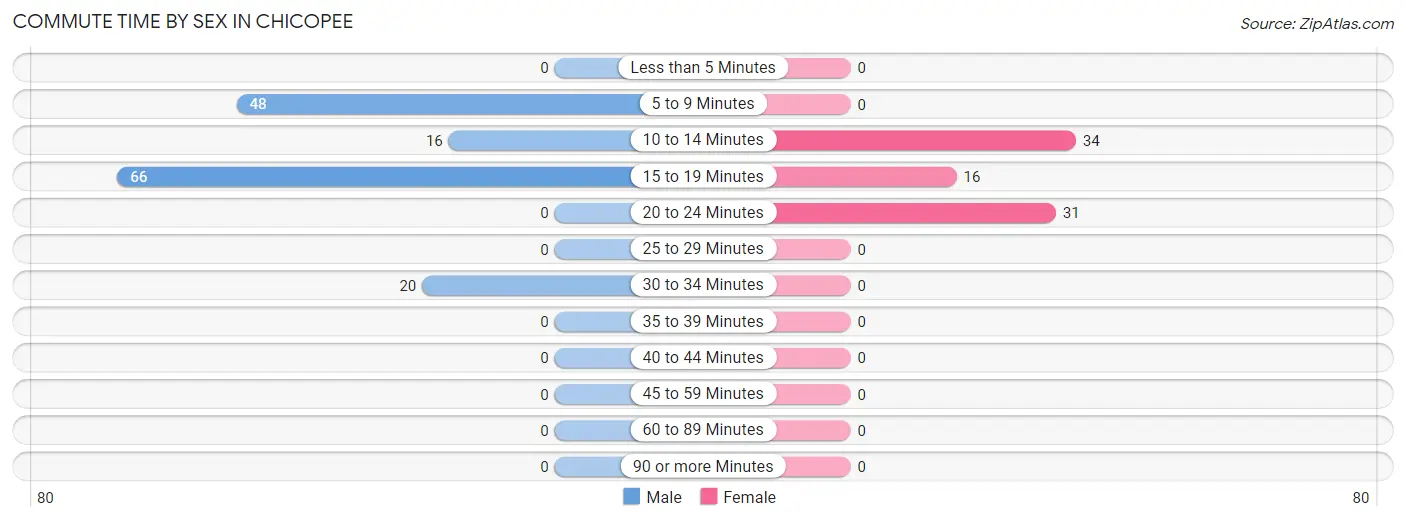
| Commute Time | Male | Female |
| Less than 5 Minutes | 0 (0.0%) | 0 (0.0%) |
| 5 to 9 Minutes | 48 (32.0%) | 0 (0.0%) |
| 10 to 14 Minutes | 16 (10.7%) | 34 (42.0%) |
| 15 to 19 Minutes | 66 (44.0%) | 16 (19.8%) |
| 20 to 24 Minutes | 0 (0.0%) | 31 (38.3%) |
| 25 to 29 Minutes | 0 (0.0%) | 0 (0.0%) |
| 30 to 34 Minutes | 20 (13.3%) | 0 (0.0%) |
| 35 to 39 Minutes | 0 (0.0%) | 0 (0.0%) |
| 40 to 44 Minutes | 0 (0.0%) | 0 (0.0%) |
| 45 to 59 Minutes | 0 (0.0%) | 0 (0.0%) |
| 60 to 89 Minutes | 0 (0.0%) | 0 (0.0%) |
| 90 or more Minutes | 0 (0.0%) | 0 (0.0%) |
Time of Departure to Work by Sex in Chicopee
The most frequent times of departure to work in Chicopee are 7:30 AM to 7:59 AM (66, 44.0%) for males and 7:30 AM to 7:59 AM (68, 84.0%) for females.
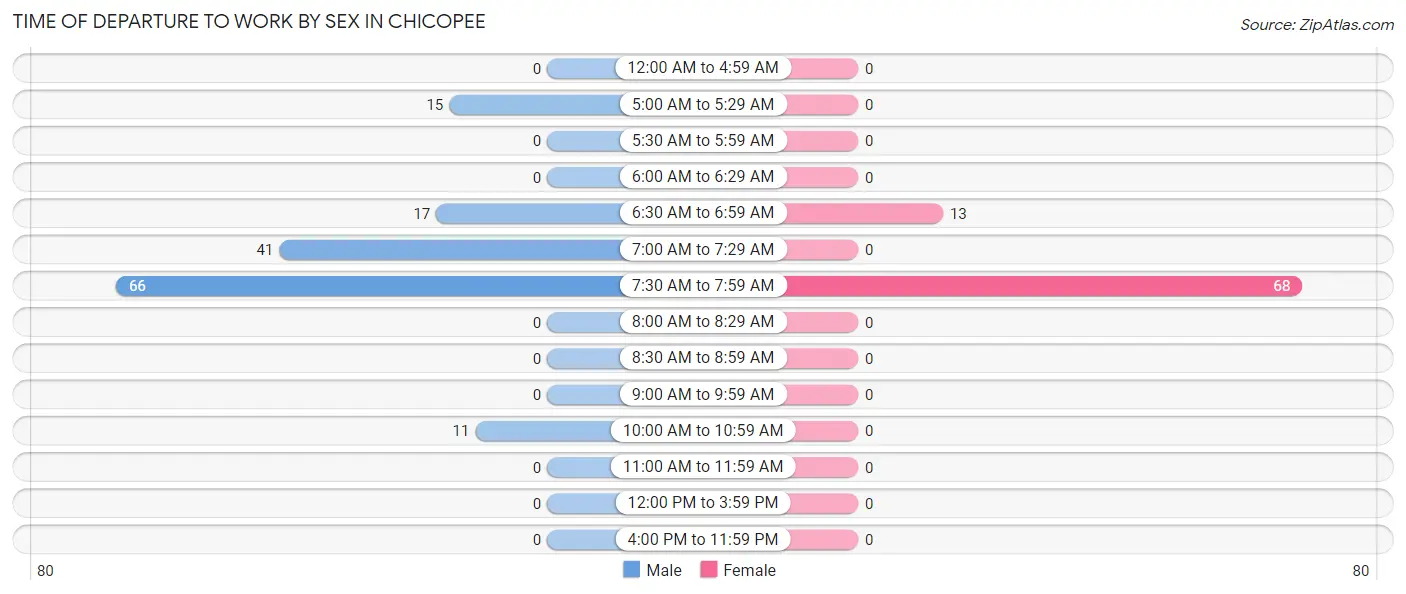
| Time of Departure | Male | Female |
| 12:00 AM to 4:59 AM | 0 (0.0%) | 0 (0.0%) |
| 5:00 AM to 5:29 AM | 15 (10.0%) | 0 (0.0%) |
| 5:30 AM to 5:59 AM | 0 (0.0%) | 0 (0.0%) |
| 6:00 AM to 6:29 AM | 0 (0.0%) | 0 (0.0%) |
| 6:30 AM to 6:59 AM | 17 (11.3%) | 13 (16.1%) |
| 7:00 AM to 7:29 AM | 41 (27.3%) | 0 (0.0%) |
| 7:30 AM to 7:59 AM | 66 (44.0%) | 68 (84.0%) |
| 8:00 AM to 8:29 AM | 0 (0.0%) | 0 (0.0%) |
| 8:30 AM to 8:59 AM | 0 (0.0%) | 0 (0.0%) |
| 9:00 AM to 9:59 AM | 0 (0.0%) | 0 (0.0%) |
| 10:00 AM to 10:59 AM | 11 (7.3%) | 0 (0.0%) |
| 11:00 AM to 11:59 AM | 0 (0.0%) | 0 (0.0%) |
| 12:00 PM to 3:59 PM | 0 (0.0%) | 0 (0.0%) |
| 4:00 PM to 11:59 PM | 0 (0.0%) | 0 (0.0%) |
| Total | 150 (100.0%) | 81 (100.0%) |
Housing Occupancy in Chicopee
Occupancy by Ownership in Chicopee
Of the total 166 dwellings in Chicopee, owner-occupied units account for 166 (100.0%), while renter-occupied units make up 0 (0.0%).
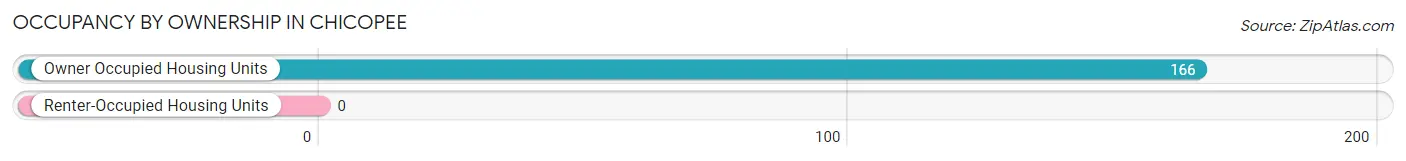
| Occupancy | # Housing Units | % Housing Units |
| Owner Occupied Housing Units | 166 | 100.0% |
| Renter-Occupied Housing Units | 0 | 0.0% |
| Total Occupied Housing Units | 166 | 100.0% |
Occupancy by Household Size in Chicopee
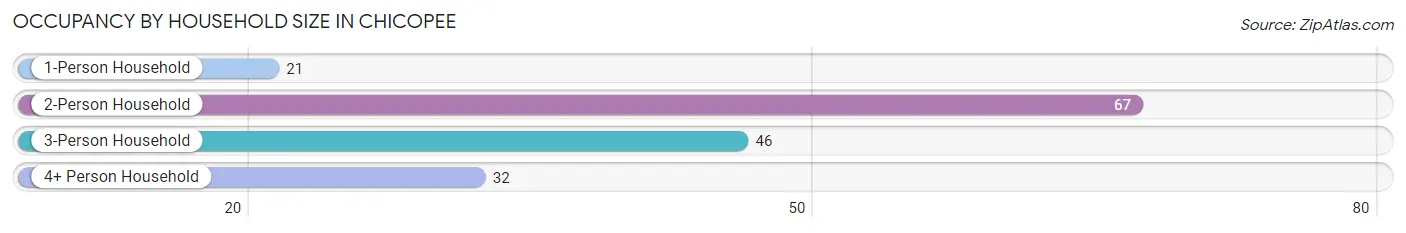
| Household Size | # Housing Units | % Housing Units |
| 1-Person Household | 21 | 12.7% |
| 2-Person Household | 67 | 40.4% |
| 3-Person Household | 46 | 27.7% |
| 4+ Person Household | 32 | 19.3% |
| Total Housing Units | 166 | 100.0% |
Occupancy by Ownership by Household Size in Chicopee
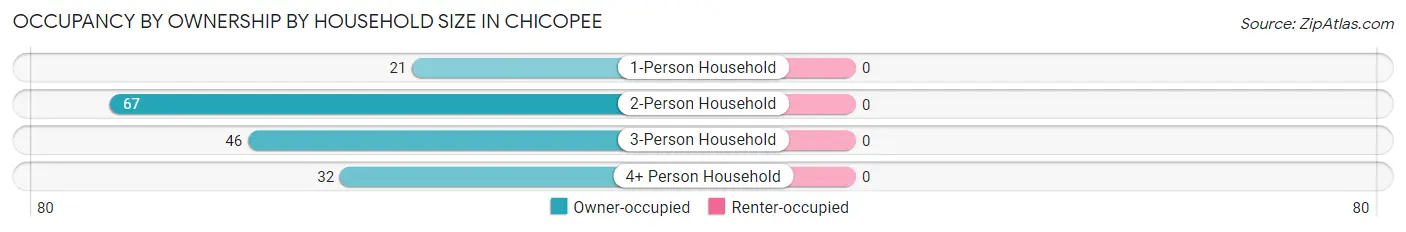
| Household Size | Owner-occupied | Renter-occupied |
| 1-Person Household | 21 (100.0%) | 0 (0.0%) |
| 2-Person Household | 67 (100.0%) | 0 (0.0%) |
| 3-Person Household | 46 (100.0%) | 0 (0.0%) |
| 4+ Person Household | 32 (100.0%) | 0 (0.0%) |
| Total Housing Units | 166 (100.0%) | 0 (0.0%) |
Occupancy by Educational Attainment in Chicopee
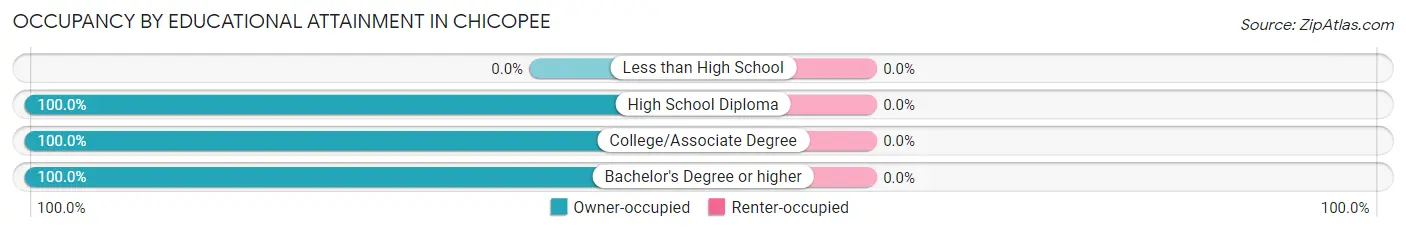
| Household Size | Owner-occupied | Renter-occupied |
| Less than High School | 0 (0.0%) | 0 (0.0%) |
| High School Diploma | 23 (100.0%) | 0 (0.0%) |
| College/Associate Degree | 42 (100.0%) | 0 (0.0%) |
| Bachelor's Degree or higher | 101 (100.0%) | 0 (0.0%) |
Occupancy by Age of Householder in Chicopee
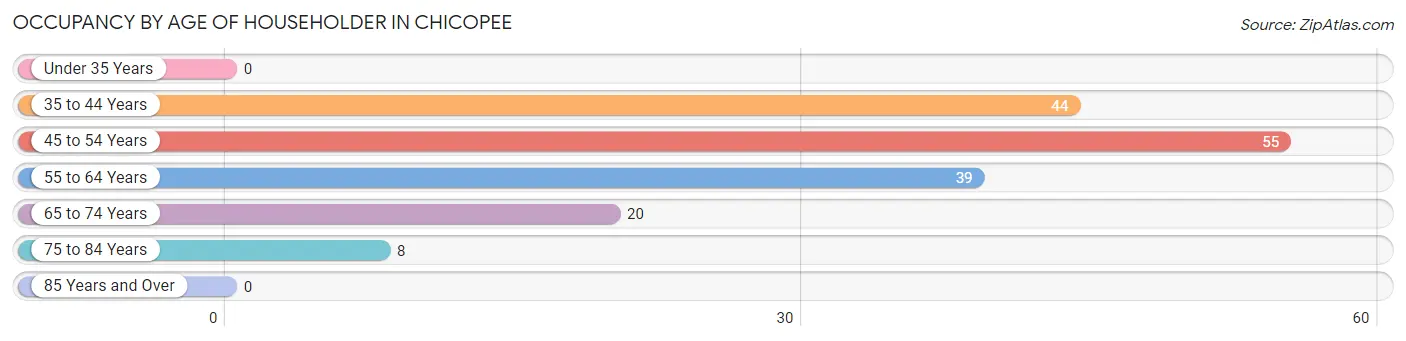
| Age Bracket | # Households | % Households |
| Under 35 Years | 0 | 0.0% |
| 35 to 44 Years | 44 | 26.5% |
| 45 to 54 Years | 55 | 33.1% |
| 55 to 64 Years | 39 | 23.5% |
| 65 to 74 Years | 20 | 12.0% |
| 75 to 84 Years | 8 | 4.8% |
| 85 Years and Over | 0 | 0.0% |
| Total | 166 | 100.0% |
Housing Finances in Chicopee
Median Income by Occupancy in Chicopee
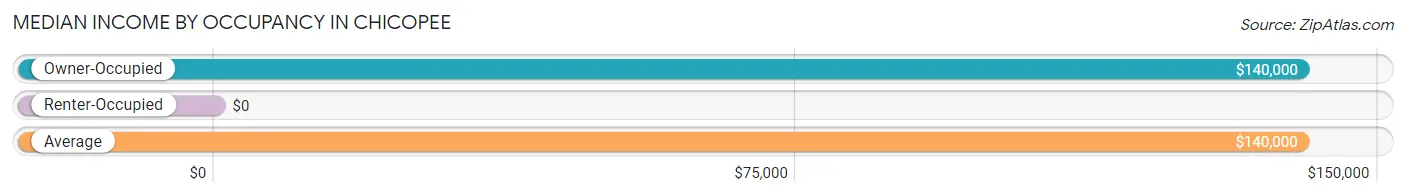
| Occupancy Type | # Households | Median Income |
| Owner-Occupied | 166 (100.0%) | $140,000 |
| Renter-Occupied | 0 (0.0%) | $0 |
| Average | 166 (100.0%) | $140,000 |
Occupancy by Householder Income Bracket in Chicopee
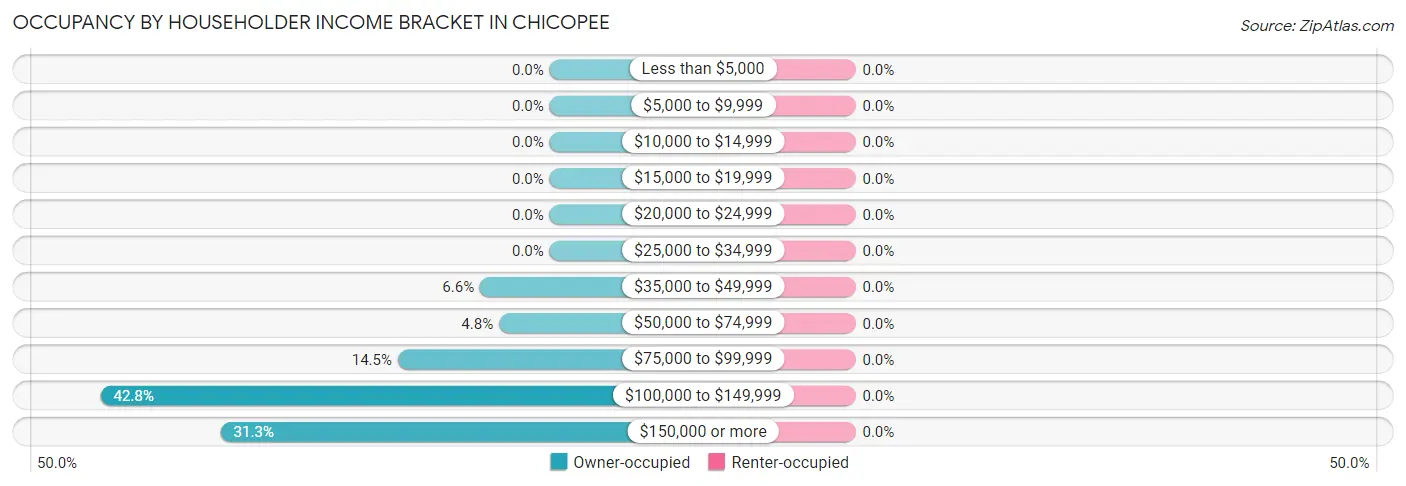
| Income Bracket | Owner-occupied | Renter-occupied |
| Less than $5,000 | 0 (0.0%) | 0 (0.0%) |
| $5,000 to $9,999 | 0 (0.0%) | 0 (0.0%) |
| $10,000 to $14,999 | 0 (0.0%) | 0 (0.0%) |
| $15,000 to $19,999 | 0 (0.0%) | 0 (0.0%) |
| $20,000 to $24,999 | 0 (0.0%) | 0 (0.0%) |
| $25,000 to $34,999 | 0 (0.0%) | 0 (0.0%) |
| $35,000 to $49,999 | 11 (6.6%) | 0 (0.0%) |
| $50,000 to $74,999 | 8 (4.8%) | 0 (0.0%) |
| $75,000 to $99,999 | 24 (14.5%) | 0 (0.0%) |
| $100,000 to $149,999 | 71 (42.8%) | 0 (0.0%) |
| $150,000 or more | 52 (31.3%) | 0 (0.0%) |
| Total | 166 (100.0%) | 0 (0.0%) |
Monthly Housing Cost Tiers in Chicopee
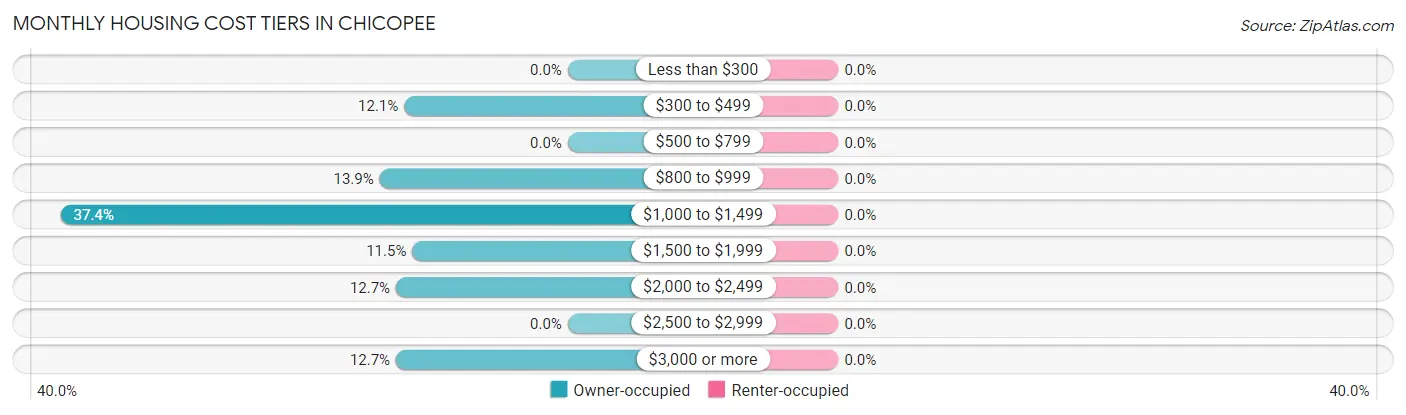
| Monthly Cost | Owner-occupied | Renter-occupied |
| Less than $300 | 0 (0.0%) | 0 (0.0%) |
| $300 to $499 | 20 (12.0%) | 0 (0.0%) |
| $500 to $799 | 0 (0.0%) | 0 (0.0%) |
| $800 to $999 | 23 (13.9%) | 0 (0.0%) |
| $1,000 to $1,499 | 62 (37.3%) | 0 (0.0%) |
| $1,500 to $1,999 | 19 (11.5%) | 0 (0.0%) |
| $2,000 to $2,499 | 21 (12.7%) | 0 (0.0%) |
| $2,500 to $2,999 | 0 (0.0%) | 0 (0.0%) |
| $3,000 or more | 21 (12.7%) | 0 (0.0%) |
| Total | 166 (100.0%) | 0 (0.0%) |
Physical Housing Characteristics in Chicopee
Housing Structures in Chicopee
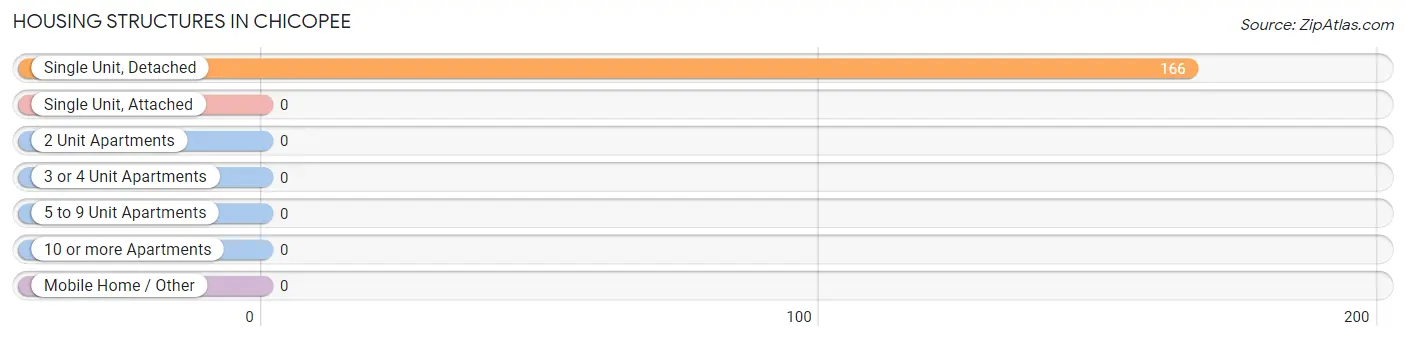
| Structure Type | # Housing Units | % Housing Units |
| Single Unit, Detached | 166 | 100.0% |
| Single Unit, Attached | 0 | 0.0% |
| 2 Unit Apartments | 0 | 0.0% |
| 3 or 4 Unit Apartments | 0 | 0.0% |
| 5 to 9 Unit Apartments | 0 | 0.0% |
| 10 or more Apartments | 0 | 0.0% |
| Mobile Home / Other | 0 | 0.0% |
| Total | 166 | 100.0% |
Housing Structures by Occupancy in Chicopee
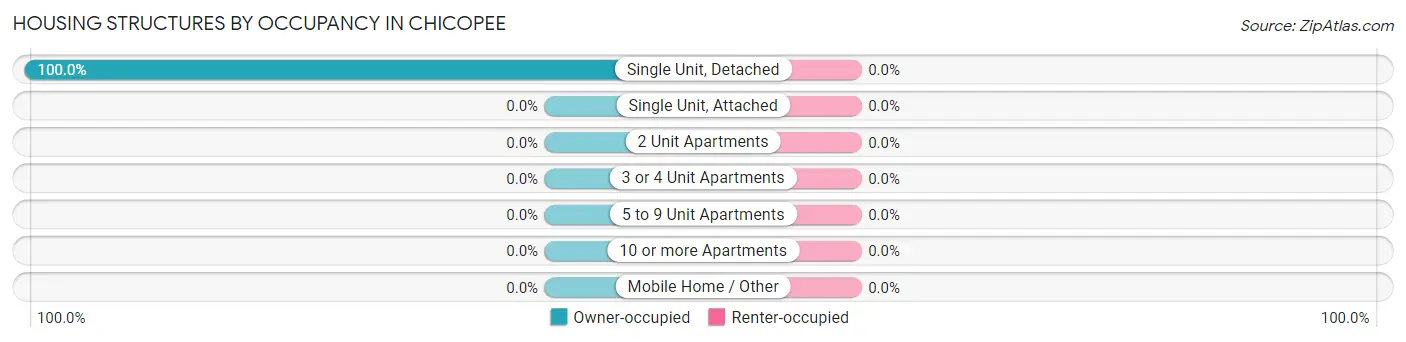
| Structure Type | Owner-occupied | Renter-occupied |
| Single Unit, Detached | 166 (100.0%) | 0 (0.0%) |
| Single Unit, Attached | 0 (0.0%) | 0 (0.0%) |
| 2 Unit Apartments | 0 (0.0%) | 0 (0.0%) |
| 3 or 4 Unit Apartments | 0 (0.0%) | 0 (0.0%) |
| 5 to 9 Unit Apartments | 0 (0.0%) | 0 (0.0%) |
| 10 or more Apartments | 0 (0.0%) | 0 (0.0%) |
| Mobile Home / Other | 0 (0.0%) | 0 (0.0%) |
| Total | 166 (100.0%) | 0 (0.0%) |
Housing Structures by Number of Rooms in Chicopee
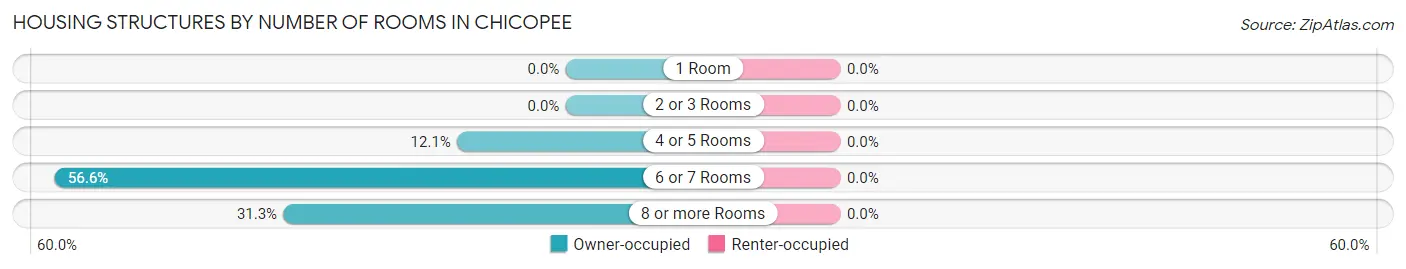
| Number of Rooms | Owner-occupied | Renter-occupied |
| 1 Room | 0 (0.0%) | 0 (0.0%) |
| 2 or 3 Rooms | 0 (0.0%) | 0 (0.0%) |
| 4 or 5 Rooms | 20 (12.0%) | 0 (0.0%) |
| 6 or 7 Rooms | 94 (56.6%) | 0 (0.0%) |
| 8 or more Rooms | 52 (31.3%) | 0 (0.0%) |
| Total | 166 (100.0%) | 0 (0.0%) |
Housing Structure by Heating Type in Chicopee
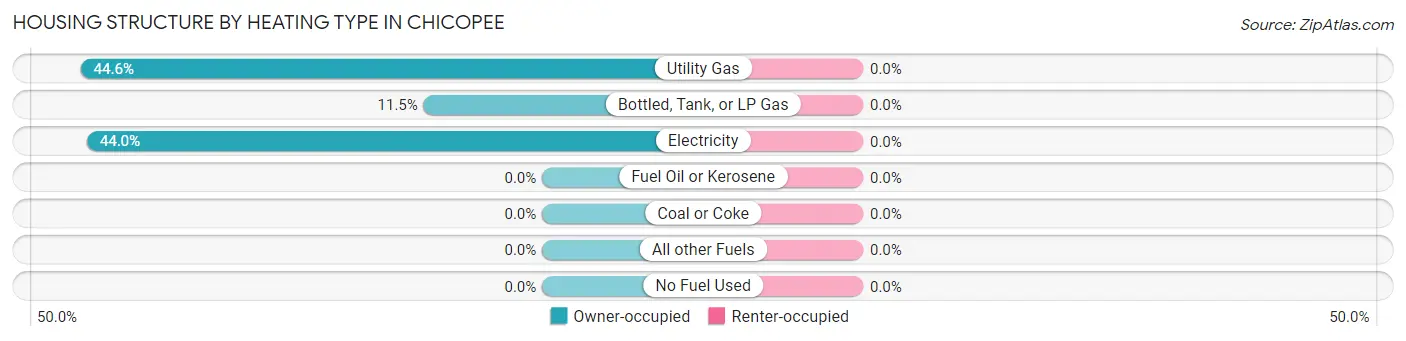
| Heating Type | Owner-occupied | Renter-occupied |
| Utility Gas | 74 (44.6%) | 0 (0.0%) |
| Bottled, Tank, or LP Gas | 19 (11.5%) | 0 (0.0%) |
| Electricity | 73 (44.0%) | 0 (0.0%) |
| Fuel Oil or Kerosene | 0 (0.0%) | 0 (0.0%) |
| Coal or Coke | 0 (0.0%) | 0 (0.0%) |
| All other Fuels | 0 (0.0%) | 0 (0.0%) |
| No Fuel Used | 0 (0.0%) | 0 (0.0%) |
| Total | 166 (100.0%) | 0 (0.0%) |
Household Vehicle Usage in Chicopee
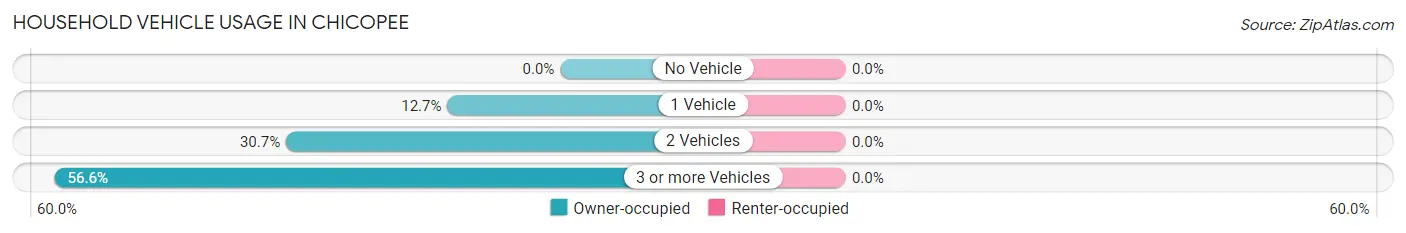
| Vehicles per Household | Owner-occupied | Renter-occupied |
| No Vehicle | 0 (0.0%) | 0 (0.0%) |
| 1 Vehicle | 21 (12.7%) | 0 (0.0%) |
| 2 Vehicles | 51 (30.7%) | 0 (0.0%) |
| 3 or more Vehicles | 94 (56.6%) | 0 (0.0%) |
| Total | 166 (100.0%) | 0 (0.0%) |
Real Estate & Mortgages in Chicopee
Real Estate and Mortgage Overview in Chicopee
| Characteristic | Without Mortgage | With Mortgage |
| Housing Units | 59 | 107 |
| Median Property Value | $565,600 | $217,900 |
| Median Household Income | $250,001 | $21 |
| Monthly Housing Costs | $1,105 | $21 |
| Real Estate Taxes | $4,244 | $0 |
Property Value by Mortgage Status in Chicopee
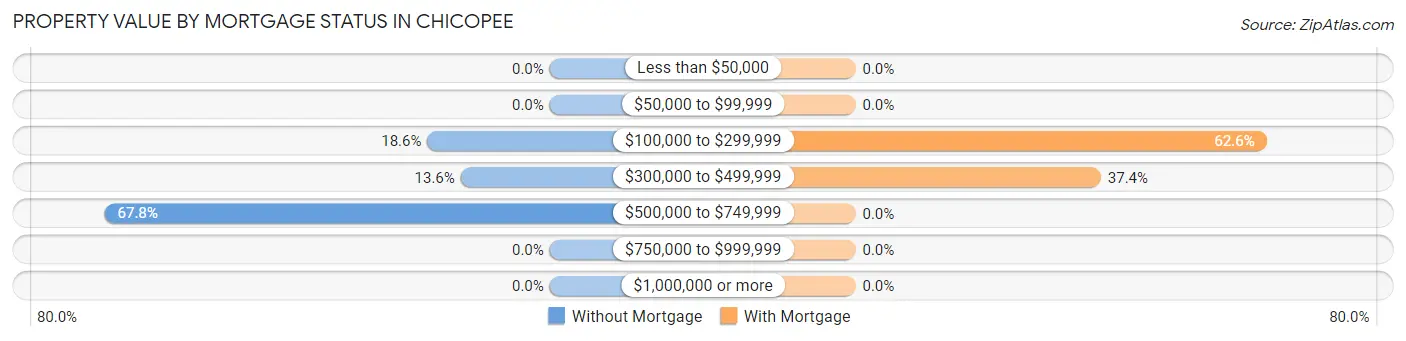
| Property Value | Without Mortgage | With Mortgage |
| Less than $50,000 | 0 (0.0%) | 0 (0.0%) |
| $50,000 to $99,999 | 0 (0.0%) | 0 (0.0%) |
| $100,000 to $299,999 | 11 (18.6%) | 67 (62.6%) |
| $300,000 to $499,999 | 8 (13.6%) | 40 (37.4%) |
| $500,000 to $749,999 | 40 (67.8%) | 0 (0.0%) |
| $750,000 to $999,999 | 0 (0.0%) | 0 (0.0%) |
| $1,000,000 or more | 0 (0.0%) | 0 (0.0%) |
| Total | 59 (100.0%) | 107 (100.0%) |
Household Income by Mortgage Status in Chicopee
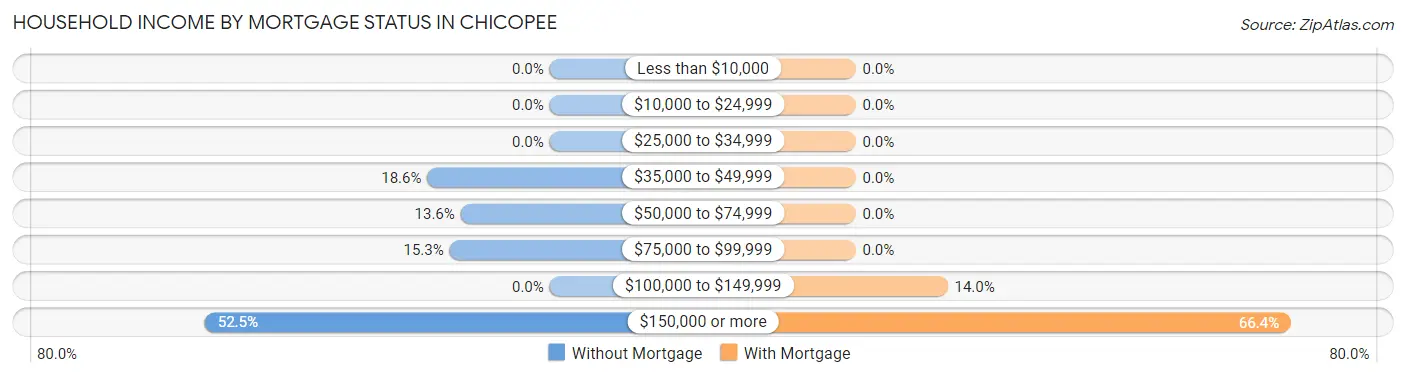
| Household Income | Without Mortgage | With Mortgage |
| Less than $10,000 | 0 (0.0%) | 0 (0.0%) |
| $10,000 to $24,999 | 0 (0.0%) | 0 (0.0%) |
| $25,000 to $34,999 | 0 (0.0%) | 0 (0.0%) |
| $35,000 to $49,999 | 11 (18.6%) | 0 (0.0%) |
| $50,000 to $74,999 | 8 (13.6%) | 0 (0.0%) |
| $75,000 to $99,999 | 9 (15.2%) | 0 (0.0%) |
| $100,000 to $149,999 | 0 (0.0%) | 15 (14.0%) |
| $150,000 or more | 31 (52.5%) | 71 (66.4%) |
| Total | 59 (100.0%) | 107 (100.0%) |
Property Value to Household Income Ratio in Chicopee
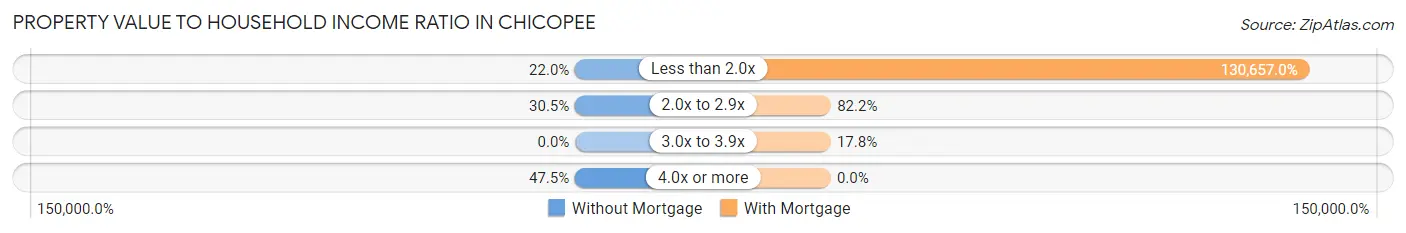
| Value-to-Income Ratio | Without Mortgage | With Mortgage |
| Less than 2.0x | 13 (22.0%) | 139,803 (130,657.0%) |
| 2.0x to 2.9x | 18 (30.5%) | 88 (82.2%) |
| 3.0x to 3.9x | 0 (0.0%) | 19 (17.8%) |
| 4.0x or more | 28 (47.5%) | 0 (0.0%) |
| Total | 59 (100.0%) | 107 (100.0%) |
Real Estate Taxes by Mortgage Status in Chicopee
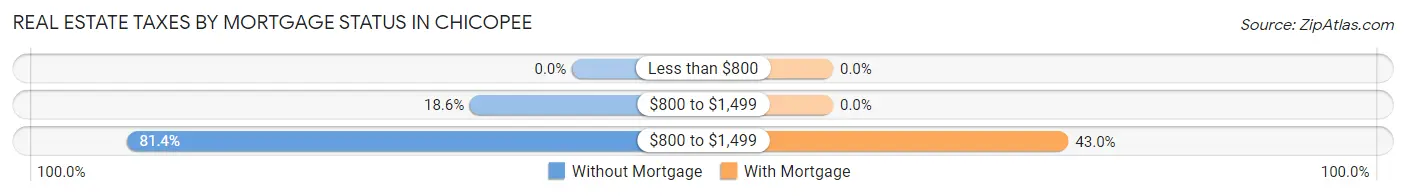
| Property Taxes | Without Mortgage | With Mortgage |
| Less than $800 | 0 (0.0%) | 0 (0.0%) |
| $800 to $1,499 | 11 (18.6%) | 0 (0.0%) |
| $800 to $1,499 | 48 (81.4%) | 46 (43.0%) |
| Total | 59 (100.0%) | 107 (100.0%) |
Health & Disability in Chicopee
Health Insurance Coverage by Age in Chicopee
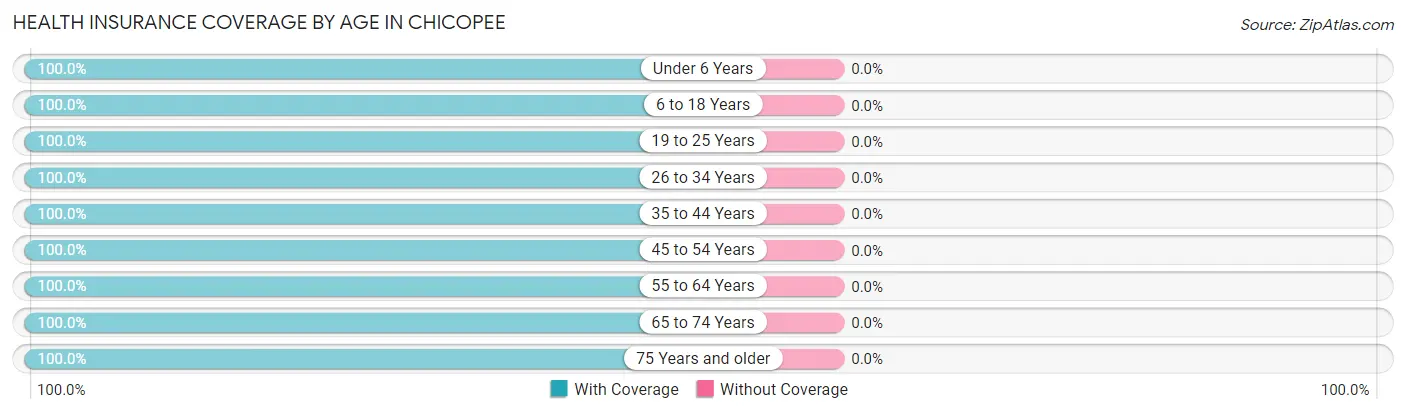
| Age Bracket | With Coverage | Without Coverage |
| Under 6 Years | 25 (100.0%) | 0 (0.0%) |
| 6 to 18 Years | 47 (100.0%) | 0 (0.0%) |
| 19 to 25 Years | 11 (100.0%) | 0 (0.0%) |
| 26 to 34 Years | 31 (100.0%) | 0 (0.0%) |
| 35 to 44 Years | 60 (100.0%) | 0 (0.0%) |
| 45 to 54 Years | 82 (100.0%) | 0 (0.0%) |
| 55 to 64 Years | 59 (100.0%) | 0 (0.0%) |
| 65 to 74 Years | 58 (100.0%) | 0 (0.0%) |
| 75 Years and older | 15 (100.0%) | 0 (0.0%) |
| Total | 388 (100.0%) | 0 (0.0%) |
Health Insurance Coverage by Citizenship Status in Chicopee

| Citizenship Status | With Coverage | Without Coverage |
| Native Born | 25 (100.0%) | 0 (0.0%) |
| Foreign Born, Citizen | 47 (100.0%) | 0 (0.0%) |
| Foreign Born, not a Citizen | 11 (100.0%) | 0 (0.0%) |
Health Insurance Coverage by Household Income in Chicopee
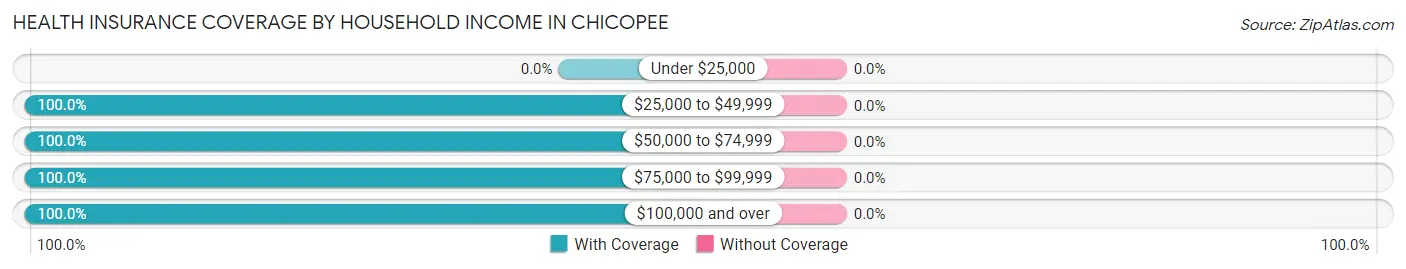
| Household Income | With Coverage | Without Coverage |
| Under $25,000 | 0 (0.0%) | 0 (0.0%) |
| $25,000 to $49,999 | 21 (100.0%) | 0 (0.0%) |
| $50,000 to $74,999 | 15 (100.0%) | 0 (0.0%) |
| $75,000 to $99,999 | 63 (100.0%) | 0 (0.0%) |
| $100,000 and over | 289 (100.0%) | 0 (0.0%) |
Public vs Private Health Insurance Coverage by Age in Chicopee
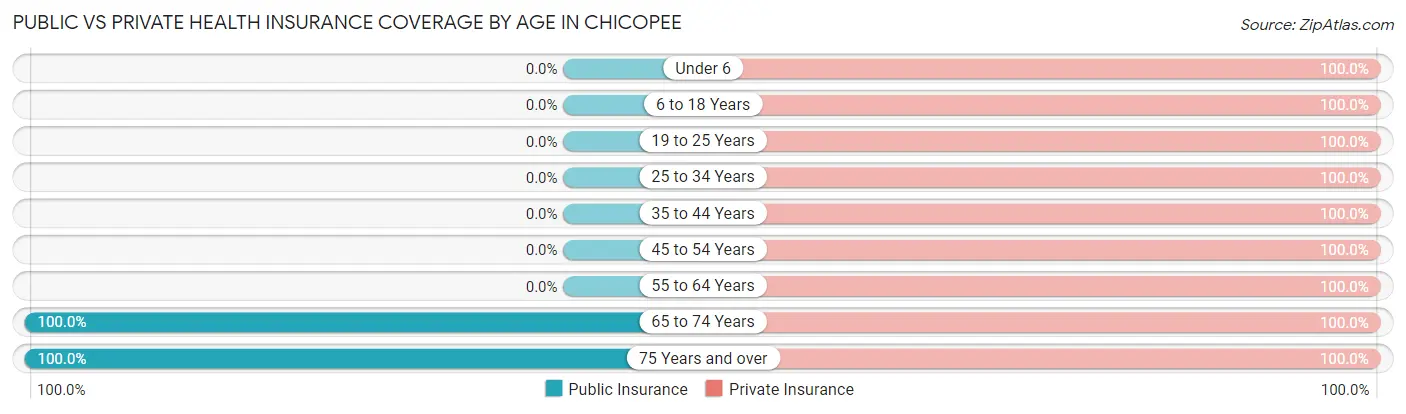
| Age Bracket | Public Insurance | Private Insurance |
| Under 6 | 0 (0.0%) | 25 (100.0%) |
| 6 to 18 Years | 0 (0.0%) | 47 (100.0%) |
| 19 to 25 Years | 0 (0.0%) | 11 (100.0%) |
| 25 to 34 Years | 0 (0.0%) | 31 (100.0%) |
| 35 to 44 Years | 0 (0.0%) | 60 (100.0%) |
| 45 to 54 Years | 0 (0.0%) | 82 (100.0%) |
| 55 to 64 Years | 0 (0.0%) | 59 (100.0%) |
| 65 to 74 Years | 58 (100.0%) | 58 (100.0%) |
| 75 Years and over | 15 (100.0%) | 15 (100.0%) |
| Total | 73 (18.8%) | 388 (100.0%) |
Disability Status by Sex by Age in Chicopee
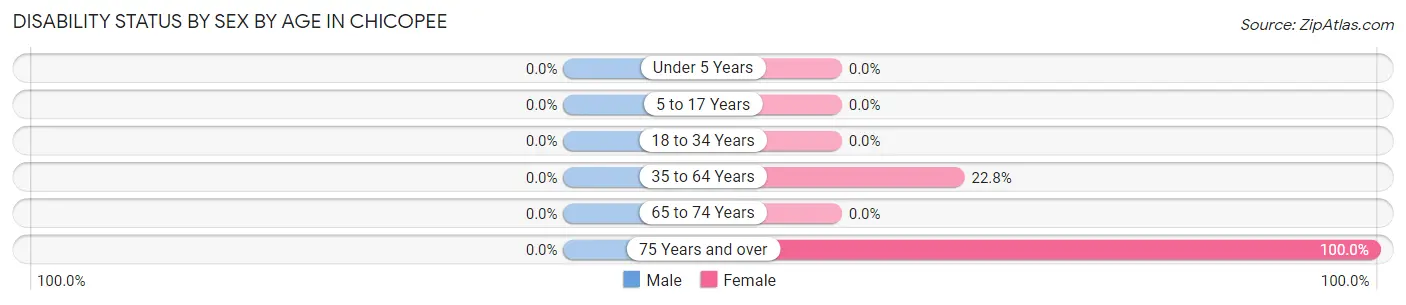
| Age Bracket | Male | Female |
| Under 5 Years | 0 (0.0%) | 0 (0.0%) |
| 5 to 17 Years | 0 (0.0%) | 0 (0.0%) |
| 18 to 34 Years | 0 (0.0%) | 0 (0.0%) |
| 35 to 64 Years | 0 (0.0%) | 18 (22.8%) |
| 65 to 74 Years | 0 (0.0%) | 0 (0.0%) |
| 75 Years and over | 0 (0.0%) | 8 (100.0%) |
Disability Class by Sex by Age in Chicopee
Disability Class: Hearing Difficulty
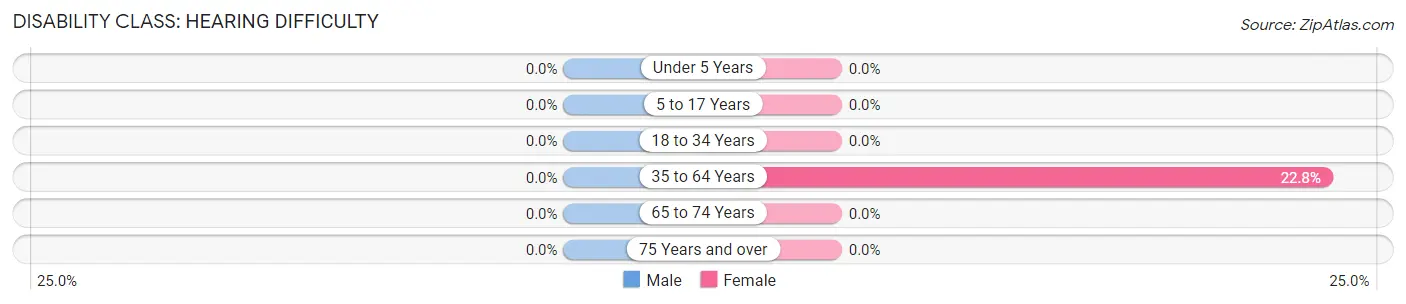
| Age Bracket | Male | Female |
| Under 5 Years | 0 (0.0%) | 0 (0.0%) |
| 5 to 17 Years | 0 (0.0%) | 0 (0.0%) |
| 18 to 34 Years | 0 (0.0%) | 0 (0.0%) |
| 35 to 64 Years | 0 (0.0%) | 18 (22.8%) |
| 65 to 74 Years | 0 (0.0%) | 0 (0.0%) |
| 75 Years and over | 0 (0.0%) | 0 (0.0%) |
Disability Class: Vision Difficulty
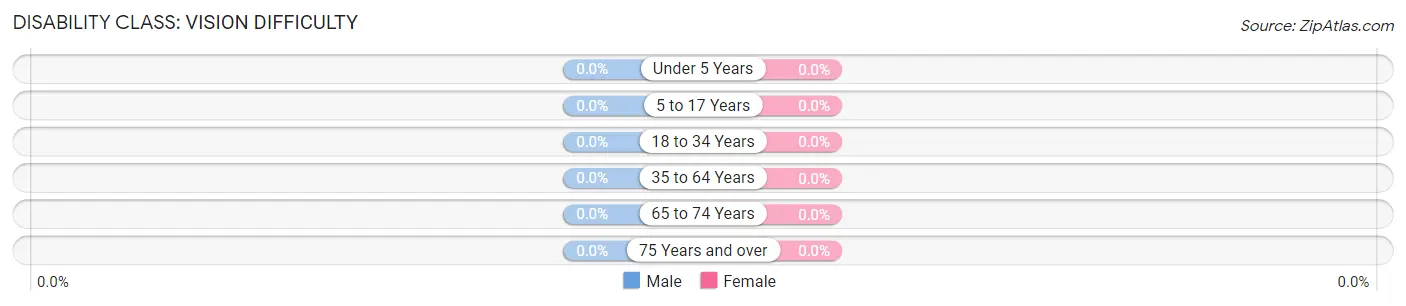
| Age Bracket | Male | Female |
| Under 5 Years | 0 (0.0%) | 0 (0.0%) |
| 5 to 17 Years | 0 (0.0%) | 0 (0.0%) |
| 18 to 34 Years | 0 (0.0%) | 0 (0.0%) |
| 35 to 64 Years | 0 (0.0%) | 0 (0.0%) |
| 65 to 74 Years | 0 (0.0%) | 0 (0.0%) |
| 75 Years and over | 0 (0.0%) | 0 (0.0%) |
Disability Class: Cognitive Difficulty
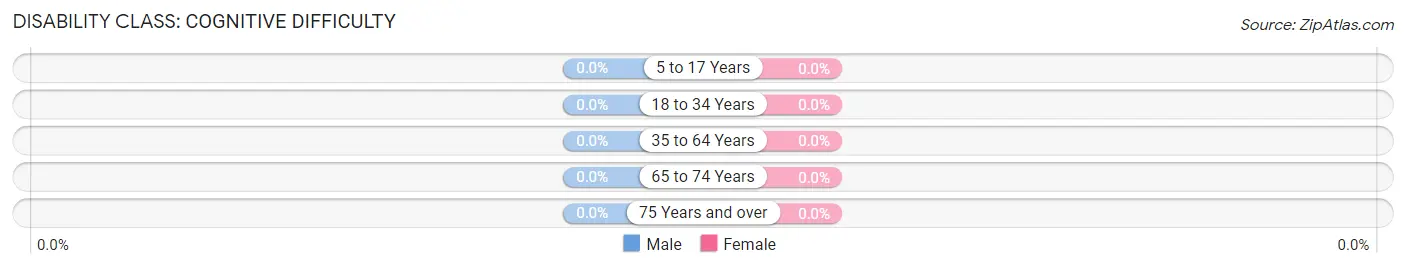
| Age Bracket | Male | Female |
| 5 to 17 Years | 0 (0.0%) | 0 (0.0%) |
| 18 to 34 Years | 0 (0.0%) | 0 (0.0%) |
| 35 to 64 Years | 0 (0.0%) | 0 (0.0%) |
| 65 to 74 Years | 0 (0.0%) | 0 (0.0%) |
| 75 Years and over | 0 (0.0%) | 0 (0.0%) |
Disability Class: Ambulatory Difficulty
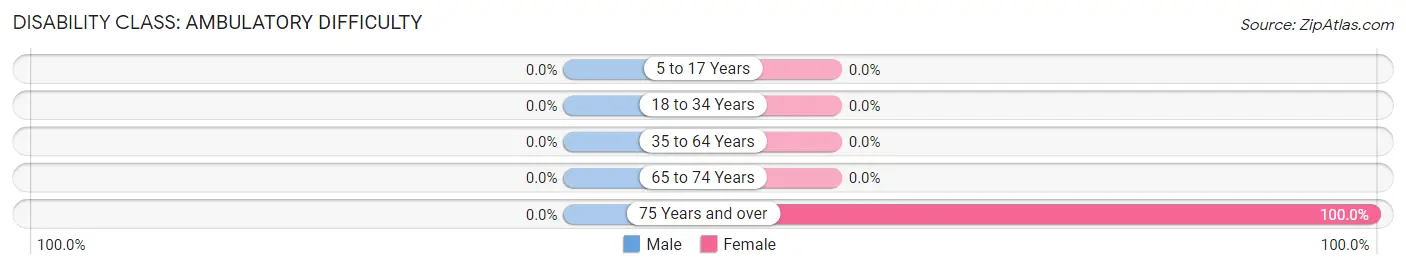
| Age Bracket | Male | Female |
| 5 to 17 Years | 0 (0.0%) | 0 (0.0%) |
| 18 to 34 Years | 0 (0.0%) | 0 (0.0%) |
| 35 to 64 Years | 0 (0.0%) | 0 (0.0%) |
| 65 to 74 Years | 0 (0.0%) | 0 (0.0%) |
| 75 Years and over | 0 (0.0%) | 8 (100.0%) |
Disability Class: Self-Care Difficulty
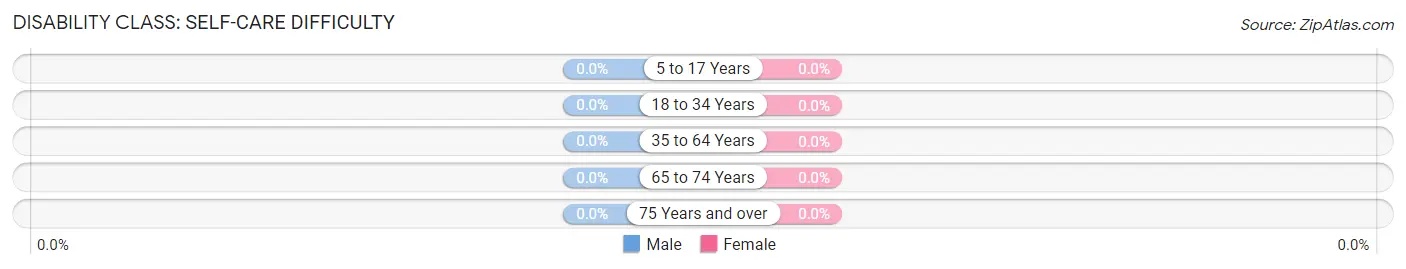
| Age Bracket | Male | Female |
| 5 to 17 Years | 0 (0.0%) | 0 (0.0%) |
| 18 to 34 Years | 0 (0.0%) | 0 (0.0%) |
| 35 to 64 Years | 0 (0.0%) | 0 (0.0%) |
| 65 to 74 Years | 0 (0.0%) | 0 (0.0%) |
| 75 Years and over | 0 (0.0%) | 0 (0.0%) |
Technology Access in Chicopee
Computing Device Access in Chicopee
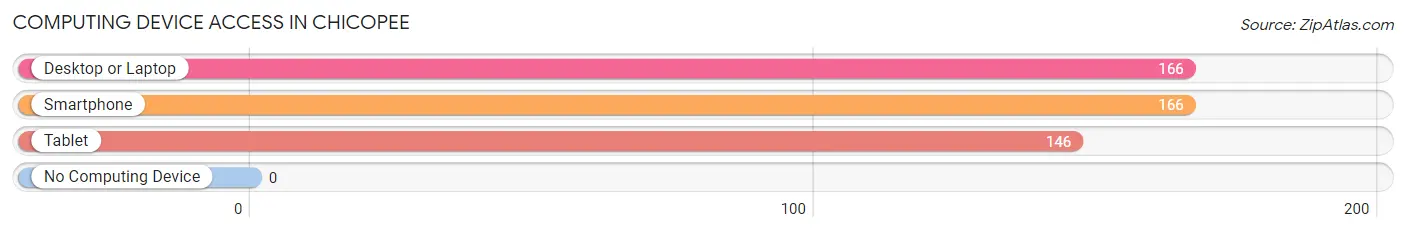
| Device Type | # Households | % Households |
| Desktop or Laptop | 166 | 100.0% |
| Smartphone | 166 | 100.0% |
| Tablet | 146 | 87.9% |
| No Computing Device | 0 | 0.0% |
| Total | 166 | 100.0% |
Internet Access in Chicopee
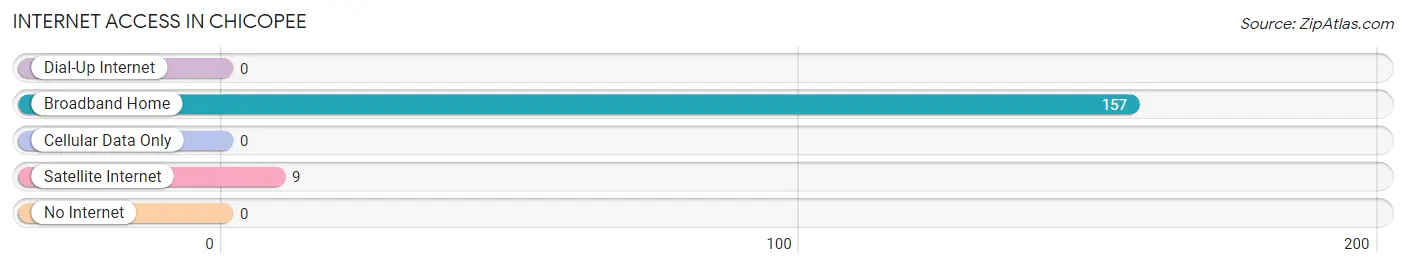
| Internet Type | # Households | % Households |
| Dial-Up Internet | 0 | 0.0% |
| Broadband Home | 157 | 94.6% |
| Cellular Data Only | 0 | 0.0% |
| Satellite Internet | 9 | 5.4% |
| No Internet | 0 | 0.0% |
| Total | 166 | 100.0% |
Chicopee Summary
Chicopee, Kansas is a small city located in the northeastern corner of the state, just south of the Kansas-Missouri border. It is part of the Kansas City metropolitan area and is home to a population of just over 1,000 people. The city is known for its small-town charm and its close proximity to the larger cities of Kansas City and Topeka.
History
Chicopee was founded in 1887 by a group of settlers from the nearby town of Leavenworth. The town was named after the nearby Chicopee Creek, which was named after the Native American tribe that once lived in the area. The town was originally a farming community, but it soon became a popular stop for travelers on the Santa Fe Trail. In the early 1900s, the town began to grow and develop, and by the 1920s it had become a thriving community.
Geography
Chicopee is located in the northeastern corner of Kansas, just south of the Kansas-Missouri border. It is part of the Kansas City metropolitan area and is situated in Leavenworth County. The city is located on the banks of the Missouri River and is surrounded by rolling hills and farmland. The city has a total area of 1.2 square miles, all of which is land.
Economy
Chicopee’s economy is largely based on agriculture and tourism. The city is home to several farms, which produce a variety of crops, including corn, soybeans, wheat, and hay. The city is also home to several small businesses, including restaurants, retail stores, and service providers. In addition, the city is home to a number of tourist attractions, including the historic Santa Fe Trail, the Leavenworth County Historical Museum, and the Leavenworth County Fairgrounds.
Demographics
As of the 2010 census, the population of Chicopee was 1,039. The racial makeup of the city was 95.3% White, 0.7% African American, 0.3% Native American, 0.3% Asian, 0.1% Pacific Islander, 1.2% from other races, and 2.4% from two or more races. Hispanic or Latino of any race were 3.2% of the population. The median household income in the city was $41,250, and the median family income was $48,750. The per capita income for the city was $19,945.
Conclusion
Chicopee, Kansas is a small city located in the northeastern corner of the state, just south of the Kansas-Missouri border. It is part of the Kansas City metropolitan area and is home to a population of just over 1,000 people. The city is known for its small-town charm and its close proximity to the larger cities of Kansas City and Topeka. The economy of Chicopee is largely based on agriculture and tourism, and the city is home to several farms, small businesses, and tourist attractions. The population of Chicopee is largely white, with a small percentage of African American, Native American, Asian, and Pacific Islander residents. The median household income in the city is $41,250, and the median family income is $48,750.
Common Questions
What is the Total Population of Chicopee?
Total Population of Chicopee is 388.
What is the Total Male Population of Chicopee?
Total Male Population of Chicopee is 187.
What is the Total Female Population of Chicopee?
Total Female Population of Chicopee is 201.
What is the Ratio of Males per 100 Females in Chicopee?
There are 93.03 Males per 100 Females in Chicopee.
What is the Ratio of Females per 100 Males in Chicopee?
There are 107.49 Females per 100 Males in Chicopee.
What is the Median Population Age in Chicopee?
Median Population Age in Chicopee is 48.3 Years.
What is the Average Family Size in Chicopee
Average Family Size in Chicopee is 2.5 People.
What is the Average Household Size in Chicopee
Average Household Size in Chicopee is 2.3 People.
What is Per Capita Income in Chicopee?
Per Capita income in Chicopee is $77,178.
What is the Median Family Income in Chicopee?
Median Family Income in Chicopee is $138,618.
What is the Median Household income in Chicopee?
Median Household Income in Chicopee is $140,000.
What is Inequality or Gini Index in Chicopee?
Inequality or Gini Index in Chicopee is 0.31.
How Large is the Labor Force in Chicopee?
There are 231 People in the Labor Forcein in Chicopee.
What is the Percentage of People in the Labor Force in Chicopee?
65.6% of People are in the Labor Force in Chicopee.