Climax, KS
Climax Map
Climax Overview
48
TOTAL POPULATION
23
MALE POPULATION
25
FEMALE POPULATION
92.00
MALES / 100 FEMALES
108.70
FEMALES / 100 MALES
51.0
MEDIAN AGE
2.4
AVG FAMILY SIZE
2.3
AVG HOUSEHOLD SIZE
$36,760
PER CAPITA INCOME
$68,750
AVG FAMILY INCOME
$68,250
AVG HOUSEHOLD INCOME
0.43
INEQUALITY / GINI INDEX
18
LABOR FORCE [ PEOPLE ]
48.6%
PERCENT IN LABOR FORCE
Climax Area Codes
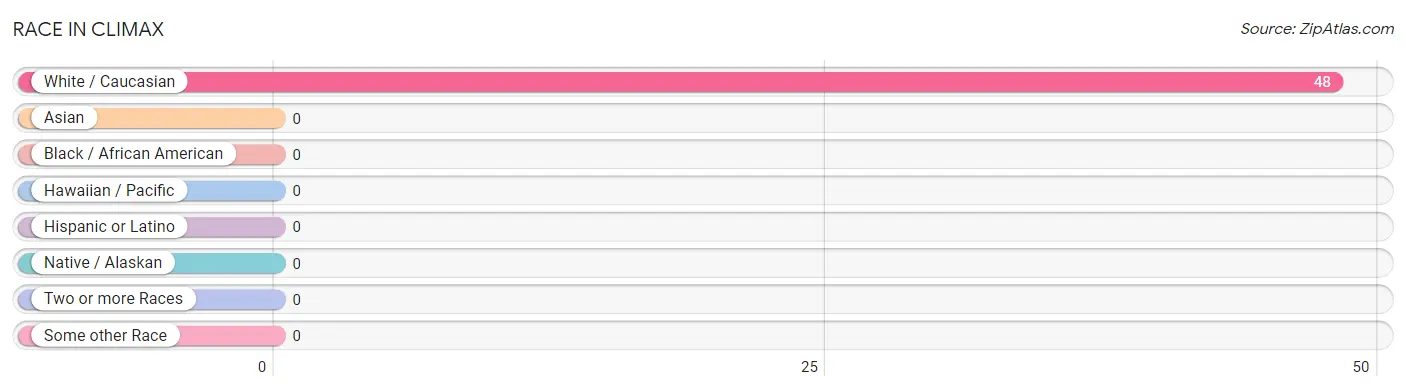
Race in Climax
The most populous races in Climax are , and White / Caucasian (48 | 100.0%).
| Race | # Population | % Population |
| Asian | 0 | 0.0% |
| Black / African American | 0 | 0.0% |
| Hawaiian / Pacific | 0 | 0.0% |
| Hispanic or Latino | 0 | 0.0% |
| Native / Alaskan | 0 | 0.0% |
| White / Caucasian | 48 | 100.0% |
| Two or more Races | 0 | 0.0% |
| Some other Race | 0 | 0.0% |
| Total | 48 | 100.0% |
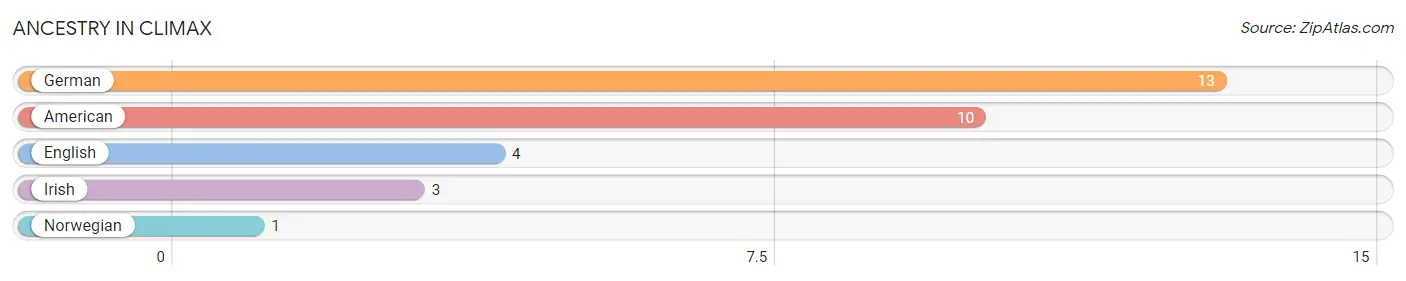
Ancestry in Climax
The most populous ancestries reported in Climax are German (13 | 27.1%), American (10 | 20.8%), English (4 | 8.3%), Irish (3 | 6.2%), and Norwegian (1 | 2.1%), together accounting for 64.6% of all Climax residents.
| Ancestry | # Population | % Population |
| American | 10 | 20.8% |
| English | 4 | 8.3% |
| German | 13 | 27.1% |
| Irish | 3 | 6.2% |
| Norwegian | 1 | 2.1% | View All 5 Rows |
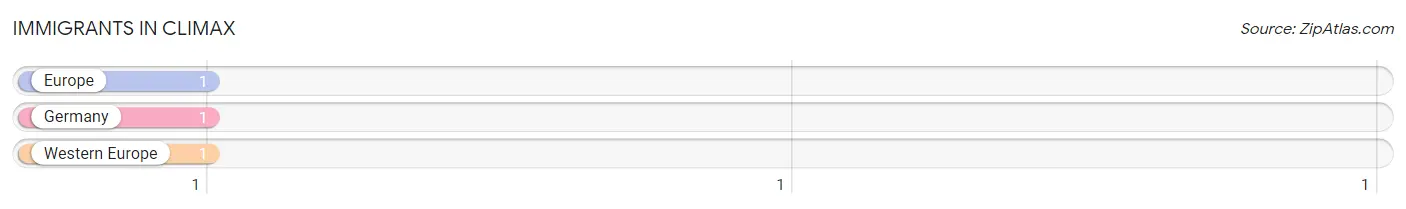
Immigrants in Climax
The most numerous immigrant groups reported in Climax came from Europe (1 | 2.1%), Germany (1 | 2.1%), and Western Europe (1 | 2.1%), together accounting for 6.2% of all Climax residents.
| Immigration Origin | # Population | % Population |
| Europe | 1 | 2.1% |
| Germany | 1 | 2.1% |
| Western Europe | 1 | 2.1% | View All 3 Rows |
Sex and Age in Climax
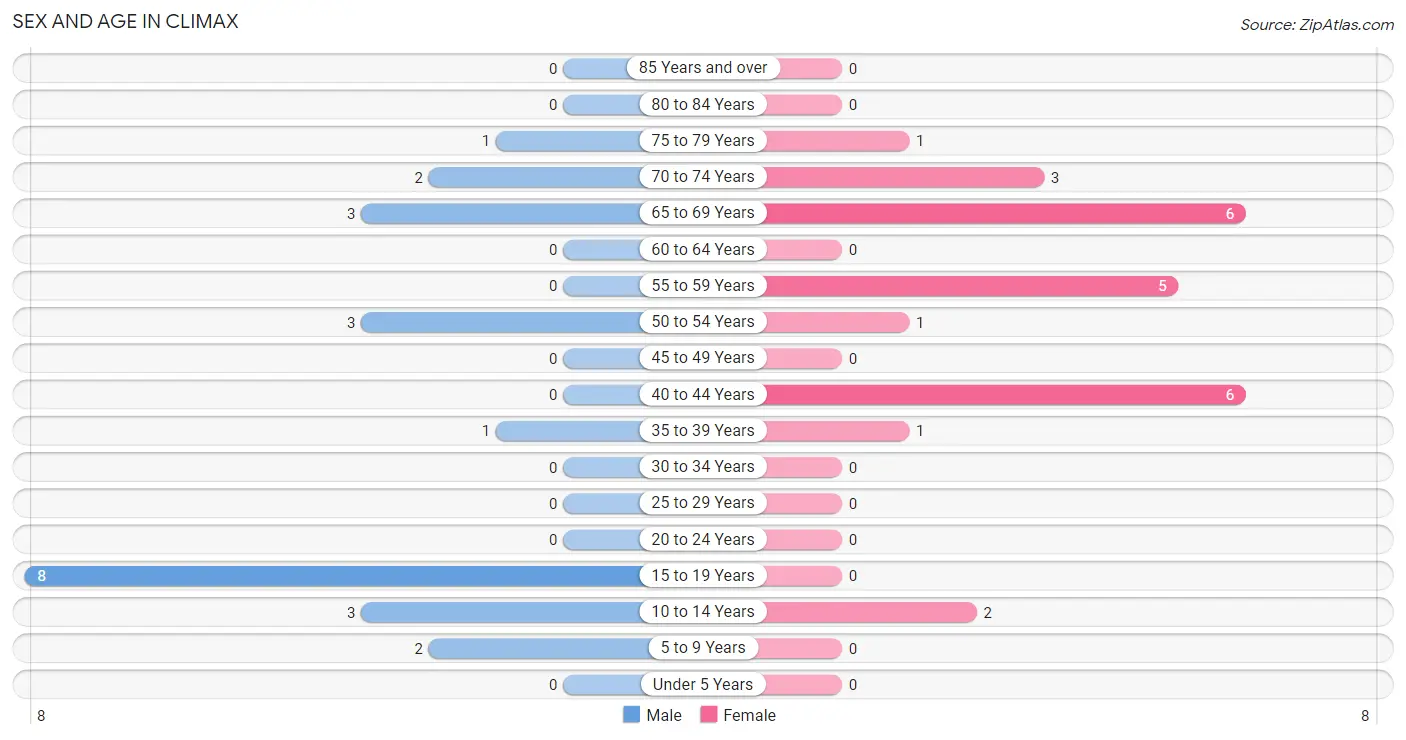
Sex and Age in Climax
The most populous age groups in Climax are 15 to 19 Years (8 | 34.8%) for men and 40 to 44 Years (6 | 24.0%) for women.
| Age Bracket | Male | Female |
| Under 5 Years | 0 (0.0%) | 0 (0.0%) |
| 5 to 9 Years | 2 (8.7%) | 0 (0.0%) |
| 10 to 14 Years | 3 (13.0%) | 2 (8.0%) |
| 15 to 19 Years | 8 (34.8%) | 0 (0.0%) |
| 20 to 24 Years | 0 (0.0%) | 0 (0.0%) |
| 25 to 29 Years | 0 (0.0%) | 0 (0.0%) |
| 30 to 34 Years | 0 (0.0%) | 0 (0.0%) |
| 35 to 39 Years | 1 (4.3%) | 1 (4.0%) |
| 40 to 44 Years | 0 (0.0%) | 6 (24.0%) |
| 45 to 49 Years | 0 (0.0%) | 0 (0.0%) |
| 50 to 54 Years | 3 (13.0%) | 1 (4.0%) |
| 55 to 59 Years | 0 (0.0%) | 5 (20.0%) |
| 60 to 64 Years | 0 (0.0%) | 0 (0.0%) |
| 65 to 69 Years | 3 (13.0%) | 6 (24.0%) |
| 70 to 74 Years | 2 (8.7%) | 3 (12.0%) |
| 75 to 79 Years | 1 (4.3%) | 1 (4.0%) |
| 80 to 84 Years | 0 (0.0%) | 0 (0.0%) |
| 85 Years and over | 0 (0.0%) | 0 (0.0%) |
| Total | 23 (100.0%) | 25 (100.0%) |
Families and Households in Climax
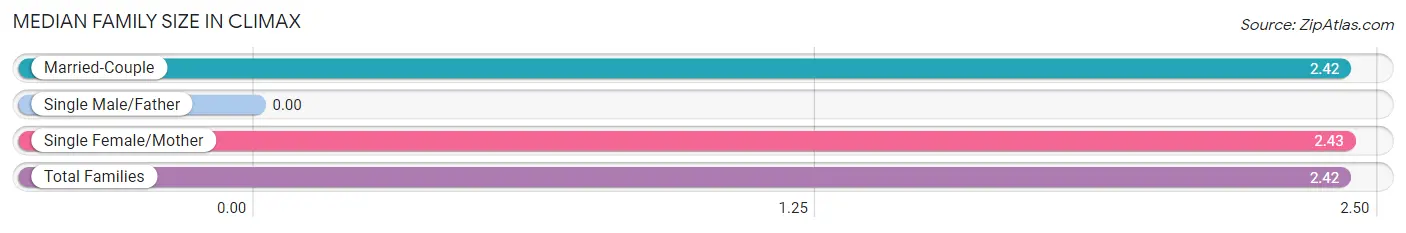
Median Family Size in Climax
| Family Type | # Families | Family Size |
| Married-Couple | 12 (63.2%) | 2.42 |
| Single Male/Father | 0 (0.0%) | - |
| Single Female/Mother | 7 (36.8%) | 2.43 |
| Total Families | 19 (100.0%) | 2.42 |
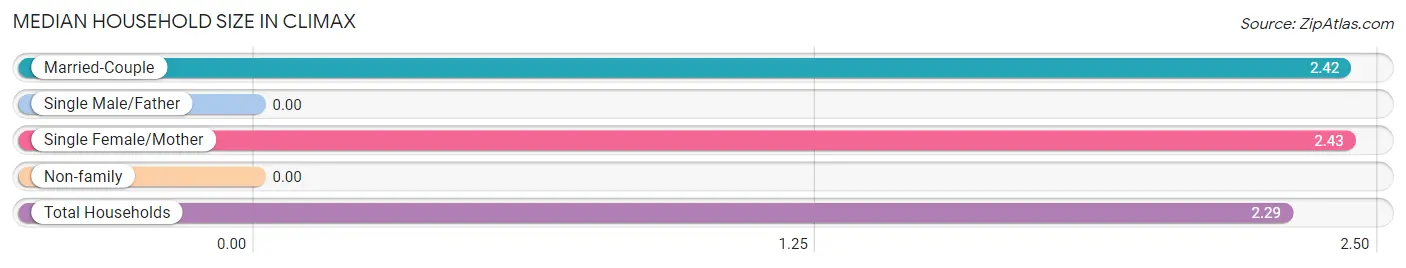
Median Household Size in Climax
| Household Type | # Households | Household Size |
| Married-Couple | 12 (57.1%) | 2.42 |
| Single Male/Father | 0 (0.0%) | - |
| Single Female/Mother | 7 (33.3%) | 2.43 |
| Non-family | 2 (9.5%) | - |
| Total Households | 21 (100.0%) | 2.29 |
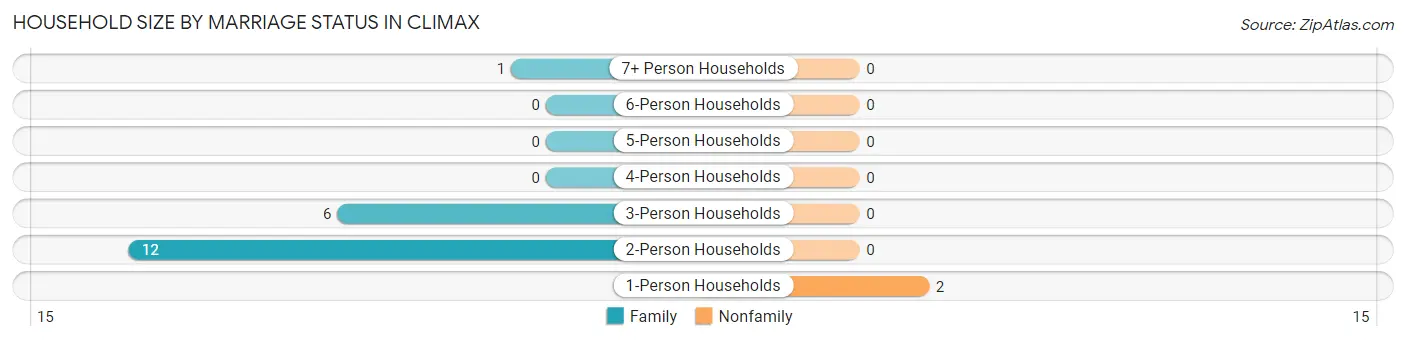
Household Size by Marriage Status in Climax
Out of a total of 21 households in Climax, 19 (90.5%) are family households, while 2 (9.5%) are nonfamily households. The most numerous type of family households are 2-person households, comprising 12, and the most common type of nonfamily households are 1-person households, comprising 2.
| Household Size | Family Households | Nonfamily Households |
| 1-Person Households | - | 2 (9.5%) |
| 2-Person Households | 12 (57.1%) | 0 (0.0%) |
| 3-Person Households | 6 (28.6%) | 0 (0.0%) |
| 4-Person Households | 0 (0.0%) | 0 (0.0%) |
| 5-Person Households | 0 (0.0%) | 0 (0.0%) |
| 6-Person Households | 0 (0.0%) | 0 (0.0%) |
| 7+ Person Households | 1 (4.8%) | 0 (0.0%) |
| Total | 19 (90.5%) | 2 (9.5%) |
Female Fertility in Climax
Fertility by Age in Climax
| Age Bracket | Women with Births | Births / 1,000 Women |
| 15 to 19 years | 0 (0.0%) | 0.0 |
| 20 to 34 years | 0 (0.0%) | 0.0 |
| 35 to 50 years | 0 (0.0%) | 0.0 |
| Total | 0 (0.0%) | 0.0 |
Fertility by Age by Marriage Status in Climax
| Age Bracket | Married | Unmarried |
| 15 to 19 years | 0 (0.0%) | 0 (0.0%) |
| 20 to 34 years | 0 (0.0%) | 0 (0.0%) |
| 35 to 50 years | 0 (0.0%) | 0 (0.0%) |
| Total | 0 (0.0%) | 0 (0.0%) |
Fertility by Education in Climax
| Educational Attainment | Women with Births | Births / 1,000 Women |
| Less than High School | 0 (0.0%) | 0.0 |
| High School Diploma | 0 (0.0%) | 0.0 |
| College or Associate's Degree | 0 (0.0%) | 0.0 |
| Bachelor's Degree | 0 (0.0%) | 0.0 |
| Graduate Degree | 0 (0.0%) | 0.0 |
| Total | 0 (0.0%) | 0.0 |
Fertility by Education by Marriage Status in Climax
| Educational Attainment | Married | Unmarried |
| Less than High School | 0 (0.0%) | 0 (0.0%) |
| High School Diploma | 0 (0.0%) | 0 (0.0%) |
| College or Associate's Degree | 0 (0.0%) | 0 (0.0%) |
| Bachelor's Degree | 0 (0.0%) | 0 (0.0%) |
| Graduate Degree | 0 (0.0%) | 0 (0.0%) |
| Total | 0 (0.0%) | 0 (0.0%) |
Income in Climax
Income Overview in Climax
Per Capita Income in Climax is $36,760, while median incomes of families and households are $68,750 and $68,250 respectively.
| Characteristic | Number | Measure |
| Per Capita Income | 48 | $36,760 |
| Median Family Income | 19 | $68,750 |
| Mean Family Income | 19 | $89,816 |
| Median Household Income | 21 | $68,250 |
| Mean Household Income | 21 | $83,319 |
| Income Deficit | 19 | $0 |
| Wage / Income Gap (%) | 48 | 0.00% |
| Wage / Income Gap ($) | 48 | 100.00¢ per $1 |
| Gini / Inequality Index | 48 | 0.43 |
Earnings by Sex in Climax
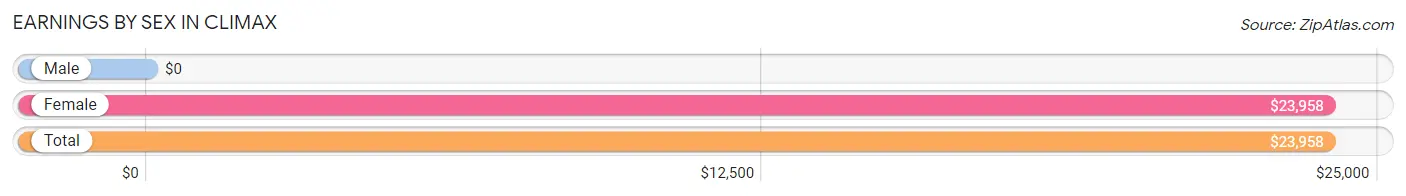
| Sex | Number | Average Earnings |
| Male | 8 (38.1%) | $0 |
| Female | 13 (61.9%) | $23,958 |
| Total | 21 (100.0%) | $23,958 |
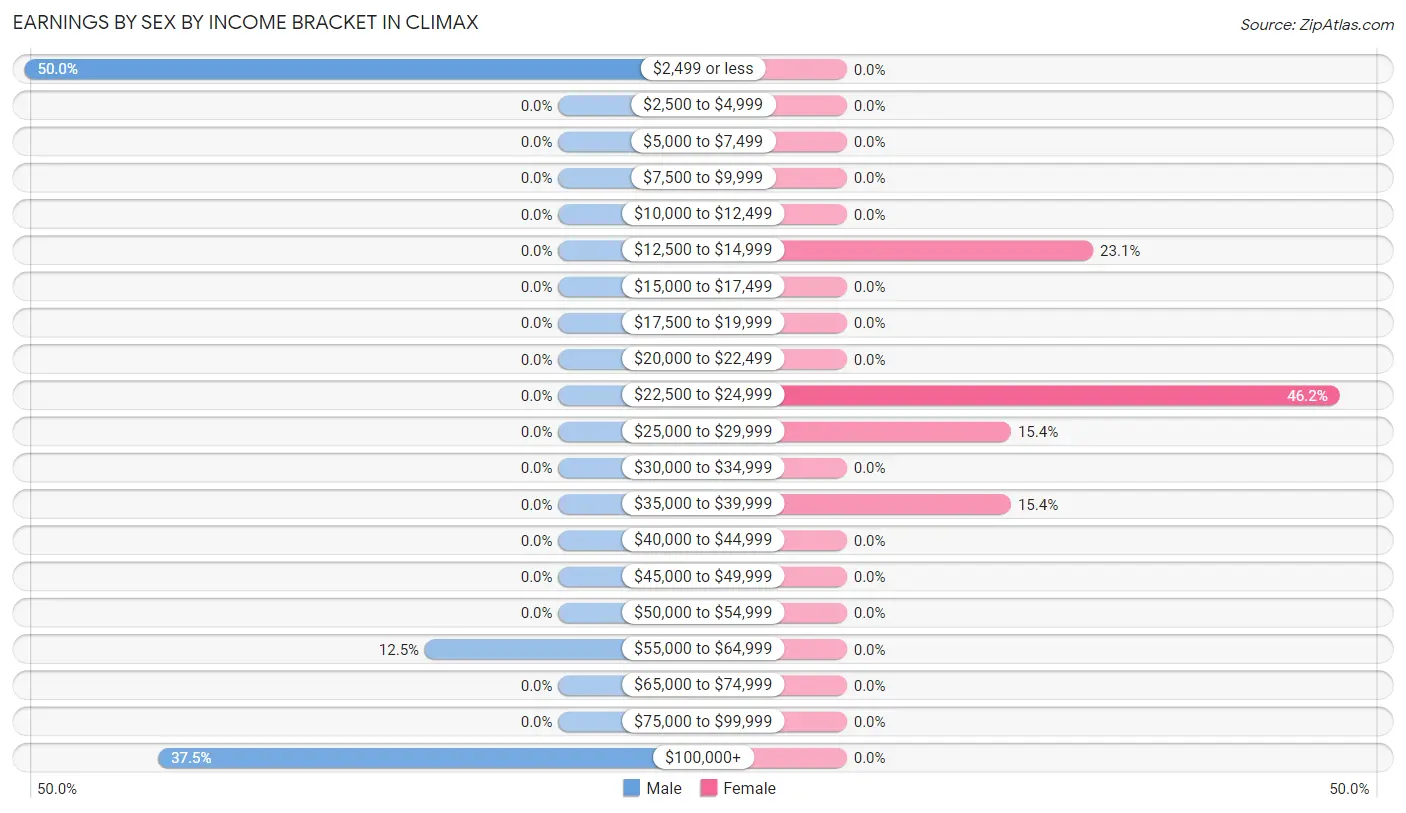
Earnings by Sex by Income Bracket in Climax
The most common earnings brackets in Climax are $2,499 or less for men (4 | 50.0%) and $22,500 to $24,999 for women (6 | 46.2%).
| Income | Male | Female |
| $2,499 or less | 4 (50.0%) | 0 (0.0%) |
| $2,500 to $4,999 | 0 (0.0%) | 0 (0.0%) |
| $5,000 to $7,499 | 0 (0.0%) | 0 (0.0%) |
| $7,500 to $9,999 | 0 (0.0%) | 0 (0.0%) |
| $10,000 to $12,499 | 0 (0.0%) | 0 (0.0%) |
| $12,500 to $14,999 | 0 (0.0%) | 3 (23.1%) |
| $15,000 to $17,499 | 0 (0.0%) | 0 (0.0%) |
| $17,500 to $19,999 | 0 (0.0%) | 0 (0.0%) |
| $20,000 to $22,499 | 0 (0.0%) | 0 (0.0%) |
| $22,500 to $24,999 | 0 (0.0%) | 6 (46.2%) |
| $25,000 to $29,999 | 0 (0.0%) | 2 (15.4%) |
| $30,000 to $34,999 | 0 (0.0%) | 0 (0.0%) |
| $35,000 to $39,999 | 0 (0.0%) | 2 (15.4%) |
| $40,000 to $44,999 | 0 (0.0%) | 0 (0.0%) |
| $45,000 to $49,999 | 0 (0.0%) | 0 (0.0%) |
| $50,000 to $54,999 | 0 (0.0%) | 0 (0.0%) |
| $55,000 to $64,999 | 1 (12.5%) | 0 (0.0%) |
| $65,000 to $74,999 | 0 (0.0%) | 0 (0.0%) |
| $75,000 to $99,999 | 0 (0.0%) | 0 (0.0%) |
| $100,000+ | 3 (37.5%) | 0 (0.0%) |
| Total | 8 (100.0%) | 13 (100.0%) |
Earnings by Sex by Educational Attainment in Climax
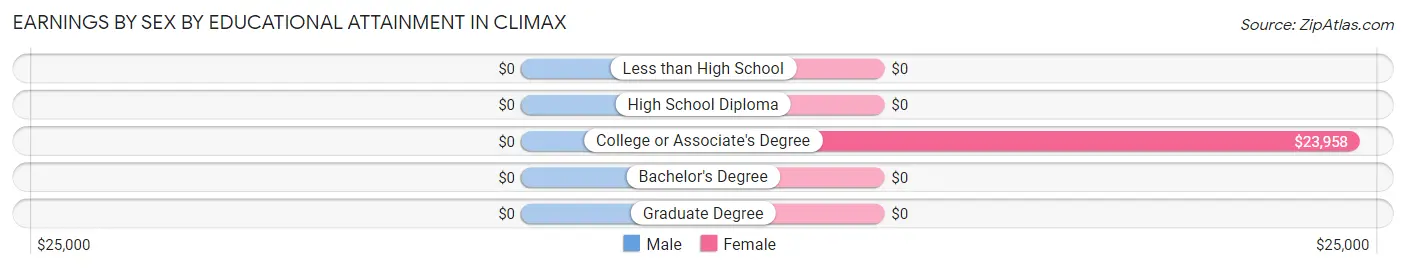
| Educational Attainment | Male Income | Female Income |
| Less than High School | - | - |
| High School Diploma | - | - |
| College or Associate's Degree | - | - |
| Bachelor's Degree | - | - |
| Graduate Degree | - | - |
| Total | - | - |
Family Income in Climax
Family Income Brackets in Climax
According to the Climax family income data, there are 6 families falling into the $25,000 to $34,999 income range, which is the most common income bracket and makes up 31.6% of all families.
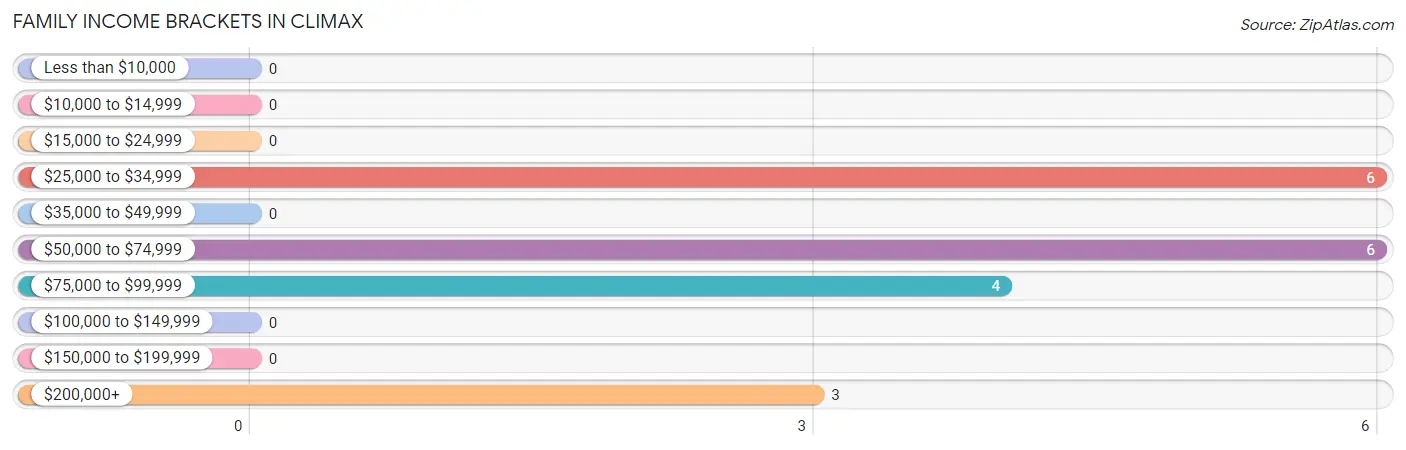
| Income Bracket | # Families | % Families |
| Less than $10,000 | 0 | 0.0% |
| $10,000 to $14,999 | 0 | 0.0% |
| $15,000 to $24,999 | 0 | 0.0% |
| $25,000 to $34,999 | 6 | 31.6% |
| $35,000 to $49,999 | 0 | 0.0% |
| $50,000 to $74,999 | 6 | 31.6% |
| $75,000 to $99,999 | 4 | 21.1% |
| $100,000 to $149,999 | 0 | 0.0% |
| $150,000 to $199,999 | 0 | 0.0% |
| $200,000+ | 3 | 15.8% |
Family Income by Famaliy Size in Climax
2-person families (12 | 63.2%) account for the highest median family income in Climax with $72,500 per family, while 2-person families (12 | 63.2%) have the highest median income of $36,250 per family member.
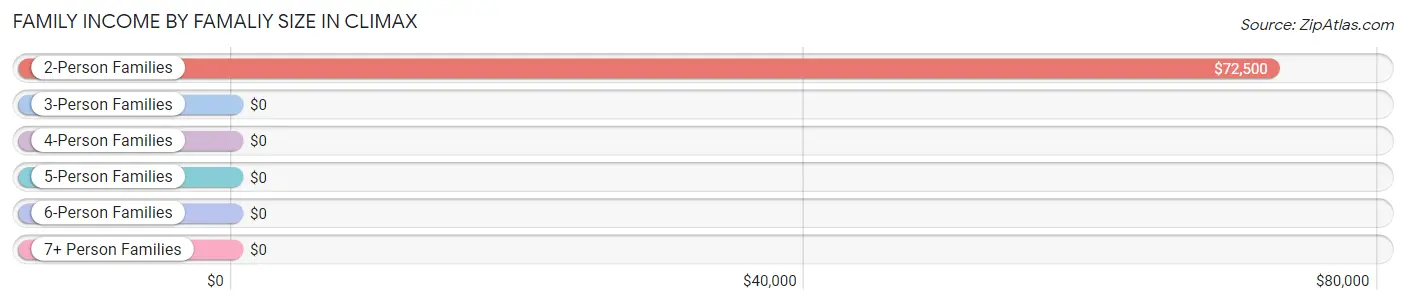
| Income Bracket | # Families | Median Income |
| 2-Person Families | 12 (63.2%) | $72,500 |
| 3-Person Families | 6 (31.6%) | $0 |
| 4-Person Families | 0 (0.0%) | $0 |
| 5-Person Families | 0 (0.0%) | $0 |
| 6-Person Families | 0 (0.0%) | $0 |
| 7+ Person Families | 1 (5.3%) | $0 |
| Total | 19 (100.0%) | $68,750 |
Family Income by Number of Earners in Climax
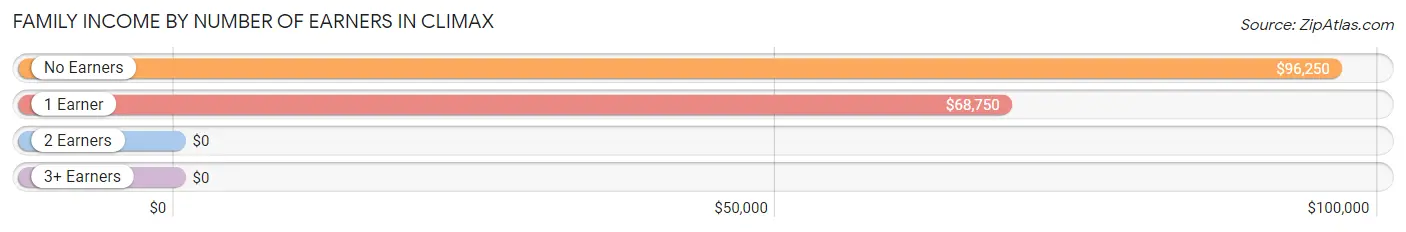
| Number of Earners | # Families | Median Income |
| No Earners | 3 (15.8%) | $96,250 |
| 1 Earner | 7 (36.8%) | $68,750 |
| 2 Earners | 9 (47.4%) | $0 |
| 3+ Earners | 0 (0.0%) | $0 |
| Total | 19 (100.0%) | $68,750 |
Household Income in Climax
Household Income Brackets in Climax
With 7 households falling in the category, the $25,000 to $34,999 income range is the most frequent in Climax, accounting for 33.3% of all households.
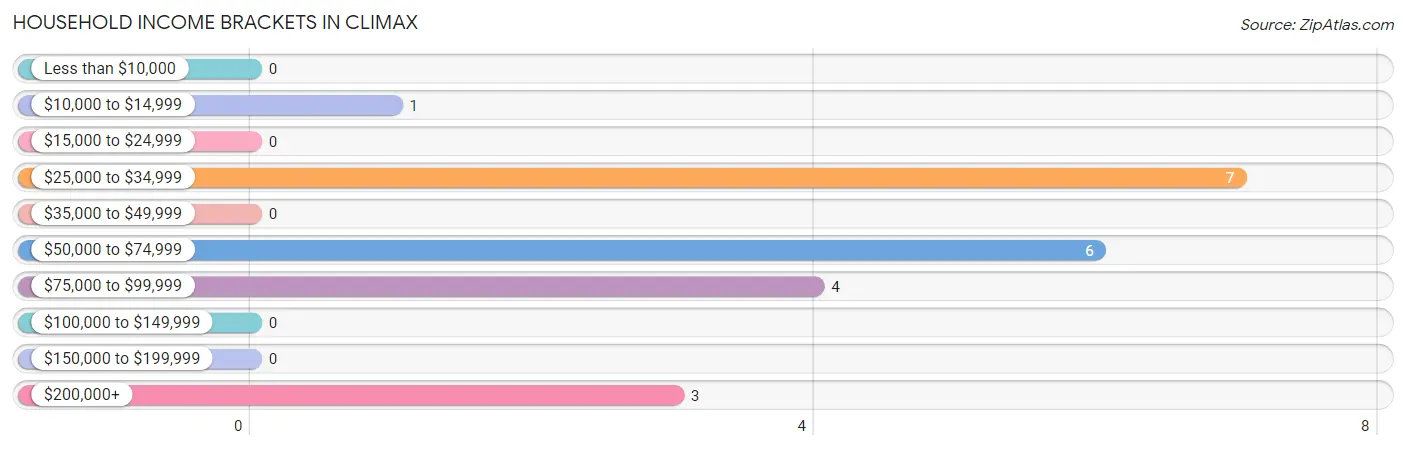
| Income Bracket | # Households | % Households |
| Less than $10,000 | 0 | 0.0% |
| $10,000 to $14,999 | 1 | 4.8% |
| $15,000 to $24,999 | 0 | 0.0% |
| $25,000 to $34,999 | 7 | 33.3% |
| $35,000 to $49,999 | 0 | 0.0% |
| $50,000 to $74,999 | 6 | 28.6% |
| $75,000 to $99,999 | 4 | 19.0% |
| $100,000 to $149,999 | 0 | 0.0% |
| $150,000 to $199,999 | 0 | 0.0% |
| $200,000+ | 3 | 14.3% |
Household Income by Householder Age in Climax
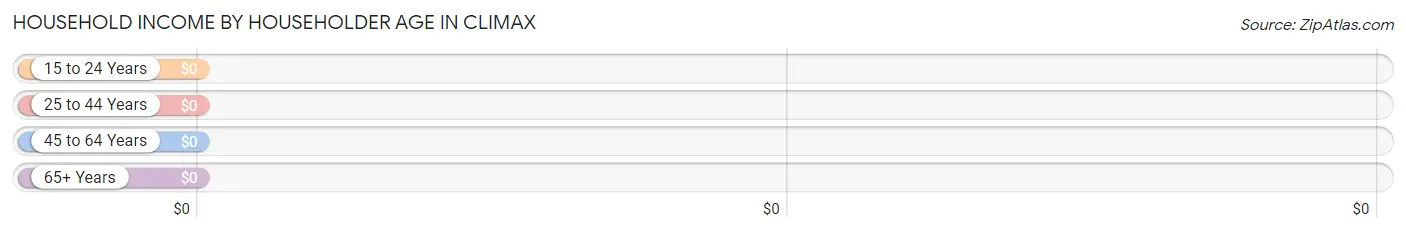
| Income Bracket | # Households | Median Income |
| 15 to 24 Years | 0 (0.0%) | $0 |
| 25 to 44 Years | 7 (33.3%) | $0 |
| 45 to 64 Years | 6 (28.6%) | $0 |
| 65+ Years | 8 (38.1%) | $0 |
| Total | 21 (100.0%) | $68,250 |
Poverty in Climax
Income Below Poverty by Sex and Age in Climax
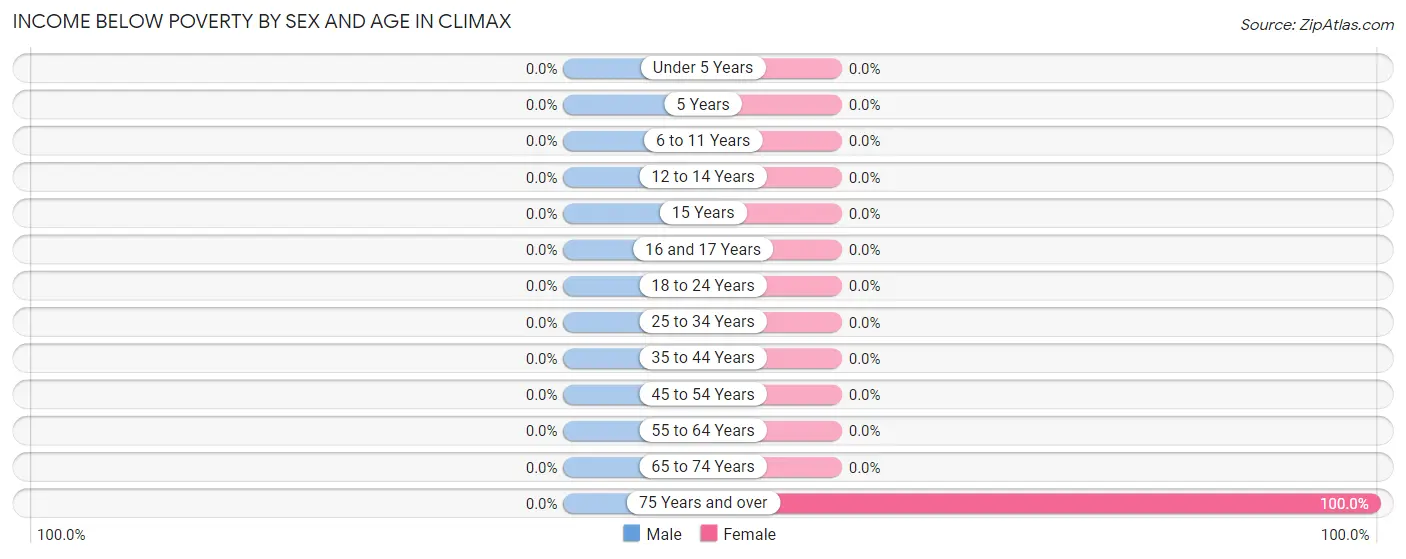
| Age Bracket | Male | Female |
| Under 5 Years | 0 (0.0%) | 0 (0.0%) |
| 5 Years | 0 (0.0%) | 0 (0.0%) |
| 6 to 11 Years | 0 (0.0%) | 0 (0.0%) |
| 12 to 14 Years | 0 (0.0%) | 0 (0.0%) |
| 15 Years | 0 (0.0%) | 0 (0.0%) |
| 16 and 17 Years | 0 (0.0%) | 0 (0.0%) |
| 18 to 24 Years | 0 (0.0%) | 0 (0.0%) |
| 25 to 34 Years | 0 (0.0%) | 0 (0.0%) |
| 35 to 44 Years | 0 (0.0%) | 0 (0.0%) |
| 45 to 54 Years | 0 (0.0%) | 0 (0.0%) |
| 55 to 64 Years | 0 (0.0%) | 0 (0.0%) |
| 65 to 74 Years | 0 (0.0%) | 0 (0.0%) |
| 75 Years and over | 0 (0.0%) | 1 (100.0%) |
| Total | 0 (0.0%) | 1 (4.0%) |
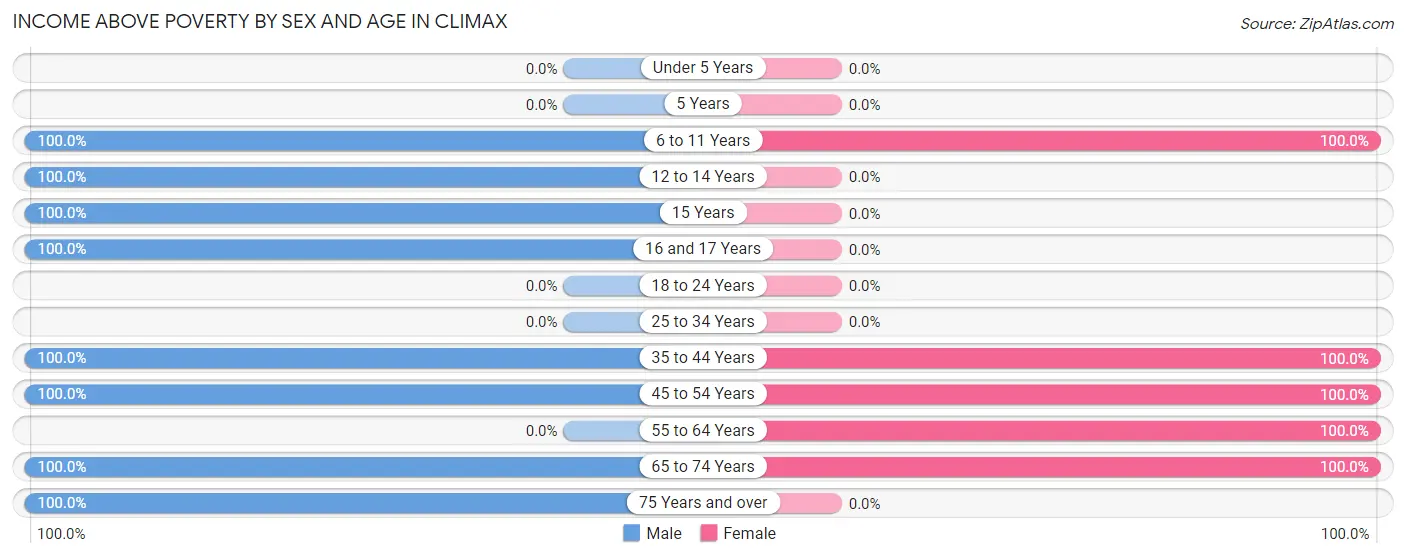
Income Above Poverty by Sex and Age in Climax
According to the poverty statistics in Climax, males aged 6 to 11 years and females aged 6 to 11 years are the age groups that are most secure financially, with 100.0% of males and 100.0% of females in these age groups living above the poverty line.
| Age Bracket | Male | Female |
| Under 5 Years | 0 (0.0%) | 0 (0.0%) |
| 5 Years | 0 (0.0%) | 0 (0.0%) |
| 6 to 11 Years | 4 (100.0%) | 2 (100.0%) |
| 12 to 14 Years | 1 (100.0%) | 0 (0.0%) |
| 15 Years | 4 (100.0%) | 0 (0.0%) |
| 16 and 17 Years | 4 (100.0%) | 0 (0.0%) |
| 18 to 24 Years | 0 (0.0%) | 0 (0.0%) |
| 25 to 34 Years | 0 (0.0%) | 0 (0.0%) |
| 35 to 44 Years | 1 (100.0%) | 7 (100.0%) |
| 45 to 54 Years | 3 (100.0%) | 1 (100.0%) |
| 55 to 64 Years | 0 (0.0%) | 5 (100.0%) |
| 65 to 74 Years | 5 (100.0%) | 9 (100.0%) |
| 75 Years and over | 1 (100.0%) | 0 (0.0%) |
| Total | 23 (100.0%) | 24 (96.0%) |
Income Below Poverty Among Married-Couple Families in Climax
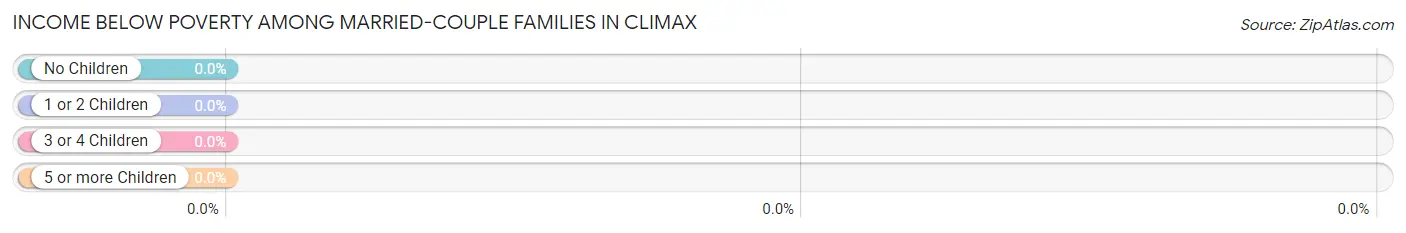
| Children | Above Poverty | Below Poverty |
| No Children | 11 (100.0%) | 0 (0.0%) |
| 1 or 2 Children | 0 (0.0%) | 0 (0.0%) |
| 3 or 4 Children | 0 (0.0%) | 0 (0.0%) |
| 5 or more Children | 1 (100.0%) | 0 (0.0%) |
| Total | 12 (100.0%) | 0 (0.0%) |
Income Below Poverty Among Single-Parent Households in Climax
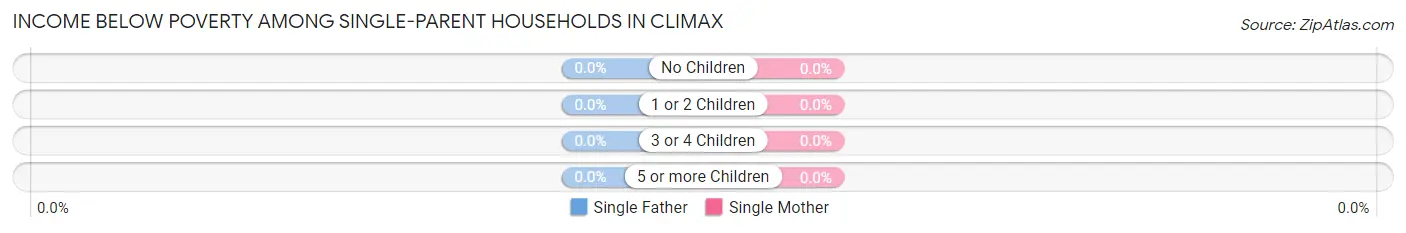
| Children | Single Father | Single Mother |
| No Children | 0 (0.0%) | 0 (0.0%) |
| 1 or 2 Children | 0 (0.0%) | 0 (0.0%) |
| 3 or 4 Children | 0 (0.0%) | 0 (0.0%) |
| 5 or more Children | 0 (0.0%) | 0 (0.0%) |
| Total | 0 (0.0%) | 0 (0.0%) |
Income Below Poverty Among Married-Couple vs Single-Parent Households in Climax
| Children | Married-Couple Families | Single-Parent Households |
| No Children | 0 (0.0%) | 0 (0.0%) |
| 1 or 2 Children | 0 (0.0%) | 0 (0.0%) |
| 3 or 4 Children | 0 (0.0%) | 0 (0.0%) |
| 5 or more Children | 0 (0.0%) | 0 (0.0%) |
| Total | 0 (0.0%) | 0 (0.0%) |
Employment Characteristics in Climax
Employment by Class of Employer in Climax
Among the 18 employed individuals in Climax, private company employees (8 | 44.4%), self-employed (incorporated) (7 | 38.9%), and self-employed (not incorporated) (3 | 16.7%) make up the most common classes of employment.
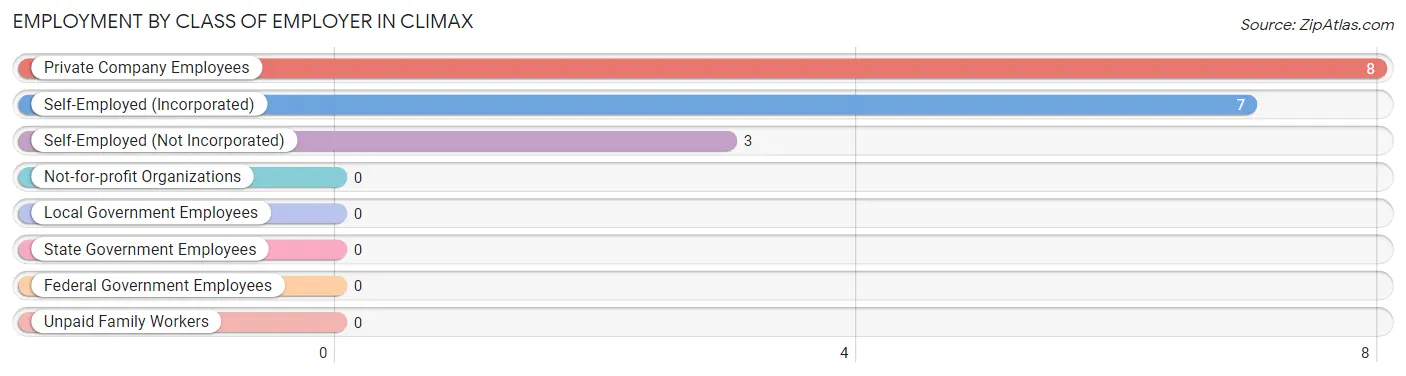
| Employer Class | # Employees | % Employees |
| Private Company Employees | 8 | 44.4% |
| Self-Employed (Incorporated) | 7 | 38.9% |
| Self-Employed (Not Incorporated) | 3 | 16.7% |
| Not-for-profit Organizations | 0 | 0.0% |
| Local Government Employees | 0 | 0.0% |
| State Government Employees | 0 | 0.0% |
| Federal Government Employees | 0 | 0.0% |
| Unpaid Family Workers | 0 | 0.0% |
| Total | 18 | 100.0% |
Employment Status by Age in Climax
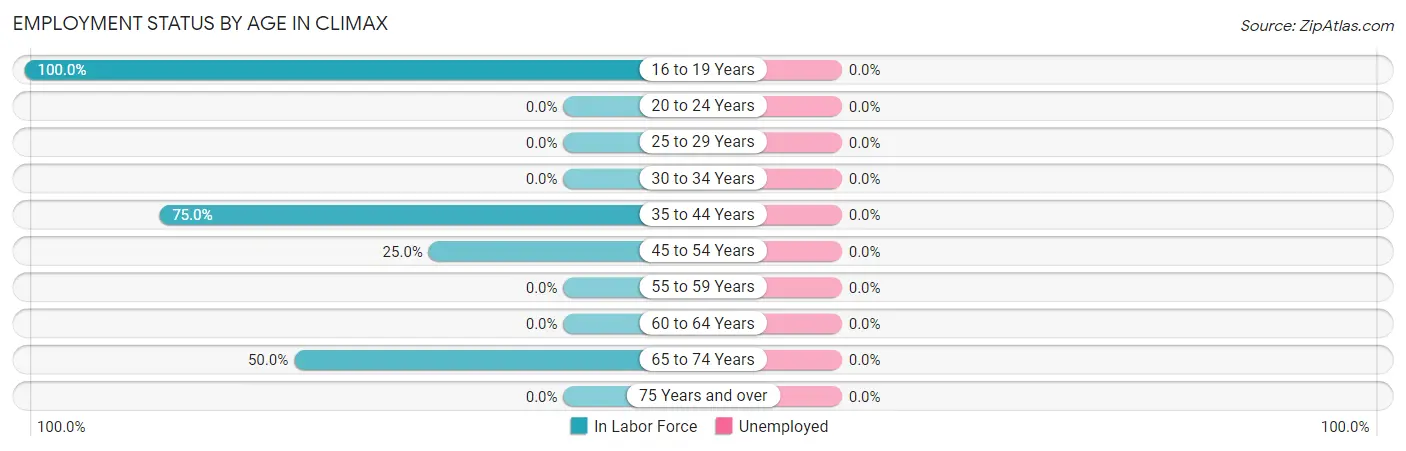
| Age Bracket | In Labor Force | Unemployed |
| 16 to 19 Years | 4 (100.0%) | 0 (0.0%) |
| 20 to 24 Years | 0 (0.0%) | 0 (0.0%) |
| 25 to 29 Years | 0 (0.0%) | 0 (0.0%) |
| 30 to 34 Years | 0 (0.0%) | 0 (0.0%) |
| 35 to 44 Years | 6 (75.0%) | 0 (0.0%) |
| 45 to 54 Years | 1 (25.0%) | 0 (0.0%) |
| 55 to 59 Years | 0 (0.0%) | 0 (0.0%) |
| 60 to 64 Years | 0 (0.0%) | 0 (0.0%) |
| 65 to 74 Years | 7 (50.0%) | 0 (0.0%) |
| 75 Years and over | 0 (0.0%) | 0 (0.0%) |
| Total | 18 (48.6%) | 0 (0.0%) |
Employment Status by Educational Attainment in Climax
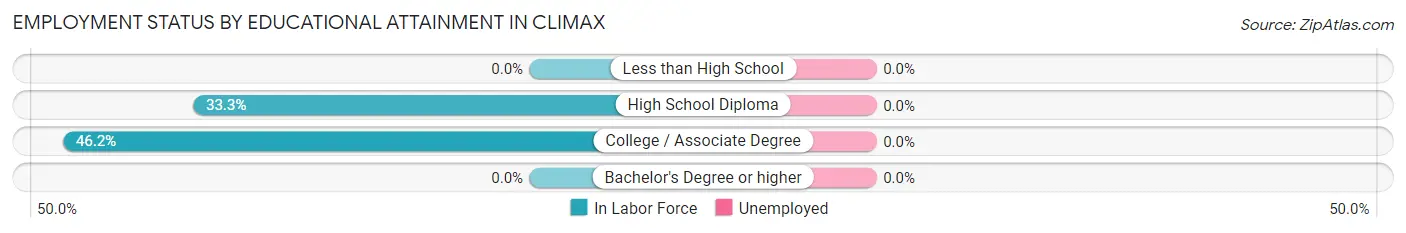
| Educational Attainment | In Labor Force | Unemployed |
| Less than High School | 0 (0.0%) | 0 (0.0%) |
| High School Diploma | 1 (33.3%) | 0 (0.0%) |
| College / Associate Degree | 6 (46.2%) | 0 (0.0%) |
| Bachelor's Degree or higher | 0 (0.0%) | 0 (0.0%) |
| Total | 7 (41.2%) | 0 (0.0%) |
Employment Occupations by Sex in Climax
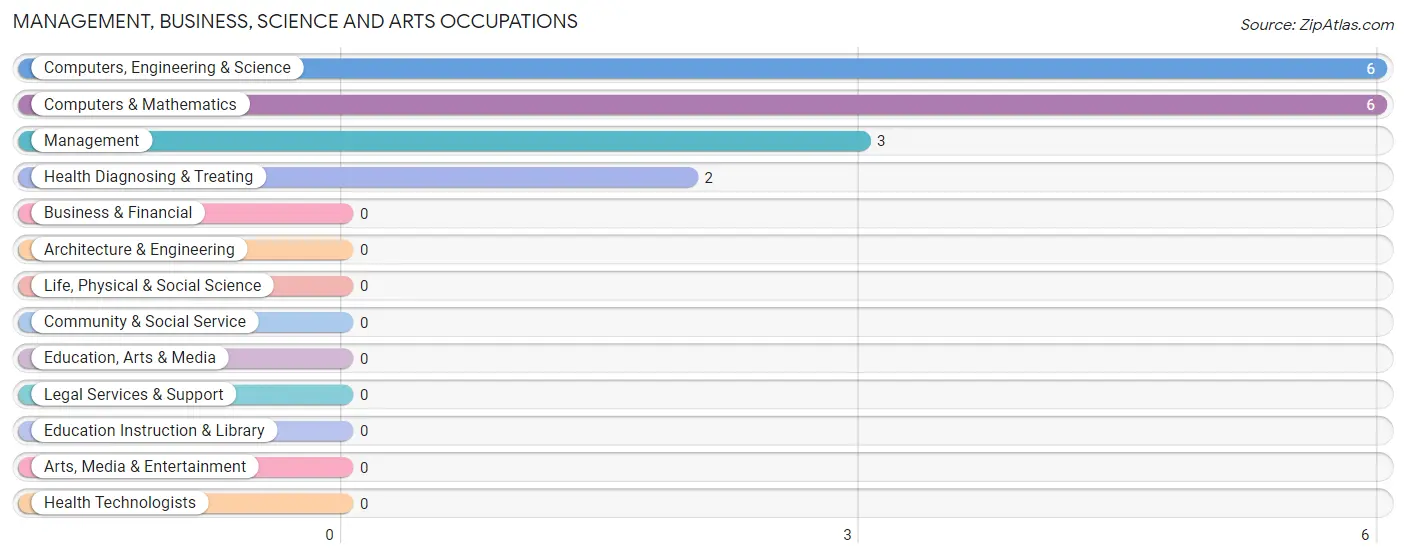
Management, Business, Science and Arts Occupations
The most common Management, Business, Science and Arts occupations in Climax are Computers, Engineering & Science (6 | 33.3%), Computers & Mathematics (6 | 33.3%), Management (3 | 16.7%), and Health Diagnosing & Treating (2 | 11.1%).
Management, Business, Science and Arts Occupations by Sex
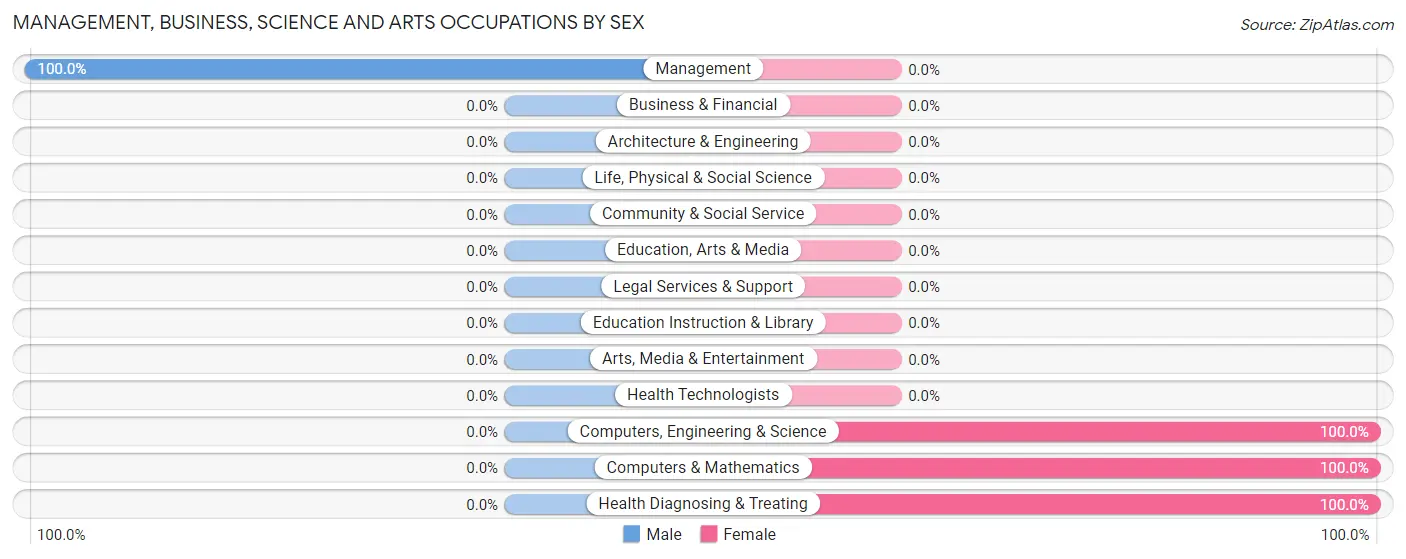
| Occupation | Male | Female |
| Management | 3 (100.0%) | 0 (0.0%) |
| Business & Financial | 0 (0.0%) | 0 (0.0%) |
| Computers, Engineering & Science | 0 (0.0%) | 6 (100.0%) |
| Computers & Mathematics | 0 (0.0%) | 6 (100.0%) |
| Architecture & Engineering | 0 (0.0%) | 0 (0.0%) |
| Life, Physical & Social Science | 0 (0.0%) | 0 (0.0%) |
| Community & Social Service | 0 (0.0%) | 0 (0.0%) |
| Education, Arts & Media | 0 (0.0%) | 0 (0.0%) |
| Legal Services & Support | 0 (0.0%) | 0 (0.0%) |
| Education Instruction & Library | 0 (0.0%) | 0 (0.0%) |
| Arts, Media & Entertainment | 0 (0.0%) | 0 (0.0%) |
| Health Diagnosing & Treating | 0 (0.0%) | 2 (100.0%) |
| Health Technologists | 0 (0.0%) | 0 (0.0%) |
| Total (Category) | 3 (27.3%) | 8 (72.7%) |
| Total (Overall) | 8 (44.4%) | 10 (55.6%) |
Services Occupations
Services Occupations by Sex
| Occupation | Male | Female |
| Healthcare Support | 0 (0.0%) | 0 (0.0%) |
| Security & Protection | 0 (0.0%) | 0 (0.0%) |
| Firefighting & Prevention | 0 (0.0%) | 0 (0.0%) |
| Law Enforcement | 0 (0.0%) | 0 (0.0%) |
| Food Preparation & Serving | 0 (0.0%) | 0 (0.0%) |
| Cleaning & Maintenance | 0 (0.0%) | 0 (0.0%) |
| Personal Care & Service | 0 (0.0%) | 0 (0.0%) |
| Total (Category) | 0 (0.0%) | 0 (0.0%) |
| Total (Overall) | 8 (44.4%) | 10 (55.6%) |
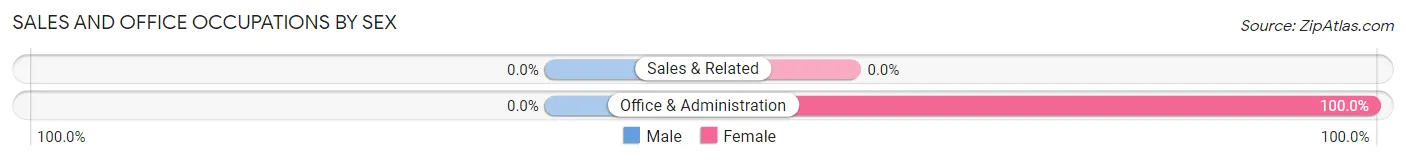
Sales and Office Occupations
The most common Sales and Office occupations in Climax are , and Office & Administration (2 | 11.1%).
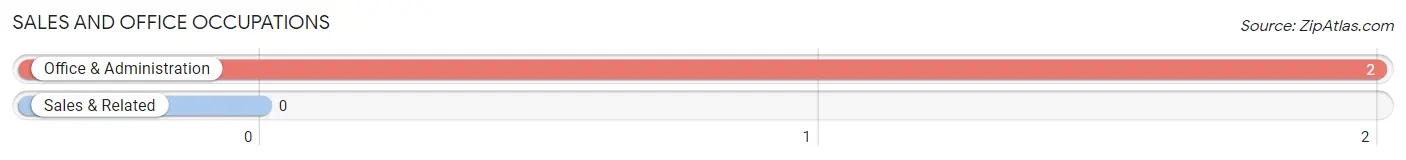
Sales and Office Occupations by Sex
| Occupation | Male | Female |
| Sales & Related | 0 (0.0%) | 0 (0.0%) |
| Office & Administration | 0 (0.0%) | 2 (100.0%) |
| Total (Category) | 0 (0.0%) | 2 (100.0%) |
| Total (Overall) | 8 (44.4%) | 10 (55.6%) |
Natural Resources, Construction and Maintenance Occupations
The most common Natural Resources, Construction and Maintenance occupations in Climax are Farming, Fishing & Forestry (4 | 22.2%), and Construction & Extraction (1 | 5.6%).
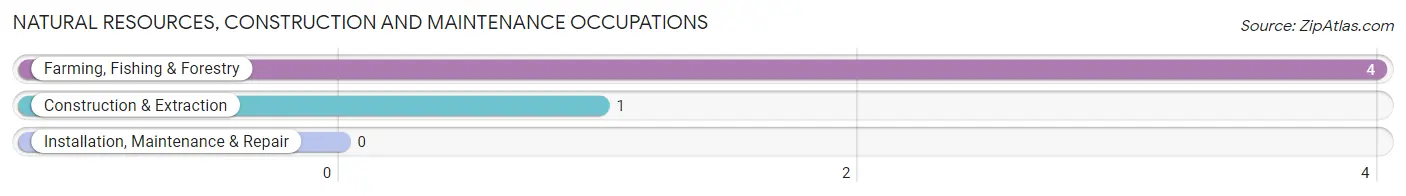
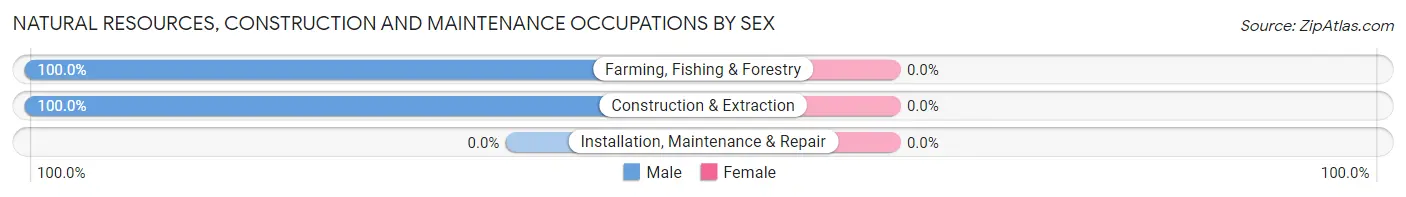
Natural Resources, Construction and Maintenance Occupations by Sex
| Occupation | Male | Female |
| Farming, Fishing & Forestry | 4 (100.0%) | 0 (0.0%) |
| Construction & Extraction | 1 (100.0%) | 0 (0.0%) |
| Installation, Maintenance & Repair | 0 (0.0%) | 0 (0.0%) |
| Total (Category) | 5 (100.0%) | 0 (0.0%) |
| Total (Overall) | 8 (44.4%) | 10 (55.6%) |
Production, Transportation and Moving Occupations
Production, Transportation and Moving Occupations by Sex
| Occupation | Male | Female |
| Production | 0 (0.0%) | 0 (0.0%) |
| Transportation | 0 (0.0%) | 0 (0.0%) |
| Material Moving | 0 (0.0%) | 0 (0.0%) |
| Total (Category) | 0 (0.0%) | 0 (0.0%) |
| Total (Overall) | 8 (44.4%) | 10 (55.6%) |
Employment Industries by Sex in Climax
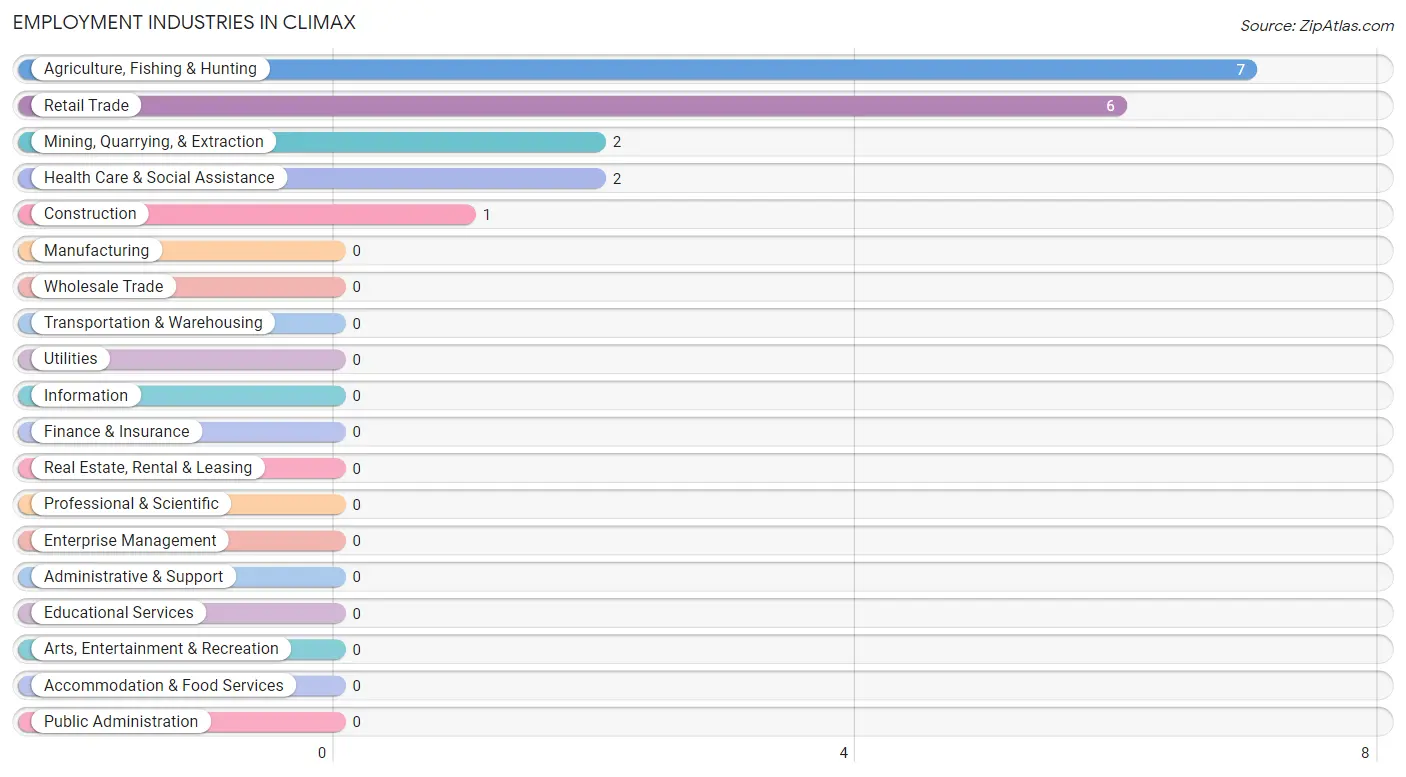
Employment Industries in Climax
The major employment industries in Climax include Agriculture, Fishing & Hunting (7 | 38.9%), Retail Trade (6 | 33.3%), Mining, Quarrying, & Extraction (2 | 11.1%), Health Care & Social Assistance (2 | 11.1%), and Construction (1 | 5.6%).
Employment Industries by Sex in Climax
The Climax industries that see more men than women are Agriculture, Fishing & Hunting (100.0%), and Construction (100.0%), whereas the industries that tend to have a higher number of women are Mining, Quarrying, & Extraction (100.0%), Retail Trade (100.0%), and Health Care & Social Assistance (100.0%).
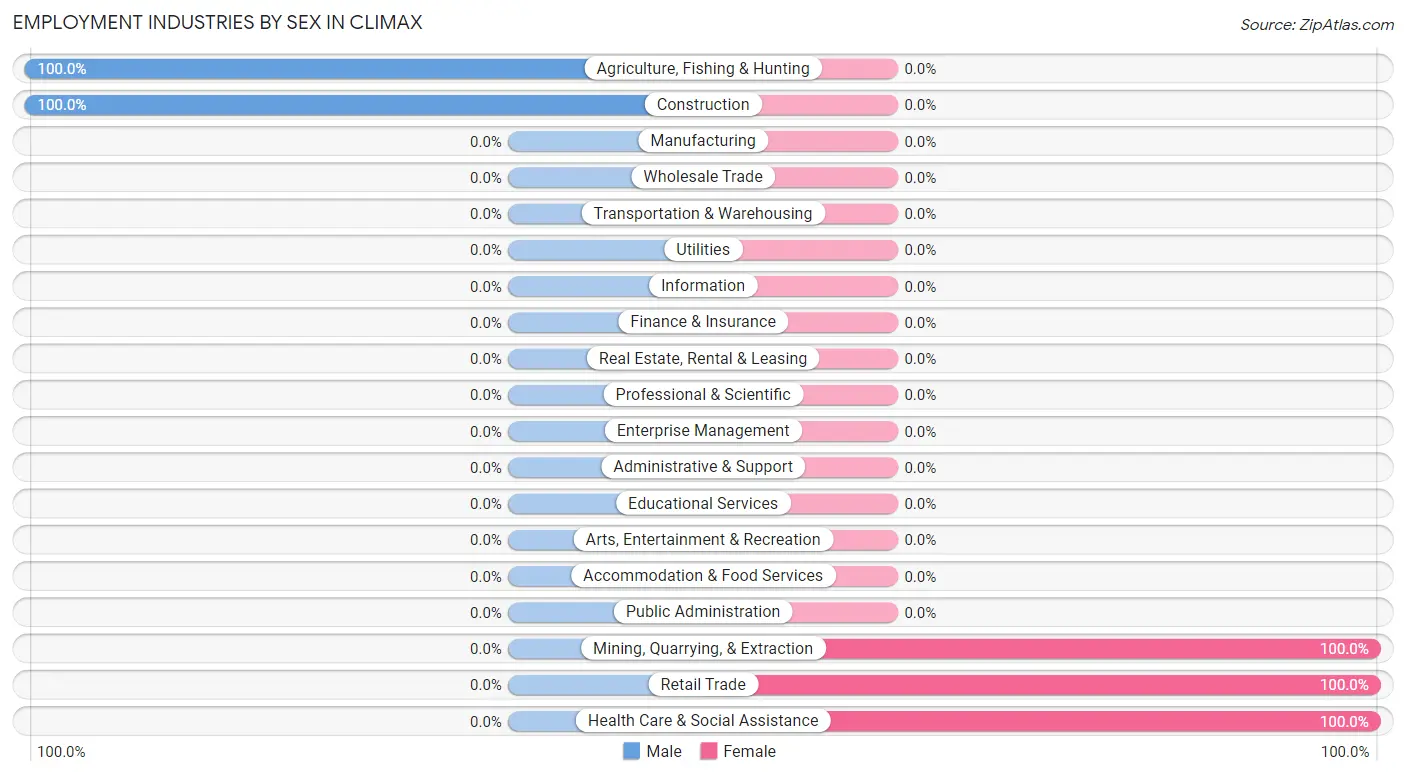
| Industry | Male | Female |
| Agriculture, Fishing & Hunting | 7 (100.0%) | 0 (0.0%) |
| Mining, Quarrying, & Extraction | 0 (0.0%) | 2 (100.0%) |
| Construction | 1 (100.0%) | 0 (0.0%) |
| Manufacturing | 0 (0.0%) | 0 (0.0%) |
| Wholesale Trade | 0 (0.0%) | 0 (0.0%) |
| Retail Trade | 0 (0.0%) | 6 (100.0%) |
| Transportation & Warehousing | 0 (0.0%) | 0 (0.0%) |
| Utilities | 0 (0.0%) | 0 (0.0%) |
| Information | 0 (0.0%) | 0 (0.0%) |
| Finance & Insurance | 0 (0.0%) | 0 (0.0%) |
| Real Estate, Rental & Leasing | 0 (0.0%) | 0 (0.0%) |
| Professional & Scientific | 0 (0.0%) | 0 (0.0%) |
| Enterprise Management | 0 (0.0%) | 0 (0.0%) |
| Administrative & Support | 0 (0.0%) | 0 (0.0%) |
| Educational Services | 0 (0.0%) | 0 (0.0%) |
| Health Care & Social Assistance | 0 (0.0%) | 2 (100.0%) |
| Arts, Entertainment & Recreation | 0 (0.0%) | 0 (0.0%) |
| Accommodation & Food Services | 0 (0.0%) | 0 (0.0%) |
| Public Administration | 0 (0.0%) | 0 (0.0%) |
| Total | 8 (44.4%) | 10 (55.6%) |
Education in Climax
School Enrollment in Climax
The most common levels of schooling among the 15 students in Climax are high school (8 | 53.3%), middle school (5 | 33.3%), and elementary school (2 | 13.3%).
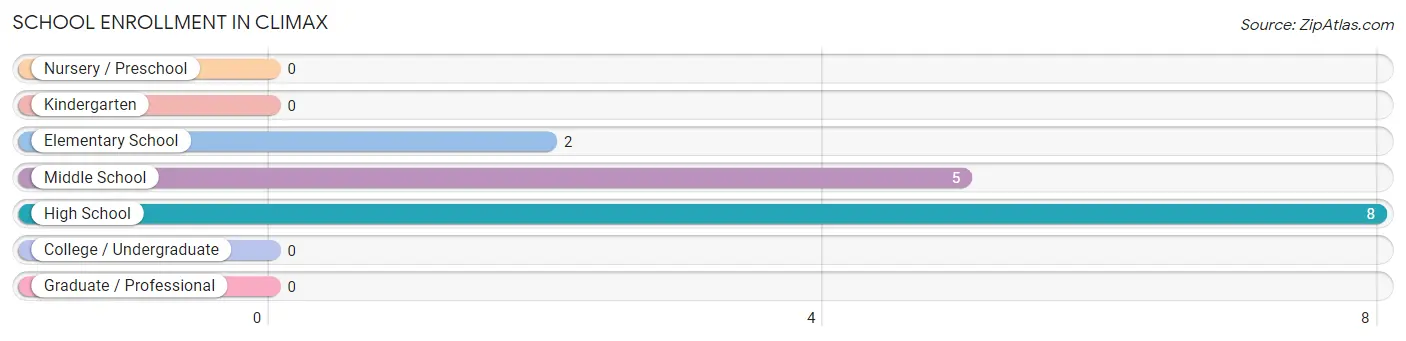
| School Level | # Students | % Students |
| Nursery / Preschool | 0 | 0.0% |
| Kindergarten | 0 | 0.0% |
| Elementary School | 2 | 13.3% |
| Middle School | 5 | 33.3% |
| High School | 8 | 53.3% |
| College / Undergraduate | 0 | 0.0% |
| Graduate / Professional | 0 | 0.0% |
| Total | 15 | 100.0% |
School Enrollment by Age by Funding Source in Climax
Out of a total of 15 students who are enrolled in schools in Climax, 5 (33.3%) attend a private institution, while the remaining 10 (66.7%) are enrolled in public schools. The age group of 10 to 14 year olds has the highest likelihood of being enrolled in private schools, with 5 (100.0% in the age bracket) enrolled. Conversely, the age group of 5 to 9 year old has the lowest likelihood of being enrolled in a private school, with 2 (100.0% in the age bracket) attending a public institution.
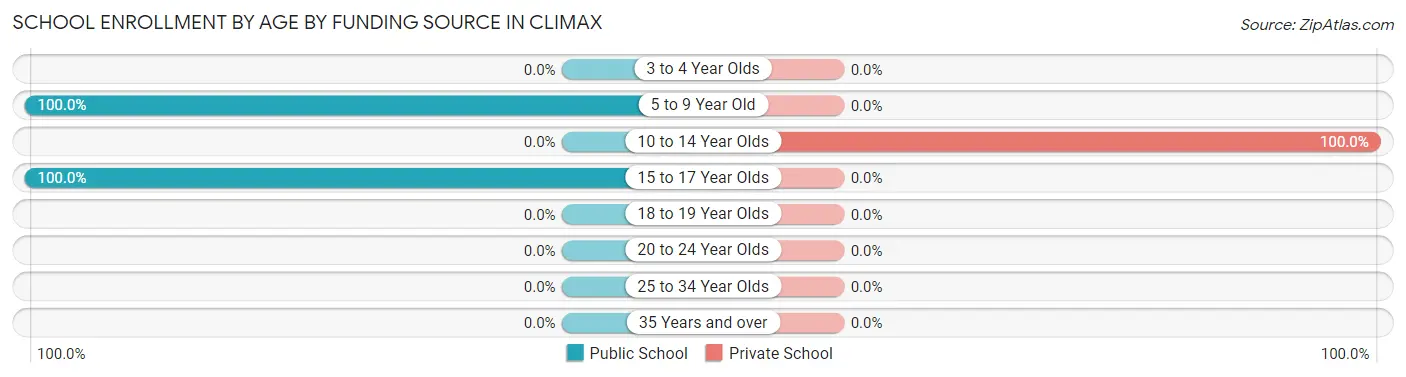
| Age Bracket | Public School | Private School |
| 3 to 4 Year Olds | 0 (0.0%) | 0 (0.0%) |
| 5 to 9 Year Old | 2 (100.0%) | 0 (0.0%) |
| 10 to 14 Year Olds | 0 (0.0%) | 5 (100.0%) |
| 15 to 17 Year Olds | 8 (100.0%) | 0 (0.0%) |
| 18 to 19 Year Olds | 0 (0.0%) | 0 (0.0%) |
| 20 to 24 Year Olds | 0 (0.0%) | 0 (0.0%) |
| 25 to 34 Year Olds | 0 (0.0%) | 0 (0.0%) |
| 35 Years and over | 0 (0.0%) | 0 (0.0%) |
| Total | 10 (66.7%) | 5 (33.3%) |
Educational Attainment by Field of Study in Climax
, and communications (1 | 100.0%) are the most common fields of study among 1 individuals in Climax who have obtained a bachelor's degree or higher.
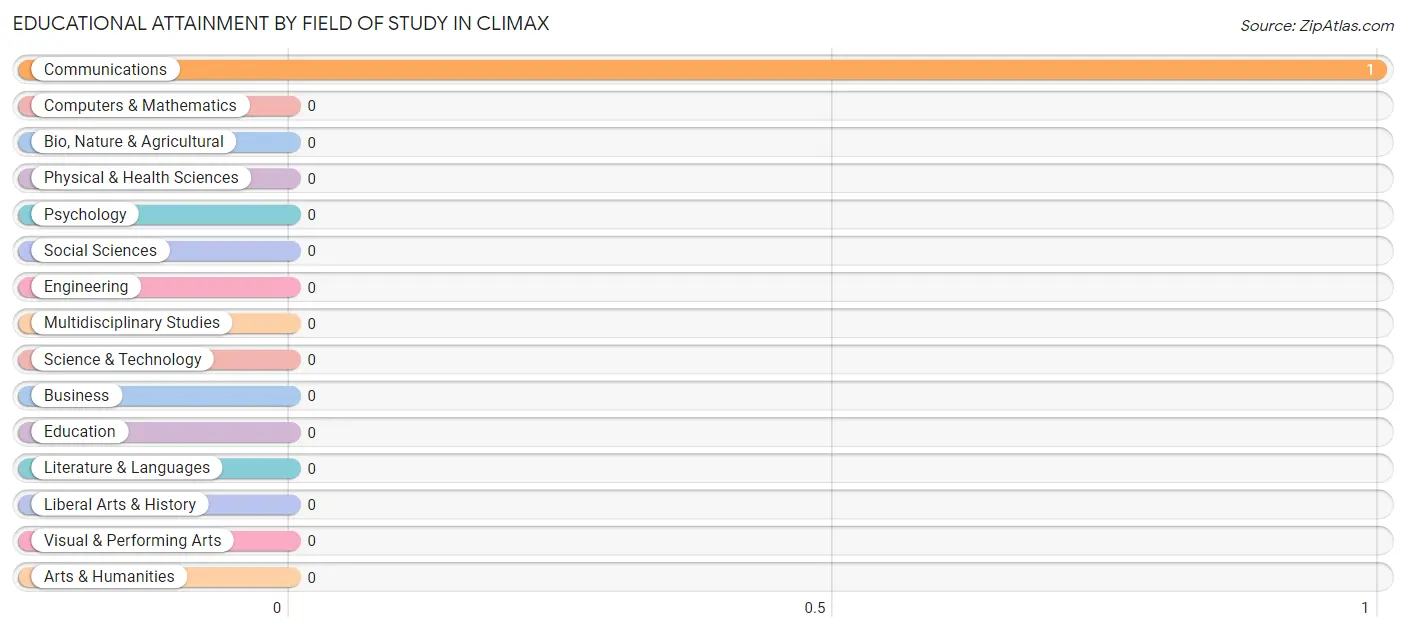
| Field of Study | # Graduates | % Graduates |
| Computers & Mathematics | 0 | 0.0% |
| Bio, Nature & Agricultural | 0 | 0.0% |
| Physical & Health Sciences | 0 | 0.0% |
| Psychology | 0 | 0.0% |
| Social Sciences | 0 | 0.0% |
| Engineering | 0 | 0.0% |
| Multidisciplinary Studies | 0 | 0.0% |
| Science & Technology | 0 | 0.0% |
| Business | 0 | 0.0% |
| Education | 0 | 0.0% |
| Literature & Languages | 0 | 0.0% |
| Liberal Arts & History | 0 | 0.0% |
| Visual & Performing Arts | 0 | 0.0% |
| Communications | 1 | 100.0% |
| Arts & Humanities | 0 | 0.0% |
| Total | 1 | 100.0% |
Transportation & Commute in Climax
Vehicle Availability by Sex in Climax
The most prevalent vehicle ownership categories in Climax are males with 2 vehicles (4, accounting for 50.0%) and females with 2 vehicles (6, making up 40.0%).
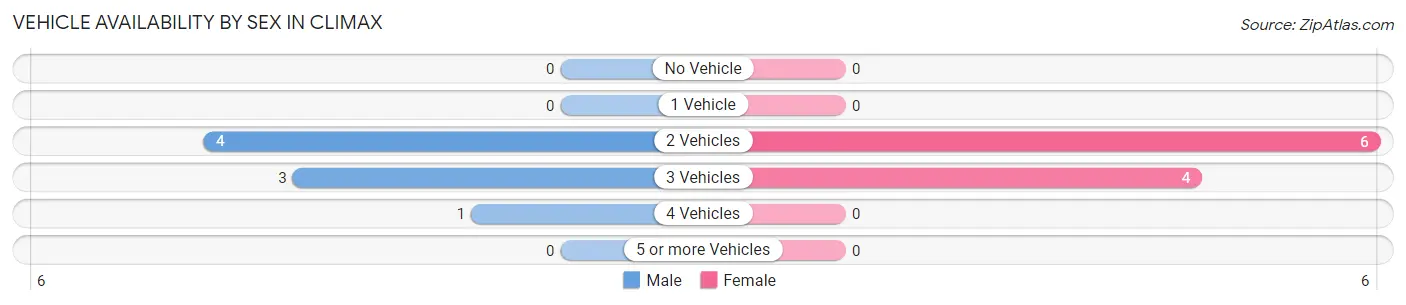
| Vehicles Available | Male | Female |
| No Vehicle | 0 (0.0%) | 0 (0.0%) |
| 1 Vehicle | 0 (0.0%) | 0 (0.0%) |
| 2 Vehicles | 4 (50.0%) | 6 (60.0%) |
| 3 Vehicles | 3 (37.5%) | 4 (40.0%) |
| 4 Vehicles | 1 (12.5%) | 0 (0.0%) |
| 5 or more Vehicles | 0 (0.0%) | 0 (0.0%) |
| Total | 8 (100.0%) | 10 (100.0%) |
Commute Time in Climax
The most frequently occuring commute durations in Climax are 10 to 14 minutes (6 commuters, 40.0%), 30 to 34 minutes (4 commuters, 26.7%), and 20 to 24 minutes (2 commuters, 13.3%).
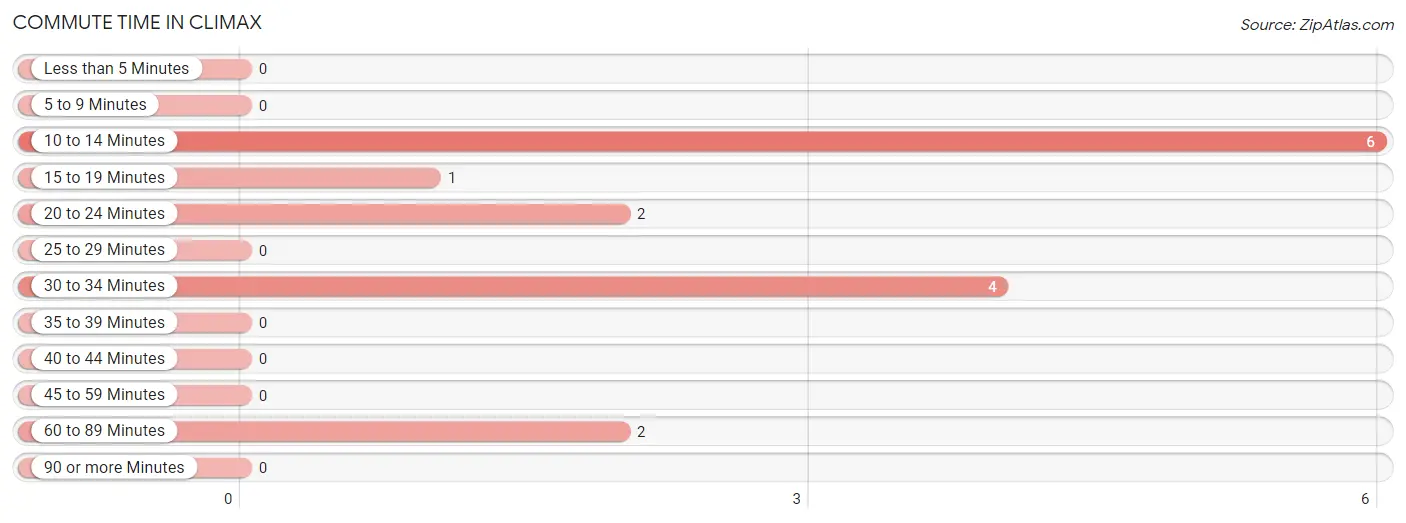
| Commute Time | # Commuters | % Commuters |
| Less than 5 Minutes | 0 | 0.0% |
| 5 to 9 Minutes | 0 | 0.0% |
| 10 to 14 Minutes | 6 | 40.0% |
| 15 to 19 Minutes | 1 | 6.7% |
| 20 to 24 Minutes | 2 | 13.3% |
| 25 to 29 Minutes | 0 | 0.0% |
| 30 to 34 Minutes | 4 | 26.7% |
| 35 to 39 Minutes | 0 | 0.0% |
| 40 to 44 Minutes | 0 | 0.0% |
| 45 to 59 Minutes | 0 | 0.0% |
| 60 to 89 Minutes | 2 | 13.3% |
| 90 or more Minutes | 0 | 0.0% |
Commute Time by Sex in Climax
The most common commute times in Climax are 30 to 34 minutes (4 commuters, 80.0%) for males and 10 to 14 minutes (6 commuters, 60.0%) for females.
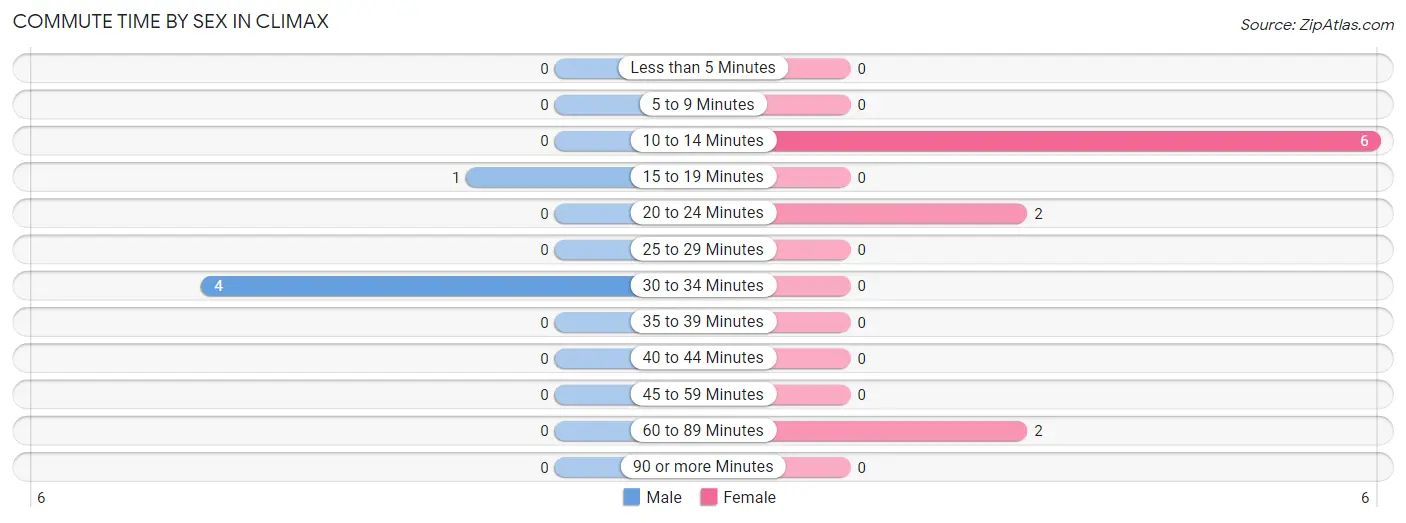
| Commute Time | Male | Female |
| Less than 5 Minutes | 0 (0.0%) | 0 (0.0%) |
| 5 to 9 Minutes | 0 (0.0%) | 0 (0.0%) |
| 10 to 14 Minutes | 0 (0.0%) | 6 (60.0%) |
| 15 to 19 Minutes | 1 (20.0%) | 0 (0.0%) |
| 20 to 24 Minutes | 0 (0.0%) | 2 (20.0%) |
| 25 to 29 Minutes | 0 (0.0%) | 0 (0.0%) |
| 30 to 34 Minutes | 4 (80.0%) | 0 (0.0%) |
| 35 to 39 Minutes | 0 (0.0%) | 0 (0.0%) |
| 40 to 44 Minutes | 0 (0.0%) | 0 (0.0%) |
| 45 to 59 Minutes | 0 (0.0%) | 0 (0.0%) |
| 60 to 89 Minutes | 0 (0.0%) | 2 (20.0%) |
| 90 or more Minutes | 0 (0.0%) | 0 (0.0%) |
Time of Departure to Work by Sex in Climax
The most frequent times of departure to work in Climax are 5:30 AM to 5:59 AM (4, 80.0%) for males and 6:00 AM to 6:29 AM (8, 80.0%) for females.
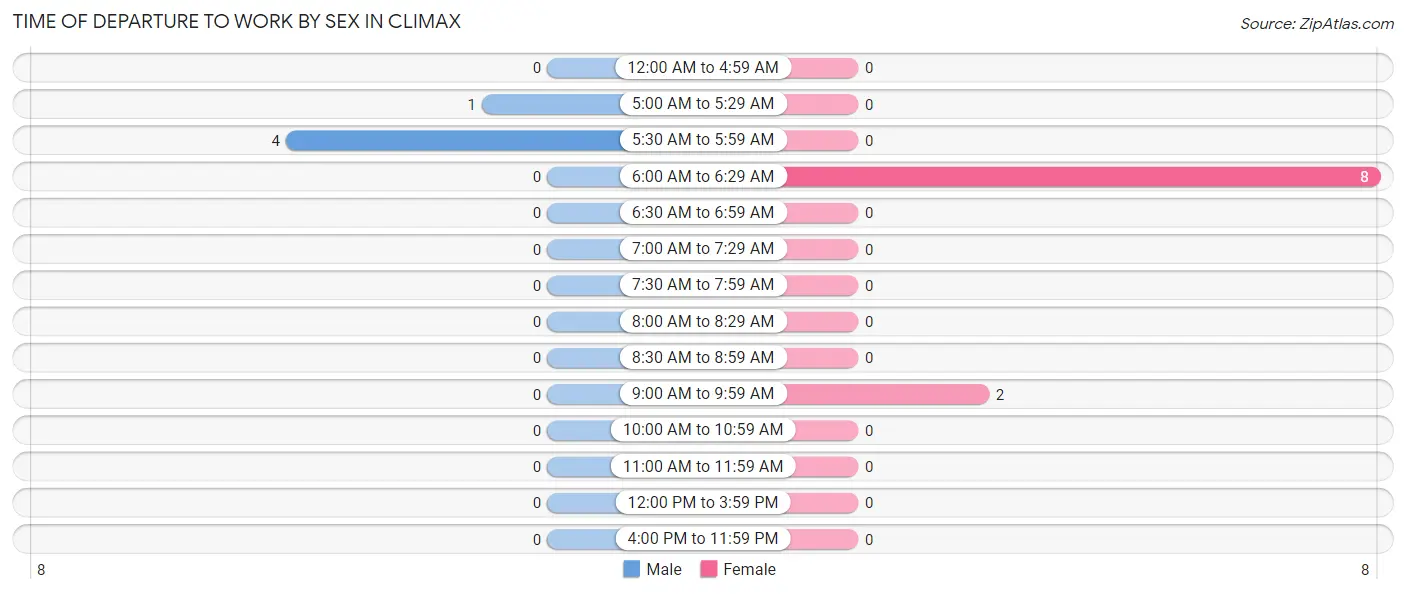
| Time of Departure | Male | Female |
| 12:00 AM to 4:59 AM | 0 (0.0%) | 0 (0.0%) |
| 5:00 AM to 5:29 AM | 1 (20.0%) | 0 (0.0%) |
| 5:30 AM to 5:59 AM | 4 (80.0%) | 0 (0.0%) |
| 6:00 AM to 6:29 AM | 0 (0.0%) | 8 (80.0%) |
| 6:30 AM to 6:59 AM | 0 (0.0%) | 0 (0.0%) |
| 7:00 AM to 7:29 AM | 0 (0.0%) | 0 (0.0%) |
| 7:30 AM to 7:59 AM | 0 (0.0%) | 0 (0.0%) |
| 8:00 AM to 8:29 AM | 0 (0.0%) | 0 (0.0%) |
| 8:30 AM to 8:59 AM | 0 (0.0%) | 0 (0.0%) |
| 9:00 AM to 9:59 AM | 0 (0.0%) | 2 (20.0%) |
| 10:00 AM to 10:59 AM | 0 (0.0%) | 0 (0.0%) |
| 11:00 AM to 11:59 AM | 0 (0.0%) | 0 (0.0%) |
| 12:00 PM to 3:59 PM | 0 (0.0%) | 0 (0.0%) |
| 4:00 PM to 11:59 PM | 0 (0.0%) | 0 (0.0%) |
| Total | 5 (100.0%) | 10 (100.0%) |
Housing Occupancy in Climax
Occupancy by Ownership in Climax
Of the total 21 dwellings in Climax, owner-occupied units account for 12 (57.1%), while renter-occupied units make up 9 (42.9%).
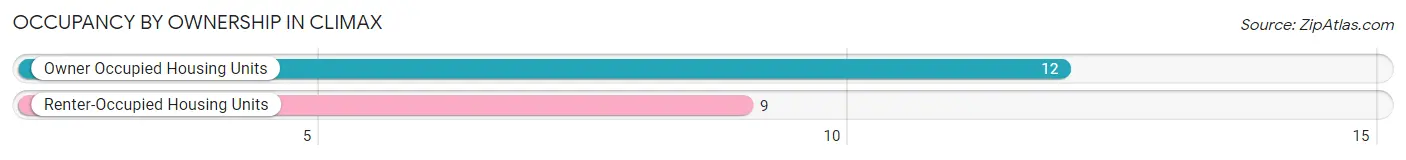
| Occupancy | # Housing Units | % Housing Units |
| Owner Occupied Housing Units | 12 | 57.1% |
| Renter-Occupied Housing Units | 9 | 42.9% |
| Total Occupied Housing Units | 21 | 100.0% |
Occupancy by Household Size in Climax
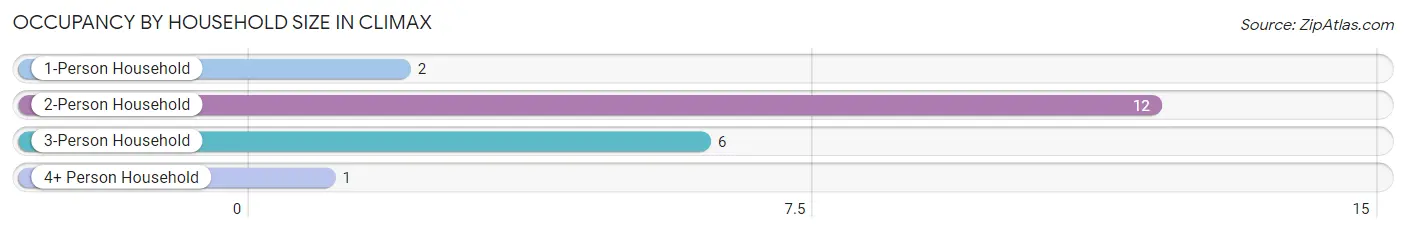
| Household Size | # Housing Units | % Housing Units |
| 1-Person Household | 2 | 9.5% |
| 2-Person Household | 12 | 57.1% |
| 3-Person Household | 6 | 28.6% |
| 4+ Person Household | 1 | 4.8% |
| Total Housing Units | 21 | 100.0% |
Occupancy by Ownership by Household Size in Climax
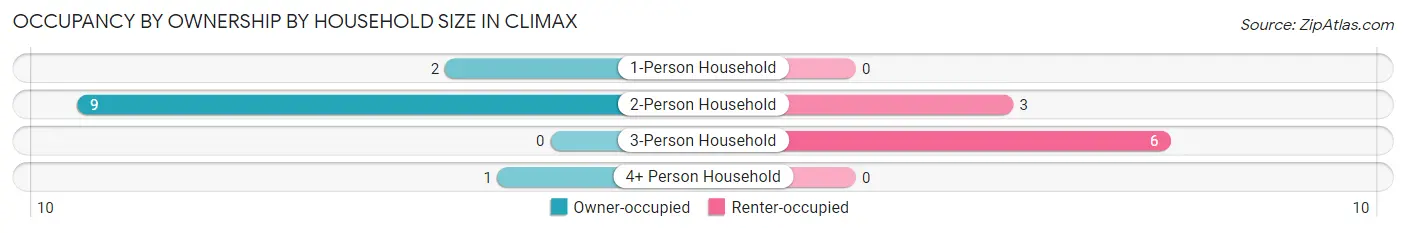
| Household Size | Owner-occupied | Renter-occupied |
| 1-Person Household | 2 (100.0%) | 0 (0.0%) |
| 2-Person Household | 9 (75.0%) | 3 (25.0%) |
| 3-Person Household | 0 (0.0%) | 6 (100.0%) |
| 4+ Person Household | 1 (100.0%) | 0 (0.0%) |
| Total Housing Units | 12 (57.1%) | 9 (42.9%) |
Occupancy by Educational Attainment in Climax
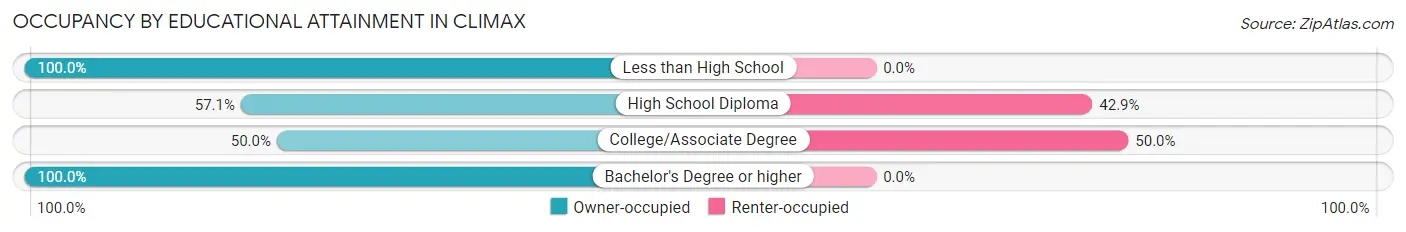
| Household Size | Owner-occupied | Renter-occupied |
| Less than High School | 1 (100.0%) | 0 (0.0%) |
| High School Diploma | 4 (57.1%) | 3 (42.9%) |
| College/Associate Degree | 6 (50.0%) | 6 (50.0%) |
| Bachelor's Degree or higher | 1 (100.0%) | 0 (0.0%) |
Occupancy by Age of Householder in Climax
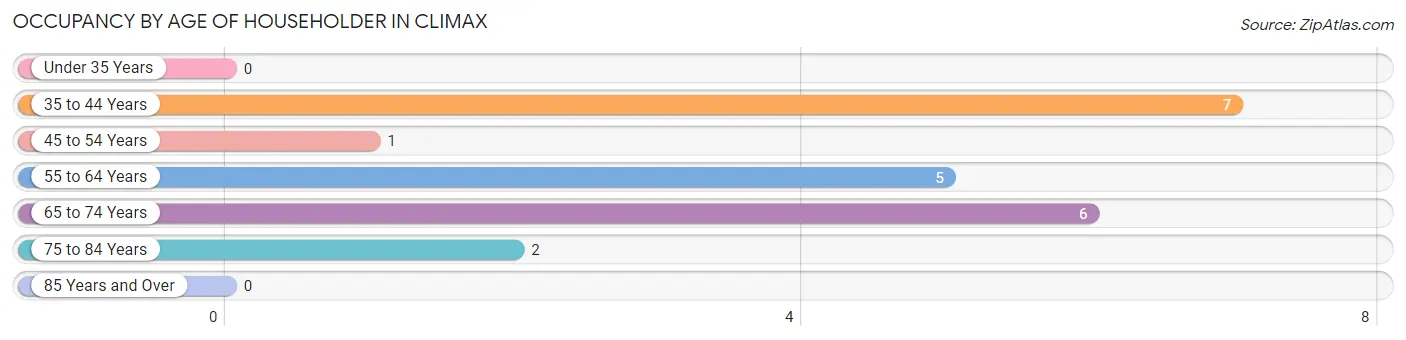
| Age Bracket | # Households | % Households |
| Under 35 Years | 0 | 0.0% |
| 35 to 44 Years | 7 | 33.3% |
| 45 to 54 Years | 1 | 4.8% |
| 55 to 64 Years | 5 | 23.8% |
| 65 to 74 Years | 6 | 28.6% |
| 75 to 84 Years | 2 | 9.5% |
| 85 Years and Over | 0 | 0.0% |
| Total | 21 | 100.0% |
Housing Finances in Climax
Median Income by Occupancy in Climax
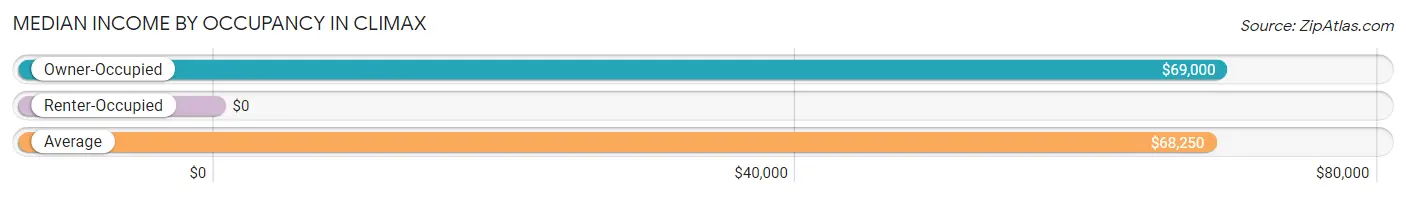
| Occupancy Type | # Households | Median Income |
| Owner-Occupied | 12 (57.1%) | $69,000 |
| Renter-Occupied | 9 (42.9%) | $0 |
| Average | 21 (100.0%) | $68,250 |
Occupancy by Householder Income Bracket in Climax
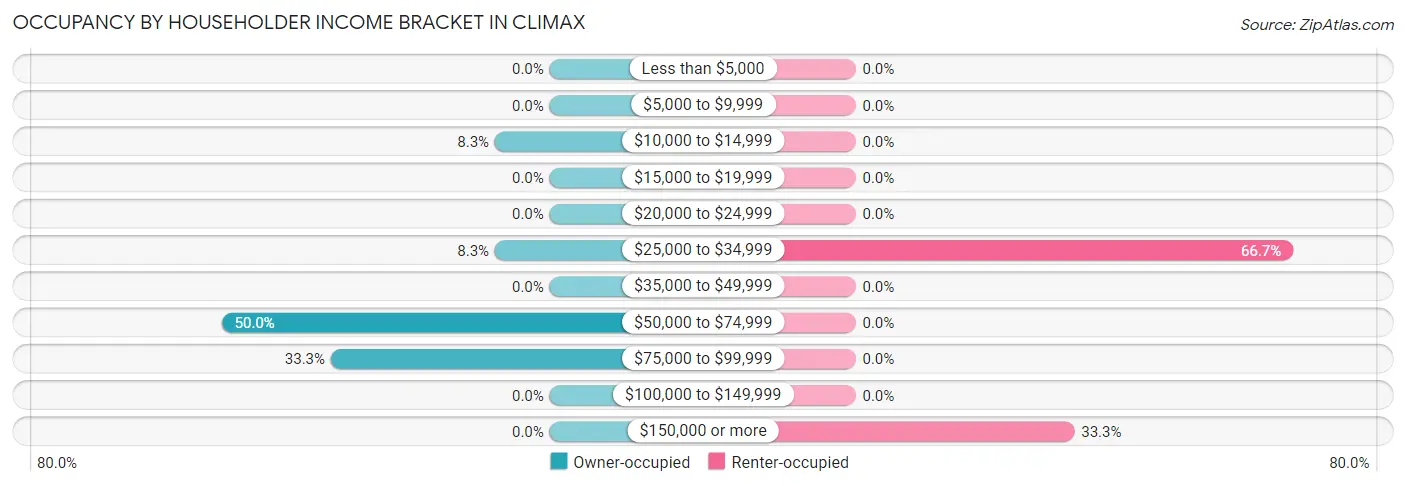
| Income Bracket | Owner-occupied | Renter-occupied |
| Less than $5,000 | 0 (0.0%) | 0 (0.0%) |
| $5,000 to $9,999 | 0 (0.0%) | 0 (0.0%) |
| $10,000 to $14,999 | 1 (8.3%) | 0 (0.0%) |
| $15,000 to $19,999 | 0 (0.0%) | 0 (0.0%) |
| $20,000 to $24,999 | 0 (0.0%) | 0 (0.0%) |
| $25,000 to $34,999 | 1 (8.3%) | 6 (66.7%) |
| $35,000 to $49,999 | 0 (0.0%) | 0 (0.0%) |
| $50,000 to $74,999 | 6 (50.0%) | 0 (0.0%) |
| $75,000 to $99,999 | 4 (33.3%) | 0 (0.0%) |
| $100,000 to $149,999 | 0 (0.0%) | 0 (0.0%) |
| $150,000 or more | 0 (0.0%) | 3 (33.3%) |
| Total | 12 (100.0%) | 9 (100.0%) |
Monthly Housing Cost Tiers in Climax
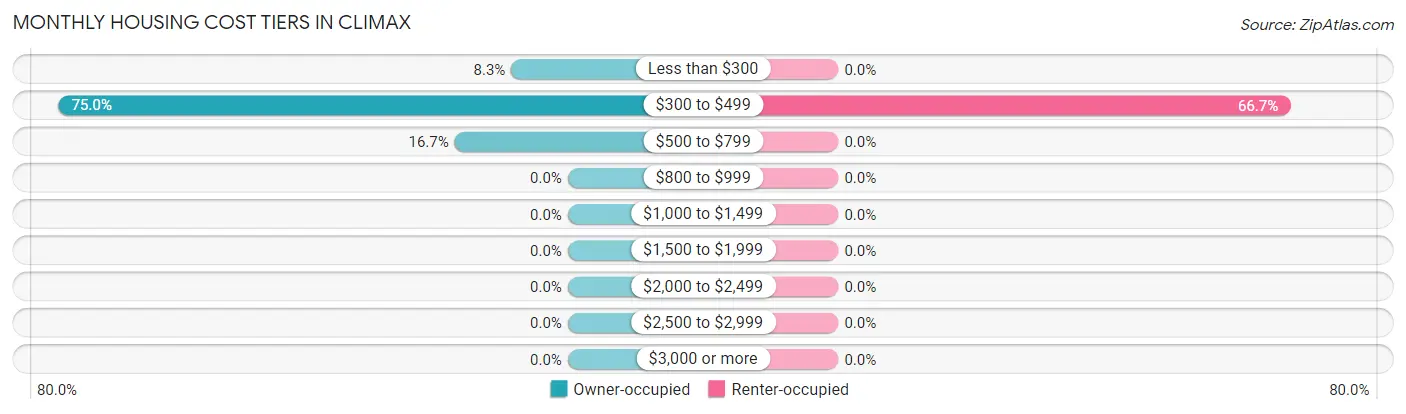
| Monthly Cost | Owner-occupied | Renter-occupied |
| Less than $300 | 1 (8.3%) | 0 (0.0%) |
| $300 to $499 | 9 (75.0%) | 6 (66.7%) |
| $500 to $799 | 2 (16.7%) | 0 (0.0%) |
| $800 to $999 | 0 (0.0%) | 0 (0.0%) |
| $1,000 to $1,499 | 0 (0.0%) | 0 (0.0%) |
| $1,500 to $1,999 | 0 (0.0%) | 0 (0.0%) |
| $2,000 to $2,499 | 0 (0.0%) | 0 (0.0%) |
| $2,500 to $2,999 | 0 (0.0%) | 0 (0.0%) |
| $3,000 or more | 0 (0.0%) | 0 (0.0%) |
| Total | 12 (100.0%) | 9 (100.0%) |
Physical Housing Characteristics in Climax
Housing Structures in Climax
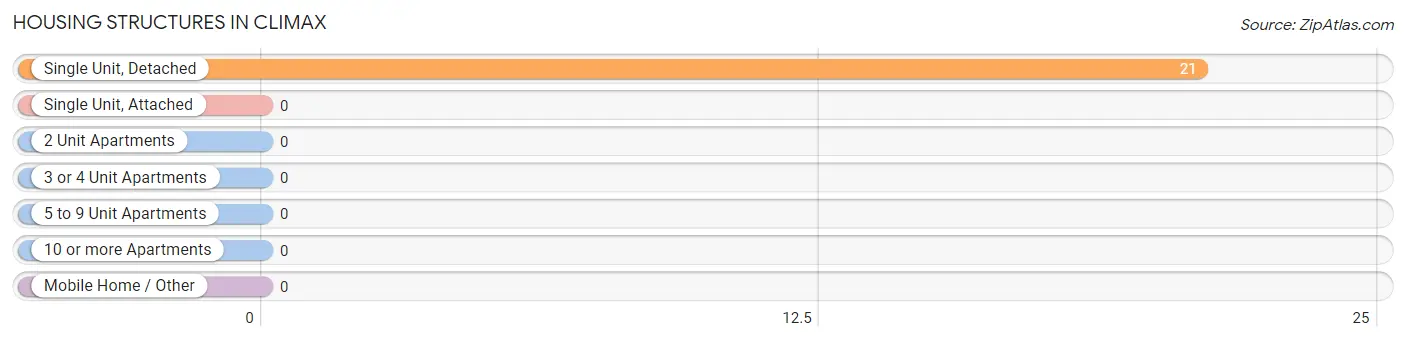
| Structure Type | # Housing Units | % Housing Units |
| Single Unit, Detached | 21 | 100.0% |
| Single Unit, Attached | 0 | 0.0% |
| 2 Unit Apartments | 0 | 0.0% |
| 3 or 4 Unit Apartments | 0 | 0.0% |
| 5 to 9 Unit Apartments | 0 | 0.0% |
| 10 or more Apartments | 0 | 0.0% |
| Mobile Home / Other | 0 | 0.0% |
| Total | 21 | 100.0% |
Housing Structures by Occupancy in Climax
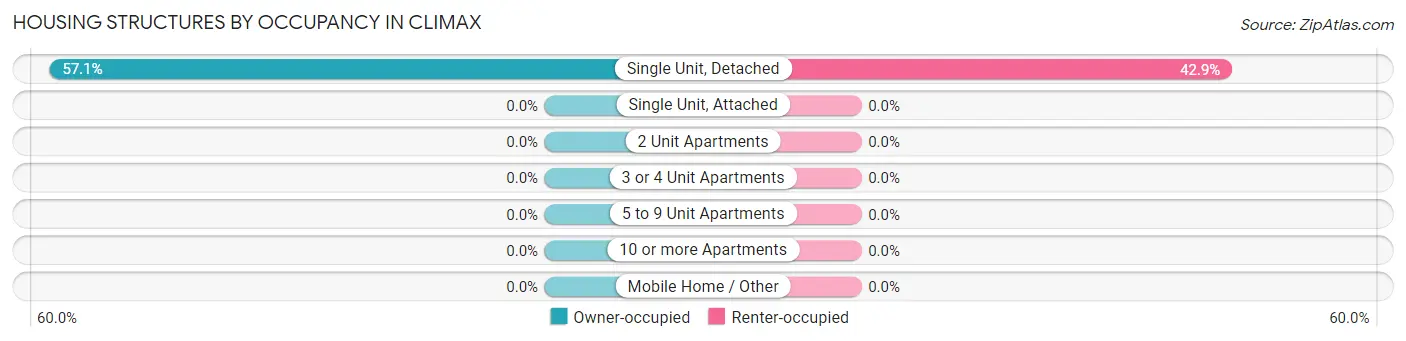
| Structure Type | Owner-occupied | Renter-occupied |
| Single Unit, Detached | 12 (57.1%) | 9 (42.9%) |
| Single Unit, Attached | 0 (0.0%) | 0 (0.0%) |
| 2 Unit Apartments | 0 (0.0%) | 0 (0.0%) |
| 3 or 4 Unit Apartments | 0 (0.0%) | 0 (0.0%) |
| 5 to 9 Unit Apartments | 0 (0.0%) | 0 (0.0%) |
| 10 or more Apartments | 0 (0.0%) | 0 (0.0%) |
| Mobile Home / Other | 0 (0.0%) | 0 (0.0%) |
| Total | 12 (57.1%) | 9 (42.9%) |
Housing Structures by Number of Rooms in Climax
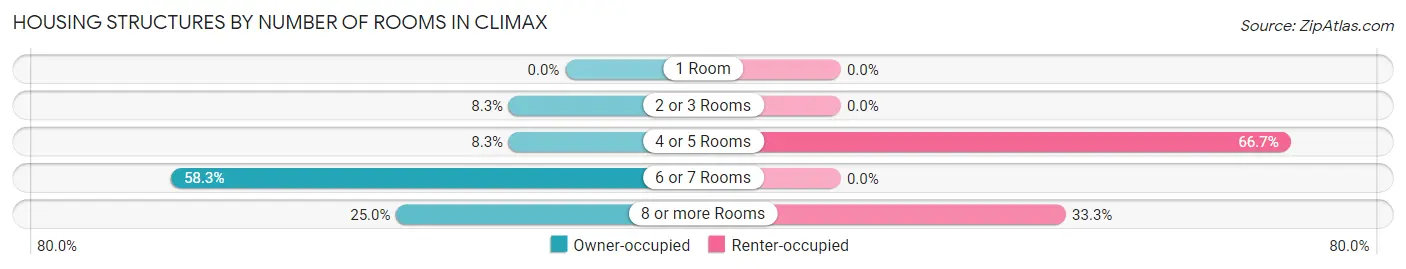
| Number of Rooms | Owner-occupied | Renter-occupied |
| 1 Room | 0 (0.0%) | 0 (0.0%) |
| 2 or 3 Rooms | 1 (8.3%) | 0 (0.0%) |
| 4 or 5 Rooms | 1 (8.3%) | 6 (66.7%) |
| 6 or 7 Rooms | 7 (58.3%) | 0 (0.0%) |
| 8 or more Rooms | 3 (25.0%) | 3 (33.3%) |
| Total | 12 (100.0%) | 9 (100.0%) |
Housing Structure by Heating Type in Climax
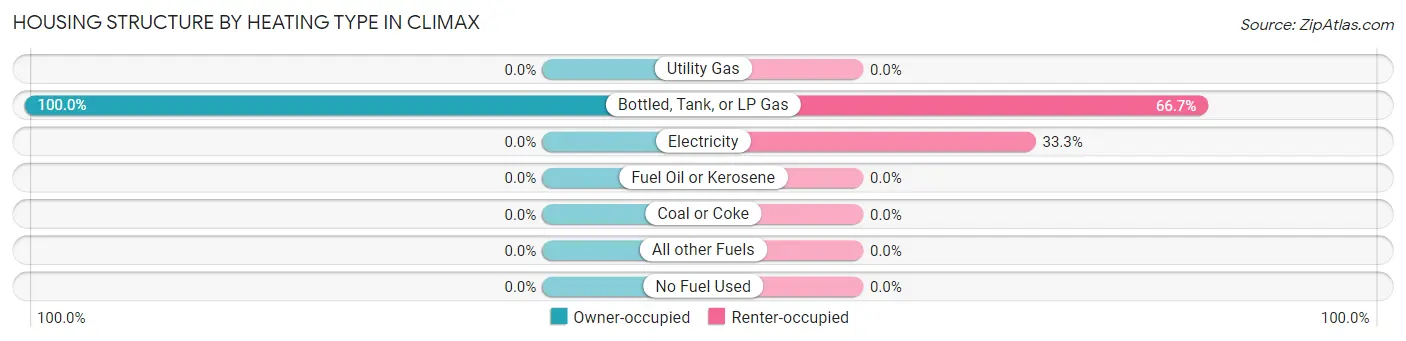
| Heating Type | Owner-occupied | Renter-occupied |
| Utility Gas | 0 (0.0%) | 0 (0.0%) |
| Bottled, Tank, or LP Gas | 12 (100.0%) | 6 (66.7%) |
| Electricity | 0 (0.0%) | 3 (33.3%) |
| Fuel Oil or Kerosene | 0 (0.0%) | 0 (0.0%) |
| Coal or Coke | 0 (0.0%) | 0 (0.0%) |
| All other Fuels | 0 (0.0%) | 0 (0.0%) |
| No Fuel Used | 0 (0.0%) | 0 (0.0%) |
| Total | 12 (100.0%) | 9 (100.0%) |
Household Vehicle Usage in Climax
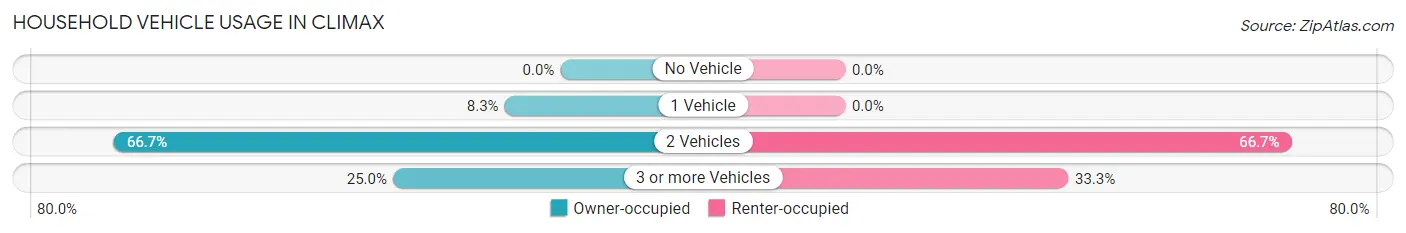
| Vehicles per Household | Owner-occupied | Renter-occupied |
| No Vehicle | 0 (0.0%) | 0 (0.0%) |
| 1 Vehicle | 1 (8.3%) | 0 (0.0%) |
| 2 Vehicles | 8 (66.7%) | 6 (66.7%) |
| 3 or more Vehicles | 3 (25.0%) | 3 (33.3%) |
| Total | 12 (100.0%) | 9 (100.0%) |
Real Estate & Mortgages in Climax
Real Estate and Mortgage Overview in Climax
| Characteristic | Without Mortgage | With Mortgage |
| Housing Units | 12 | 0 |
| Median Property Value | $60,000 | $0 |
| Median Household Income | $69,000 | $0 |
| Monthly Housing Costs | $381 | $0 |
| Real Estate Taxes | $800 | $0 |
Property Value by Mortgage Status in Climax
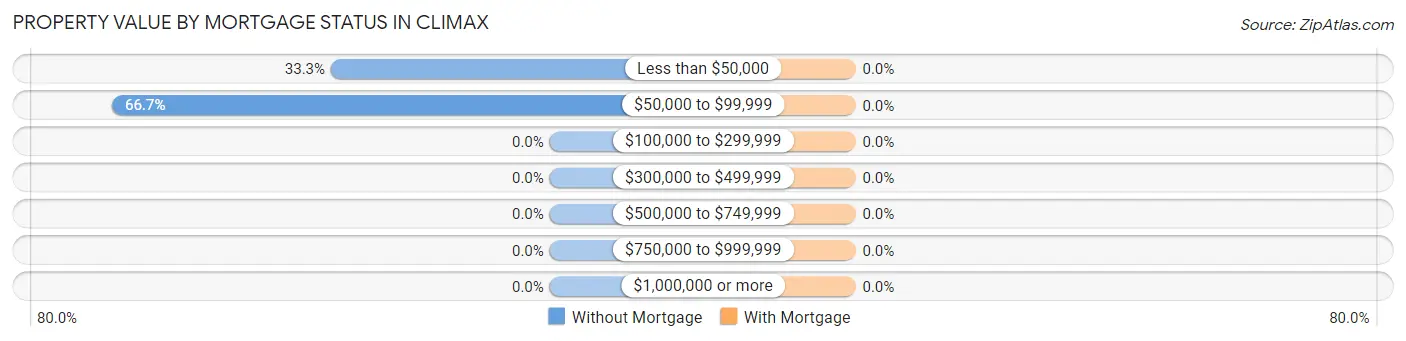
| Property Value | Without Mortgage | With Mortgage |
| Less than $50,000 | 4 (33.3%) | 0 (0.0%) |
| $50,000 to $99,999 | 8 (66.7%) | 0 (0.0%) |
| $100,000 to $299,999 | 0 (0.0%) | 0 (0.0%) |
| $300,000 to $499,999 | 0 (0.0%) | 0 (0.0%) |
| $500,000 to $749,999 | 0 (0.0%) | 0 (0.0%) |
| $750,000 to $999,999 | 0 (0.0%) | 0 (0.0%) |
| $1,000,000 or more | 0 (0.0%) | 0 (0.0%) |
| Total | 12 (100.0%) | 0 (0.0%) |
Household Income by Mortgage Status in Climax
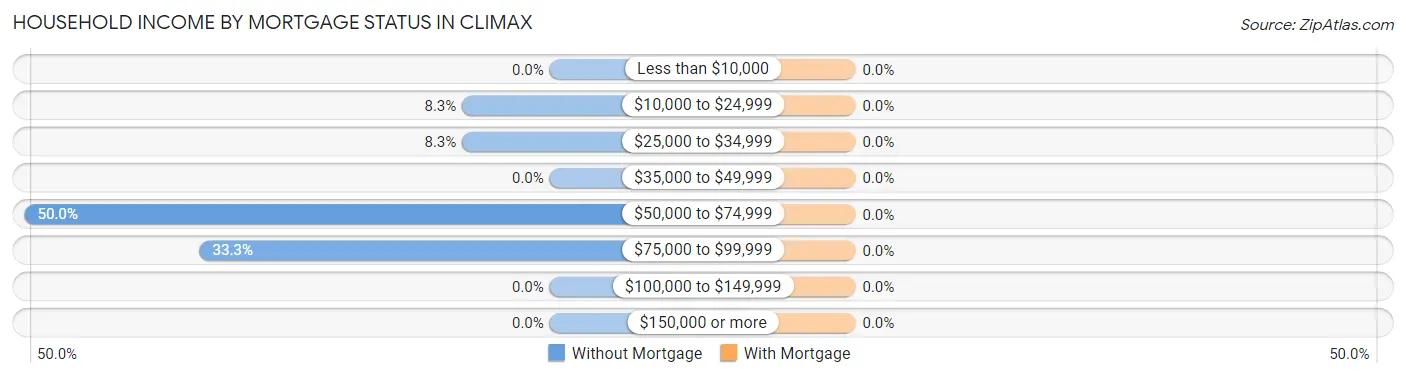
| Household Income | Without Mortgage | With Mortgage |
| Less than $10,000 | 0 (0.0%) | 0 (0.0%) |
| $10,000 to $24,999 | 1 (8.3%) | 0 (0.0%) |
| $25,000 to $34,999 | 1 (8.3%) | 0 (0.0%) |
| $35,000 to $49,999 | 0 (0.0%) | 0 (0.0%) |
| $50,000 to $74,999 | 6 (50.0%) | 0 (0.0%) |
| $75,000 to $99,999 | 4 (33.3%) | 0 (0.0%) |
| $100,000 to $149,999 | 0 (0.0%) | 0 (0.0%) |
| $150,000 or more | 0 (0.0%) | 0 (0.0%) |
| Total | 12 (100.0%) | 0 (0.0%) |
Property Value to Household Income Ratio in Climax
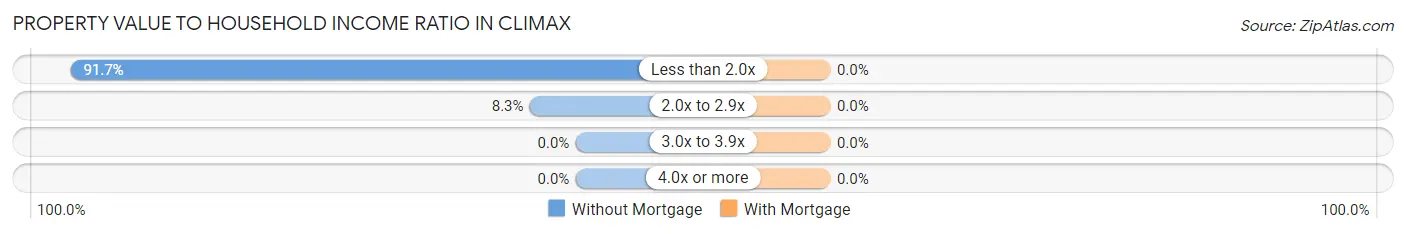
| Value-to-Income Ratio | Without Mortgage | With Mortgage |
| Less than 2.0x | 11 (91.7%) | 0 (0.0%) |
| 2.0x to 2.9x | 1 (8.3%) | 0 (0.0%) |
| 3.0x to 3.9x | 0 (0.0%) | 0 (0.0%) |
| 4.0x or more | 0 (0.0%) | 0 (0.0%) |
| Total | 12 (100.0%) | 0 (0.0%) |
Real Estate Taxes by Mortgage Status in Climax
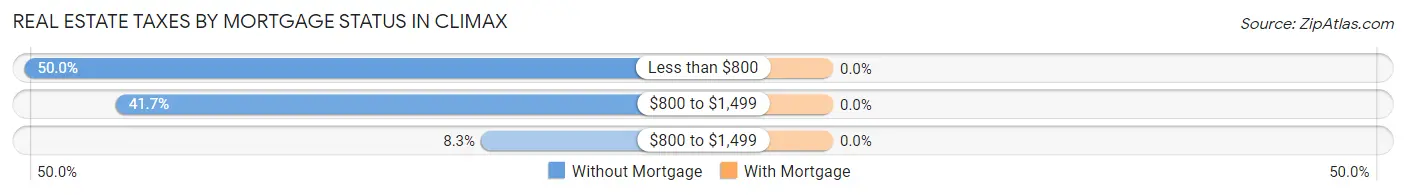
| Property Taxes | Without Mortgage | With Mortgage |
| Less than $800 | 6 (50.0%) | 0 (0.0%) |
| $800 to $1,499 | 5 (41.7%) | 0 (0.0%) |
| $800 to $1,499 | 1 (8.3%) | 0 (0.0%) |
| Total | 12 (100.0%) | 0 (0.0%) |
Health & Disability in Climax
Health Insurance Coverage by Age in Climax
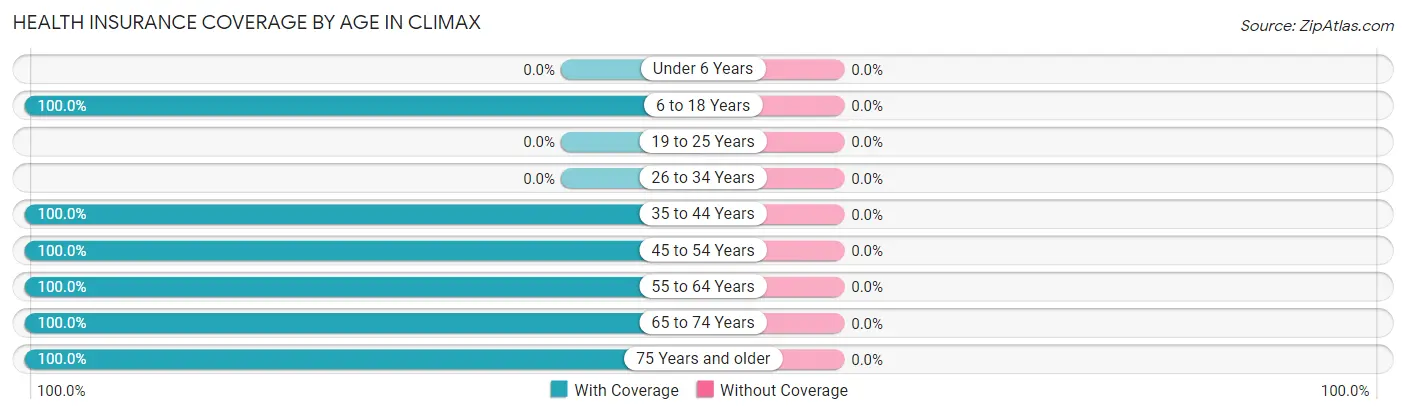
| Age Bracket | With Coverage | Without Coverage |
| Under 6 Years | 0 (0.0%) | 0 (0.0%) |
| 6 to 18 Years | 15 (100.0%) | 0 (0.0%) |
| 19 to 25 Years | 0 (0.0%) | 0 (0.0%) |
| 26 to 34 Years | 0 (0.0%) | 0 (0.0%) |
| 35 to 44 Years | 8 (100.0%) | 0 (0.0%) |
| 45 to 54 Years | 4 (100.0%) | 0 (0.0%) |
| 55 to 64 Years | 5 (100.0%) | 0 (0.0%) |
| 65 to 74 Years | 14 (100.0%) | 0 (0.0%) |
| 75 Years and older | 2 (100.0%) | 0 (0.0%) |
| Total | 48 (100.0%) | 0 (0.0%) |
Health Insurance Coverage by Citizenship Status in Climax
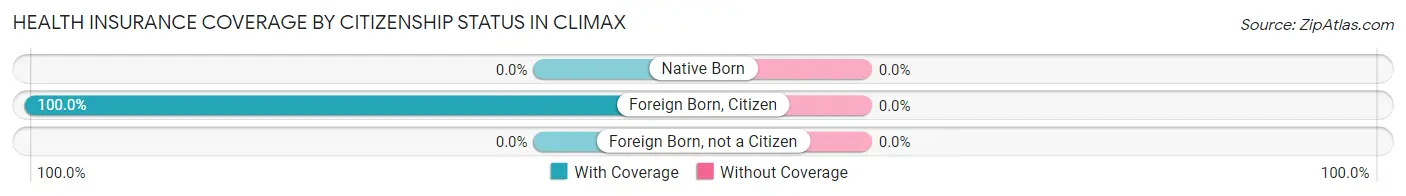
| Citizenship Status | With Coverage | Without Coverage |
| Native Born | 0 (0.0%) | 0 (0.0%) |
| Foreign Born, Citizen | 15 (100.0%) | 0 (0.0%) |
| Foreign Born, not a Citizen | 0 (0.0%) | 0 (0.0%) |
Health Insurance Coverage by Household Income in Climax
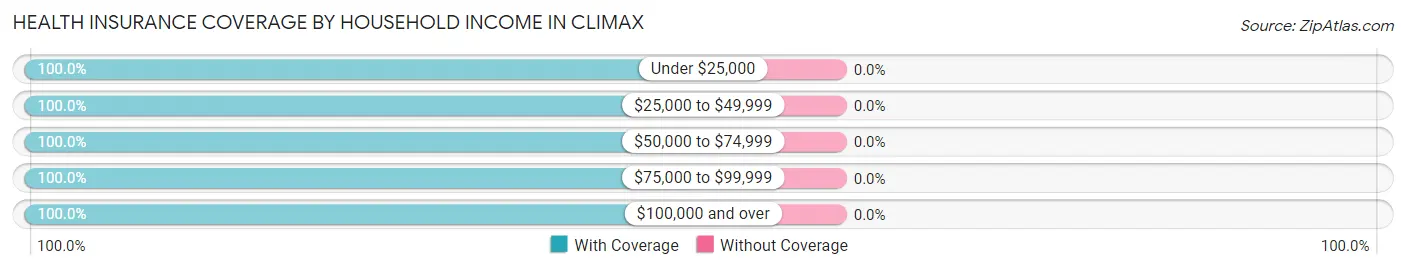
| Household Income | With Coverage | Without Coverage |
| Under $25,000 | 1 (100.0%) | 0 (0.0%) |
| $25,000 to $49,999 | 15 (100.0%) | 0 (0.0%) |
| $50,000 to $74,999 | 10 (100.0%) | 0 (0.0%) |
| $75,000 to $99,999 | 17 (100.0%) | 0 (0.0%) |
| $100,000 and over | 5 (100.0%) | 0 (0.0%) |
Public vs Private Health Insurance Coverage by Age in Climax
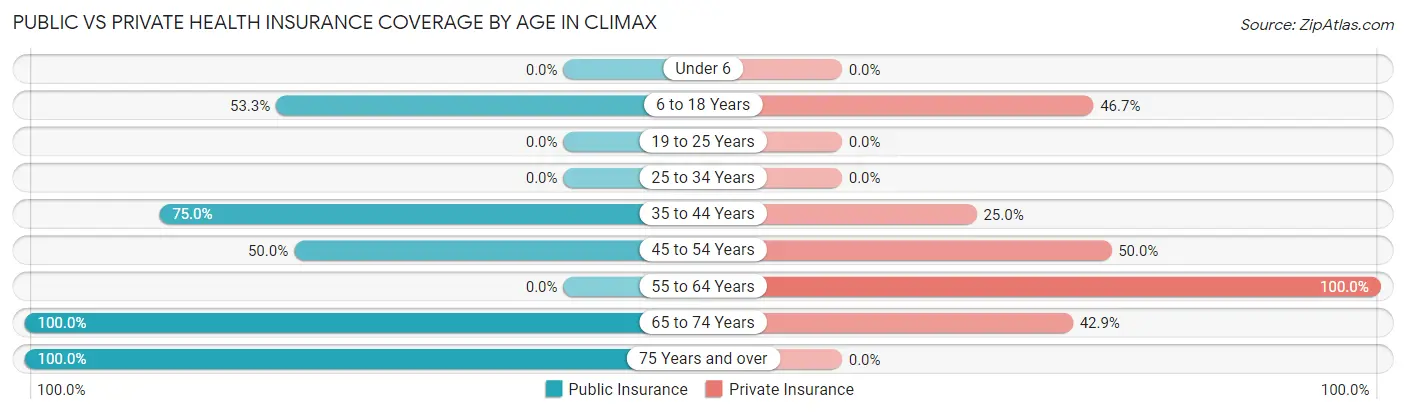
| Age Bracket | Public Insurance | Private Insurance |
| Under 6 | 0 (0.0%) | 0 (0.0%) |
| 6 to 18 Years | 8 (53.3%) | 7 (46.7%) |
| 19 to 25 Years | 0 (0.0%) | 0 (0.0%) |
| 25 to 34 Years | 0 (0.0%) | 0 (0.0%) |
| 35 to 44 Years | 6 (75.0%) | 2 (25.0%) |
| 45 to 54 Years | 2 (50.0%) | 2 (50.0%) |
| 55 to 64 Years | 0 (0.0%) | 5 (100.0%) |
| 65 to 74 Years | 14 (100.0%) | 6 (42.9%) |
| 75 Years and over | 2 (100.0%) | 0 (0.0%) |
| Total | 32 (66.7%) | 22 (45.8%) |
Disability Status by Sex by Age in Climax
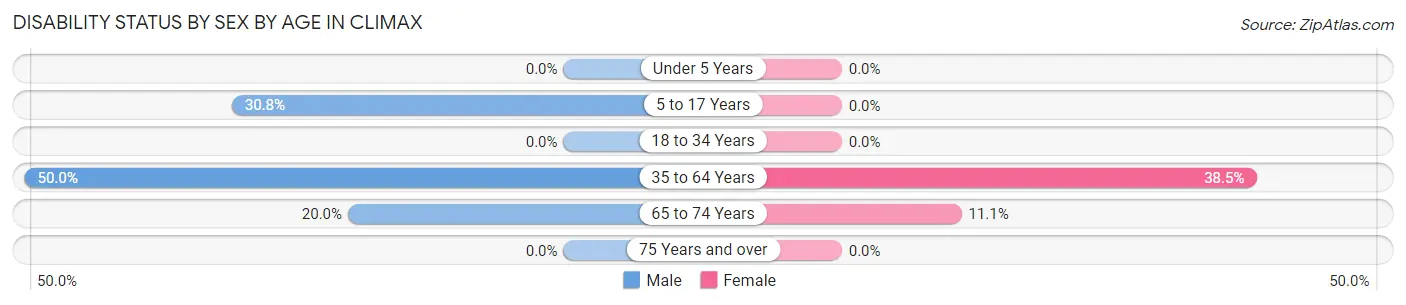
| Age Bracket | Male | Female |
| Under 5 Years | 0 (0.0%) | 0 (0.0%) |
| 5 to 17 Years | 4 (30.8%) | 0 (0.0%) |
| 18 to 34 Years | 0 (0.0%) | 0 (0.0%) |
| 35 to 64 Years | 2 (50.0%) | 5 (38.5%) |
| 65 to 74 Years | 1 (20.0%) | 1 (11.1%) |
| 75 Years and over | 0 (0.0%) | 0 (0.0%) |
Disability Class by Sex by Age in Climax
Disability Class: Hearing Difficulty
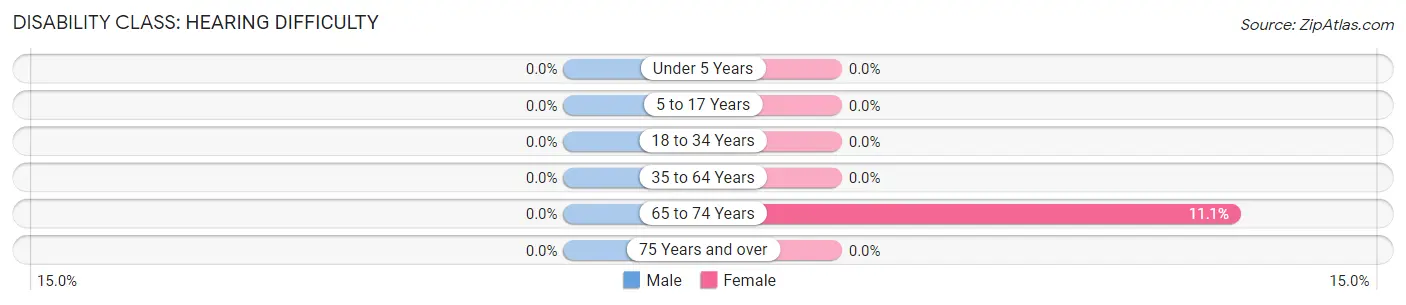
| Age Bracket | Male | Female |
| Under 5 Years | 0 (0.0%) | 0 (0.0%) |
| 5 to 17 Years | 0 (0.0%) | 0 (0.0%) |
| 18 to 34 Years | 0 (0.0%) | 0 (0.0%) |
| 35 to 64 Years | 0 (0.0%) | 0 (0.0%) |
| 65 to 74 Years | 0 (0.0%) | 1 (11.1%) |
| 75 Years and over | 0 (0.0%) | 0 (0.0%) |
Disability Class: Vision Difficulty
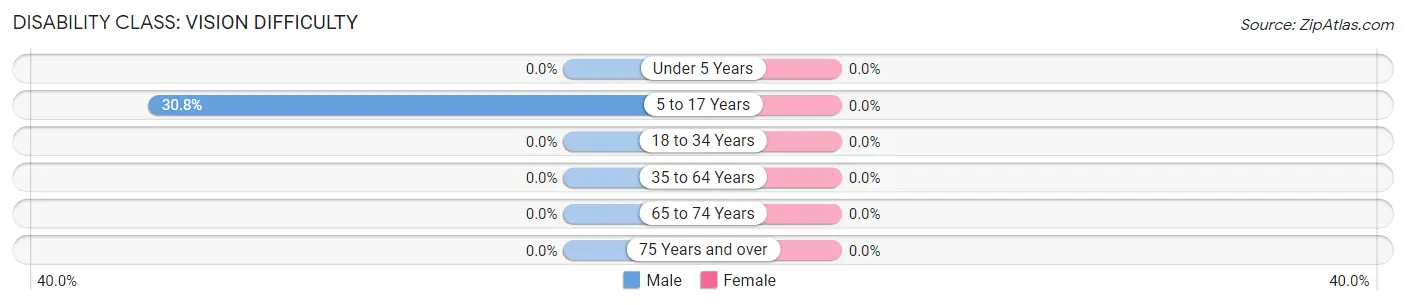
| Age Bracket | Male | Female |
| Under 5 Years | 0 (0.0%) | 0 (0.0%) |
| 5 to 17 Years | 4 (30.8%) | 0 (0.0%) |
| 18 to 34 Years | 0 (0.0%) | 0 (0.0%) |
| 35 to 64 Years | 0 (0.0%) | 0 (0.0%) |
| 65 to 74 Years | 0 (0.0%) | 0 (0.0%) |
| 75 Years and over | 0 (0.0%) | 0 (0.0%) |
Disability Class: Cognitive Difficulty
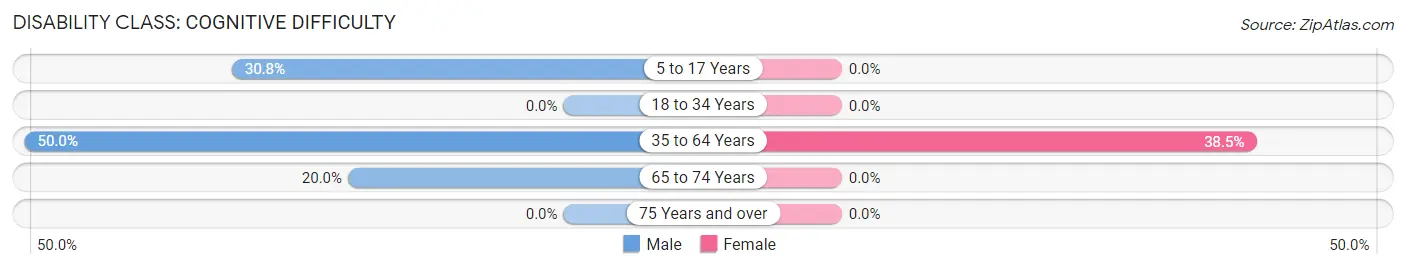
| Age Bracket | Male | Female |
| 5 to 17 Years | 4 (30.8%) | 0 (0.0%) |
| 18 to 34 Years | 0 (0.0%) | 0 (0.0%) |
| 35 to 64 Years | 2 (50.0%) | 5 (38.5%) |
| 65 to 74 Years | 1 (20.0%) | 0 (0.0%) |
| 75 Years and over | 0 (0.0%) | 0 (0.0%) |
Disability Class: Ambulatory Difficulty
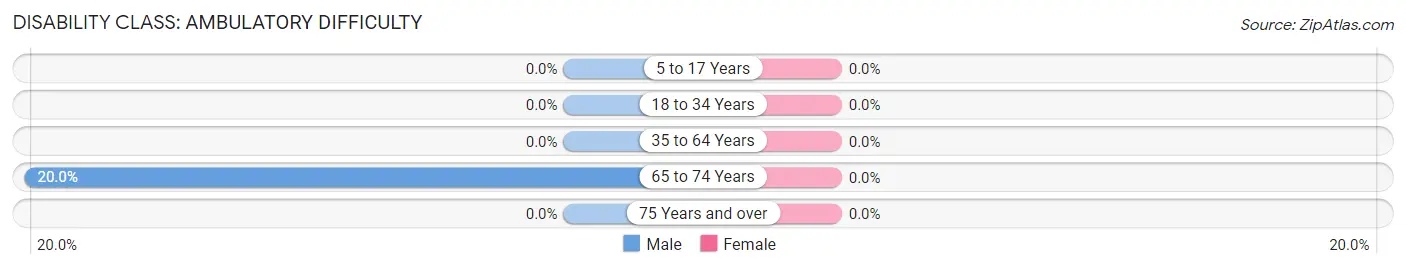
| Age Bracket | Male | Female |
| 5 to 17 Years | 0 (0.0%) | 0 (0.0%) |
| 18 to 34 Years | 0 (0.0%) | 0 (0.0%) |
| 35 to 64 Years | 0 (0.0%) | 0 (0.0%) |
| 65 to 74 Years | 1 (20.0%) | 0 (0.0%) |
| 75 Years and over | 0 (0.0%) | 0 (0.0%) |
Disability Class: Self-Care Difficulty
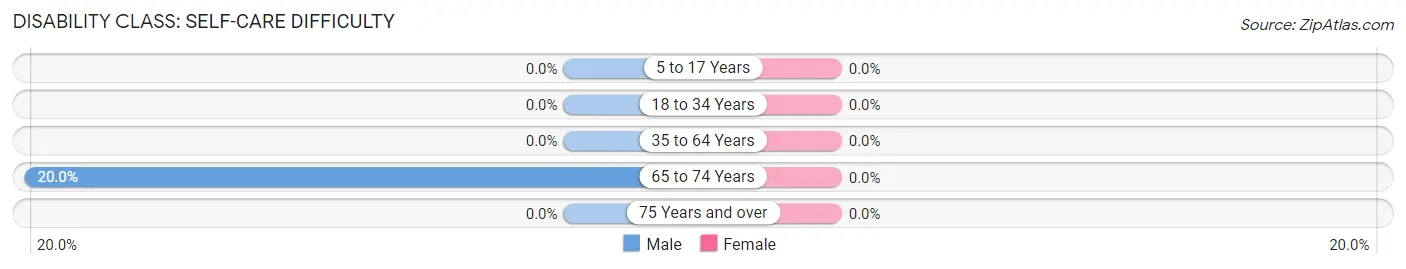
| Age Bracket | Male | Female |
| 5 to 17 Years | 0 (0.0%) | 0 (0.0%) |
| 18 to 34 Years | 0 (0.0%) | 0 (0.0%) |
| 35 to 64 Years | 0 (0.0%) | 0 (0.0%) |
| 65 to 74 Years | 1 (20.0%) | 0 (0.0%) |
| 75 Years and over | 0 (0.0%) | 0 (0.0%) |
Technology Access in Climax
Computing Device Access in Climax
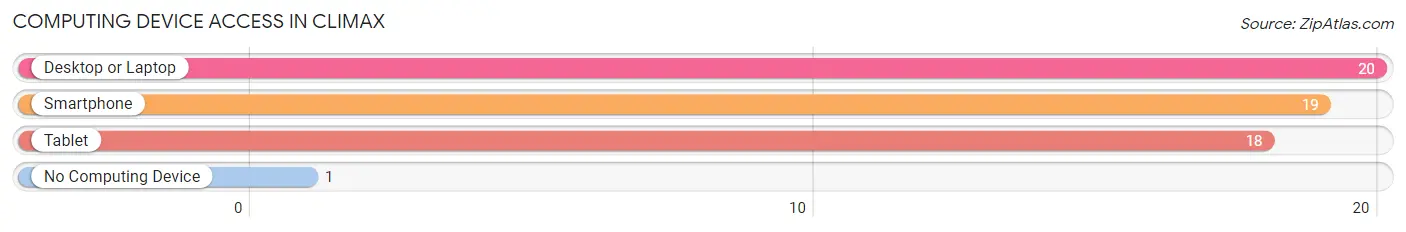
| Device Type | # Households | % Households |
| Desktop or Laptop | 20 | 95.2% |
| Smartphone | 19 | 90.5% |
| Tablet | 18 | 85.7% |
| No Computing Device | 1 | 4.8% |
| Total | 21 | 100.0% |
Internet Access in Climax
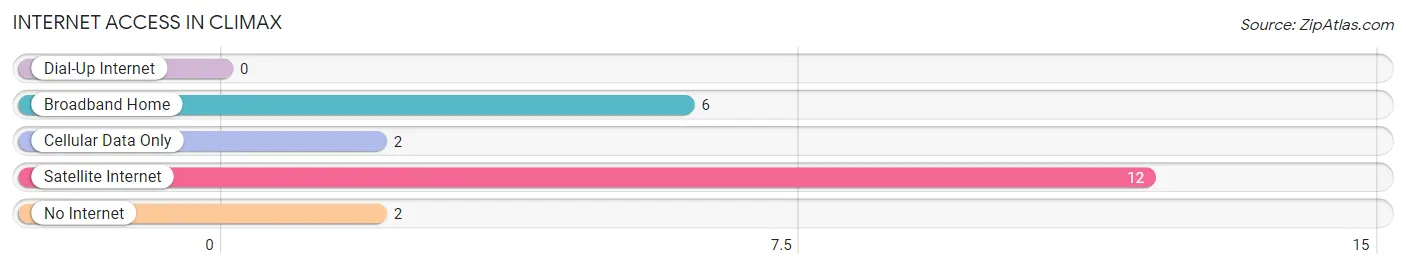
| Internet Type | # Households | % Households |
| Dial-Up Internet | 0 | 0.0% |
| Broadband Home | 6 | 28.6% |
| Cellular Data Only | 2 | 9.5% |
| Satellite Internet | 12 | 57.1% |
| No Internet | 2 | 9.5% |
| Total | 21 | 100.0% |
Climax Summary
Climax, Kansas is a small town located in the southwestern corner of the state, near the Oklahoma border. It is part of the Garden City Micropolitan Statistical Area and is the county seat of Finney County. The town was founded in 1885 and has a population of just over 500 people.
Geography
Climax is located in the southwestern corner of Kansas, near the Oklahoma border. It is part of the Garden City Micropolitan Statistical Area and is the county seat of Finney County. The town is situated on the Arkansas River, which provides a natural border between Kansas and Oklahoma. The town is located at an elevation of 2,845 feet above sea level. The climate in Climax is semi-arid, with hot summers and cold winters. The average annual precipitation is about 18 inches.
Economy
The economy of Climax is largely based on agriculture. The town is home to several farms and ranches, which produce a variety of crops, including wheat, corn, and sorghum. The town also has a few small businesses, including a grocery store, a hardware store, and a few restaurants.
Demographics
As of the 2010 census, the population of Climax was 514. The racial makeup of the town was 95.3% White, 0.6% African American, 0.4% Native American, 0.2% Asian, 0.2% Pacific Islander, and 3.3% from two or more races. The median household income was $37,500, and the median family income was $45,000. The per capita income was $17,000.
History
Climax was founded in 1885 by a group of settlers from Missouri. The town was named after the nearby Climax Springs, which were believed to have healing properties. The town was incorporated in 1887 and quickly became a center for agriculture and commerce. The town was also home to a number of churches, schools, and businesses.
In the early 1900s, Climax was a bustling town with a population of over 1,000 people. The town had a number of stores, a bank, a hotel, and a movie theater. The town also had a number of churches, including the First Baptist Church, which was founded in 1887.
In the late 20th century, the population of Climax began to decline as people moved away in search of better economic opportunities. The town’s population has remained relatively stable since then, with a population of just over 500 people as of the 2010 census.
Today, Climax is a small, rural town with a strong sense of community. The town is home to a number of churches, a library, and a few small businesses. The town also hosts a number of annual events, including the Finney County Fair and the Climax Country Music Festival.
Common Questions
What is the Total Population of Climax?
Total Population of Climax is 48.
What is the Total Male Population of Climax?
Total Male Population of Climax is 23.
What is the Total Female Population of Climax?
Total Female Population of Climax is 25.
What is the Ratio of Males per 100 Females in Climax?
There are 92.00 Males per 100 Females in Climax.
What is the Ratio of Females per 100 Males in Climax?
There are 108.70 Females per 100 Males in Climax.
What is the Median Population Age in Climax?
Median Population Age in Climax is 51.0 Years.
What is the Average Family Size in Climax
Average Family Size in Climax is 2.4 People.
What is the Average Household Size in Climax
Average Household Size in Climax is 2.3 People.
What is Per Capita Income in Climax?
Per Capita income in Climax is $36,760.
What is the Median Family Income in Climax?
Median Family Income in Climax is $68,750.
What is the Median Household income in Climax?
Median Household Income in Climax is $68,250.
What is Inequality or Gini Index in Climax?
Inequality or Gini Index in Climax is 0.43.
How Large is the Labor Force in Climax?
There are 18 People in the Labor Forcein in Climax.
What is the Percentage of People in the Labor Force in Climax?
48.6% of People are in the Labor Force in Climax.