Tlingit-Haida vs Zimbabwean Family Households
COMPARE
Tlingit-Haida
Zimbabwean
Family Households
Family Households Comparison
Tlingit-Haida
Zimbabweans
61.6%
FAMILY HOUSEHOLDS
0.0/ 100
METRIC RATING
323rd/ 347
METRIC RANK
64.1%
FAMILY HOUSEHOLDS
24.7/ 100
METRIC RATING
190th/ 347
METRIC RANK
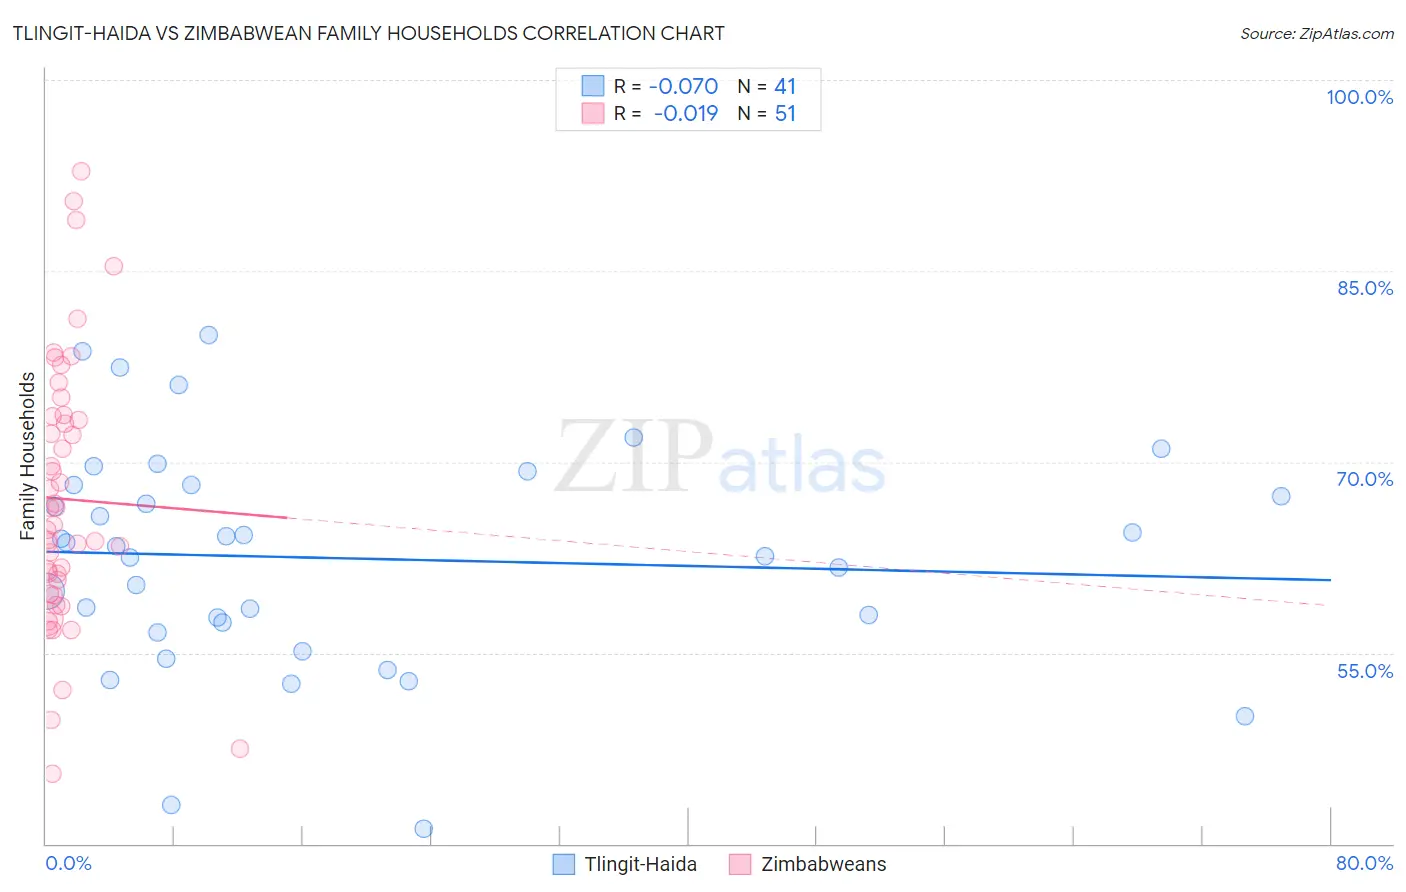
Tlingit-Haida vs Zimbabwean Family Households Correlation Chart
The statistical analysis conducted on geographies consisting of 60,855,548 people shows a slight negative correlation between the proportion of Tlingit-Haida and percentage of family households in the United States with a correlation coefficient (R) of -0.070 and weighted average of 61.6%. Similarly, the statistical analysis conducted on geographies consisting of 69,192,017 people shows no correlation between the proportion of Zimbabweans and percentage of family households in the United States with a correlation coefficient (R) of -0.019 and weighted average of 64.1%, a difference of 4.0%.
Family Households Correlation Summary
| Measurement | Tlingit-Haida | Zimbabwean |
| Minimum | 41.2% | 45.5% |
| Maximum | 80.0% | 92.9% |
| Range | 38.8% | 47.3% |
| Mean | 62.4% | 67.1% |
| Median | 63.4% | 65.0% |
| Interquartile 25% (IQ1) | 57.0% | 59.7% |
| Interquartile 75% (IQ3) | 68.2% | 73.6% |
| Interquartile Range (IQR) | 11.2% | 13.9% |
| Standard Deviation (Sample) | 8.7% | 10.5% |
| Standard Deviation (Population) | 8.6% | 10.4% |
Similar Demographics by Family Households
Demographics Similar to Tlingit-Haida by Family Households
In terms of family households, the demographic groups most similar to Tlingit-Haida are Immigrants from Serbia (61.6%, a difference of 0.010%), Immigrants from West Indies (61.6%, a difference of 0.010%), Immigrants from Switzerland (61.6%, a difference of 0.020%), Alsatian (61.7%, a difference of 0.10%), and Ugandan (61.7%, a difference of 0.15%).
| Demographics | Rating | Rank | Family Households |
| Immigrants | Middle Africa | 0.0 /100 | #316 | Tragic 61.9% |
| Immigrants | Bosnia and Herzegovina | 0.0 /100 | #317 | Tragic 61.9% |
| Alaskan Athabascans | 0.0 /100 | #318 | Tragic 61.8% |
| Cape Verdeans | 0.0 /100 | #319 | Tragic 61.8% |
| Ugandans | 0.0 /100 | #320 | Tragic 61.7% |
| Alsatians | 0.0 /100 | #321 | Tragic 61.7% |
| Immigrants | Serbia | 0.0 /100 | #322 | Tragic 61.6% |
| Tlingit-Haida | 0.0 /100 | #323 | Tragic 61.6% |
| Immigrants | West Indies | 0.0 /100 | #324 | Tragic 61.6% |
| Immigrants | Switzerland | 0.0 /100 | #325 | Tragic 61.6% |
| Indonesians | 0.0 /100 | #326 | Tragic 61.5% |
| Blacks/African Americans | 0.0 /100 | #327 | Tragic 61.5% |
| Kiowa | 0.0 /100 | #328 | Tragic 61.4% |
| Cambodians | 0.0 /100 | #329 | Tragic 61.4% |
| Immigrants | Australia | 0.0 /100 | #330 | Tragic 61.3% |
Demographics Similar to Zimbabweans by Family Households
In terms of family households, the demographic groups most similar to Zimbabweans are Arab (64.1%, a difference of 0.0%), Immigrants from Western Asia (64.1%, a difference of 0.010%), Lithuanian (64.0%, a difference of 0.020%), French (64.0%, a difference of 0.020%), and Paraguayan (64.1%, a difference of 0.040%).
| Demographics | Rating | Rank | Family Households |
| Creek | 34.1 /100 | #183 | Fair 64.2% |
| Puerto Ricans | 33.4 /100 | #184 | Fair 64.2% |
| Immigrants | Iran | 30.4 /100 | #185 | Fair 64.1% |
| Spanish Americans | 30.1 /100 | #186 | Fair 64.1% |
| Northern Europeans | 28.2 /100 | #187 | Fair 64.1% |
| Paraguayans | 26.7 /100 | #188 | Fair 64.1% |
| Immigrants | Western Asia | 25.3 /100 | #189 | Fair 64.1% |
| Zimbabweans | 24.7 /100 | #190 | Fair 64.1% |
| Arabs | 24.5 /100 | #191 | Fair 64.1% |
| Lithuanians | 23.8 /100 | #192 | Fair 64.0% |
| French | 23.7 /100 | #193 | Fair 64.0% |
| Paiute | 22.2 /100 | #194 | Fair 64.0% |
| Immigrants | North America | 20.0 /100 | #195 | Poor 64.0% |
| Immigrants | Canada | 19.2 /100 | #196 | Poor 64.0% |
| Seminole | 18.9 /100 | #197 | Poor 64.0% |