St David, AZ
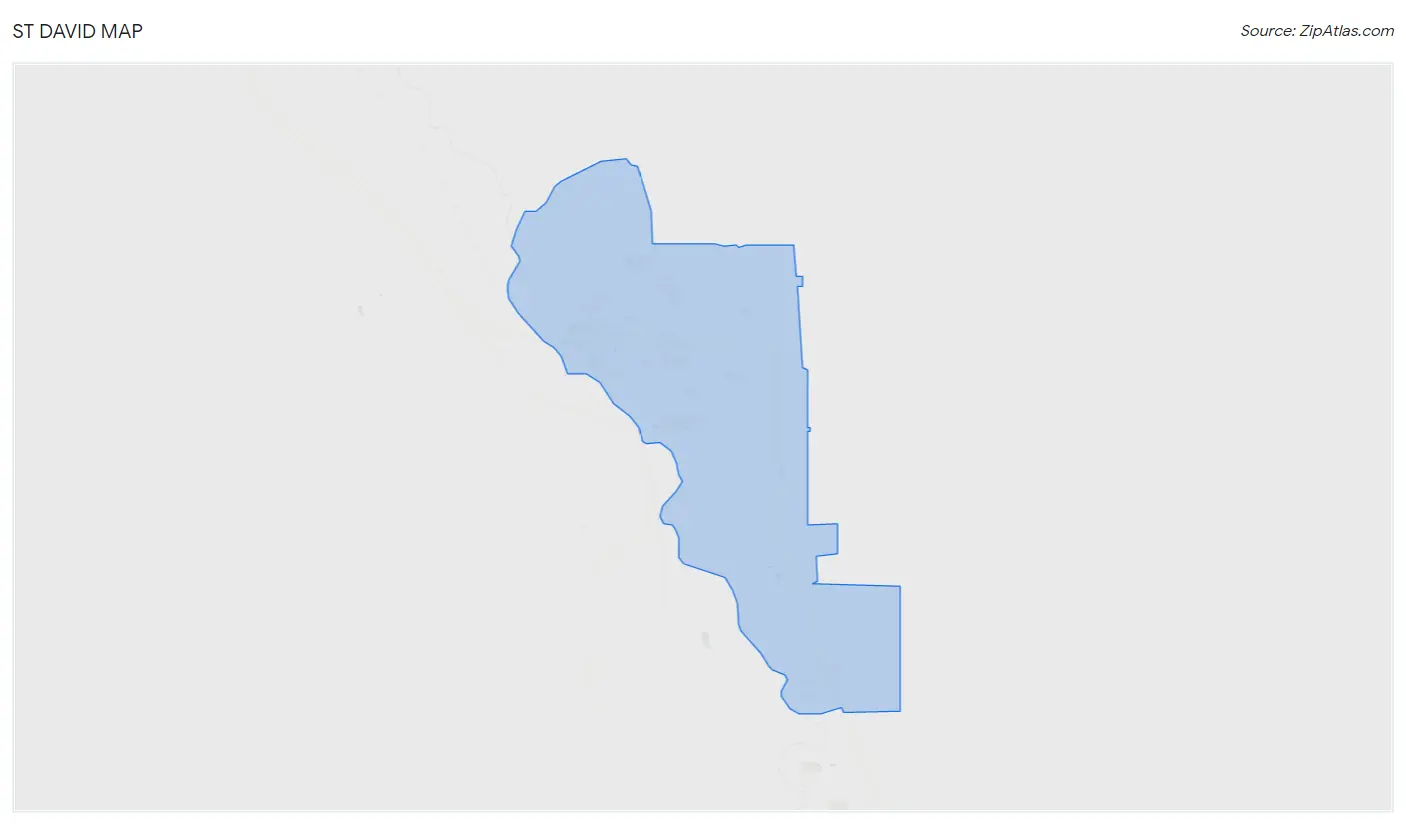
St David Map
St David Overview
1,300
TOTAL POPULATION
585
MALE POPULATION
715
FEMALE POPULATION
81.82
MALES / 100 FEMALES
122.22
FEMALES / 100 MALES
35.3
MEDIAN AGE
3.6
AVG FAMILY SIZE
2.6
AVG HOUSEHOLD SIZE
$24,560
PER CAPITA INCOME
$53,176
AVG FAMILY INCOME
$51,705
AVG HOUSEHOLD INCOME
0.45
INEQUALITY / GINI INDEX
476
LABOR FORCE [ PEOPLE ]
51.5%
PERCENT IN LABOR FORCE
Race in St David
The most populous races in St David are White / Caucasian (1,117 | 85.9%), Hispanic or Latino (149 | 11.5%), and Some other Race (147 | 11.3%).
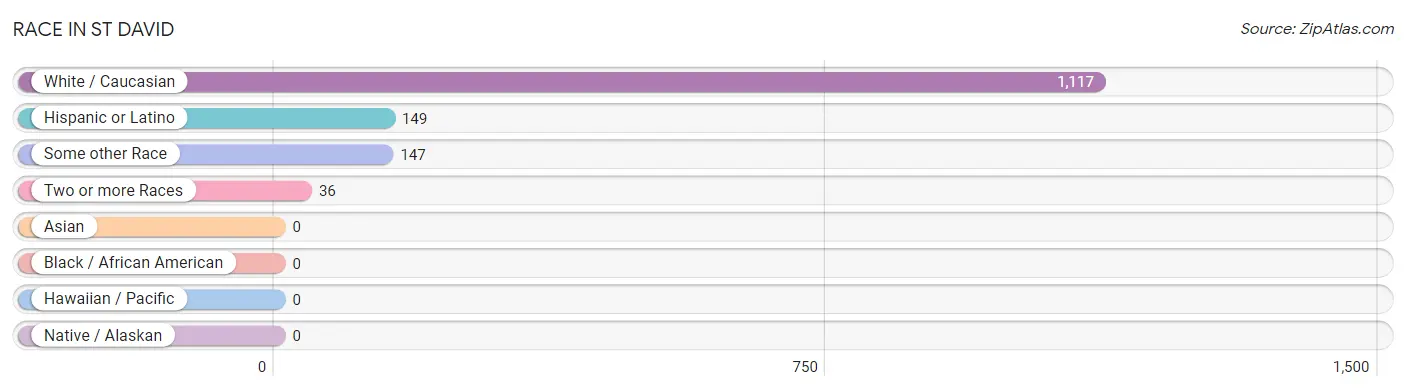
| Race | # Population | % Population |
| Asian | 0 | 0.0% |
| Black / African American | 0 | 0.0% |
| Hawaiian / Pacific | 0 | 0.0% |
| Hispanic or Latino | 149 | 11.5% |
| Native / Alaskan | 0 | 0.0% |
| White / Caucasian | 1,117 | 85.9% |
| Two or more Races | 36 | 2.8% |
| Some other Race | 147 | 11.3% |
| Total | 1,300 | 100.0% |
Ancestry in St David
The most populous ancestries reported in St David are German (198 | 15.2%), Irish (184 | 14.1%), Scottish (163 | 12.5%), Mexican (149 | 11.5%), and Welsh (69 | 5.3%), together accounting for 58.7% of all St David residents.
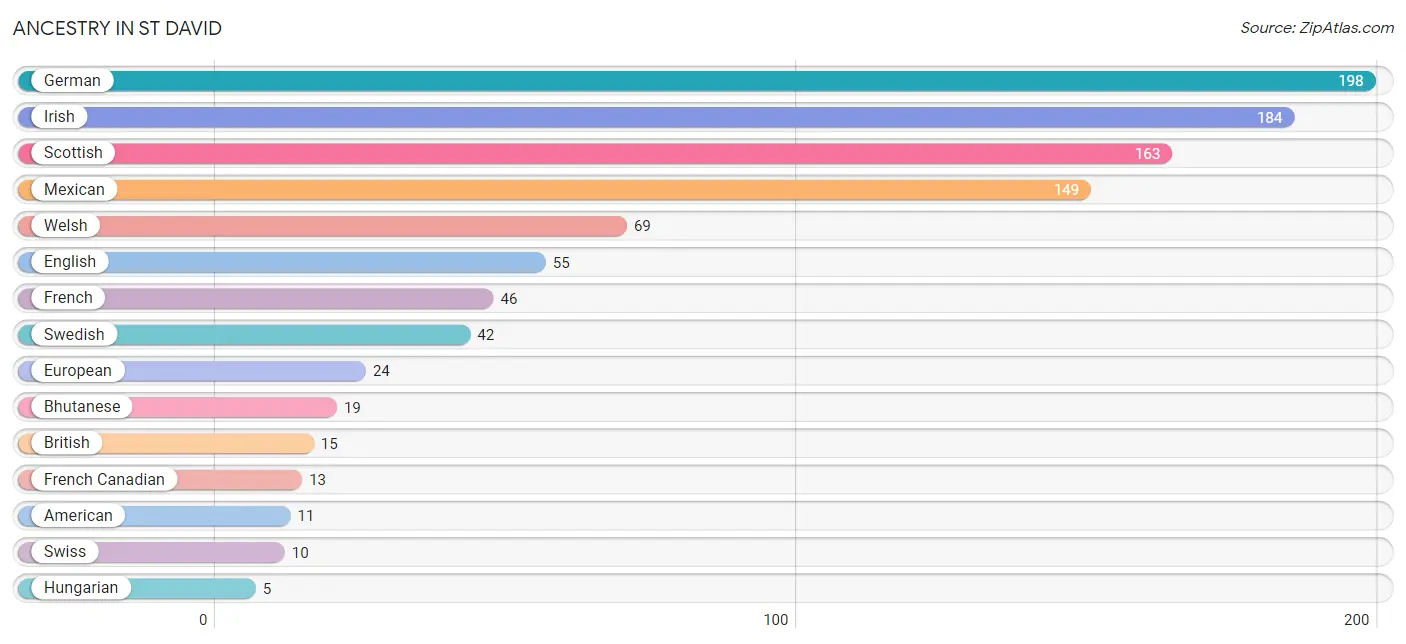
| Ancestry | # Population | % Population |
| American | 11 | 0.9% |
| Bhutanese | 19 | 1.5% |
| British | 15 | 1.1% |
| Choctaw | 3 | 0.2% |
| Czech | 4 | 0.3% |
| English | 55 | 4.2% |
| European | 24 | 1.8% |
| French | 46 | 3.5% |
| French Canadian | 13 | 1.0% |
| German | 198 | 15.2% |
| Greek | 4 | 0.3% |
| Hungarian | 5 | 0.4% |
| Irish | 184 | 14.1% |
| Mexican | 149 | 11.5% |
| Scottish | 163 | 12.5% |
| Swedish | 42 | 3.2% |
| Swiss | 10 | 0.8% |
| Welsh | 69 | 5.3% | View All 18 Rows |
Immigrants in St David
The most numerous immigrant groups reported in St David came from Central America (10 | 0.8%), Latin America (10 | 0.8%), and Mexico (10 | 0.8%), together accounting for 2.3% of all St David residents.
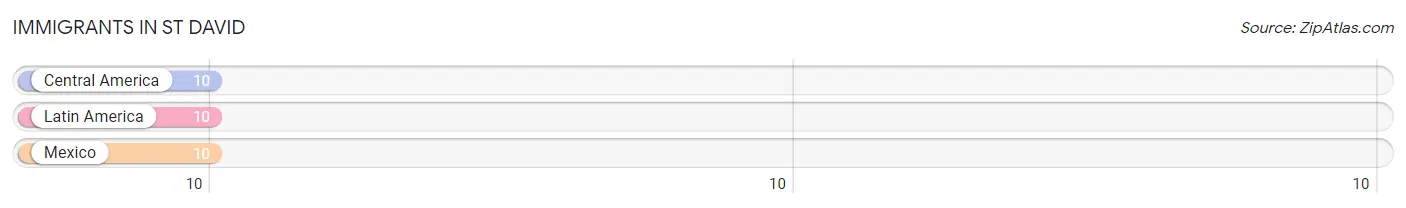
| Immigration Origin | # Population | % Population |
| Central America | 10 | 0.8% |
| Latin America | 10 | 0.8% |
| Mexico | 10 | 0.8% | View All 3 Rows |
Sex and Age in St David
Sex and Age in St David
The most populous age groups in St David are 65 to 69 Years (113 | 19.3%) for men and Under 5 Years (117 | 16.4%) for women.
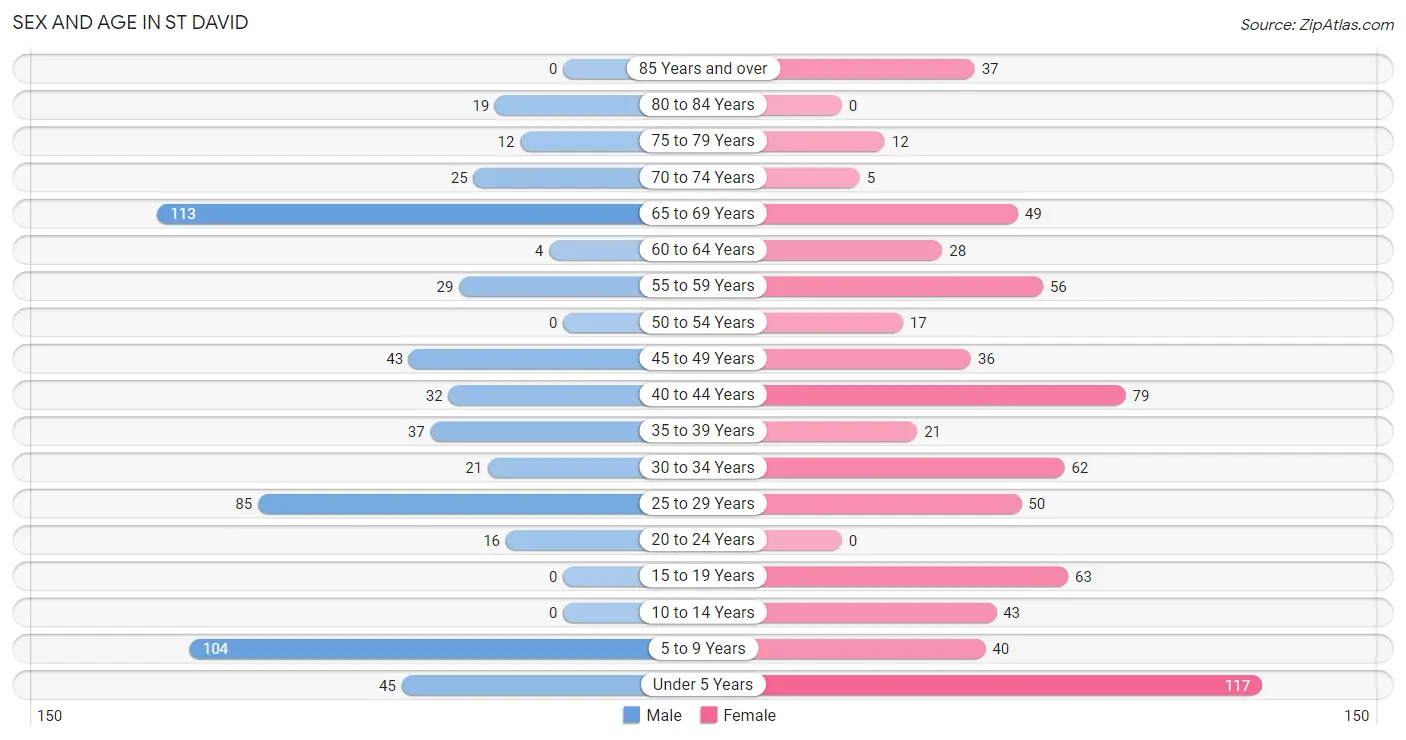
| Age Bracket | Male | Female |
| Under 5 Years | 45 (7.7%) | 117 (16.4%) |
| 5 to 9 Years | 104 (17.8%) | 40 (5.6%) |
| 10 to 14 Years | 0 (0.0%) | 43 (6.0%) |
| 15 to 19 Years | 0 (0.0%) | 63 (8.8%) |
| 20 to 24 Years | 16 (2.7%) | 0 (0.0%) |
| 25 to 29 Years | 85 (14.5%) | 50 (7.0%) |
| 30 to 34 Years | 21 (3.6%) | 62 (8.7%) |
| 35 to 39 Years | 37 (6.3%) | 21 (2.9%) |
| 40 to 44 Years | 32 (5.5%) | 79 (11.1%) |
| 45 to 49 Years | 43 (7.3%) | 36 (5.0%) |
| 50 to 54 Years | 0 (0.0%) | 17 (2.4%) |
| 55 to 59 Years | 29 (5.0%) | 56 (7.8%) |
| 60 to 64 Years | 4 (0.7%) | 28 (3.9%) |
| 65 to 69 Years | 113 (19.3%) | 49 (6.9%) |
| 70 to 74 Years | 25 (4.3%) | 5 (0.7%) |
| 75 to 79 Years | 12 (2.1%) | 12 (1.7%) |
| 80 to 84 Years | 19 (3.3%) | 0 (0.0%) |
| 85 Years and over | 0 (0.0%) | 37 (5.2%) |
| Total | 585 (100.0%) | 715 (100.0%) |
Families and Households in St David
Median Family Size in St David
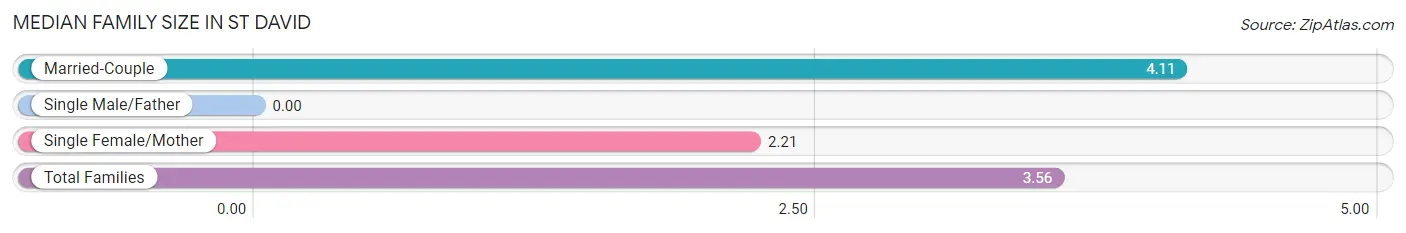
| Family Type | # Families | Family Size |
| Married-Couple | 196 (71.0%) | 4.11 |
| Single Male/Father | 0 (0.0%) | - |
| Single Female/Mother | 80 (29.0%) | 2.21 |
| Total Families | 276 (100.0%) | 3.56 |
Median Household Size in St David
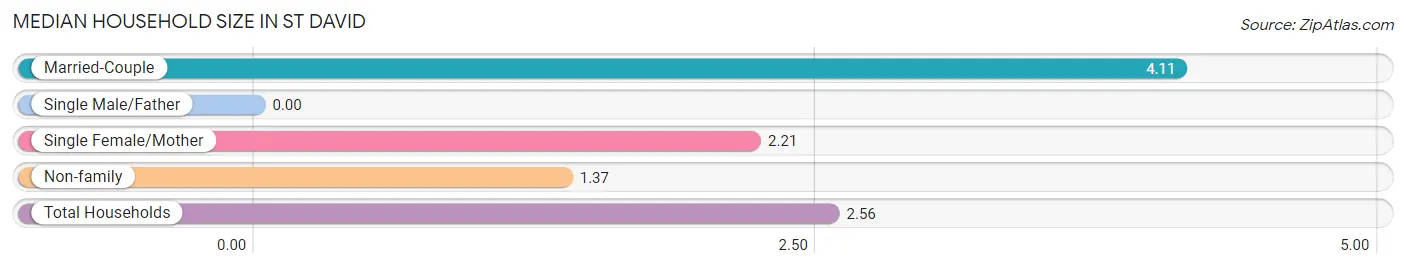
| Household Type | # Households | Household Size |
| Married-Couple | 196 (38.6%) | 4.11 |
| Single Male/Father | 0 (0.0%) | - |
| Single Female/Mother | 80 (15.8%) | 2.21 |
| Non-family | 232 (45.7%) | 1.37 |
| Total Households | 508 (100.0%) | 2.56 |
Household Size by Marriage Status in St David
Out of a total of 508 households in St David, 276 (54.3%) are family households, while 232 (45.7%) are nonfamily households. The most numerous type of family households are 2-person households, comprising 171, and the most common type of nonfamily households are 1-person households, comprising 160.
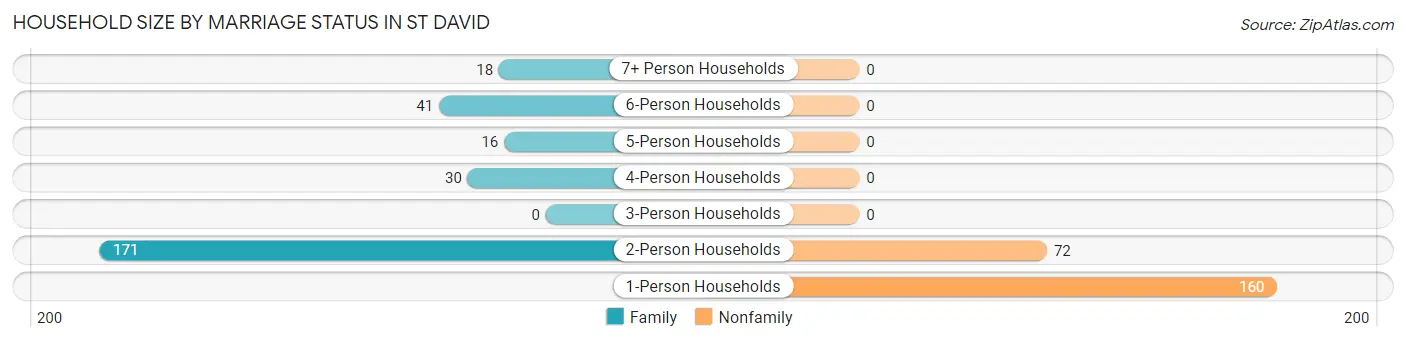
| Household Size | Family Households | Nonfamily Households |
| 1-Person Households | - | 160 (31.5%) |
| 2-Person Households | 171 (33.7%) | 72 (14.2%) |
| 3-Person Households | 0 (0.0%) | 0 (0.0%) |
| 4-Person Households | 30 (5.9%) | 0 (0.0%) |
| 5-Person Households | 16 (3.2%) | 0 (0.0%) |
| 6-Person Households | 41 (8.1%) | 0 (0.0%) |
| 7+ Person Households | 18 (3.5%) | 0 (0.0%) |
| Total | 276 (54.3%) | 232 (45.7%) |
Female Fertility in St David
Fertility by Age in St David
Average fertility rate in St David is 180.0 births per 1,000 women. Women in the age bracket of 20 to 34 years have the highest fertility rate with 268.0 births per 1,000 women. Women in the age bracket of 20 to 34 years acount for 53.6% of all women with births.
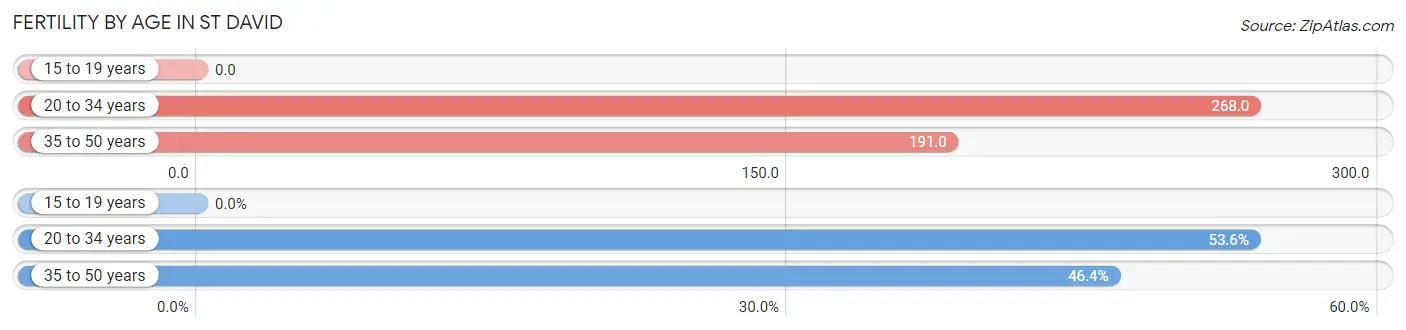
| Age Bracket | Women with Births | Births / 1,000 Women |
| 15 to 19 years | 0 (0.0%) | 0.0 |
| 20 to 34 years | 30 (53.6%) | 268.0 |
| 35 to 50 years | 26 (46.4%) | 191.0 |
| Total | 56 (100.0%) | 180.0 |
Fertility by Age by Marriage Status in St David
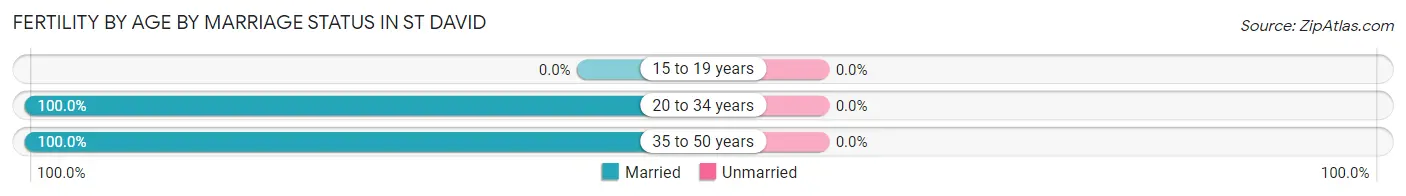
| Age Bracket | Married | Unmarried |
| 15 to 19 years | 0 (0.0%) | 0 (0.0%) |
| 20 to 34 years | 30 (100.0%) | 0 (0.0%) |
| 35 to 50 years | 26 (100.0%) | 0 (0.0%) |
| Total | 56 (100.0%) | 0 (0.0%) |
Fertility by Education in St David
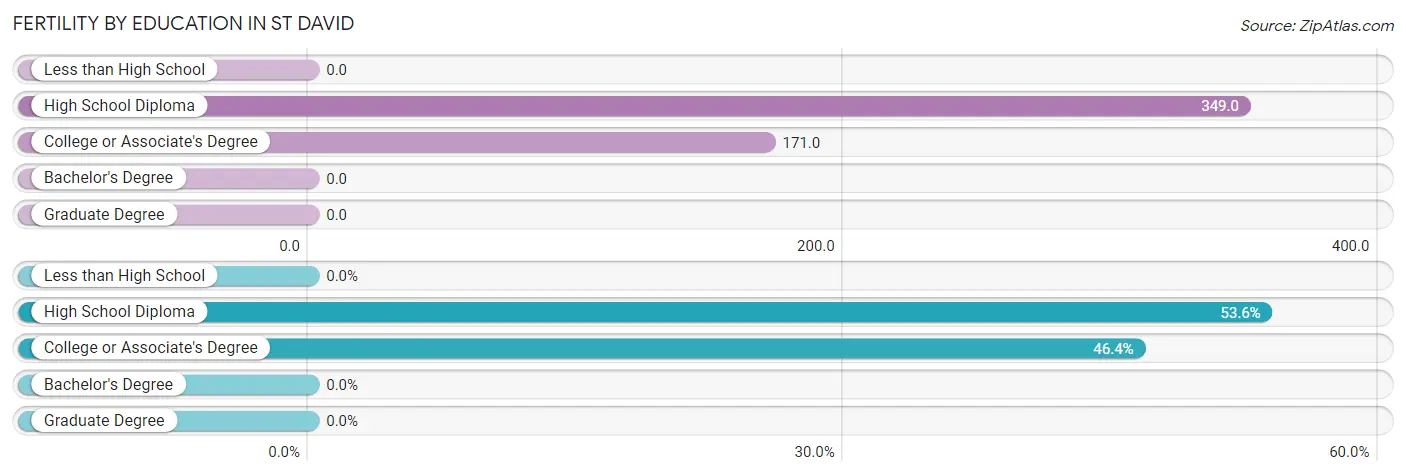
| Educational Attainment | Women with Births | Births / 1,000 Women |
| Less than High School | 0 (0.0%) | 0.0 |
| High School Diploma | 30 (53.6%) | 349.0 |
| College or Associate's Degree | 26 (46.4%) | 171.0 |
| Bachelor's Degree | 0 (0.0%) | 0.0 |
| Graduate Degree | 0 (0.0%) | 0.0 |
| Total | 56 (100.0%) | 180.0 |
Fertility by Education by Marriage Status in St David
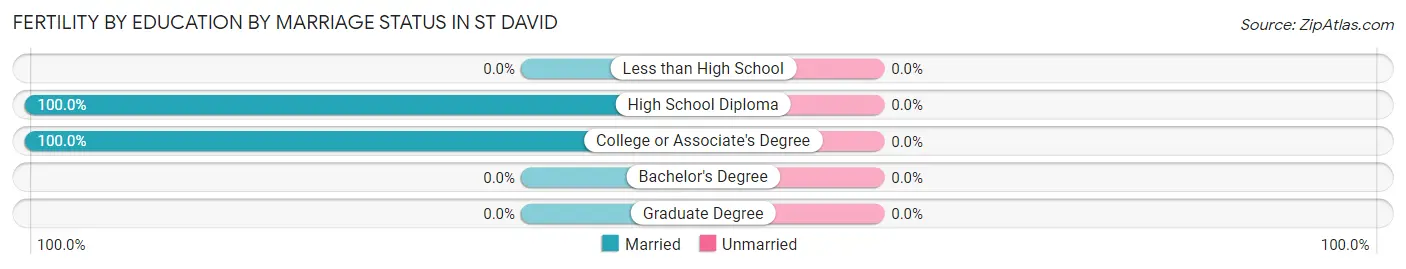
| Educational Attainment | Married | Unmarried |
| Less than High School | 0 (0.0%) | 0 (0.0%) |
| High School Diploma | 30 (100.0%) | 0 (0.0%) |
| College or Associate's Degree | 26 (100.0%) | 0 (0.0%) |
| Bachelor's Degree | 0 (0.0%) | 0 (0.0%) |
| Graduate Degree | 0 (0.0%) | 0 (0.0%) |
| Total | 56 (100.0%) | 0 (0.0%) |
Income in St David
Income Overview in St David
Per Capita Income in St David is $24,560, while median incomes of families and households are $53,176 and $51,705 respectively.
| Characteristic | Number | Measure |
| Per Capita Income | 1,300 | $24,560 |
| Median Family Income | 276 | $53,176 |
| Mean Family Income | 276 | $74,215 |
| Median Household Income | 508 | $51,705 |
| Mean Household Income | 508 | $58,763 |
| Income Deficit | 276 | $0 |
| Wage / Income Gap (%) | 1,300 | 0.00% |
| Wage / Income Gap ($) | 1,300 | 100.00¢ per $1 |
| Gini / Inequality Index | 1,300 | 0.45 |
Earnings by Sex in St David
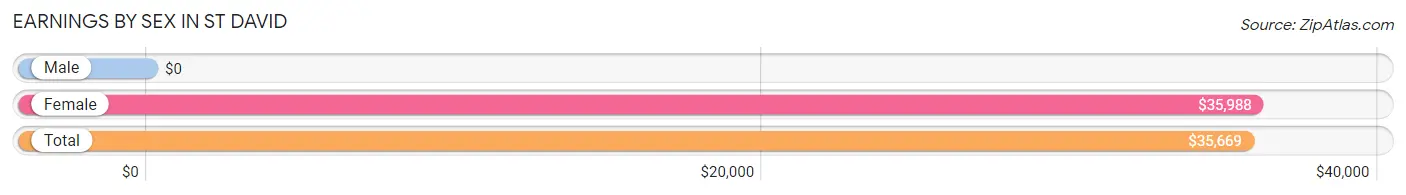
| Sex | Number | Average Earnings |
| Male | 287 (51.3%) | $0 |
| Female | 272 (48.7%) | $35,988 |
| Total | 559 (100.0%) | $35,669 |
Earnings by Sex by Income Bracket in St David
The most common earnings brackets in St David are $25,000 to $29,999 for men (45 | 15.7%) and $50,000 to $54,999 for women (59 | 21.7%).
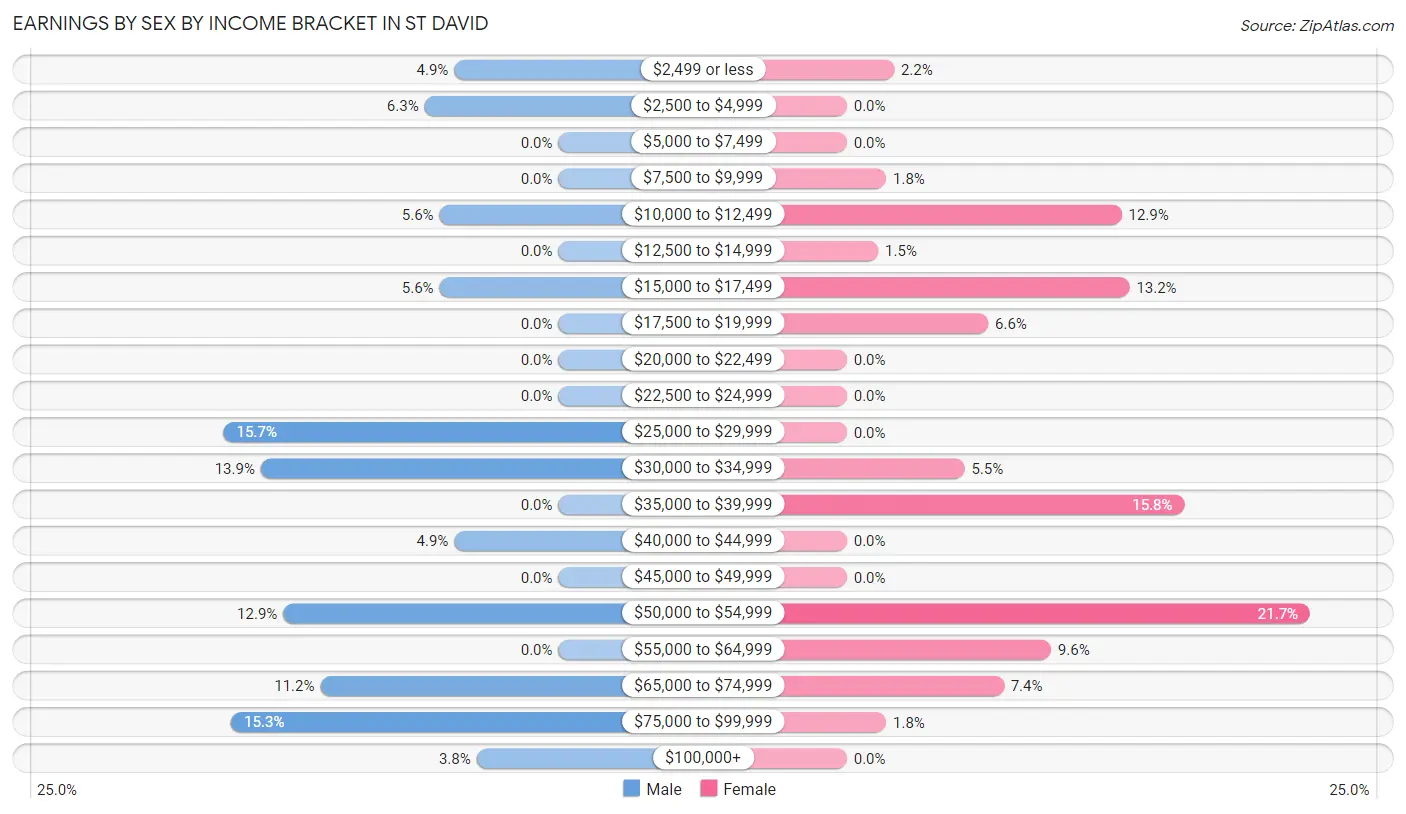
| Income | Male | Female |
| $2,499 or less | 14 (4.9%) | 6 (2.2%) |
| $2,500 to $4,999 | 18 (6.3%) | 0 (0.0%) |
| $5,000 to $7,499 | 0 (0.0%) | 0 (0.0%) |
| $7,500 to $9,999 | 0 (0.0%) | 5 (1.8%) |
| $10,000 to $12,499 | 16 (5.6%) | 35 (12.9%) |
| $12,500 to $14,999 | 0 (0.0%) | 4 (1.5%) |
| $15,000 to $17,499 | 16 (5.6%) | 36 (13.2%) |
| $17,500 to $19,999 | 0 (0.0%) | 18 (6.6%) |
| $20,000 to $22,499 | 0 (0.0%) | 0 (0.0%) |
| $22,500 to $24,999 | 0 (0.0%) | 0 (0.0%) |
| $25,000 to $29,999 | 45 (15.7%) | 0 (0.0%) |
| $30,000 to $34,999 | 40 (13.9%) | 15 (5.5%) |
| $35,000 to $39,999 | 0 (0.0%) | 43 (15.8%) |
| $40,000 to $44,999 | 14 (4.9%) | 0 (0.0%) |
| $45,000 to $49,999 | 0 (0.0%) | 0 (0.0%) |
| $50,000 to $54,999 | 37 (12.9%) | 59 (21.7%) |
| $55,000 to $64,999 | 0 (0.0%) | 26 (9.6%) |
| $65,000 to $74,999 | 32 (11.2%) | 20 (7.3%) |
| $75,000 to $99,999 | 44 (15.3%) | 5 (1.8%) |
| $100,000+ | 11 (3.8%) | 0 (0.0%) |
| Total | 287 (100.0%) | 272 (100.0%) |
Earnings by Sex by Educational Attainment in St David
Average earnings in St David are $40,446 for men and $37,035 for women, a difference of 8.4%. Men with an educational attainment of college or associate's degree enjoy the highest average annual earnings of $53,345, while those with college or associate's degree education earn the least with $53,345. Women with an educational attainment of bachelor's degree earn the most with the average annual earnings of $50,536, while those with college or associate's degree education have the smallest earnings of $37,006.
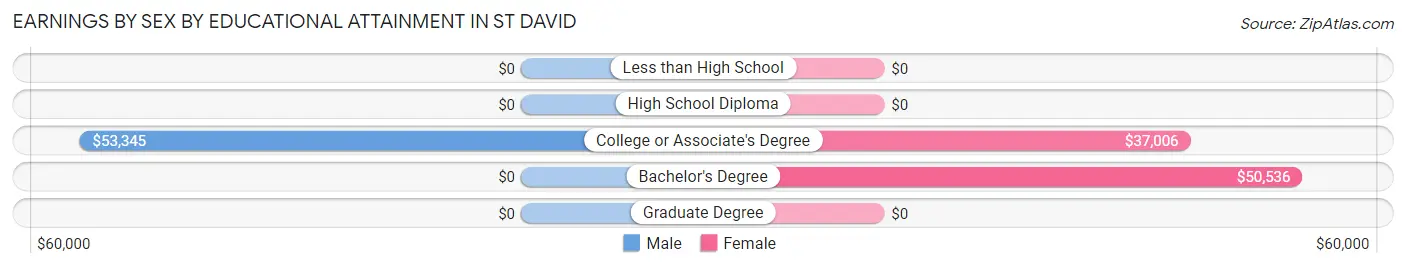
| Educational Attainment | Male Income | Female Income |
| Less than High School | - | - |
| High School Diploma | - | - |
| College or Associate's Degree | $53,345 | $37,006 |
| Bachelor's Degree | - | - |
| Graduate Degree | - | - |
| Total | $40,446 | $37,035 |
Family Income in St David
Family Income Brackets in St David
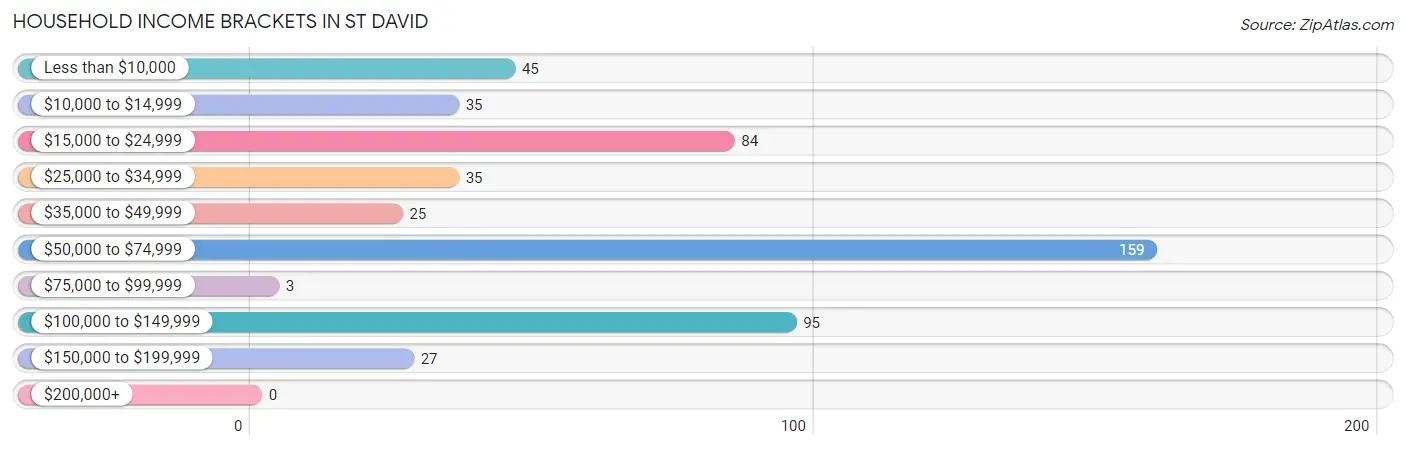
According to the St David family income data, there are 72 families falling into the $100,000 to $149,999 income range, which is the most common income bracket and makes up 26.1% of all families.
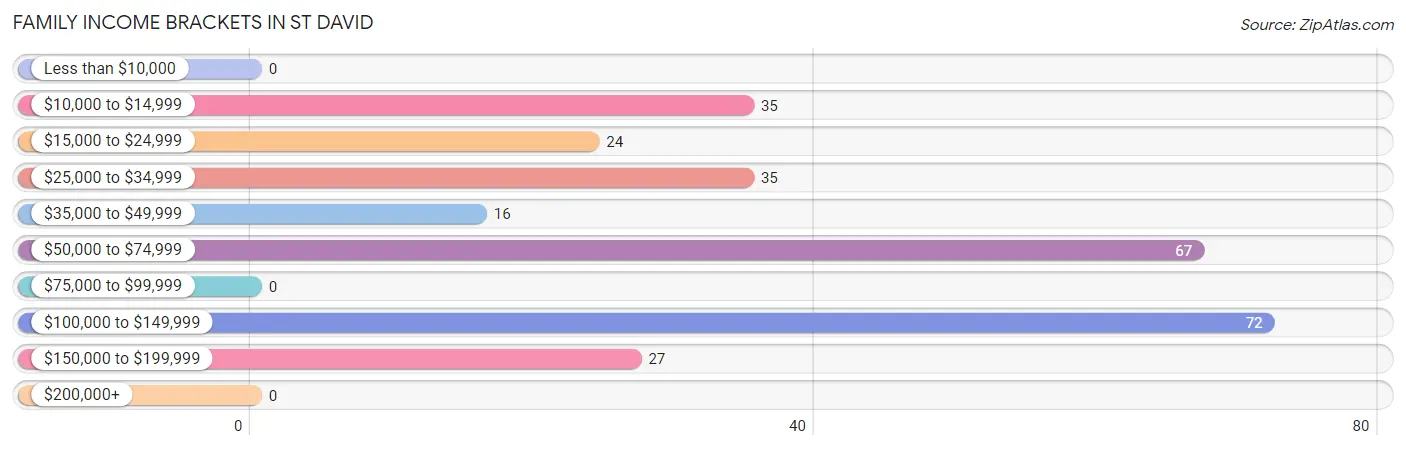
| Income Bracket | # Families | % Families |
| Less than $10,000 | 0 | 0.0% |
| $10,000 to $14,999 | 35 | 12.7% |
| $15,000 to $24,999 | 24 | 8.7% |
| $25,000 to $34,999 | 35 | 12.7% |
| $35,000 to $49,999 | 16 | 5.8% |
| $50,000 to $74,999 | 67 | 24.3% |
| $75,000 to $99,999 | 0 | 0.0% |
| $100,000 to $149,999 | 72 | 26.1% |
| $150,000 to $199,999 | 27 | 9.8% |
| $200,000+ | 0 | 0.0% |
Family Income by Famaliy Size in St David
2-person families (171 | 62.0%) account for the highest median family income in St David with $52,872 per family, while 2-person families (171 | 62.0%) have the highest median income of $26,436 per family member.
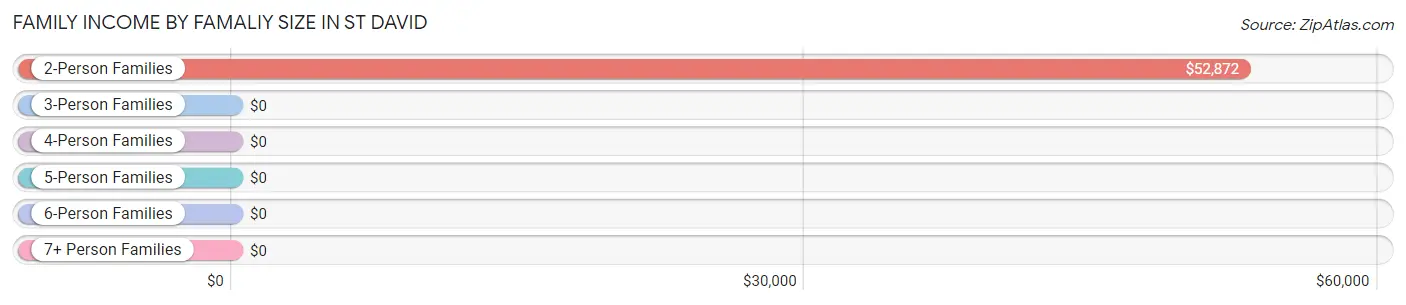
| Income Bracket | # Families | Median Income |
| 2-Person Families | 171 (62.0%) | $52,872 |
| 3-Person Families | 0 (0.0%) | $0 |
| 4-Person Families | 30 (10.9%) | $0 |
| 5-Person Families | 16 (5.8%) | $0 |
| 6-Person Families | 41 (14.9%) | $0 |
| 7+ Person Families | 18 (6.5%) | $0 |
| Total | 276 (100.0%) | $53,176 |
Family Income by Number of Earners in St David
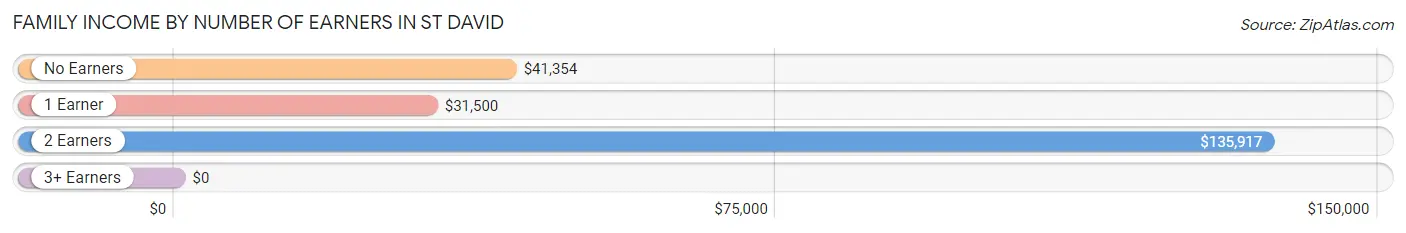
| Number of Earners | # Families | Median Income |
| No Earners | 35 (12.7%) | $41,354 |
| 1 Earner | 142 (51.4%) | $31,500 |
| 2 Earners | 73 (26.5%) | $135,917 |
| 3+ Earners | 26 (9.4%) | $0 |
| Total | 276 (100.0%) | $53,176 |
Household Income in St David
Household Income Brackets in St David
With 159 households falling in the category, the $50,000 to $74,999 income range is the most frequent in St David, accounting for 31.3% of all households.
| Income Bracket | # Households | % Households |
| Less than $10,000 | 45 | 8.9% |
| $10,000 to $14,999 | 35 | 6.9% |
| $15,000 to $24,999 | 84 | 16.5% |
| $25,000 to $34,999 | 35 | 6.9% |
| $35,000 to $49,999 | 25 | 4.9% |
| $50,000 to $74,999 | 159 | 31.3% |
| $75,000 to $99,999 | 3 | 0.6% |
| $100,000 to $149,999 | 95 | 18.7% |
| $150,000 to $199,999 | 27 | 5.3% |
| $200,000+ | 0 | 0.0% |
Household Income by Householder Age in St David
The median household income in St David is $51,705, with the highest median household income of $54,201 found in the 45 to 64 years age bracket for the primary householder. A total of 147 households (28.9%) fall into this category.
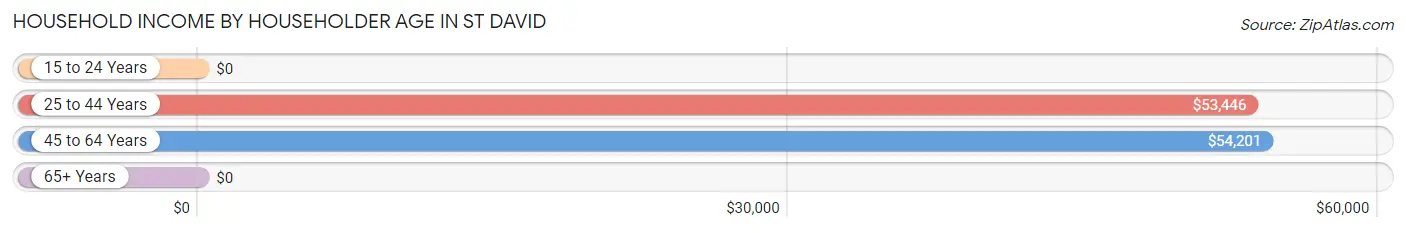
| Income Bracket | # Households | Median Income |
| 15 to 24 Years | 0 (0.0%) | $0 |
| 25 to 44 Years | 194 (38.2%) | $53,446 |
| 45 to 64 Years | 147 (28.9%) | $54,201 |
| 65+ Years | 167 (32.9%) | $0 |
| Total | 508 (100.0%) | $51,705 |
Poverty in St David
Income Below Poverty by Sex and Age in St David
With 9.2% poverty level for males and 9.4% for females among the residents of St David, 6 to 11 year old males and 75 year old and over females are the most vulnerable to poverty, with 41 males (39.4%) and 23 females (46.9%) in their respective age groups living below the poverty level.
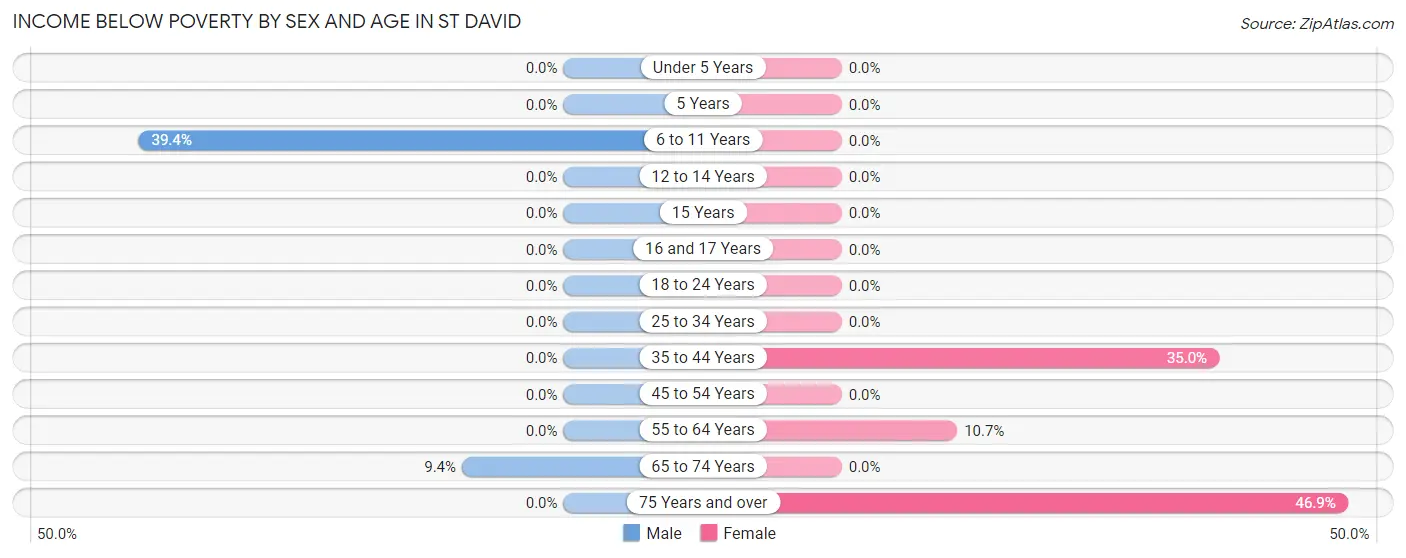
| Age Bracket | Male | Female |
| Under 5 Years | 0 (0.0%) | 0 (0.0%) |
| 5 Years | 0 (0.0%) | 0 (0.0%) |
| 6 to 11 Years | 41 (39.4%) | 0 (0.0%) |
| 12 to 14 Years | 0 (0.0%) | 0 (0.0%) |
| 15 Years | 0 (0.0%) | 0 (0.0%) |
| 16 and 17 Years | 0 (0.0%) | 0 (0.0%) |
| 18 to 24 Years | 0 (0.0%) | 0 (0.0%) |
| 25 to 34 Years | 0 (0.0%) | 0 (0.0%) |
| 35 to 44 Years | 0 (0.0%) | 35 (35.0%) |
| 45 to 54 Years | 0 (0.0%) | 0 (0.0%) |
| 55 to 64 Years | 0 (0.0%) | 9 (10.7%) |
| 65 to 74 Years | 13 (9.4%) | 0 (0.0%) |
| 75 Years and over | 0 (0.0%) | 23 (46.9%) |
| Total | 54 (9.2%) | 67 (9.4%) |
Income Above Poverty by Sex and Age in St David
According to the poverty statistics in St David, males aged under 5 years and females aged under 5 years are the age groups that are most secure financially, with 100.0% of males and 100.0% of females in these age groups living above the poverty line.
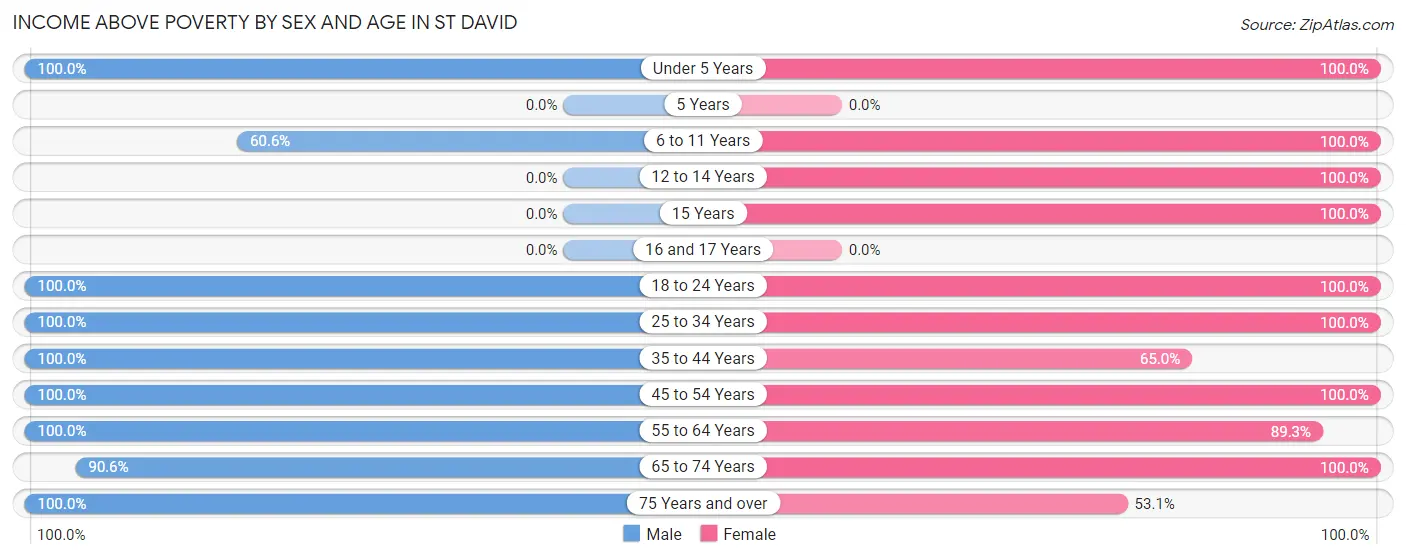
| Age Bracket | Male | Female |
| Under 5 Years | 45 (100.0%) | 117 (100.0%) |
| 5 Years | 0 (0.0%) | 0 (0.0%) |
| 6 to 11 Years | 63 (60.6%) | 40 (100.0%) |
| 12 to 14 Years | 0 (0.0%) | 43 (100.0%) |
| 15 Years | 0 (0.0%) | 27 (100.0%) |
| 16 and 17 Years | 0 (0.0%) | 0 (0.0%) |
| 18 to 24 Years | 16 (100.0%) | 36 (100.0%) |
| 25 to 34 Years | 106 (100.0%) | 112 (100.0%) |
| 35 to 44 Years | 69 (100.0%) | 65 (65.0%) |
| 45 to 54 Years | 43 (100.0%) | 53 (100.0%) |
| 55 to 64 Years | 33 (100.0%) | 75 (89.3%) |
| 65 to 74 Years | 125 (90.6%) | 54 (100.0%) |
| 75 Years and over | 31 (100.0%) | 26 (53.1%) |
| Total | 531 (90.8%) | 648 (90.6%) |
Income Below Poverty Among Married-Couple Families in St David
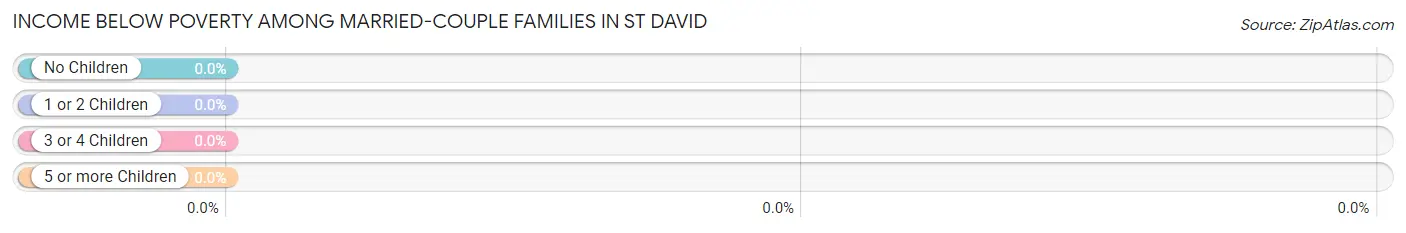
| Children | Above Poverty | Below Poverty |
| No Children | 91 (100.0%) | 0 (0.0%) |
| 1 or 2 Children | 61 (100.0%) | 0 (0.0%) |
| 3 or 4 Children | 26 (100.0%) | 0 (0.0%) |
| 5 or more Children | 18 (100.0%) | 0 (0.0%) |
| Total | 196 (100.0%) | 0 (0.0%) |
Income Below Poverty Among Single-Parent Households in St David
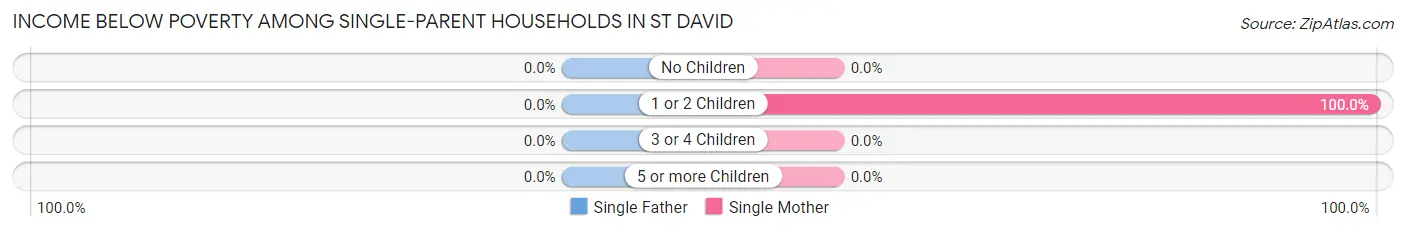
| Children | Single Father | Single Mother |
| No Children | 0 (0.0%) | 0 (0.0%) |
| 1 or 2 Children | 0 (0.0%) | 35 (100.0%) |
| 3 or 4 Children | 0 (0.0%) | 0 (0.0%) |
| 5 or more Children | 0 (0.0%) | 0 (0.0%) |
| Total | 0 (0.0%) | 35 (43.8%) |
Income Below Poverty Among Married-Couple vs Single-Parent Households in St David
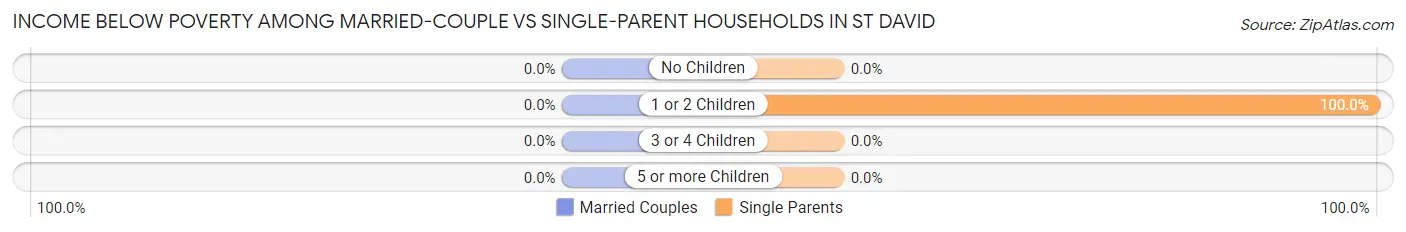
| Children | Married-Couple Families | Single-Parent Households |
| No Children | 0 (0.0%) | 0 (0.0%) |
| 1 or 2 Children | 0 (0.0%) | 35 (100.0%) |
| 3 or 4 Children | 0 (0.0%) | 0 (0.0%) |
| 5 or more Children | 0 (0.0%) | 0 (0.0%) |
| Total | 0 (0.0%) | 35 (43.8%) |
Employment Characteristics in St David
Employment by Class of Employer in St David
Among the 476 employed individuals in St David, private company employees (313 | 65.8%), local government employees (96 | 20.2%), and not-for-profit organizations (44 | 9.2%) make up the most common classes of employment.
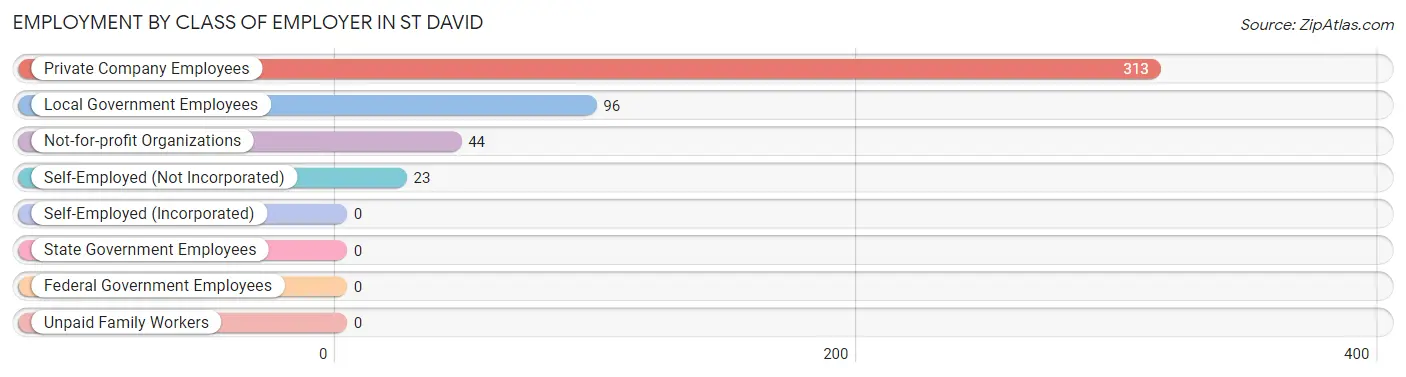
| Employer Class | # Employees | % Employees |
| Private Company Employees | 313 | 65.8% |
| Self-Employed (Incorporated) | 0 | 0.0% |
| Self-Employed (Not Incorporated) | 23 | 4.8% |
| Not-for-profit Organizations | 44 | 9.2% |
| Local Government Employees | 96 | 20.2% |
| State Government Employees | 0 | 0.0% |
| Federal Government Employees | 0 | 0.0% |
| Unpaid Family Workers | 0 | 0.0% |
| Total | 476 | 100.0% |
Employment Status by Age in St David
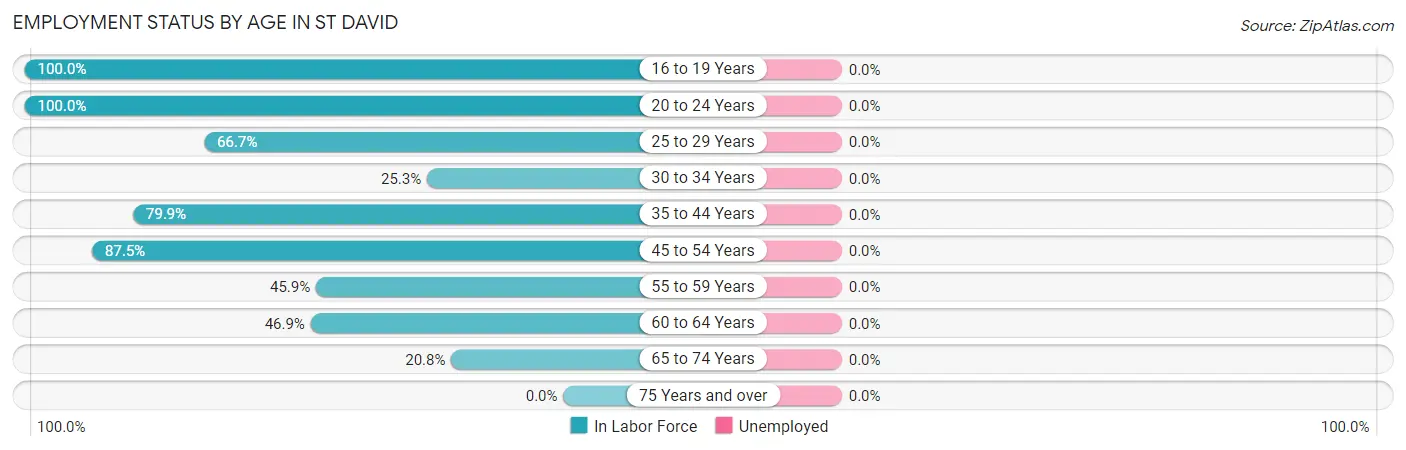
| Age Bracket | In Labor Force | Unemployed |
| 16 to 19 Years | 36 (100.0%) | 0 (0.0%) |
| 20 to 24 Years | 16 (100.0%) | 0 (0.0%) |
| 25 to 29 Years | 90 (66.7%) | 0 (0.0%) |
| 30 to 34 Years | 21 (25.3%) | 0 (0.0%) |
| 35 to 44 Years | 135 (79.9%) | 0 (0.0%) |
| 45 to 54 Years | 84 (87.5%) | 0 (0.0%) |
| 55 to 59 Years | 39 (45.9%) | 0 (0.0%) |
| 60 to 64 Years | 15 (46.9%) | 0 (0.0%) |
| 65 to 74 Years | 40 (20.8%) | 0 (0.0%) |
| 75 Years and over | 0 (0.0%) | 0 (0.0%) |
| Total | 476 (51.5%) | 0 (0.0%) |
Employment Status by Educational Attainment in St David
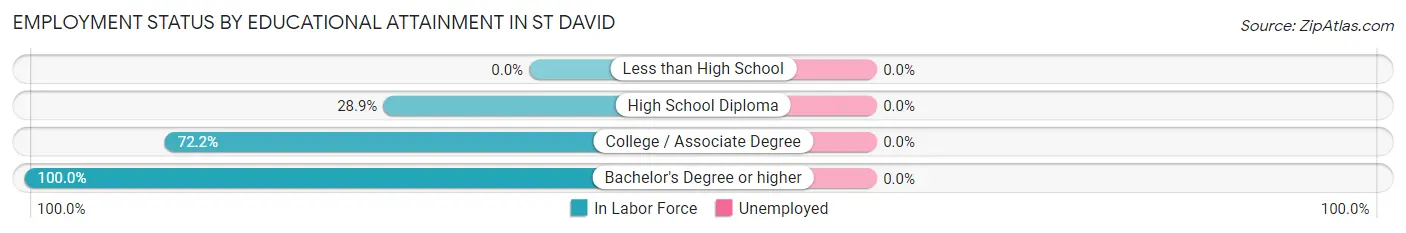
| Educational Attainment | In Labor Force | Unemployed |
| Less than High School | 0 (0.0%) | 0 (0.0%) |
| High School Diploma | 41 (28.9%) | 0 (0.0%) |
| College / Associate Degree | 268 (72.2%) | 0 (0.0%) |
| Bachelor's Degree or higher | 75 (100.0%) | 0 (0.0%) |
| Total | 384 (64.0%) | 0 (0.0%) |
Employment Occupations by Sex in St David
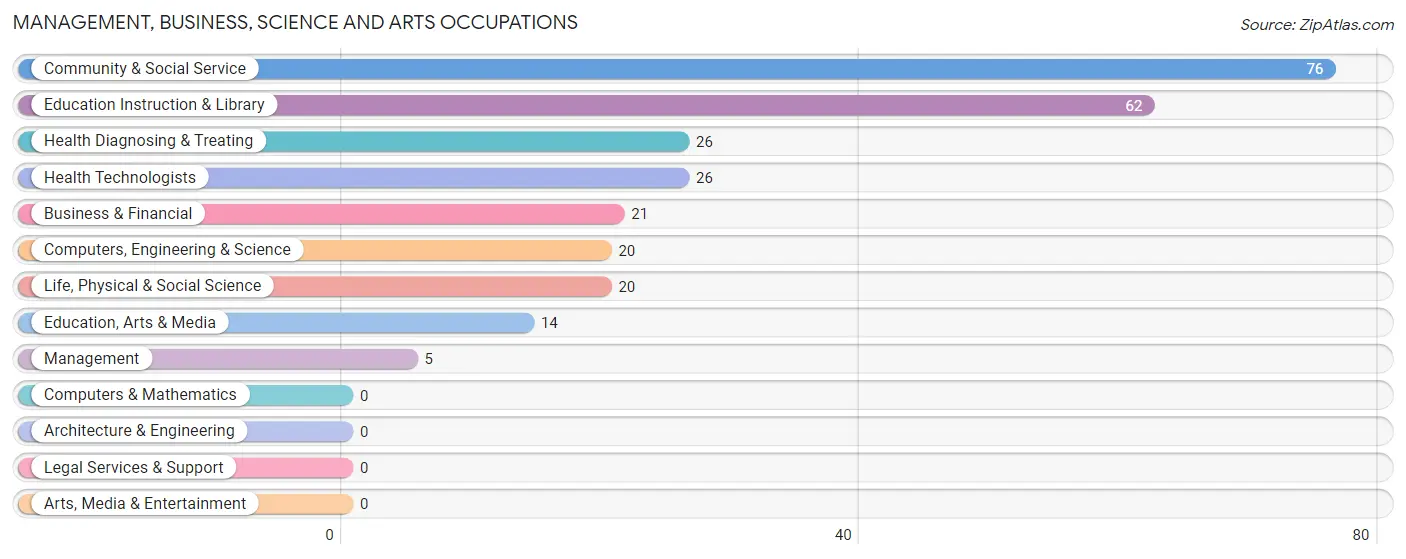
Management, Business, Science and Arts Occupations
The most common Management, Business, Science and Arts occupations in St David are Community & Social Service (76 | 16.0%), Education Instruction & Library (62 | 13.0%), Health Diagnosing & Treating (26 | 5.5%), Health Technologists (26 | 5.5%), and Business & Financial (21 | 4.4%).
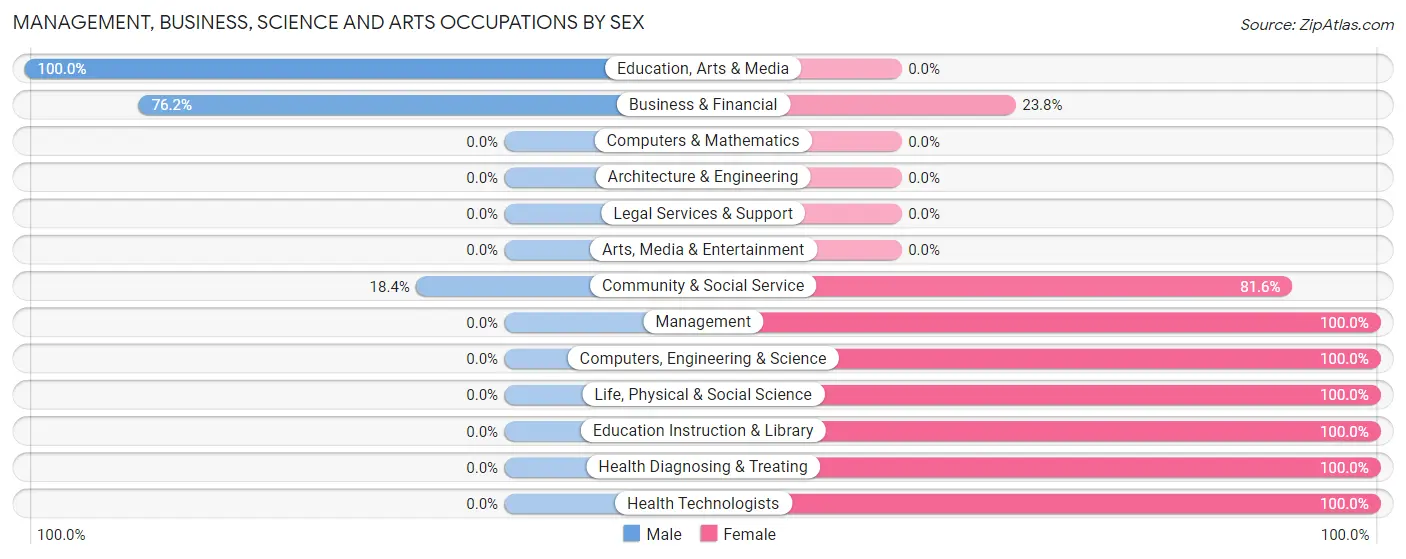
Management, Business, Science and Arts Occupations by Sex
Within the Management, Business, Science and Arts occupations in St David, the most male-oriented occupations are Education, Arts & Media (100.0%), Business & Financial (76.2%), and Community & Social Service (18.4%), while the most female-oriented occupations are Management (100.0%), Computers, Engineering & Science (100.0%), and Life, Physical & Social Science (100.0%).
| Occupation | Male | Female |
| Management | 0 (0.0%) | 5 (100.0%) |
| Business & Financial | 16 (76.2%) | 5 (23.8%) |
| Computers, Engineering & Science | 0 (0.0%) | 20 (100.0%) |
| Computers & Mathematics | 0 (0.0%) | 0 (0.0%) |
| Architecture & Engineering | 0 (0.0%) | 0 (0.0%) |
| Life, Physical & Social Science | 0 (0.0%) | 20 (100.0%) |
| Community & Social Service | 14 (18.4%) | 62 (81.6%) |
| Education, Arts & Media | 14 (100.0%) | 0 (0.0%) |
| Legal Services & Support | 0 (0.0%) | 0 (0.0%) |
| Education Instruction & Library | 0 (0.0%) | 62 (100.0%) |
| Arts, Media & Entertainment | 0 (0.0%) | 0 (0.0%) |
| Health Diagnosing & Treating | 0 (0.0%) | 26 (100.0%) |
| Health Technologists | 0 (0.0%) | 26 (100.0%) |
| Total (Category) | 30 (20.3%) | 118 (79.7%) |
| Total (Overall) | 210 (44.1%) | 266 (55.9%) |
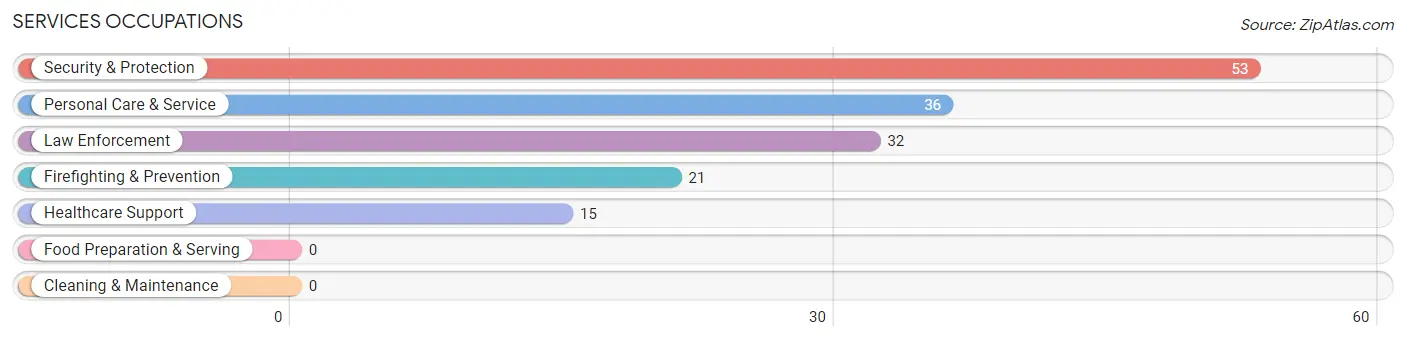
Services Occupations
The most common Services occupations in St David are Security & Protection (53 | 11.1%), Personal Care & Service (36 | 7.6%), Law Enforcement (32 | 6.7%), Firefighting & Prevention (21 | 4.4%), and Healthcare Support (15 | 3.2%).
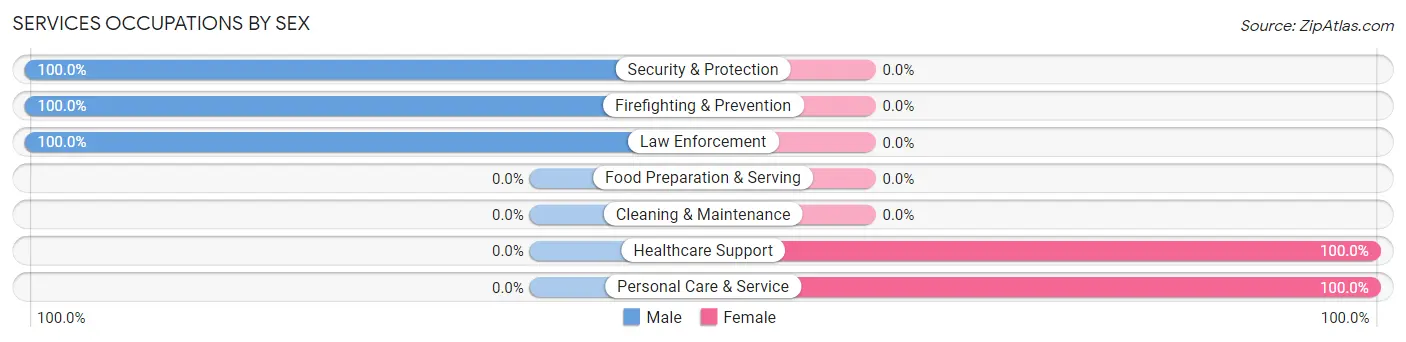
Services Occupations by Sex
Within the Services occupations in St David, the most male-oriented occupations are Security & Protection (100.0%), Firefighting & Prevention (100.0%), and Law Enforcement (100.0%), while the most female-oriented occupations are Healthcare Support (100.0%), and Personal Care & Service (100.0%).
| Occupation | Male | Female |
| Healthcare Support | 0 (0.0%) | 15 (100.0%) |
| Security & Protection | 53 (100.0%) | 0 (0.0%) |
| Firefighting & Prevention | 21 (100.0%) | 0 (0.0%) |
| Law Enforcement | 32 (100.0%) | 0 (0.0%) |
| Food Preparation & Serving | 0 (0.0%) | 0 (0.0%) |
| Cleaning & Maintenance | 0 (0.0%) | 0 (0.0%) |
| Personal Care & Service | 0 (0.0%) | 36 (100.0%) |
| Total (Category) | 53 (51.0%) | 51 (49.0%) |
| Total (Overall) | 210 (44.1%) | 266 (55.9%) |
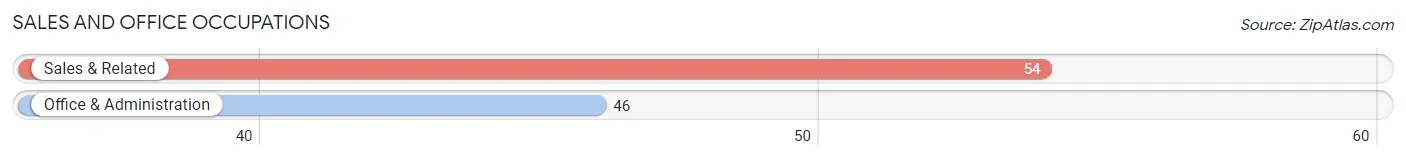
Sales and Office Occupations
The most common Sales and Office occupations in St David are Sales & Related (54 | 11.3%), and Office & Administration (46 | 9.7%).
Sales and Office Occupations by Sex
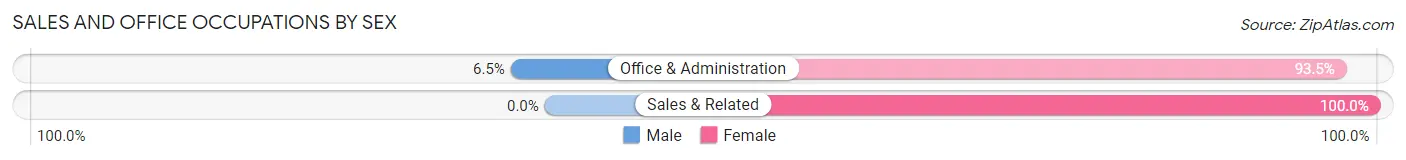
| Occupation | Male | Female |
| Sales & Related | 0 (0.0%) | 54 (100.0%) |
| Office & Administration | 3 (6.5%) | 43 (93.5%) |
| Total (Category) | 3 (3.0%) | 97 (97.0%) |
| Total (Overall) | 210 (44.1%) | 266 (55.9%) |
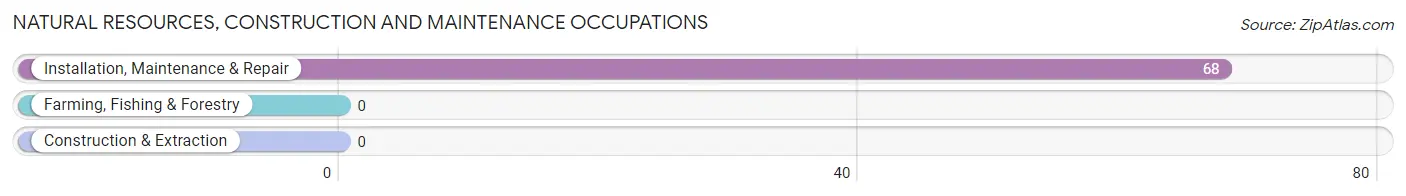
Natural Resources, Construction and Maintenance Occupations
The most common Natural Resources, Construction and Maintenance occupations in St David are , and Installation, Maintenance & Repair (68 | 14.3%).
Natural Resources, Construction and Maintenance Occupations by Sex
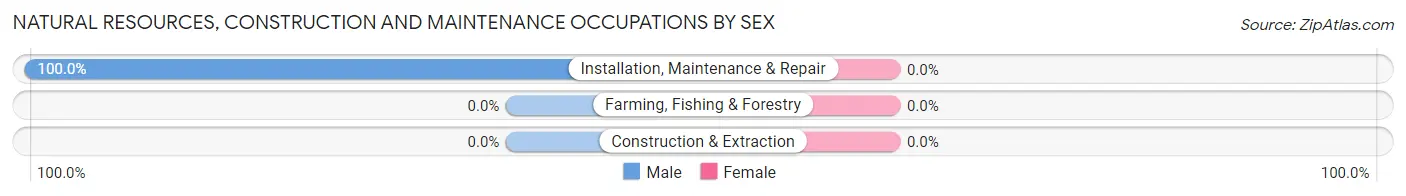
| Occupation | Male | Female |
| Farming, Fishing & Forestry | 0 (0.0%) | 0 (0.0%) |
| Construction & Extraction | 0 (0.0%) | 0 (0.0%) |
| Installation, Maintenance & Repair | 68 (100.0%) | 0 (0.0%) |
| Total (Category) | 68 (100.0%) | 0 (0.0%) |
| Total (Overall) | 210 (44.1%) | 266 (55.9%) |
Production, Transportation and Moving Occupations
The most common Production, Transportation and Moving occupations in St David are Transportation (40 | 8.4%), and Production (16 | 3.4%).
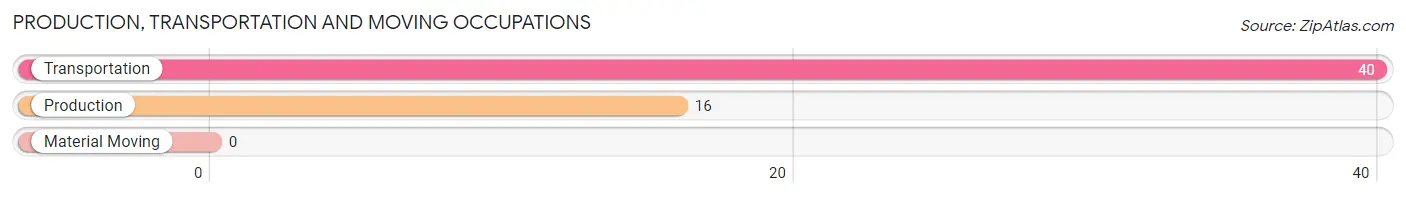
Production, Transportation and Moving Occupations by Sex
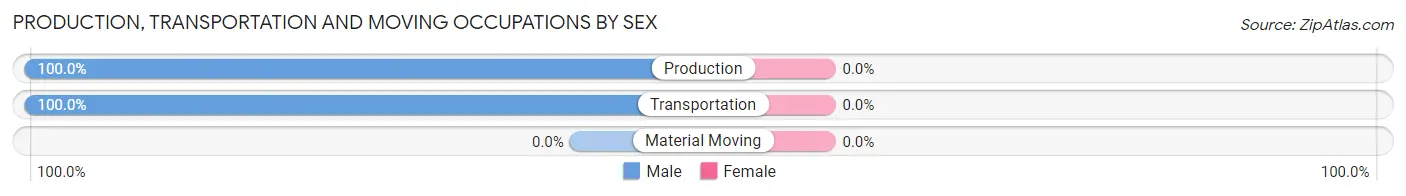
| Occupation | Male | Female |
| Production | 16 (100.0%) | 0 (0.0%) |
| Transportation | 40 (100.0%) | 0 (0.0%) |
| Material Moving | 0 (0.0%) | 0 (0.0%) |
| Total (Category) | 56 (100.0%) | 0 (0.0%) |
| Total (Overall) | 210 (44.1%) | 266 (55.9%) |
Employment Industries by Sex in St David
Employment Industries in St David
The major employment industries in St David include Health Care & Social Assistance (69 | 14.5%), Educational Services (62 | 13.0%), Transportation & Warehousing (60 | 12.6%), Public Administration (53 | 11.1%), and Information (37 | 7.8%).
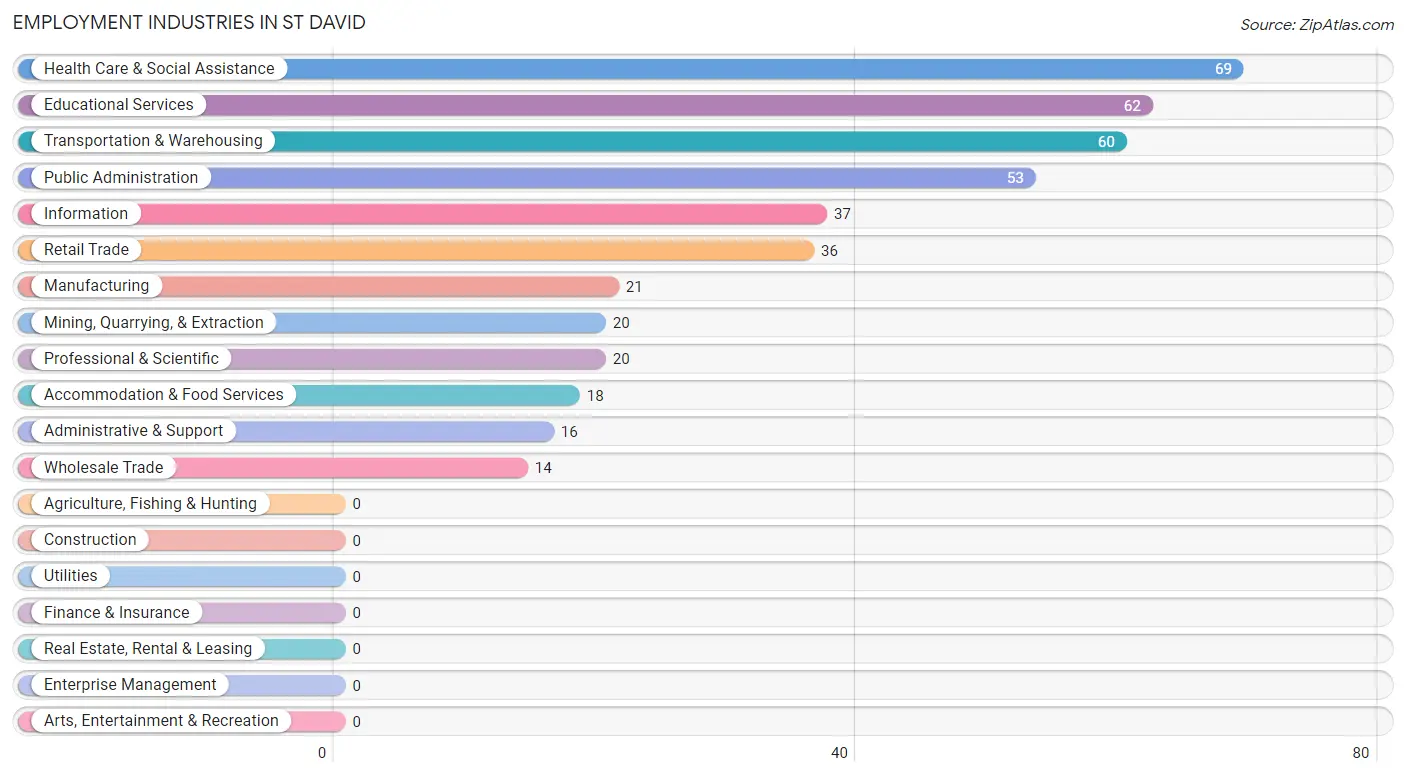
Employment Industries by Sex in St David
The St David industries that see more men than women are Wholesale Trade (100.0%), Transportation & Warehousing (100.0%), and Information (100.0%), whereas the industries that tend to have a higher number of women are Mining, Quarrying, & Extraction (100.0%), Retail Trade (100.0%), and Professional & Scientific (100.0%).
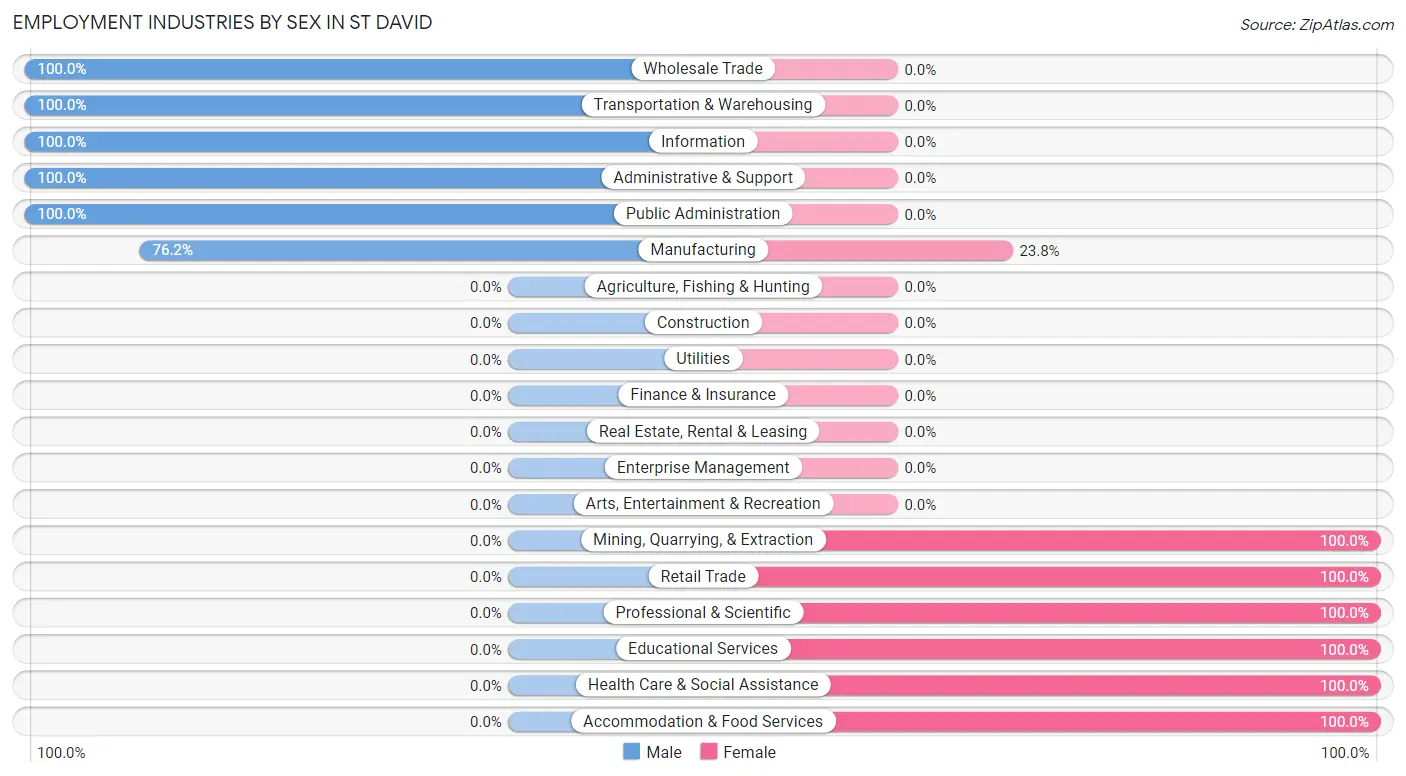
| Industry | Male | Female |
| Agriculture, Fishing & Hunting | 0 (0.0%) | 0 (0.0%) |
| Mining, Quarrying, & Extraction | 0 (0.0%) | 20 (100.0%) |
| Construction | 0 (0.0%) | 0 (0.0%) |
| Manufacturing | 16 (76.2%) | 5 (23.8%) |
| Wholesale Trade | 14 (100.0%) | 0 (0.0%) |
| Retail Trade | 0 (0.0%) | 36 (100.0%) |
| Transportation & Warehousing | 60 (100.0%) | 0 (0.0%) |
| Utilities | 0 (0.0%) | 0 (0.0%) |
| Information | 37 (100.0%) | 0 (0.0%) |
| Finance & Insurance | 0 (0.0%) | 0 (0.0%) |
| Real Estate, Rental & Leasing | 0 (0.0%) | 0 (0.0%) |
| Professional & Scientific | 0 (0.0%) | 20 (100.0%) |
| Enterprise Management | 0 (0.0%) | 0 (0.0%) |
| Administrative & Support | 16 (100.0%) | 0 (0.0%) |
| Educational Services | 0 (0.0%) | 62 (100.0%) |
| Health Care & Social Assistance | 0 (0.0%) | 69 (100.0%) |
| Arts, Entertainment & Recreation | 0 (0.0%) | 0 (0.0%) |
| Accommodation & Food Services | 0 (0.0%) | 18 (100.0%) |
| Public Administration | 53 (100.0%) | 0 (0.0%) |
| Total | 210 (44.1%) | 266 (55.9%) |
Education in St David
School Enrollment in St David
The most common levels of schooling among the 264 students in St David are elementary school (121 | 45.8%), high school (53 | 20.1%), and nursery / preschool (36 | 13.6%).
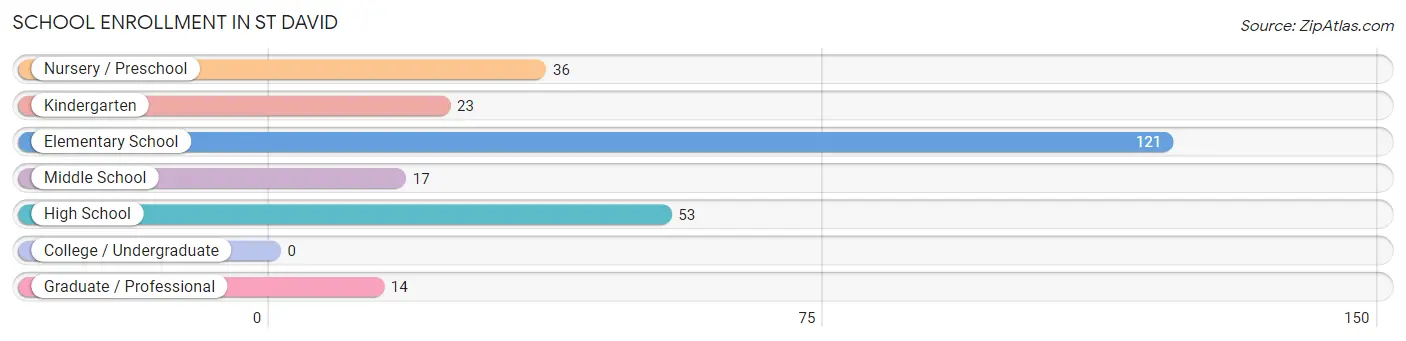
| School Level | # Students | % Students |
| Nursery / Preschool | 36 | 13.6% |
| Kindergarten | 23 | 8.7% |
| Elementary School | 121 | 45.8% |
| Middle School | 17 | 6.4% |
| High School | 53 | 20.1% |
| College / Undergraduate | 0 | 0.0% |
| Graduate / Professional | 14 | 5.3% |
| Total | 264 | 100.0% |
School Enrollment by Age by Funding Source in St David
Out of a total of 264 students who are enrolled in schools in St David, 50 (18.9%) attend a private institution, while the remaining 214 (81.1%) are enrolled in public schools. The age group of 3 to 4 year olds has the highest likelihood of being enrolled in private schools, with 36 (100.0% in the age bracket) enrolled. Conversely, the age group of 5 to 9 year old has the lowest likelihood of being enrolled in a private school, with 144 (100.0% in the age bracket) attending a public institution.
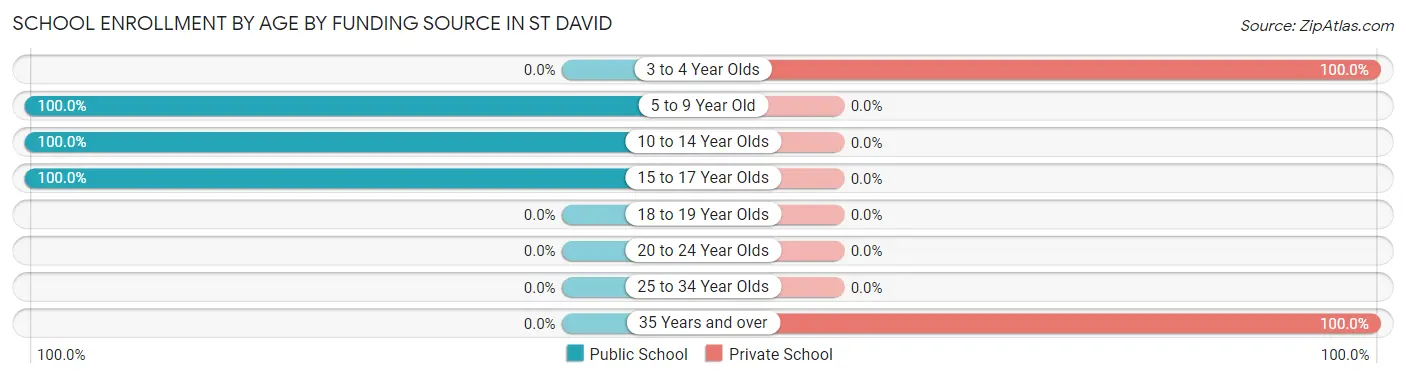
| Age Bracket | Public School | Private School |
| 3 to 4 Year Olds | 0 (0.0%) | 36 (100.0%) |
| 5 to 9 Year Old | 144 (100.0%) | 0 (0.0%) |
| 10 to 14 Year Olds | 43 (100.0%) | 0 (0.0%) |
| 15 to 17 Year Olds | 27 (100.0%) | 0 (0.0%) |
| 18 to 19 Year Olds | 0 (0.0%) | 0 (0.0%) |
| 20 to 24 Year Olds | 0 (0.0%) | 0 (0.0%) |
| 25 to 34 Year Olds | 0 (0.0%) | 0 (0.0%) |
| 35 Years and over | 0 (0.0%) | 14 (100.0%) |
| Total | 214 (81.1%) | 50 (18.9%) |
Educational Attainment by Field of Study in St David
Education (51 | 22.0%), physical & health sciences (50 | 21.5%), business (30 | 12.9%), liberal arts & history (26 | 11.2%), and visual & performing arts (19 | 8.2%) are the most common fields of study among 232 individuals in St David who have obtained a bachelor's degree or higher.
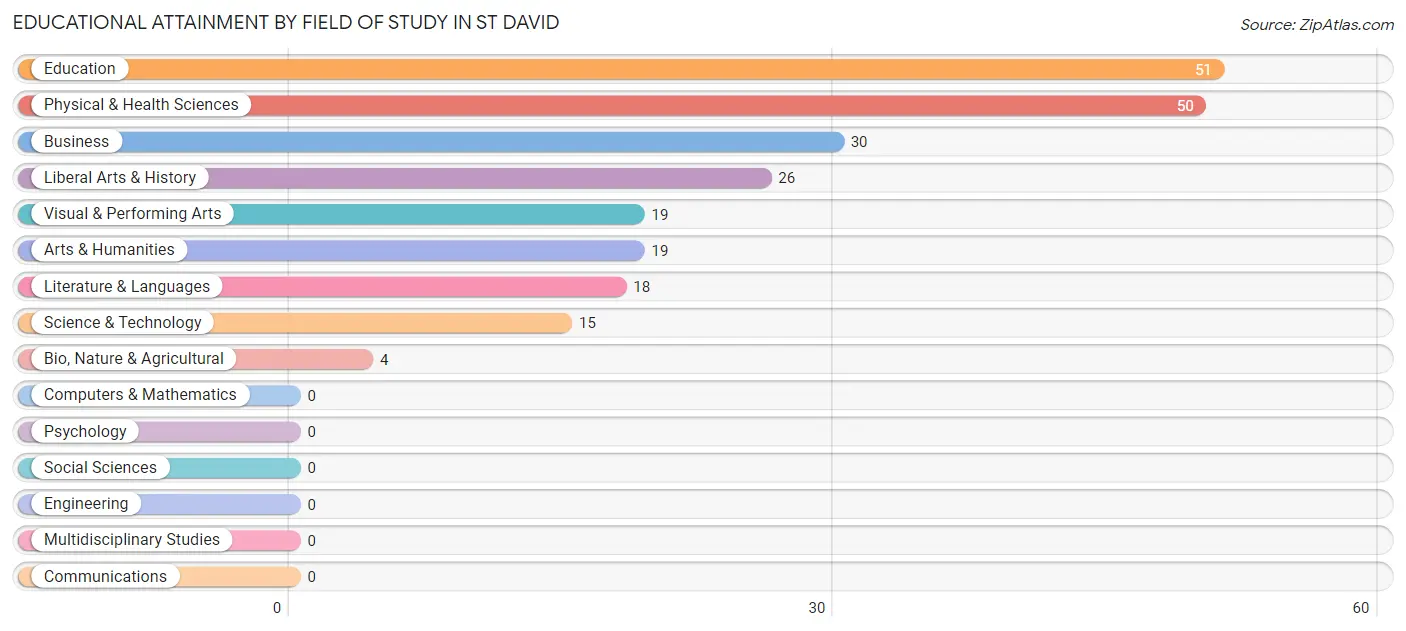
| Field of Study | # Graduates | % Graduates |
| Computers & Mathematics | 0 | 0.0% |
| Bio, Nature & Agricultural | 4 | 1.7% |
| Physical & Health Sciences | 50 | 21.5% |
| Psychology | 0 | 0.0% |
| Social Sciences | 0 | 0.0% |
| Engineering | 0 | 0.0% |
| Multidisciplinary Studies | 0 | 0.0% |
| Science & Technology | 15 | 6.5% |
| Business | 30 | 12.9% |
| Education | 51 | 22.0% |
| Literature & Languages | 18 | 7.8% |
| Liberal Arts & History | 26 | 11.2% |
| Visual & Performing Arts | 19 | 8.2% |
| Communications | 0 | 0.0% |
| Arts & Humanities | 19 | 8.2% |
| Total | 232 | 100.0% |
Transportation & Commute in St David
Vehicle Availability by Sex in St David
The most prevalent vehicle ownership categories in St David are males with 1 vehicle (78, accounting for 37.1%) and females with 1 vehicle (81, making up 29.3%).
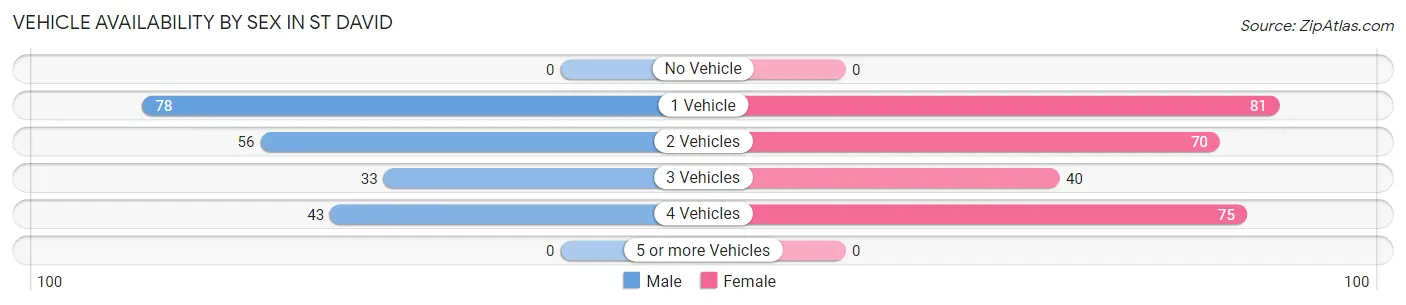
| Vehicles Available | Male | Female |
| No Vehicle | 0 (0.0%) | 0 (0.0%) |
| 1 Vehicle | 78 (37.1%) | 81 (30.4%) |
| 2 Vehicles | 56 (26.7%) | 70 (26.3%) |
| 3 Vehicles | 33 (15.7%) | 40 (15.0%) |
| 4 Vehicles | 43 (20.5%) | 75 (28.2%) |
| 5 or more Vehicles | 0 (0.0%) | 0 (0.0%) |
| Total | 210 (100.0%) | 266 (100.0%) |
Commute Time in St David
The most frequently occuring commute durations in St David are 15 to 19 minutes (132 commuters, 28.8%), 5 to 9 minutes (120 commuters, 26.2%), and 60 to 89 minutes (73 commuters, 15.9%).
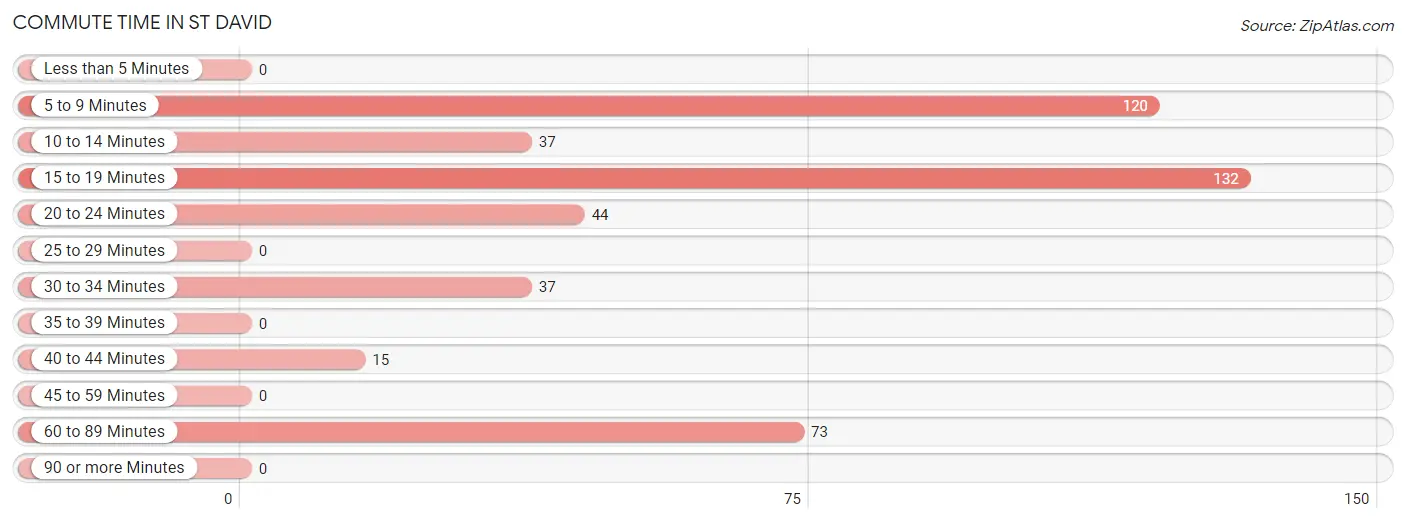
| Commute Time | # Commuters | % Commuters |
| Less than 5 Minutes | 0 | 0.0% |
| 5 to 9 Minutes | 120 | 26.2% |
| 10 to 14 Minutes | 37 | 8.1% |
| 15 to 19 Minutes | 132 | 28.8% |
| 20 to 24 Minutes | 44 | 9.6% |
| 25 to 29 Minutes | 0 | 0.0% |
| 30 to 34 Minutes | 37 | 8.1% |
| 35 to 39 Minutes | 0 | 0.0% |
| 40 to 44 Minutes | 15 | 3.3% |
| 45 to 59 Minutes | 0 | 0.0% |
| 60 to 89 Minutes | 73 | 15.9% |
| 90 or more Minutes | 0 | 0.0% |
Commute Time by Sex in St David
The most common commute times in St David are 15 to 19 minutes (80 commuters, 38.1%) for males and 5 to 9 minutes (72 commuters, 29.0%) for females.
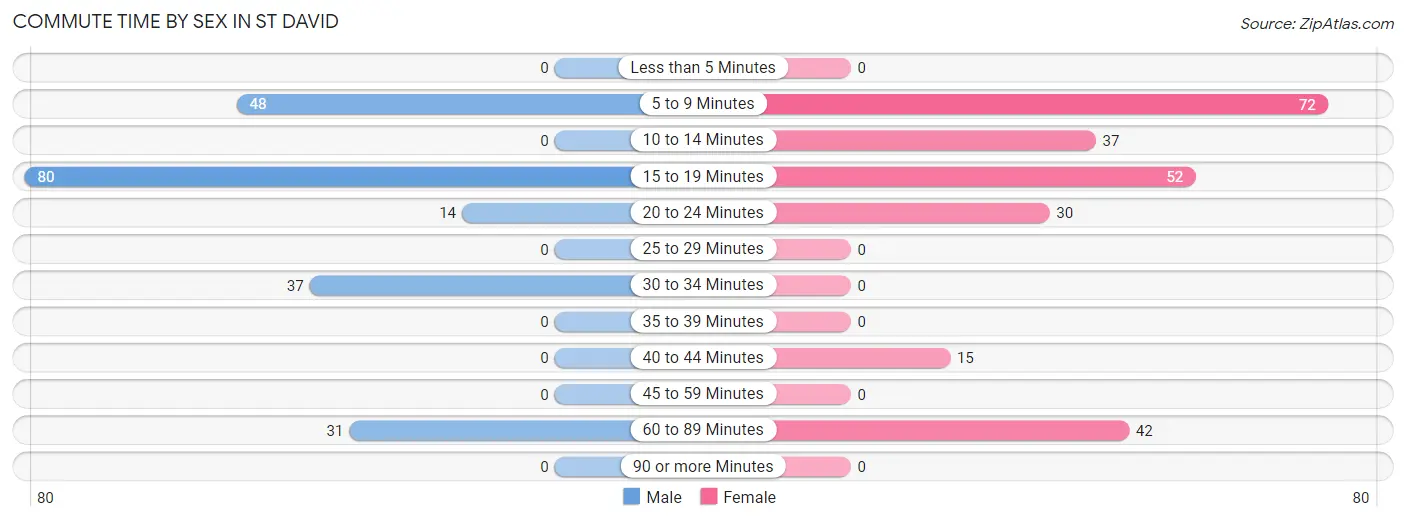
| Commute Time | Male | Female |
| Less than 5 Minutes | 0 (0.0%) | 0 (0.0%) |
| 5 to 9 Minutes | 48 (22.9%) | 72 (29.0%) |
| 10 to 14 Minutes | 0 (0.0%) | 37 (14.9%) |
| 15 to 19 Minutes | 80 (38.1%) | 52 (21.0%) |
| 20 to 24 Minutes | 14 (6.7%) | 30 (12.1%) |
| 25 to 29 Minutes | 0 (0.0%) | 0 (0.0%) |
| 30 to 34 Minutes | 37 (17.6%) | 0 (0.0%) |
| 35 to 39 Minutes | 0 (0.0%) | 0 (0.0%) |
| 40 to 44 Minutes | 0 (0.0%) | 15 (6.0%) |
| 45 to 59 Minutes | 0 (0.0%) | 0 (0.0%) |
| 60 to 89 Minutes | 31 (14.8%) | 42 (16.9%) |
| 90 or more Minutes | 0 (0.0%) | 0 (0.0%) |
Time of Departure to Work by Sex in St David
The most frequent times of departure to work in St David are 10:00 AM to 10:59 AM (40, 19.1%) for males and 7:30 AM to 7:59 AM (85, 34.3%) for females.
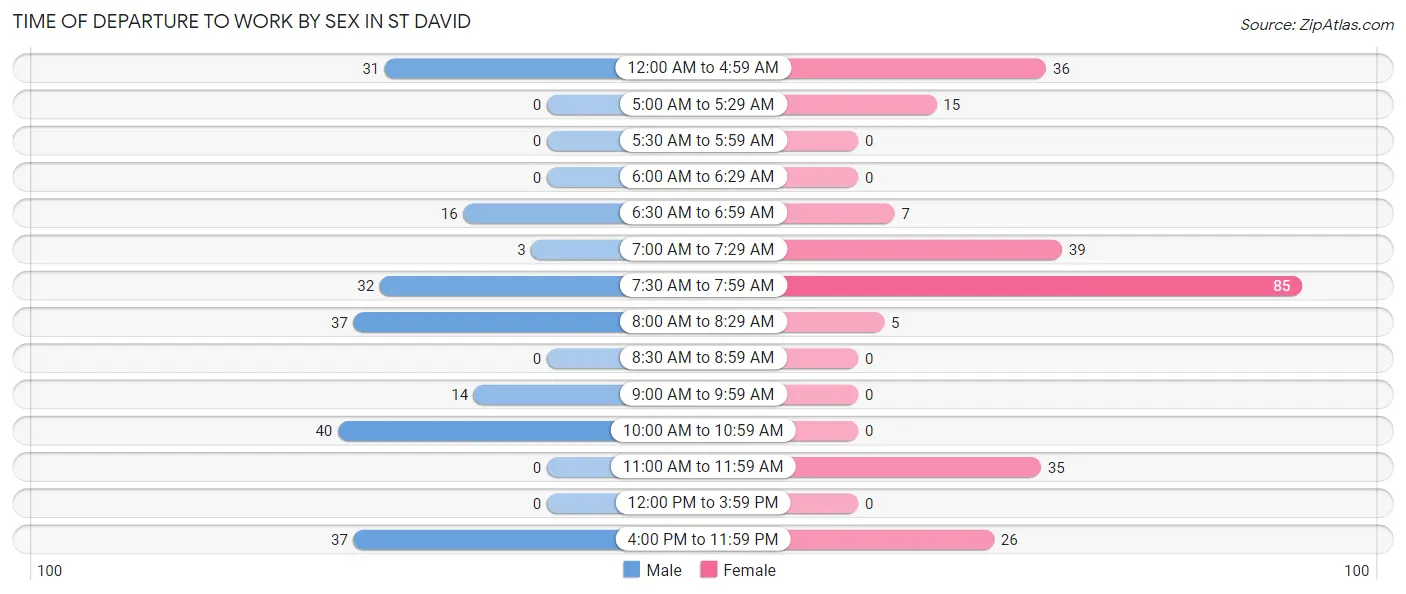
| Time of Departure | Male | Female |
| 12:00 AM to 4:59 AM | 31 (14.8%) | 36 (14.5%) |
| 5:00 AM to 5:29 AM | 0 (0.0%) | 15 (6.0%) |
| 5:30 AM to 5:59 AM | 0 (0.0%) | 0 (0.0%) |
| 6:00 AM to 6:29 AM | 0 (0.0%) | 0 (0.0%) |
| 6:30 AM to 6:59 AM | 16 (7.6%) | 7 (2.8%) |
| 7:00 AM to 7:29 AM | 3 (1.4%) | 39 (15.7%) |
| 7:30 AM to 7:59 AM | 32 (15.2%) | 85 (34.3%) |
| 8:00 AM to 8:29 AM | 37 (17.6%) | 5 (2.0%) |
| 8:30 AM to 8:59 AM | 0 (0.0%) | 0 (0.0%) |
| 9:00 AM to 9:59 AM | 14 (6.7%) | 0 (0.0%) |
| 10:00 AM to 10:59 AM | 40 (19.1%) | 0 (0.0%) |
| 11:00 AM to 11:59 AM | 0 (0.0%) | 35 (14.1%) |
| 12:00 PM to 3:59 PM | 0 (0.0%) | 0 (0.0%) |
| 4:00 PM to 11:59 PM | 37 (17.6%) | 26 (10.5%) |
| Total | 210 (100.0%) | 248 (100.0%) |
Housing Occupancy in St David
Occupancy by Ownership in St David
Of the total 508 dwellings in St David, owner-occupied units account for 350 (68.9%), while renter-occupied units make up 158 (31.1%).
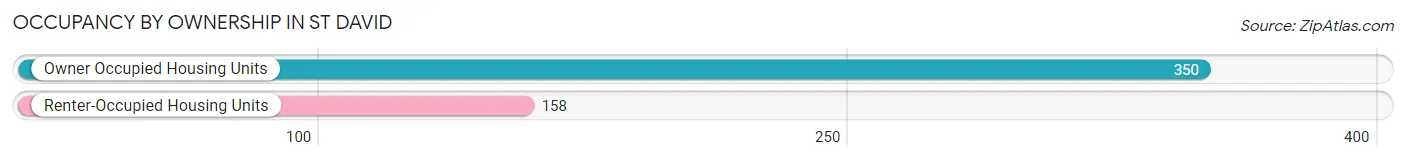
| Occupancy | # Housing Units | % Housing Units |
| Owner Occupied Housing Units | 350 | 68.9% |
| Renter-Occupied Housing Units | 158 | 31.1% |
| Total Occupied Housing Units | 508 | 100.0% |
Occupancy by Household Size in St David
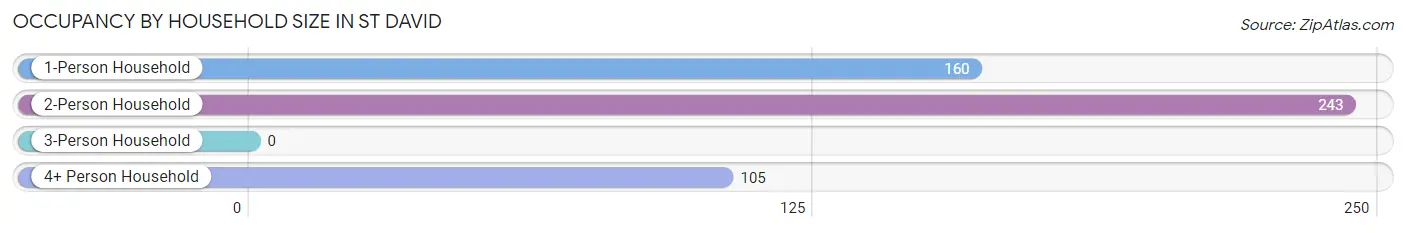
| Household Size | # Housing Units | % Housing Units |
| 1-Person Household | 160 | 31.5% |
| 2-Person Household | 243 | 47.8% |
| 3-Person Household | 0 | 0.0% |
| 4+ Person Household | 105 | 20.7% |
| Total Housing Units | 508 | 100.0% |
Occupancy by Ownership by Household Size in St David
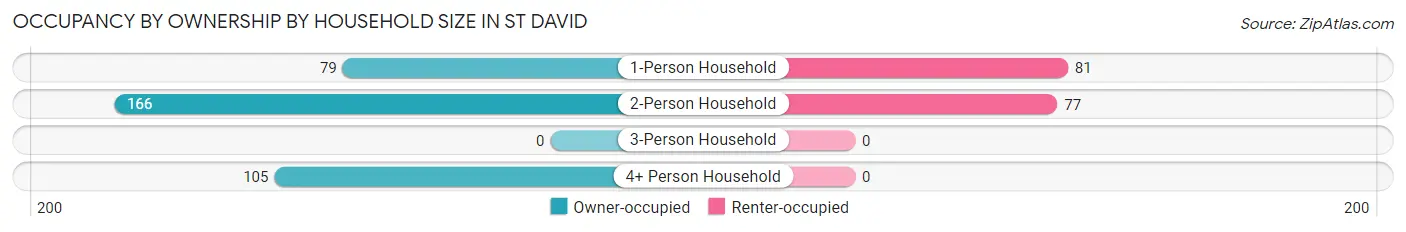
| Household Size | Owner-occupied | Renter-occupied |
| 1-Person Household | 79 (49.4%) | 81 (50.6%) |
| 2-Person Household | 166 (68.3%) | 77 (31.7%) |
| 3-Person Household | 0 (0.0%) | 0 (0.0%) |
| 4+ Person Household | 105 (100.0%) | 0 (0.0%) |
| Total Housing Units | 350 (68.9%) | 158 (31.1%) |
Occupancy by Educational Attainment in St David
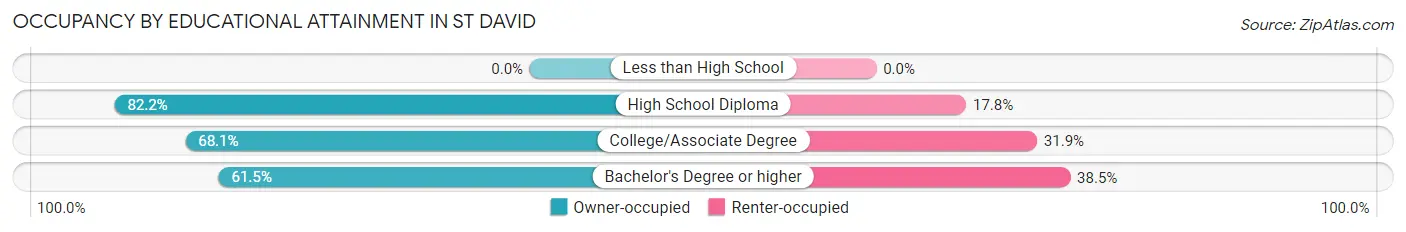
| Household Size | Owner-occupied | Renter-occupied |
| Less than High School | 0 (0.0%) | 0 (0.0%) |
| High School Diploma | 83 (82.2%) | 18 (17.8%) |
| College/Associate Degree | 171 (68.1%) | 80 (31.9%) |
| Bachelor's Degree or higher | 96 (61.5%) | 60 (38.5%) |
Occupancy by Age of Householder in St David
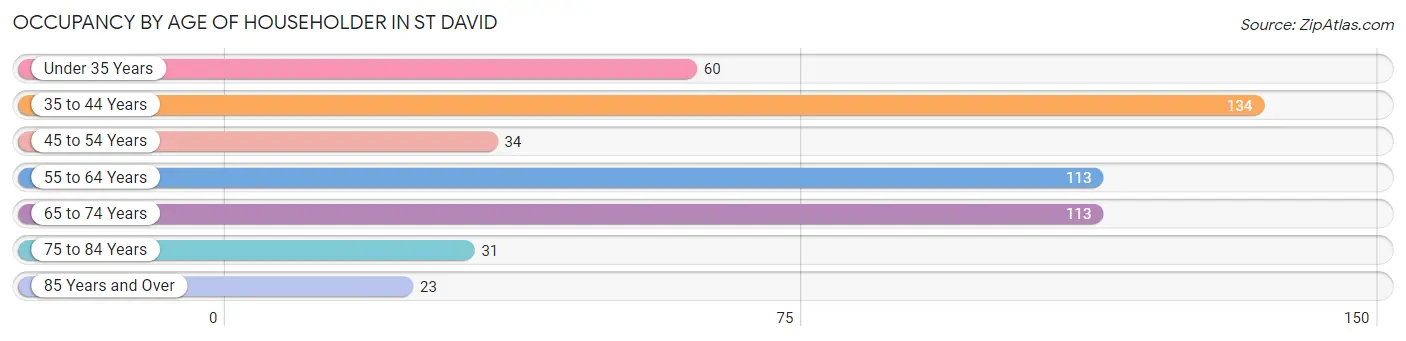
| Age Bracket | # Households | % Households |
| Under 35 Years | 60 | 11.8% |
| 35 to 44 Years | 134 | 26.4% |
| 45 to 54 Years | 34 | 6.7% |
| 55 to 64 Years | 113 | 22.2% |
| 65 to 74 Years | 113 | 22.2% |
| 75 to 84 Years | 31 | 6.1% |
| 85 Years and Over | 23 | 4.5% |
| Total | 508 | 100.0% |
Housing Finances in St David
Median Income by Occupancy in St David
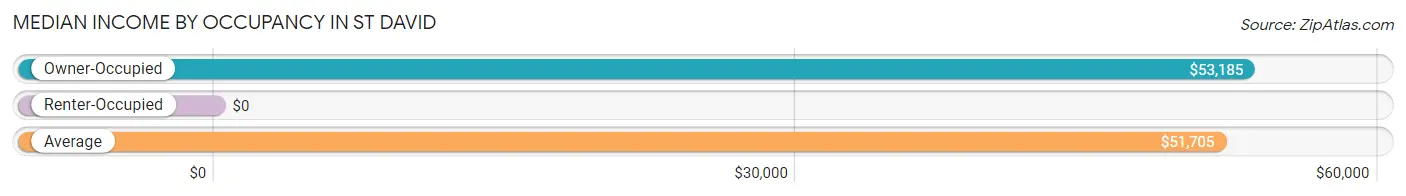
| Occupancy Type | # Households | Median Income |
| Owner-Occupied | 350 (68.9%) | $53,185 |
| Renter-Occupied | 158 (31.1%) | $0 |
| Average | 508 (100.0%) | $51,705 |
Occupancy by Householder Income Bracket in St David
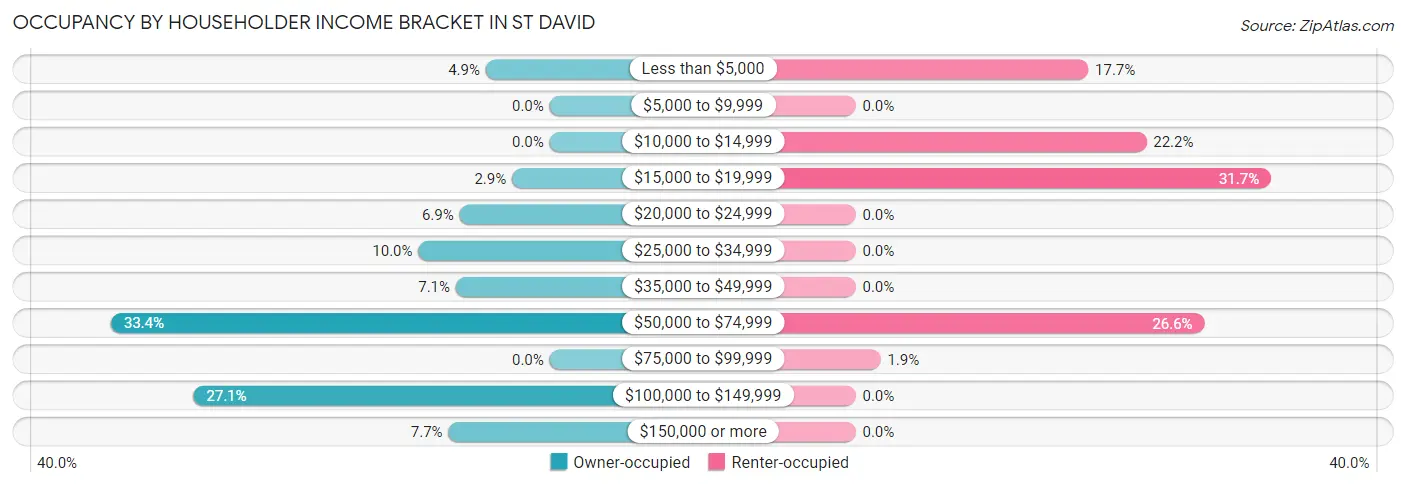
| Income Bracket | Owner-occupied | Renter-occupied |
| Less than $5,000 | 17 (4.9%) | 28 (17.7%) |
| $5,000 to $9,999 | 0 (0.0%) | 0 (0.0%) |
| $10,000 to $14,999 | 0 (0.0%) | 35 (22.2%) |
| $15,000 to $19,999 | 10 (2.9%) | 50 (31.7%) |
| $20,000 to $24,999 | 24 (6.9%) | 0 (0.0%) |
| $25,000 to $34,999 | 35 (10.0%) | 0 (0.0%) |
| $35,000 to $49,999 | 25 (7.1%) | 0 (0.0%) |
| $50,000 to $74,999 | 117 (33.4%) | 42 (26.6%) |
| $75,000 to $99,999 | 0 (0.0%) | 3 (1.9%) |
| $100,000 to $149,999 | 95 (27.1%) | 0 (0.0%) |
| $150,000 or more | 27 (7.7%) | 0 (0.0%) |
| Total | 350 (100.0%) | 158 (100.0%) |
Monthly Housing Cost Tiers in St David
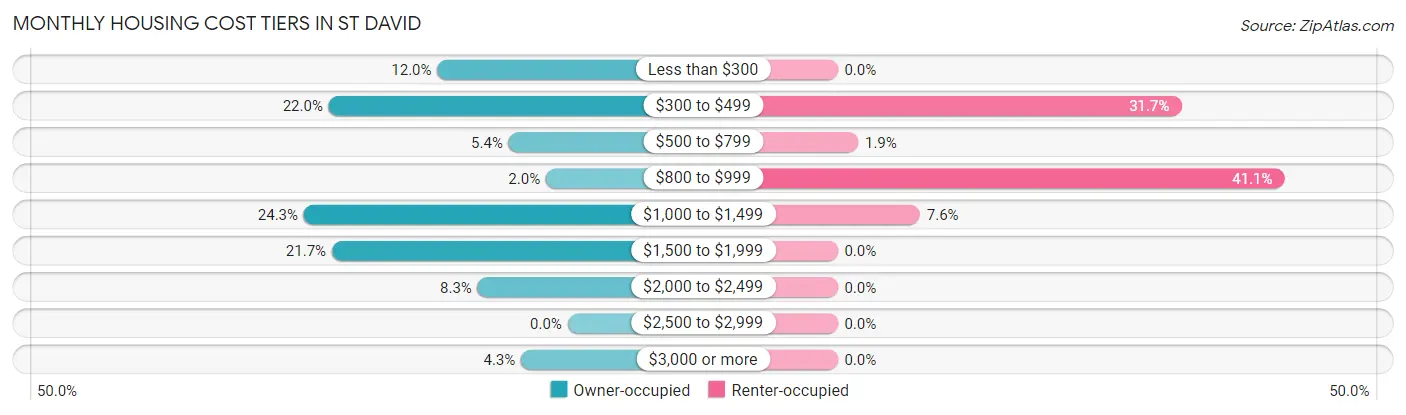
| Monthly Cost | Owner-occupied | Renter-occupied |
| Less than $300 | 42 (12.0%) | 0 (0.0%) |
| $300 to $499 | 77 (22.0%) | 50 (31.7%) |
| $500 to $799 | 19 (5.4%) | 3 (1.9%) |
| $800 to $999 | 7 (2.0%) | 65 (41.1%) |
| $1,000 to $1,499 | 85 (24.3%) | 12 (7.6%) |
| $1,500 to $1,999 | 76 (21.7%) | 0 (0.0%) |
| $2,000 to $2,499 | 29 (8.3%) | 0 (0.0%) |
| $2,500 to $2,999 | 0 (0.0%) | 0 (0.0%) |
| $3,000 or more | 15 (4.3%) | 0 (0.0%) |
| Total | 350 (100.0%) | 158 (100.0%) |
Physical Housing Characteristics in St David
Housing Structures in St David
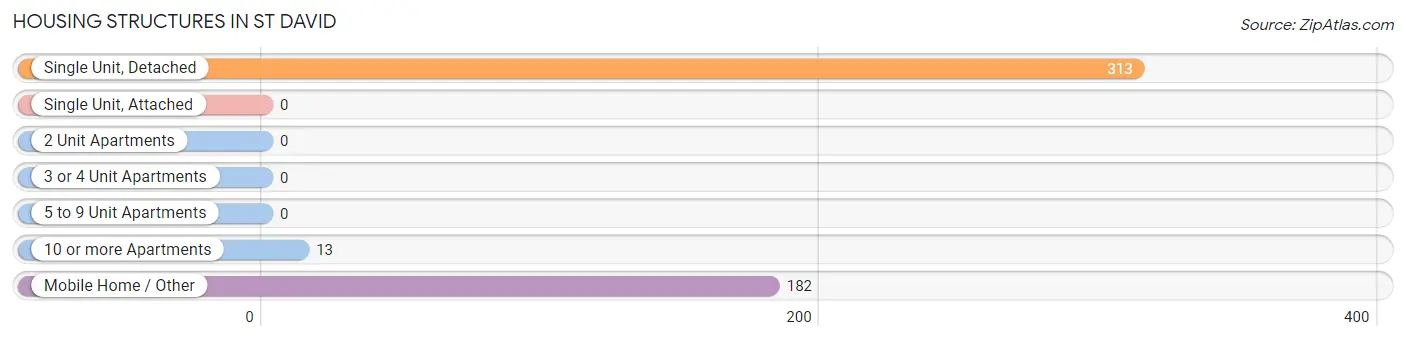
| Structure Type | # Housing Units | % Housing Units |
| Single Unit, Detached | 313 | 61.6% |
| Single Unit, Attached | 0 | 0.0% |
| 2 Unit Apartments | 0 | 0.0% |
| 3 or 4 Unit Apartments | 0 | 0.0% |
| 5 to 9 Unit Apartments | 0 | 0.0% |
| 10 or more Apartments | 13 | 2.6% |
| Mobile Home / Other | 182 | 35.8% |
| Total | 508 | 100.0% |
Housing Structures by Occupancy in St David
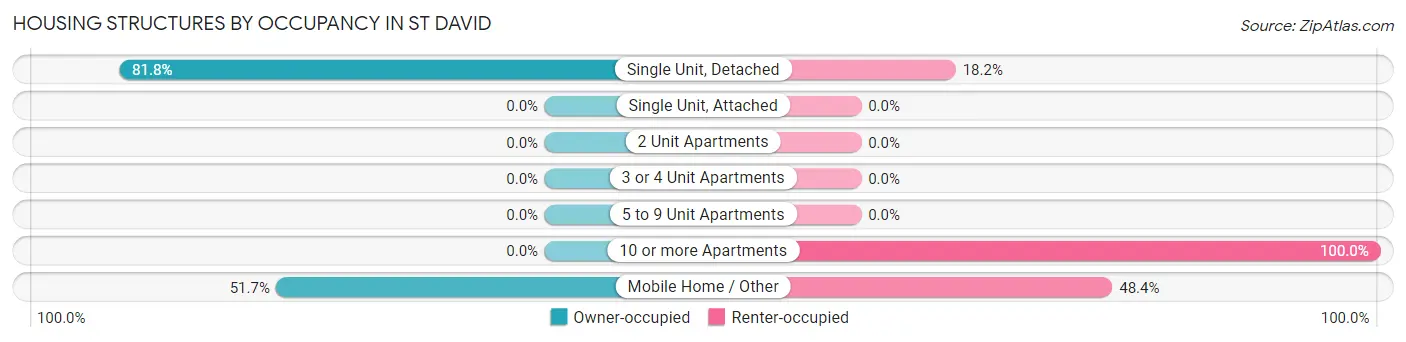
| Structure Type | Owner-occupied | Renter-occupied |
| Single Unit, Detached | 256 (81.8%) | 57 (18.2%) |
| Single Unit, Attached | 0 (0.0%) | 0 (0.0%) |
| 2 Unit Apartments | 0 (0.0%) | 0 (0.0%) |
| 3 or 4 Unit Apartments | 0 (0.0%) | 0 (0.0%) |
| 5 to 9 Unit Apartments | 0 (0.0%) | 0 (0.0%) |
| 10 or more Apartments | 0 (0.0%) | 13 (100.0%) |
| Mobile Home / Other | 94 (51.6%) | 88 (48.3%) |
| Total | 350 (68.9%) | 158 (31.1%) |
Housing Structures by Number of Rooms in St David
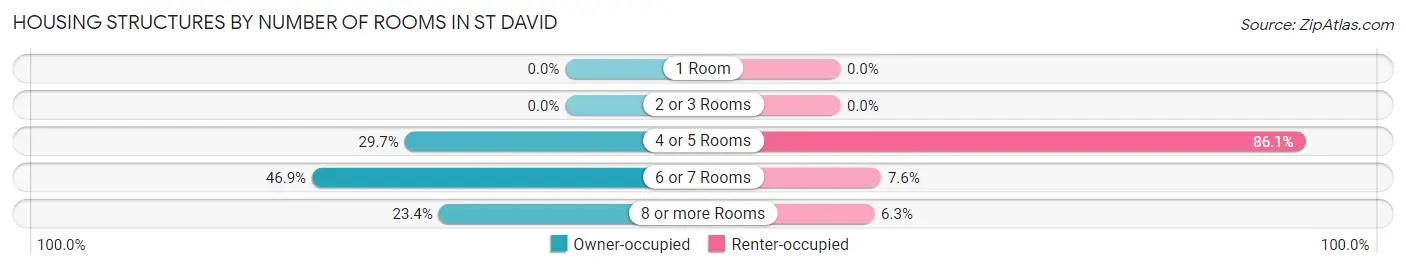
| Number of Rooms | Owner-occupied | Renter-occupied |
| 1 Room | 0 (0.0%) | 0 (0.0%) |
| 2 or 3 Rooms | 0 (0.0%) | 0 (0.0%) |
| 4 or 5 Rooms | 104 (29.7%) | 136 (86.1%) |
| 6 or 7 Rooms | 164 (46.9%) | 12 (7.6%) |
| 8 or more Rooms | 82 (23.4%) | 10 (6.3%) |
| Total | 350 (100.0%) | 158 (100.0%) |
Housing Structure by Heating Type in St David
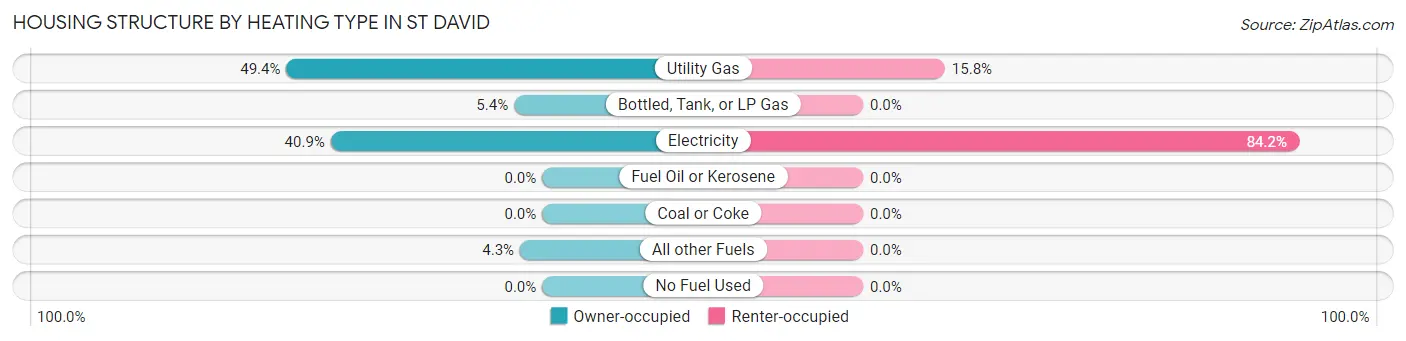
| Heating Type | Owner-occupied | Renter-occupied |
| Utility Gas | 173 (49.4%) | 25 (15.8%) |
| Bottled, Tank, or LP Gas | 19 (5.4%) | 0 (0.0%) |
| Electricity | 143 (40.9%) | 133 (84.2%) |
| Fuel Oil or Kerosene | 0 (0.0%) | 0 (0.0%) |
| Coal or Coke | 0 (0.0%) | 0 (0.0%) |
| All other Fuels | 15 (4.3%) | 0 (0.0%) |
| No Fuel Used | 0 (0.0%) | 0 (0.0%) |
| Total | 350 (100.0%) | 158 (100.0%) |
Household Vehicle Usage in St David
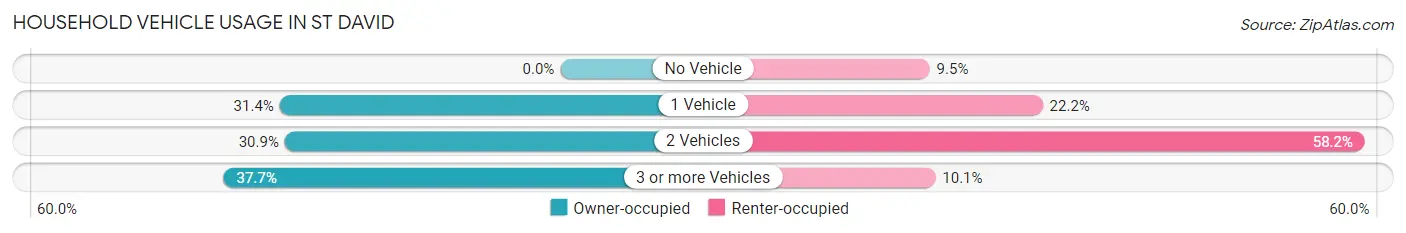
| Vehicles per Household | Owner-occupied | Renter-occupied |
| No Vehicle | 0 (0.0%) | 15 (9.5%) |
| 1 Vehicle | 110 (31.4%) | 35 (22.2%) |
| 2 Vehicles | 108 (30.9%) | 92 (58.2%) |
| 3 or more Vehicles | 132 (37.7%) | 16 (10.1%) |
| Total | 350 (100.0%) | 158 (100.0%) |
Real Estate & Mortgages in St David
Real Estate and Mortgage Overview in St David
| Characteristic | Without Mortgage | With Mortgage |
| Housing Units | 126 | 224 |
| Median Property Value | $109,100 | $216,900 |
| Median Household Income | $50,921 | $27 |
| Monthly Housing Costs | $360 | $15 |
| Real Estate Taxes | $1,053 | $48 |
Property Value by Mortgage Status in St David
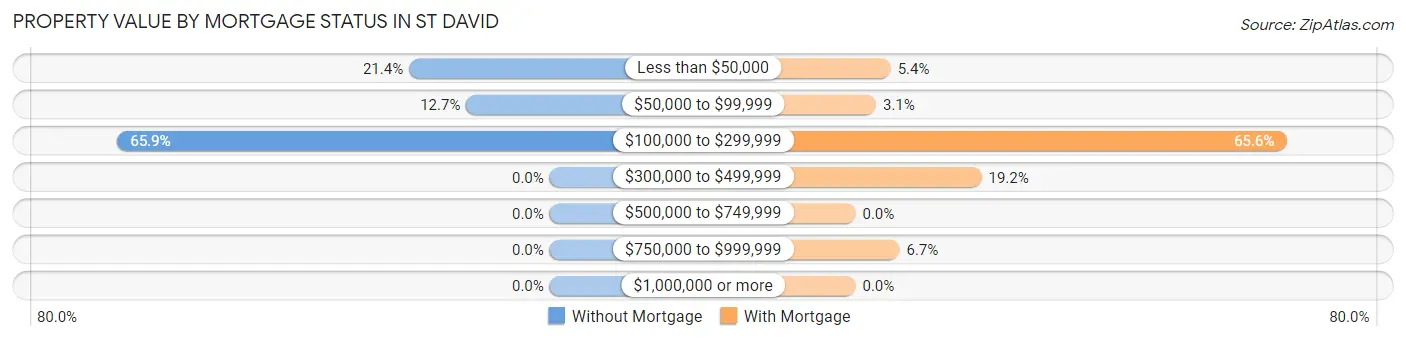
| Property Value | Without Mortgage | With Mortgage |
| Less than $50,000 | 27 (21.4%) | 12 (5.4%) |
| $50,000 to $99,999 | 16 (12.7%) | 7 (3.1%) |
| $100,000 to $299,999 | 83 (65.9%) | 147 (65.6%) |
| $300,000 to $499,999 | 0 (0.0%) | 43 (19.2%) |
| $500,000 to $749,999 | 0 (0.0%) | 0 (0.0%) |
| $750,000 to $999,999 | 0 (0.0%) | 15 (6.7%) |
| $1,000,000 or more | 0 (0.0%) | 0 (0.0%) |
| Total | 126 (100.0%) | 224 (100.0%) |
Household Income by Mortgage Status in St David
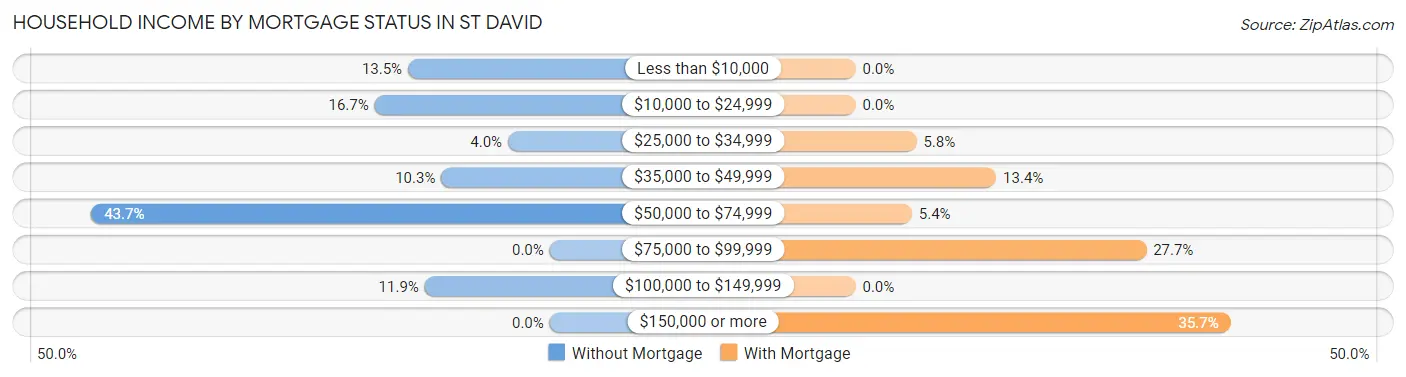
| Household Income | Without Mortgage | With Mortgage |
| Less than $10,000 | 17 (13.5%) | 0 (0.0%) |
| $10,000 to $24,999 | 21 (16.7%) | 0 (0.0%) |
| $25,000 to $34,999 | 5 (4.0%) | 13 (5.8%) |
| $35,000 to $49,999 | 13 (10.3%) | 30 (13.4%) |
| $50,000 to $74,999 | 55 (43.6%) | 12 (5.4%) |
| $75,000 to $99,999 | 0 (0.0%) | 62 (27.7%) |
| $100,000 to $149,999 | 15 (11.9%) | 0 (0.0%) |
| $150,000 or more | 0 (0.0%) | 80 (35.7%) |
| Total | 126 (100.0%) | 224 (100.0%) |
Property Value to Household Income Ratio in St David
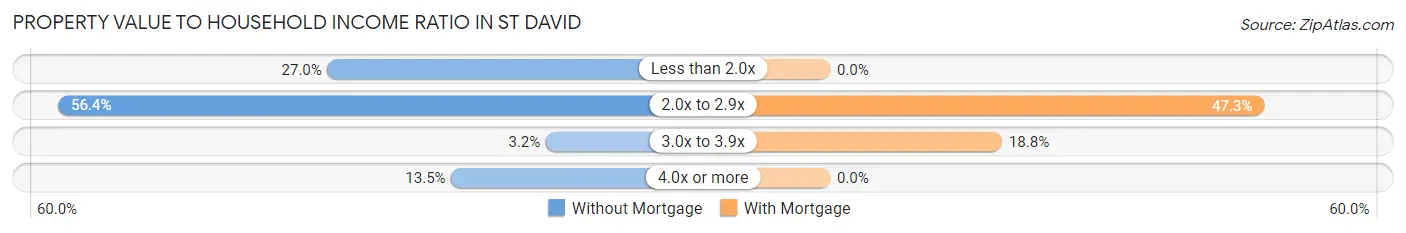
| Value-to-Income Ratio | Without Mortgage | With Mortgage |
| Less than 2.0x | 34 (27.0%) | 0 (0.0%) |
| 2.0x to 2.9x | 71 (56.4%) | 106 (47.3%) |
| 3.0x to 3.9x | 4 (3.2%) | 42 (18.8%) |
| 4.0x or more | 17 (13.5%) | 0 (0.0%) |
| Total | 126 (100.0%) | 224 (100.0%) |
Real Estate Taxes by Mortgage Status in St David
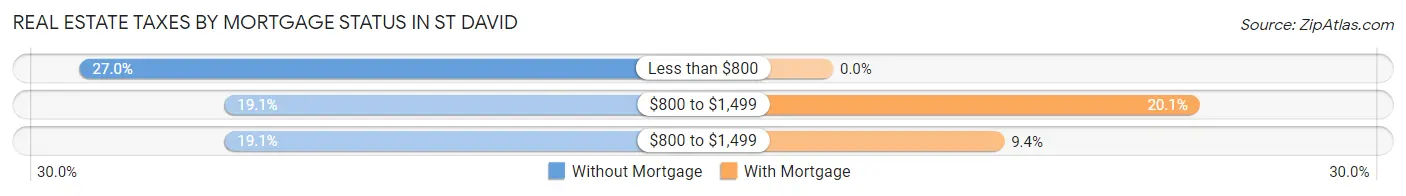
| Property Taxes | Without Mortgage | With Mortgage |
| Less than $800 | 34 (27.0%) | 0 (0.0%) |
| $800 to $1,499 | 24 (19.1%) | 45 (20.1%) |
| $800 to $1,499 | 24 (19.1%) | 21 (9.4%) |
| Total | 126 (100.0%) | 224 (100.0%) |
Health & Disability in St David
Health Insurance Coverage by Age in St David
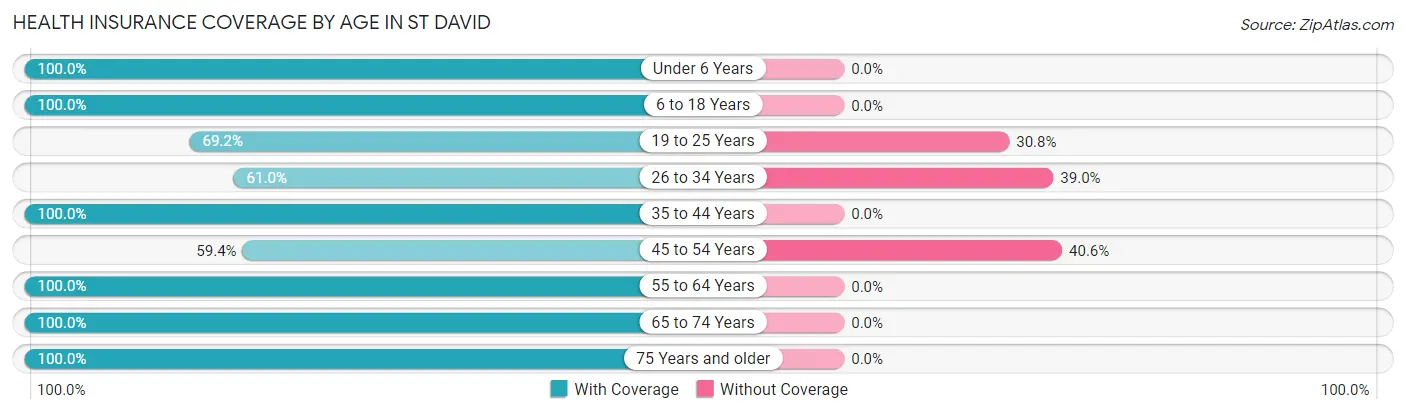
| Age Bracket | With Coverage | Without Coverage |
| Under 6 Years | 162 (100.0%) | 0 (0.0%) |
| 6 to 18 Years | 214 (100.0%) | 0 (0.0%) |
| 19 to 25 Years | 36 (69.2%) | 16 (30.8%) |
| 26 to 34 Years | 133 (61.0%) | 85 (39.0%) |
| 35 to 44 Years | 169 (100.0%) | 0 (0.0%) |
| 45 to 54 Years | 57 (59.4%) | 39 (40.6%) |
| 55 to 64 Years | 117 (100.0%) | 0 (0.0%) |
| 65 to 74 Years | 192 (100.0%) | 0 (0.0%) |
| 75 Years and older | 80 (100.0%) | 0 (0.0%) |
| Total | 1,160 (89.2%) | 140 (10.8%) |
Health Insurance Coverage by Citizenship Status in St David
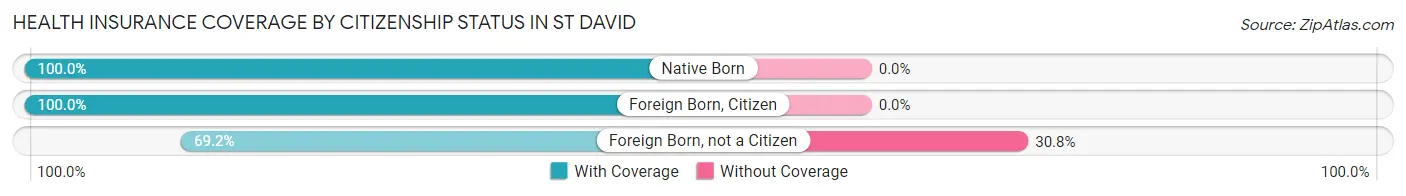
| Citizenship Status | With Coverage | Without Coverage |
| Native Born | 162 (100.0%) | 0 (0.0%) |
| Foreign Born, Citizen | 214 (100.0%) | 0 (0.0%) |
| Foreign Born, not a Citizen | 36 (69.2%) | 16 (30.8%) |
Health Insurance Coverage by Household Income in St David
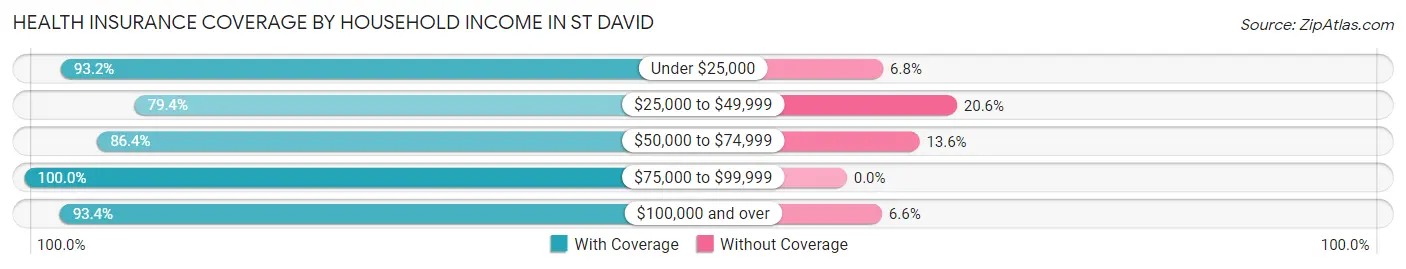
| Household Income | With Coverage | Without Coverage |
| Under $25,000 | 219 (93.2%) | 16 (6.8%) |
| $25,000 to $49,999 | 154 (79.4%) | 40 (20.6%) |
| $50,000 to $74,999 | 330 (86.4%) | 52 (13.6%) |
| $75,000 to $99,999 | 3 (100.0%) | 0 (0.0%) |
| $100,000 and over | 454 (93.4%) | 32 (6.6%) |
Public vs Private Health Insurance Coverage by Age in St David
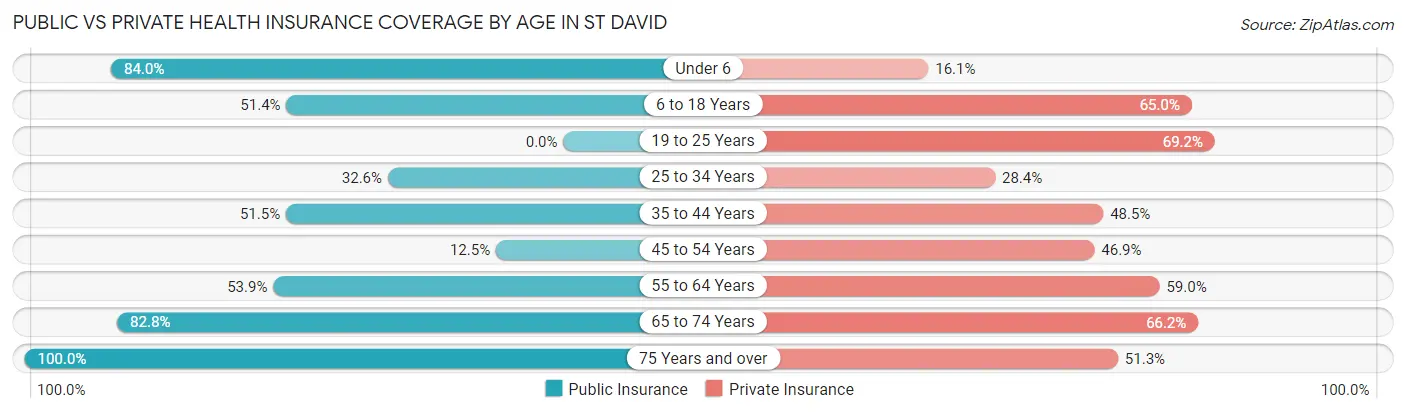
| Age Bracket | Public Insurance | Private Insurance |
| Under 6 | 136 (84.0%) | 26 (16.1%) |
| 6 to 18 Years | 110 (51.4%) | 139 (64.9%) |
| 19 to 25 Years | 0 (0.0%) | 36 (69.2%) |
| 25 to 34 Years | 71 (32.6%) | 62 (28.4%) |
| 35 to 44 Years | 87 (51.5%) | 82 (48.5%) |
| 45 to 54 Years | 12 (12.5%) | 45 (46.9%) |
| 55 to 64 Years | 63 (53.8%) | 69 (59.0%) |
| 65 to 74 Years | 159 (82.8%) | 127 (66.1%) |
| 75 Years and over | 80 (100.0%) | 41 (51.2%) |
| Total | 718 (55.2%) | 627 (48.2%) |
Disability Status by Sex by Age in St David
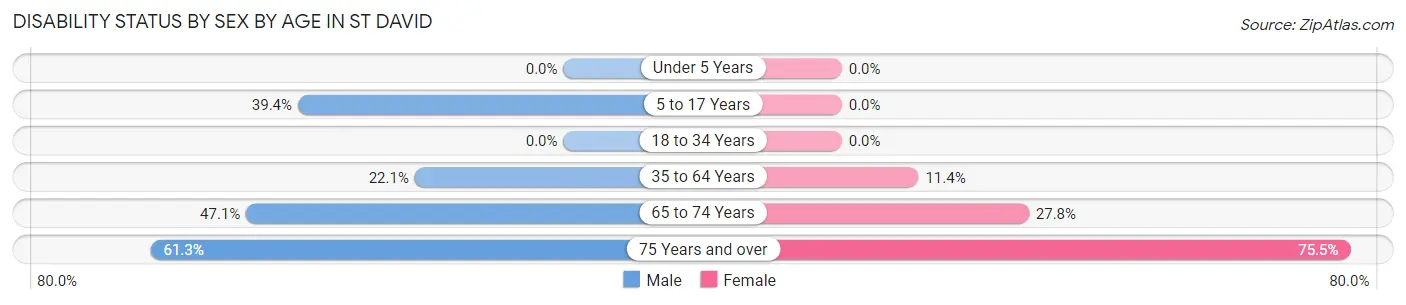
| Age Bracket | Male | Female |
| Under 5 Years | 0 (0.0%) | 0 (0.0%) |
| 5 to 17 Years | 41 (39.4%) | 0 (0.0%) |
| 18 to 34 Years | 0 (0.0%) | 0 (0.0%) |
| 35 to 64 Years | 32 (22.1%) | 27 (11.4%) |
| 65 to 74 Years | 65 (47.1%) | 15 (27.8%) |
| 75 Years and over | 19 (61.3%) | 37 (75.5%) |
Disability Class by Sex by Age in St David
Disability Class: Hearing Difficulty
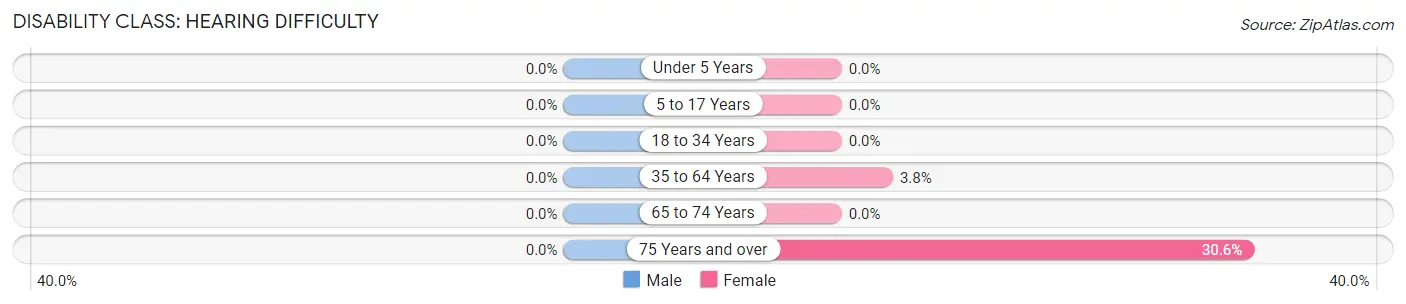
| Age Bracket | Male | Female |
| Under 5 Years | 0 (0.0%) | 0 (0.0%) |
| 5 to 17 Years | 0 (0.0%) | 0 (0.0%) |
| 18 to 34 Years | 0 (0.0%) | 0 (0.0%) |
| 35 to 64 Years | 0 (0.0%) | 9 (3.8%) |
| 65 to 74 Years | 0 (0.0%) | 0 (0.0%) |
| 75 Years and over | 0 (0.0%) | 15 (30.6%) |
Disability Class: Vision Difficulty
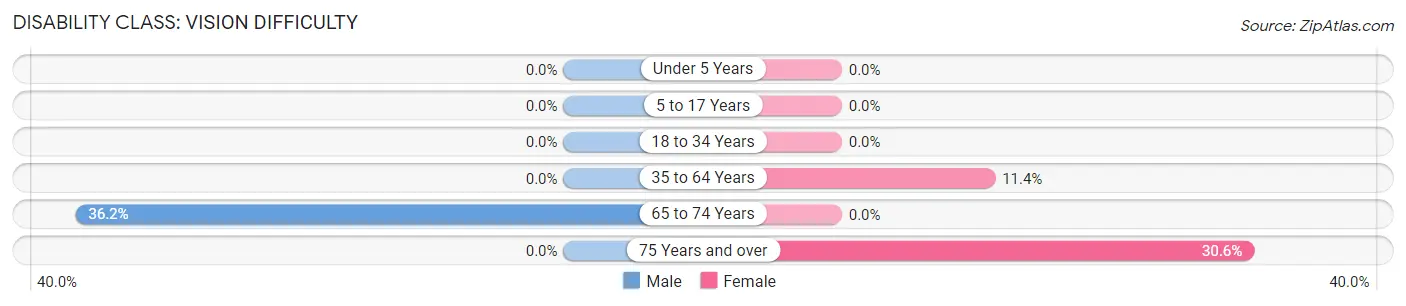
| Age Bracket | Male | Female |
| Under 5 Years | 0 (0.0%) | 0 (0.0%) |
| 5 to 17 Years | 0 (0.0%) | 0 (0.0%) |
| 18 to 34 Years | 0 (0.0%) | 0 (0.0%) |
| 35 to 64 Years | 0 (0.0%) | 27 (11.4%) |
| 65 to 74 Years | 50 (36.2%) | 0 (0.0%) |
| 75 Years and over | 0 (0.0%) | 15 (30.6%) |
Disability Class: Cognitive Difficulty
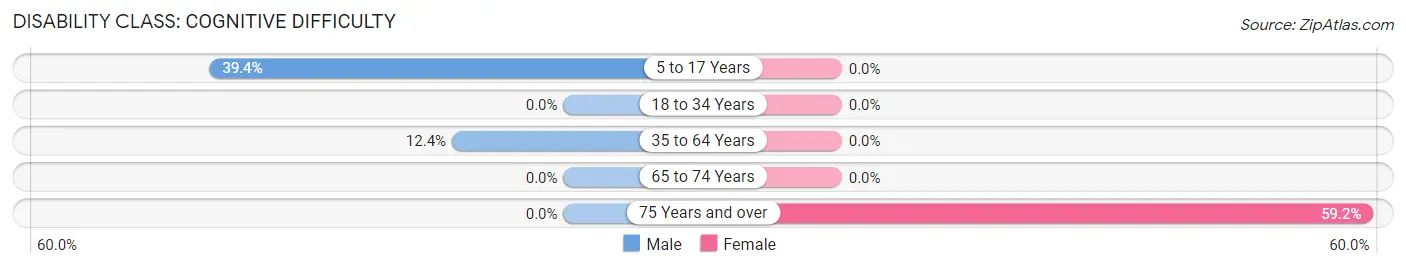
| Age Bracket | Male | Female |
| 5 to 17 Years | 41 (39.4%) | 0 (0.0%) |
| 18 to 34 Years | 0 (0.0%) | 0 (0.0%) |
| 35 to 64 Years | 18 (12.4%) | 0 (0.0%) |
| 65 to 74 Years | 0 (0.0%) | 0 (0.0%) |
| 75 Years and over | 0 (0.0%) | 29 (59.2%) |
Disability Class: Ambulatory Difficulty
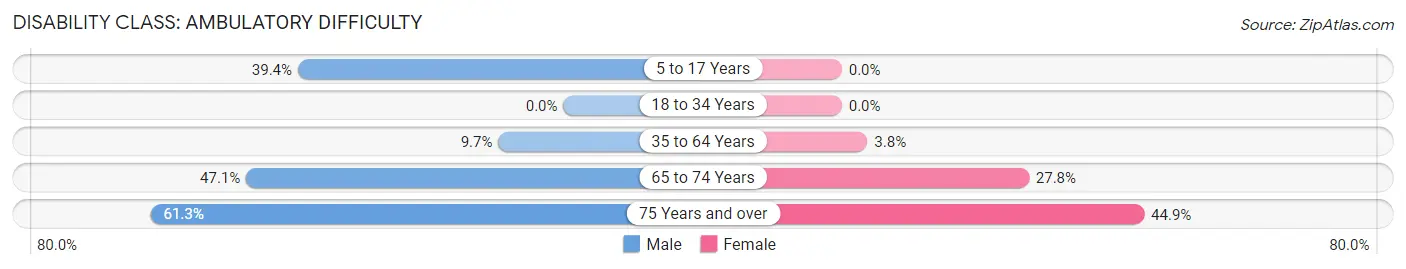
| Age Bracket | Male | Female |
| 5 to 17 Years | 41 (39.4%) | 0 (0.0%) |
| 18 to 34 Years | 0 (0.0%) | 0 (0.0%) |
| 35 to 64 Years | 14 (9.7%) | 9 (3.8%) |
| 65 to 74 Years | 65 (47.1%) | 15 (27.8%) |
| 75 Years and over | 19 (61.3%) | 22 (44.9%) |
Disability Class: Self-Care Difficulty
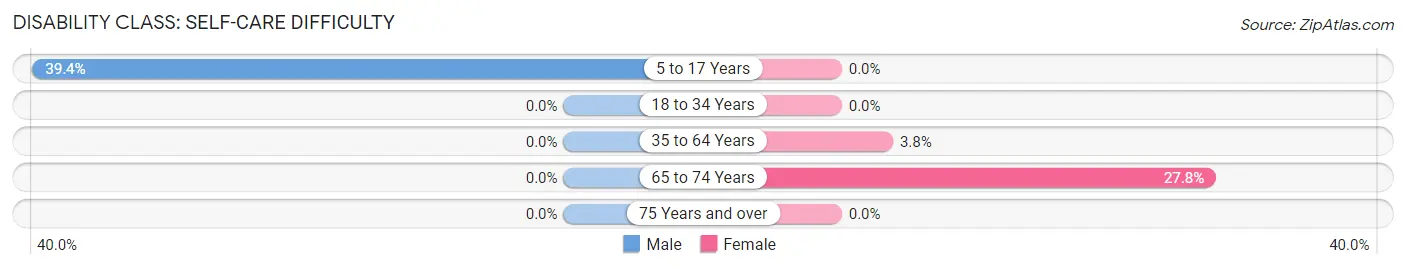
| Age Bracket | Male | Female |
| 5 to 17 Years | 41 (39.4%) | 0 (0.0%) |
| 18 to 34 Years | 0 (0.0%) | 0 (0.0%) |
| 35 to 64 Years | 0 (0.0%) | 9 (3.8%) |
| 65 to 74 Years | 0 (0.0%) | 15 (27.8%) |
| 75 Years and over | 0 (0.0%) | 0 (0.0%) |
Technology Access in St David
Computing Device Access in St David
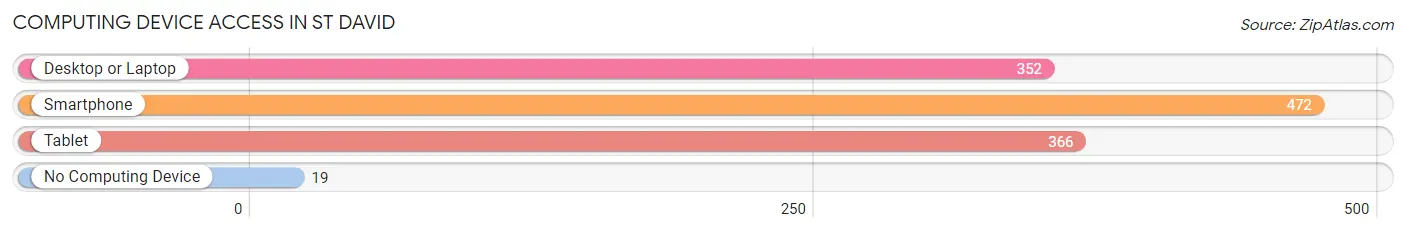
| Device Type | # Households | % Households |
| Desktop or Laptop | 352 | 69.3% |
| Smartphone | 472 | 92.9% |
| Tablet | 366 | 72.1% |
| No Computing Device | 19 | 3.7% |
| Total | 508 | 100.0% |
Internet Access in St David
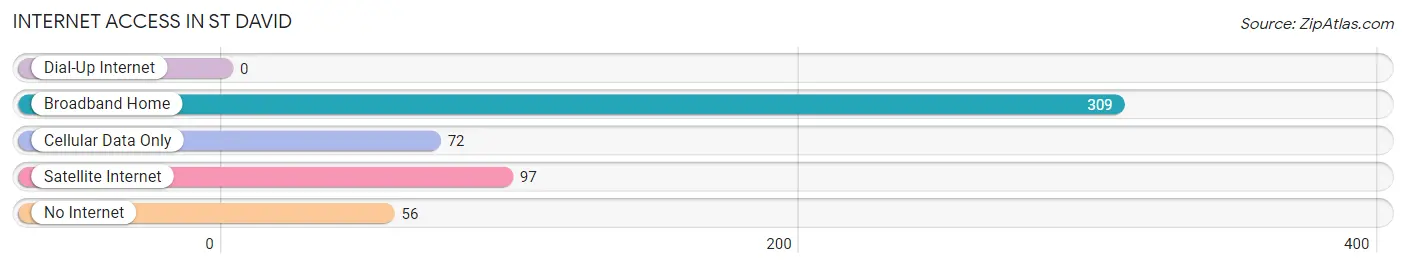
| Internet Type | # Households | % Households |
| Dial-Up Internet | 0 | 0.0% |
| Broadband Home | 309 | 60.8% |
| Cellular Data Only | 72 | 14.2% |
| Satellite Internet | 97 | 19.1% |
| No Internet | 56 | 11.0% |
| Total | 508 | 100.0% |
St David Summary
David, Arizona is a small town located in the northern part of the state, in the county of Yavapai. It is situated in the foothills of the Bradshaw Mountains, and is surrounded by the Prescott National Forest. The town was founded in 1881 by a group of settlers from Wales, and was named after the patron saint of Wales, Saint David.
History
The town of St. David was founded in 1881 by a group of Welsh settlers who had traveled from Wales to Arizona in search of a better life. The settlers were led by John Jones, a Welsh minister, and his wife, Mary. The settlers chose the area because of its proximity to the Bradshaw Mountains, which provided them with a source of timber for building homes and businesses. The town was named after the patron saint of Wales, Saint David.
The town quickly grew, and by the early 1900s, it had become a thriving community. The town was home to a variety of businesses, including a general store, a blacksmith shop, a hotel, and a saloon. The town also had a school, a post office, and a church.
In the early 1900s, the town was also home to a number of mines, including the St. David Copper Mine, which was one of the largest copper mines in the state. The mine was in operation until the late 1940s, when it was closed due to declining copper prices.
Geography
St. David is located in the northern part of Arizona, in the county of Yavapai. It is situated in the foothills of the Bradshaw Mountains, and is surrounded by the Prescott National Forest. The town is located at an elevation of 4,800 feet, and has a total area of 1.2 square miles.
The climate in St. David is semi-arid, with hot summers and mild winters. The average annual temperature is around 70 degrees Fahrenheit, and the average annual precipitation is around 12 inches.
Economy
The economy of St. David is largely based on tourism and agriculture. The town is home to a number of tourist attractions, including the St. David Copper Mine, which is now a museum, and the St. David Historical Society, which offers tours of the town.
The town is also home to a number of farms, which produce a variety of crops, including alfalfa, hay, and wheat. The town also has a number of small businesses, including restaurants, shops, and a gas station.
Demographics
As of the 2010 census, the population of St. David was 1,845. The racial makeup of the town was 95.3% White, 0.7% Native American, 0.3% Asian, 0.2% African American, and 3.5% from other races. The median household income was $37,917, and the median family income was $45,625.
Conclusion
St. David, Arizona is a small town located in the northern part of the state, in the county of Yavapai. It was founded in 1881 by a group of Welsh settlers, and was named after the patron saint of Wales, Saint David. The town is home to a variety of businesses, including a general store, a blacksmith shop, a hotel, and a saloon. The town is also home to a number of tourist attractions, including the St. David Copper Mine, which is now a museum, and the St. David Historical Society, which offers tours of the town. The economy of St. David is largely based on tourism and agriculture, and the town has a population of 1,845, as of the 2010 census.
Common Questions
What is the Total Population of St David?
Total Population of St David is 1,300.
What is the Total Male Population of St David?
Total Male Population of St David is 585.
What is the Total Female Population of St David?
Total Female Population of St David is 715.
What is the Ratio of Males per 100 Females in St David?
There are 81.82 Males per 100 Females in St David.
What is the Ratio of Females per 100 Males in St David?
There are 122.22 Females per 100 Males in St David.
What is the Median Population Age in St David?
Median Population Age in St David is 35.3 Years.
What is the Average Family Size in St David
Average Family Size in St David is 3.6 People.
What is the Average Household Size in St David
Average Household Size in St David is 2.6 People.
What is Per Capita Income in St David?
Per Capita income in St David is $24,560.
What is the Median Family Income in St David?
Median Family Income in St David is $53,176.
What is the Median Household income in St David?
Median Household Income in St David is $51,705.
What is Inequality or Gini Index in St David?
Inequality or Gini Index in St David is 0.45.
How Large is the Labor Force in St David?
There are 476 People in the Labor Forcein in St David.
What is the Percentage of People in the Labor Force in St David?
51.5% of People are in the Labor Force in St David.