Tees Toh, AZ
Tees Toh Map
Tees Toh Overview
452
TOTAL POPULATION
240
MALE POPULATION
212
FEMALE POPULATION
113.21
MALES / 100 FEMALES
88.33
FEMALES / 100 MALES
34.9
MEDIAN AGE
4.7
AVG FAMILY SIZE
3.2
AVG HOUSEHOLD SIZE
$16,754
PER CAPITA INCOME
$54,167
AVG FAMILY INCOME
$52,639
AVG HOUSEHOLD INCOME
7.5%
WAGE / INCOME GAP [ % ]
92.5¢/ $1
WAGE / INCOME GAP [ $ ]
0.43
INEQUALITY / GINI INDEX
188
LABOR FORCE [ PEOPLE ]
54.0%
PERCENT IN LABOR FORCE
23.9%
UNEMPLOYMENT RATE
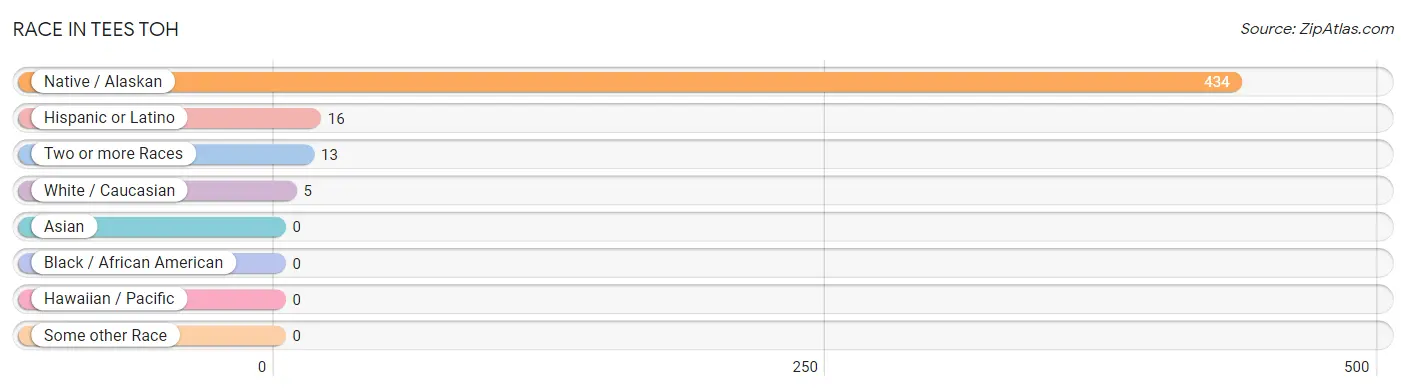
Race in Tees Toh
The most populous races in Tees Toh are Native / Alaskan (434 | 96.0%), Hispanic or Latino (16 | 3.5%), and Two or more Races (13 | 2.9%).
| Race | # Population | % Population |
| Asian | 0 | 0.0% |
| Black / African American | 0 | 0.0% |
| Hawaiian / Pacific | 0 | 0.0% |
| Hispanic or Latino | 16 | 3.5% |
| Native / Alaskan | 434 | 96.0% |
| White / Caucasian | 5 | 1.1% |
| Two or more Races | 13 | 2.9% |
| Some other Race | 0 | 0.0% |
| Total | 452 | 100.0% |
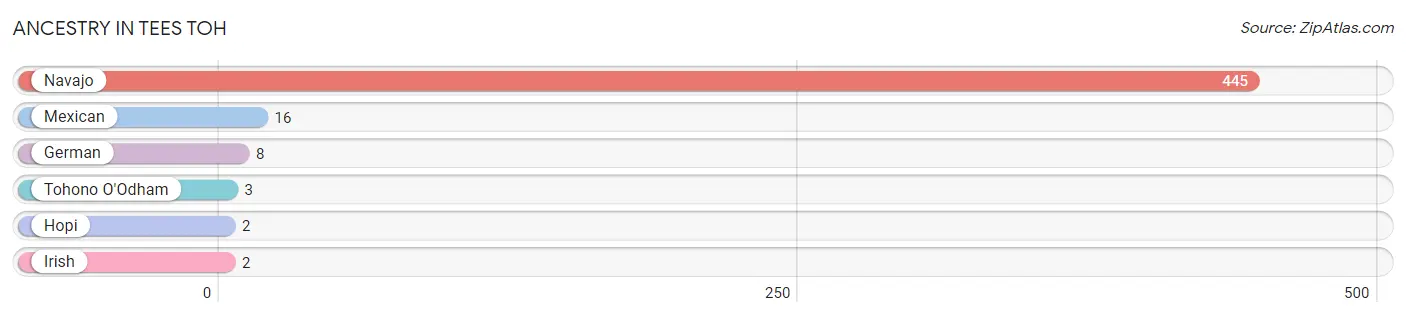
Ancestry in Tees Toh
The most populous ancestries reported in Tees Toh are Navajo (445 | 98.5%), Mexican (16 | 3.5%), German (8 | 1.8%), Tohono O'Odham (3 | 0.7%), and Hopi (2 | 0.4%), together accounting for 104.9% of all Tees Toh residents.
| Ancestry | # Population | % Population |
| German | 8 | 1.8% |
| Hopi | 2 | 0.4% |
| Irish | 2 | 0.4% |
| Mexican | 16 | 3.5% |
| Navajo | 445 | 98.5% |
| Tohono O'Odham | 3 | 0.7% | View All 6 Rows |
Immigrants in Tees Toh

| Immigration Origin | # Population | % Population | View All 0 Rows |
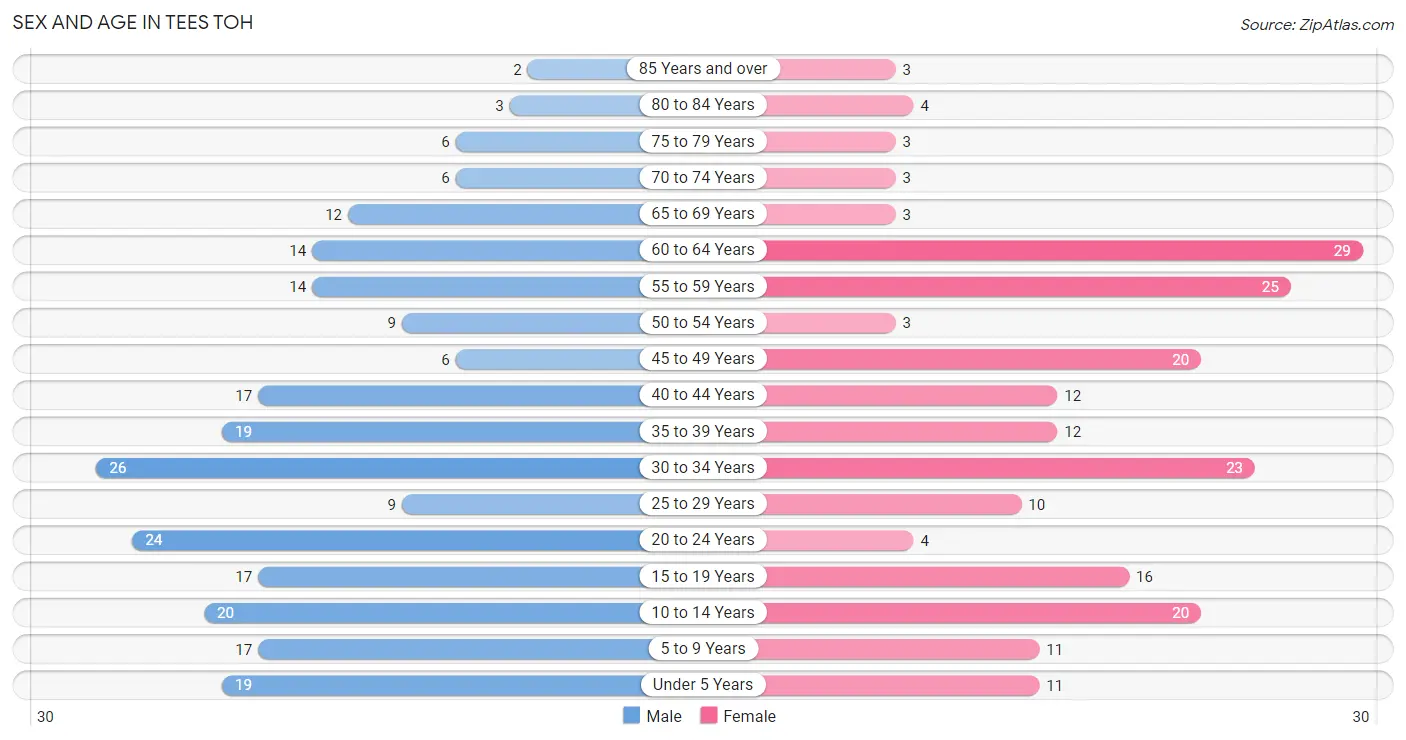
Sex and Age in Tees Toh
Sex and Age in Tees Toh
The most populous age groups in Tees Toh are 30 to 34 Years (26 | 10.8%) for men and 60 to 64 Years (29 | 13.7%) for women.
| Age Bracket | Male | Female |
| Under 5 Years | 19 (7.9%) | 11 (5.2%) |
| 5 to 9 Years | 17 (7.1%) | 11 (5.2%) |
| 10 to 14 Years | 20 (8.3%) | 20 (9.4%) |
| 15 to 19 Years | 17 (7.1%) | 16 (7.5%) |
| 20 to 24 Years | 24 (10.0%) | 4 (1.9%) |
| 25 to 29 Years | 9 (3.7%) | 10 (4.7%) |
| 30 to 34 Years | 26 (10.8%) | 23 (10.8%) |
| 35 to 39 Years | 19 (7.9%) | 12 (5.7%) |
| 40 to 44 Years | 17 (7.1%) | 12 (5.7%) |
| 45 to 49 Years | 6 (2.5%) | 20 (9.4%) |
| 50 to 54 Years | 9 (3.7%) | 3 (1.4%) |
| 55 to 59 Years | 14 (5.8%) | 25 (11.8%) |
| 60 to 64 Years | 14 (5.8%) | 29 (13.7%) |
| 65 to 69 Years | 12 (5.0%) | 3 (1.4%) |
| 70 to 74 Years | 6 (2.5%) | 3 (1.4%) |
| 75 to 79 Years | 6 (2.5%) | 3 (1.4%) |
| 80 to 84 Years | 3 (1.3%) | 4 (1.9%) |
| 85 Years and over | 2 (0.8%) | 3 (1.4%) |
| Total | 240 (100.0%) | 212 (100.0%) |
Families and Households in Tees Toh
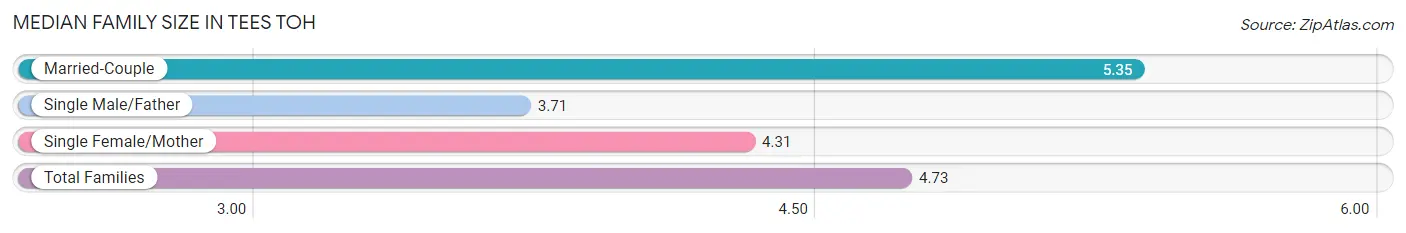
Median Family Size in Tees Toh
The median family size in Tees Toh is 4.73 persons per family, with married-couple families (40 | 50.0%) accounting for the largest median family size of 5.35 persons per family. On the other hand, single male/father families (14 | 17.5%) represent the smallest median family size with 3.71 persons per family.
| Family Type | # Families | Family Size |
| Married-Couple | 40 (50.0%) | 5.35 |
| Single Male/Father | 14 (17.5%) | 3.71 |
| Single Female/Mother | 26 (32.5%) | 4.31 |
| Total Families | 80 (100.0%) | 4.73 |
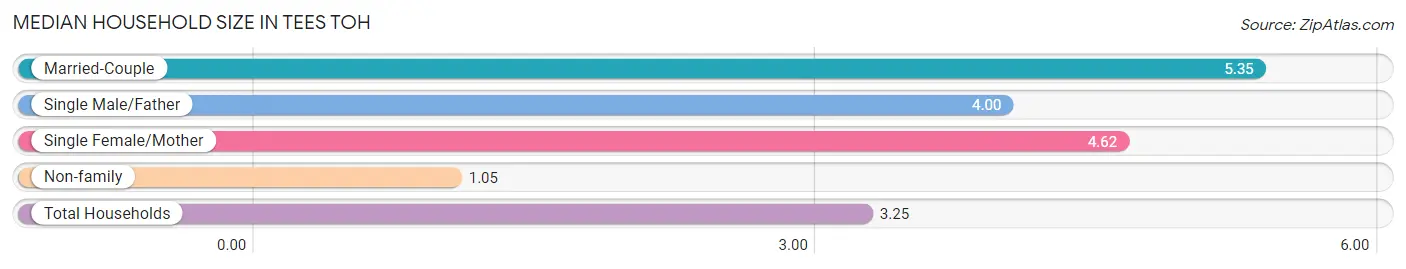
Median Household Size in Tees Toh
The median household size in Tees Toh is 3.25 persons per household, with married-couple households (40 | 28.8%) accounting for the largest median household size of 5.35 persons per household. non-family households (59 | 42.4%) represent the smallest median household size with 1.05 persons per household.
| Household Type | # Households | Household Size |
| Married-Couple | 40 (28.8%) | 5.35 |
| Single Male/Father | 14 (10.1%) | 4.00 |
| Single Female/Mother | 26 (18.7%) | 4.62 |
| Non-family | 59 (42.4%) | 1.05 |
| Total Households | 139 (100.0%) | 3.25 |
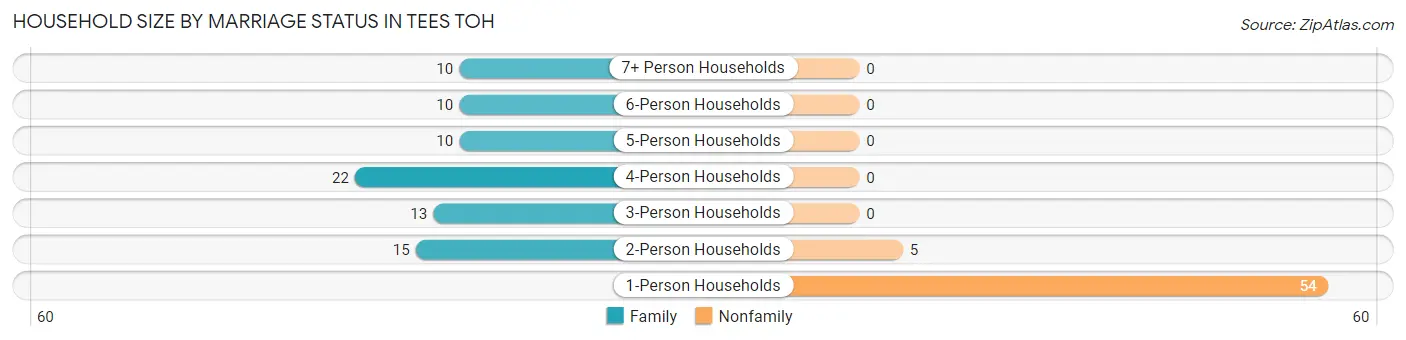
Household Size by Marriage Status in Tees Toh
Out of a total of 139 households in Tees Toh, 80 (57.6%) are family households, while 59 (42.4%) are nonfamily households. The most numerous type of family households are 4-person households, comprising 22, and the most common type of nonfamily households are 1-person households, comprising 54.
| Household Size | Family Households | Nonfamily Households |
| 1-Person Households | - | 54 (38.9%) |
| 2-Person Households | 15 (10.8%) | 5 (3.6%) |
| 3-Person Households | 13 (9.3%) | 0 (0.0%) |
| 4-Person Households | 22 (15.8%) | 0 (0.0%) |
| 5-Person Households | 10 (7.2%) | 0 (0.0%) |
| 6-Person Households | 10 (7.2%) | 0 (0.0%) |
| 7+ Person Households | 10 (7.2%) | 0 (0.0%) |
| Total | 80 (57.6%) | 59 (42.4%) |
Female Fertility in Tees Toh
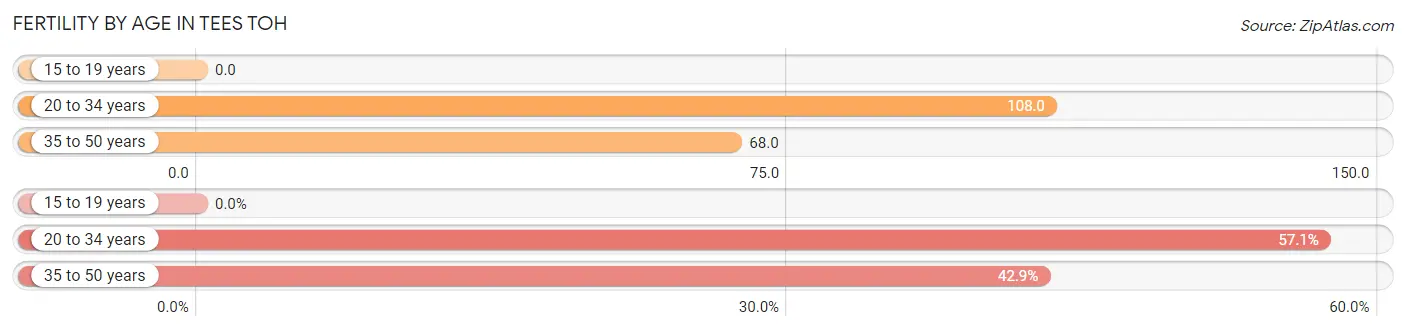
Fertility by Age in Tees Toh
Average fertility rate in Tees Toh is 72.0 births per 1,000 women. Women in the age bracket of 20 to 34 years have the highest fertility rate with 108.0 births per 1,000 women. Women in the age bracket of 20 to 34 years acount for 57.1% of all women with births.
| Age Bracket | Women with Births | Births / 1,000 Women |
| 15 to 19 years | 0 (0.0%) | 0.0 |
| 20 to 34 years | 4 (57.1%) | 108.0 |
| 35 to 50 years | 3 (42.9%) | 68.0 |
| Total | 7 (100.0%) | 72.0 |
Fertility by Age by Marriage Status in Tees Toh
42.9% of women with births (7) in Tees Toh are married. The highest percentage of unmarried women with births falls into 20 to 34 years age bracket with 100.0% of them unmarried at the time of birth, while the lowest percentage of unmarried women with births belong to 35 to 50 years age bracket with 0.0% of them unmarried.
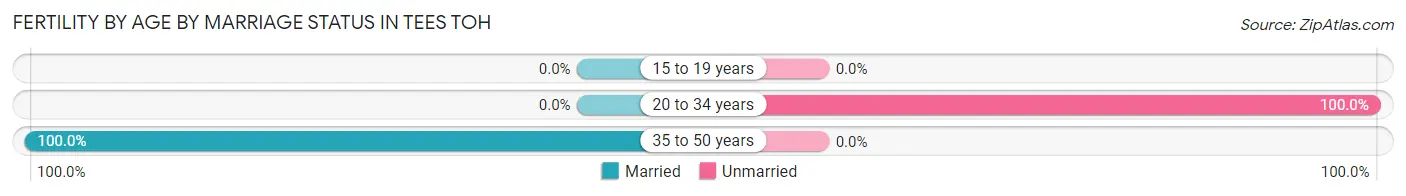
| Age Bracket | Married | Unmarried |
| 15 to 19 years | 0 (0.0%) | 0 (0.0%) |
| 20 to 34 years | 0 (0.0%) | 4 (100.0%) |
| 35 to 50 years | 3 (100.0%) | 0 (0.0%) |
| Total | 3 (42.9%) | 4 (57.1%) |
Fertility by Education in Tees Toh
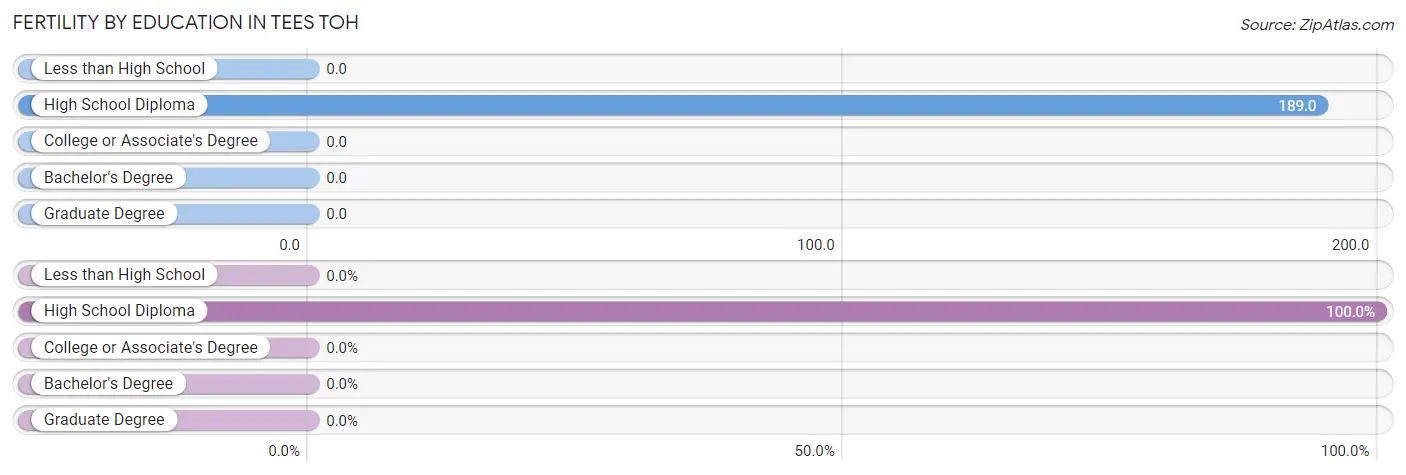
| Educational Attainment | Women with Births | Births / 1,000 Women |
| Less than High School | 0 (0.0%) | 0.0 |
| High School Diploma | 7 (100.0%) | 189.0 |
| College or Associate's Degree | 0 (0.0%) | 0.0 |
| Bachelor's Degree | 0 (0.0%) | 0.0 |
| Graduate Degree | 0 (0.0%) | 0.0 |
| Total | 7 (100.0%) | 72.0 |
Fertility by Education by Marriage Status in Tees Toh
57.1% of women with births in Tees Toh are unmarried. Women with the educational attainment of high school diploma are most likely to be married with 42.9% of them married at childbirth, while women with the educational attainment of high school diploma are least likely to be married with 57.1% of them unmarried at childbirth.
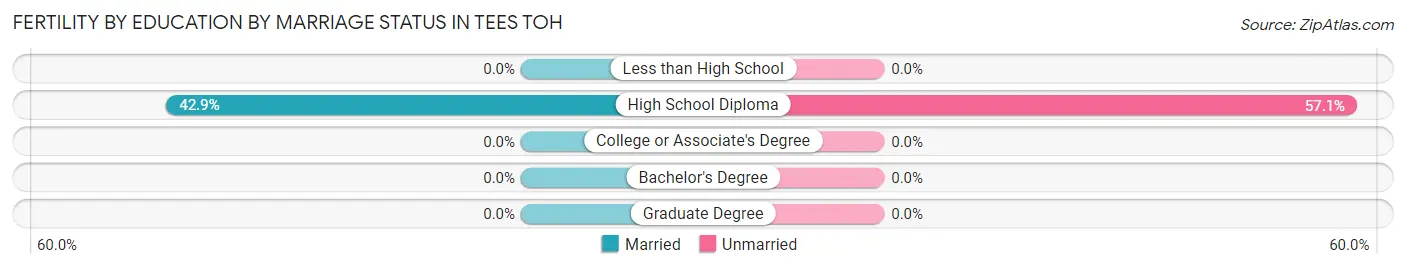
| Educational Attainment | Married | Unmarried |
| Less than High School | 0 (0.0%) | 0 (0.0%) |
| High School Diploma | 3 (42.9%) | 4 (57.1%) |
| College or Associate's Degree | 0 (0.0%) | 0 (0.0%) |
| Bachelor's Degree | 0 (0.0%) | 0 (0.0%) |
| Graduate Degree | 0 (0.0%) | 0 (0.0%) |
| Total | 3 (42.9%) | 4 (57.1%) |
Income in Tees Toh
Income Overview in Tees Toh
Per Capita Income in Tees Toh is $16,754, while median incomes of families and households are $54,167 and $52,639 respectively.
| Characteristic | Number | Measure |
| Per Capita Income | 452 | $16,754 |
| Median Family Income | 80 | $54,167 |
| Mean Family Income | 80 | $65,386 |
| Median Household Income | 139 | $52,639 |
| Mean Household Income | 139 | $55,806 |
| Income Deficit | 80 | $0 |
| Wage / Income Gap (%) | 452 | 7.54% |
| Wage / Income Gap ($) | 452 | 92.46¢ per $1 |
| Gini / Inequality Index | 452 | 0.43 |
Earnings by Sex in Tees Toh
Average Earnings in Tees Toh are $29,531, $28,750 for men and $31,094 for women, a difference of 7.5%.
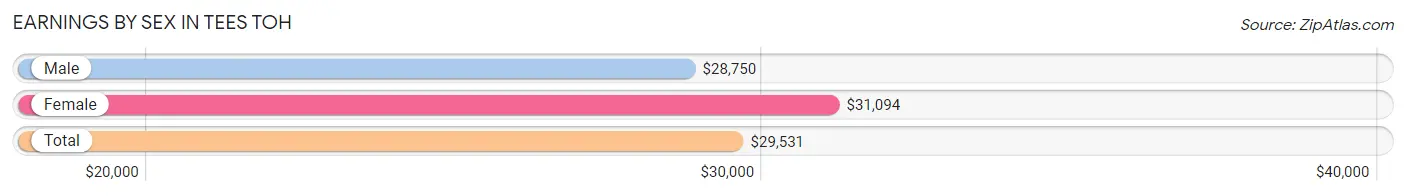
| Sex | Number | Average Earnings |
| Male | 83 (44.2%) | $28,750 |
| Female | 105 (55.8%) | $31,094 |
| Total | 188 (100.0%) | $29,531 |
Earnings by Sex by Income Bracket in Tees Toh
The most common earnings brackets in Tees Toh are $25,000 to $29,999 for men (17 | 20.5%) and $30,000 to $34,999 for women (22 | 20.9%).
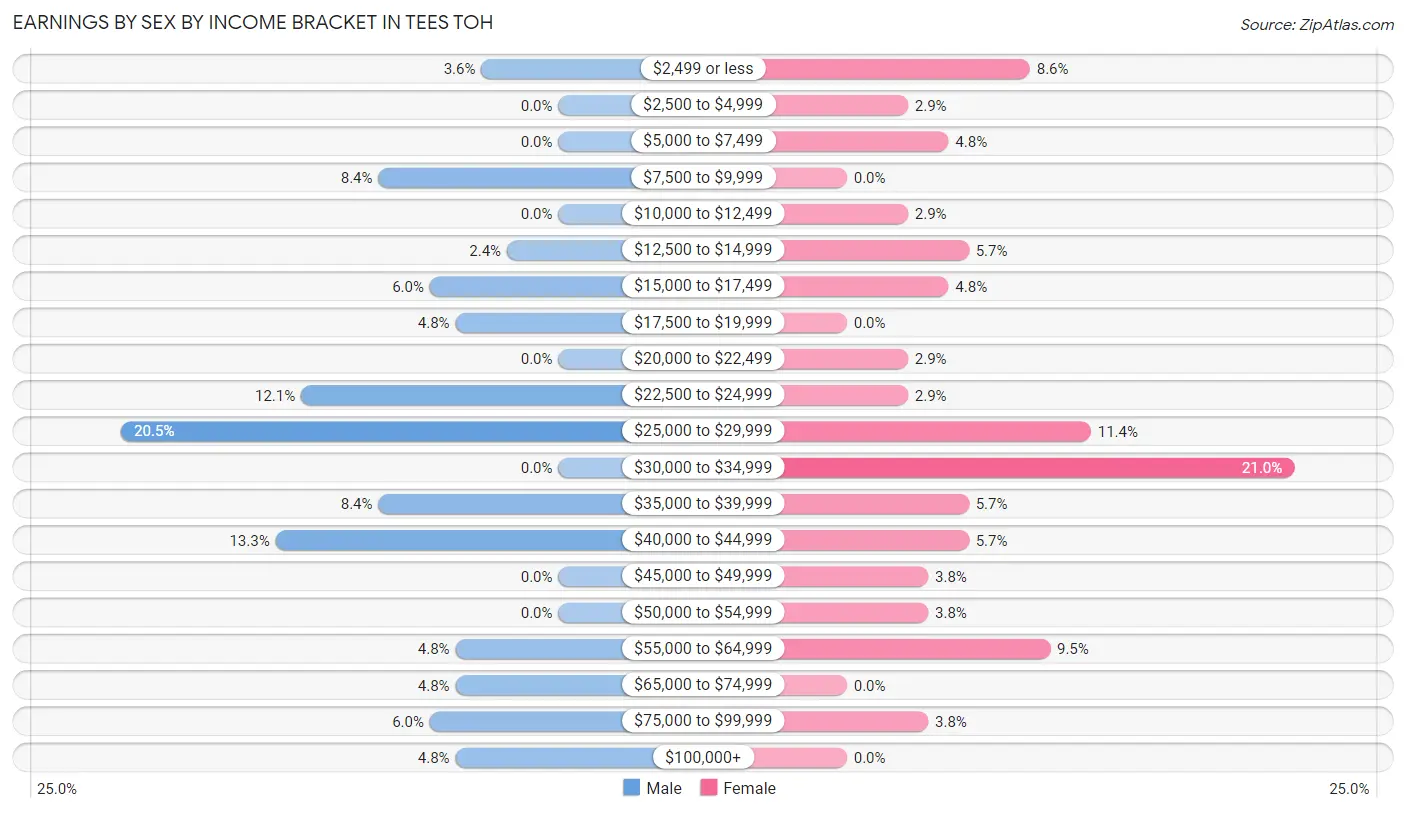
| Income | Male | Female |
| $2,499 or less | 3 (3.6%) | 9 (8.6%) |
| $2,500 to $4,999 | 0 (0.0%) | 3 (2.9%) |
| $5,000 to $7,499 | 0 (0.0%) | 5 (4.8%) |
| $7,500 to $9,999 | 7 (8.4%) | 0 (0.0%) |
| $10,000 to $12,499 | 0 (0.0%) | 3 (2.9%) |
| $12,500 to $14,999 | 2 (2.4%) | 6 (5.7%) |
| $15,000 to $17,499 | 5 (6.0%) | 5 (4.8%) |
| $17,500 to $19,999 | 4 (4.8%) | 0 (0.0%) |
| $20,000 to $22,499 | 0 (0.0%) | 3 (2.9%) |
| $22,500 to $24,999 | 10 (12.0%) | 3 (2.9%) |
| $25,000 to $29,999 | 17 (20.5%) | 12 (11.4%) |
| $30,000 to $34,999 | 0 (0.0%) | 22 (20.9%) |
| $35,000 to $39,999 | 7 (8.4%) | 6 (5.7%) |
| $40,000 to $44,999 | 11 (13.3%) | 6 (5.7%) |
| $45,000 to $49,999 | 0 (0.0%) | 4 (3.8%) |
| $50,000 to $54,999 | 0 (0.0%) | 4 (3.8%) |
| $55,000 to $64,999 | 4 (4.8%) | 10 (9.5%) |
| $65,000 to $74,999 | 4 (4.8%) | 0 (0.0%) |
| $75,000 to $99,999 | 5 (6.0%) | 4 (3.8%) |
| $100,000+ | 4 (4.8%) | 0 (0.0%) |
| Total | 83 (100.0%) | 105 (100.0%) |
Earnings by Sex by Educational Attainment in Tees Toh
Average earnings in Tees Toh are $29,135 for men and $32,589 for women, a difference of 10.6%. Men with an educational attainment of college or associate's degree enjoy the highest average annual earnings of $29,519, while those with college or associate's degree education earn the least with $29,519. Women with an educational attainment of college or associate's degree earn the most with the average annual earnings of $35,833, while those with less than high school education have the smallest earnings of $25,938.
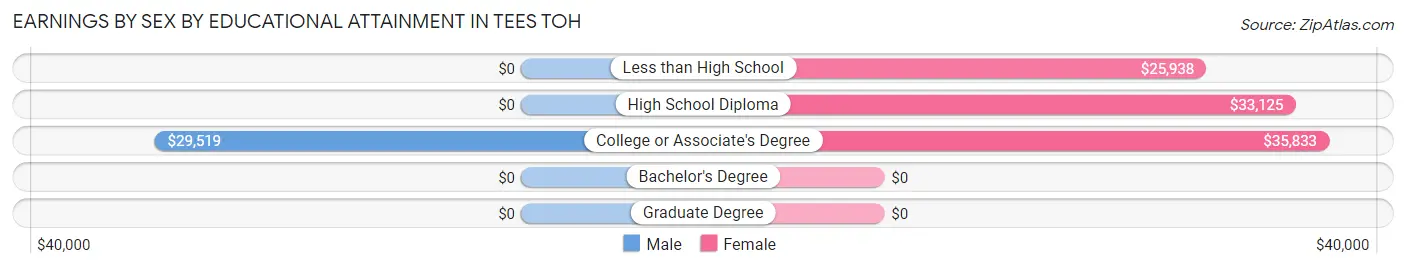
| Educational Attainment | Male Income | Female Income |
| Less than High School | - | - |
| High School Diploma | - | - |
| College or Associate's Degree | $29,519 | $35,833 |
| Bachelor's Degree | - | - |
| Graduate Degree | - | - |
| Total | $29,135 | $32,589 |
Family Income in Tees Toh
Family Income Brackets in Tees Toh
According to the Tees Toh family income data, there are 23 families falling into the $50,000 to $74,999 income range, which is the most common income bracket and makes up 28.7% of all families.
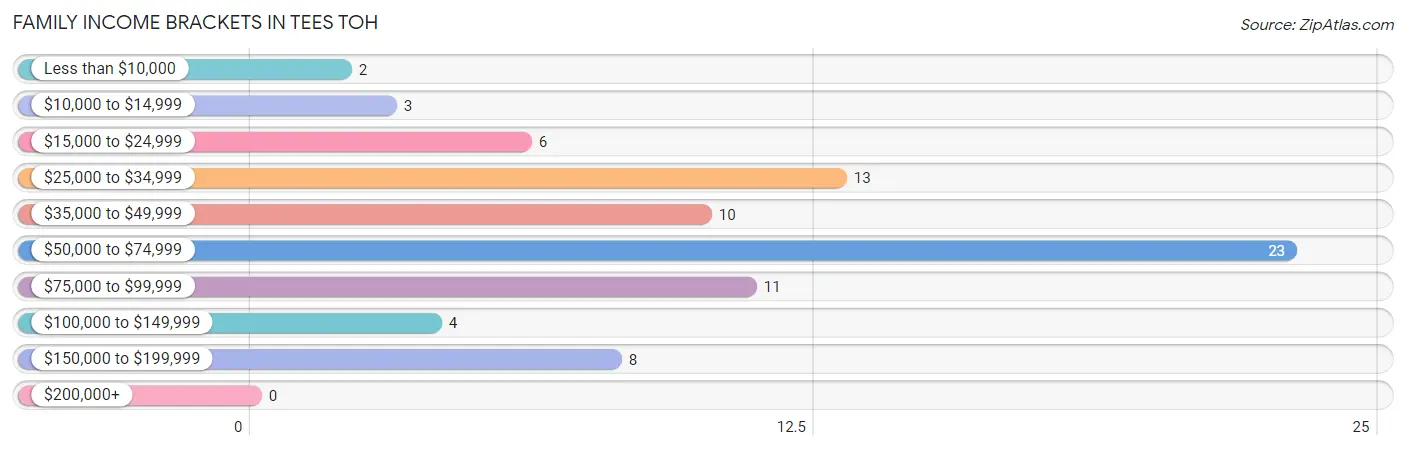
| Income Bracket | # Families | % Families |
| Less than $10,000 | 2 | 2.5% |
| $10,000 to $14,999 | 3 | 3.8% |
| $15,000 to $24,999 | 6 | 7.5% |
| $25,000 to $34,999 | 13 | 16.3% |
| $35,000 to $49,999 | 10 | 12.5% |
| $50,000 to $74,999 | 23 | 28.8% |
| $75,000 to $99,999 | 11 | 13.8% |
| $100,000 to $149,999 | 4 | 5.0% |
| $150,000 to $199,999 | 8 | 10.0% |
| $200,000+ | 0 | 0.0% |
Family Income by Famaliy Size in Tees Toh
7+ person families (10 | 12.5%) account for the highest median family income in Tees Toh with $116,875 per family, while 2-person families (15 | 18.8%) have the highest median income of $19,792 per family member.
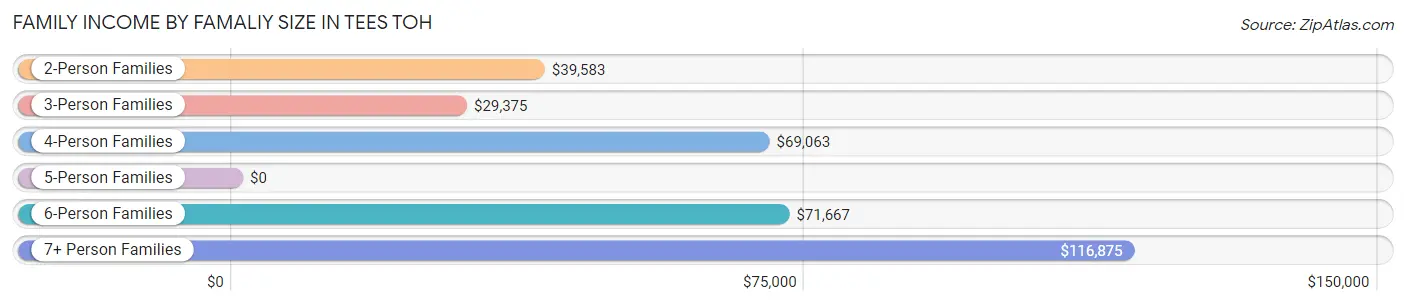
| Income Bracket | # Families | Median Income |
| 2-Person Families | 15 (18.8%) | $39,583 |
| 3-Person Families | 18 (22.5%) | $29,375 |
| 4-Person Families | 21 (26.3%) | $69,063 |
| 5-Person Families | 8 (10.0%) | $0 |
| 6-Person Families | 8 (10.0%) | $71,667 |
| 7+ Person Families | 10 (12.5%) | $116,875 |
| Total | 80 (100.0%) | $54,167 |
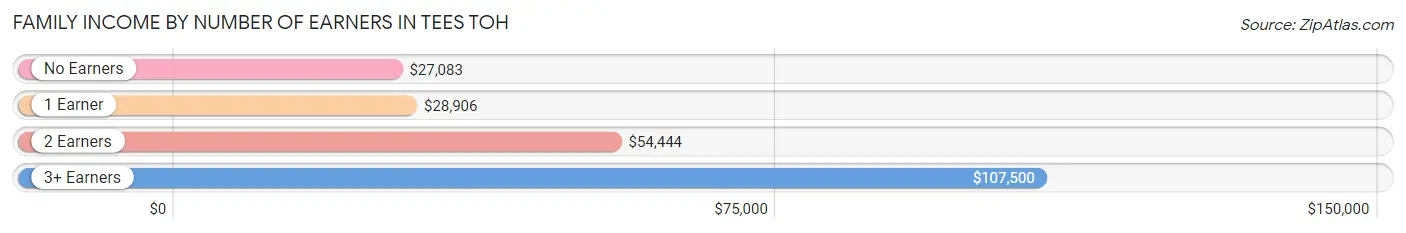
Family Income by Number of Earners in Tees Toh
The median family income in Tees Toh is $54,167, with families comprising 3+ earners (16) having the highest median family income of $107,500, while families with no earners (11) have the lowest median family income of $27,083, accounting for 20.0% and 13.8% of families, respectively.
| Number of Earners | # Families | Median Income |
| No Earners | 11 (13.8%) | $27,083 |
| 1 Earner | 23 (28.7%) | $28,906 |
| 2 Earners | 30 (37.5%) | $54,444 |
| 3+ Earners | 16 (20.0%) | $107,500 |
| Total | 80 (100.0%) | $54,167 |
Household Income in Tees Toh
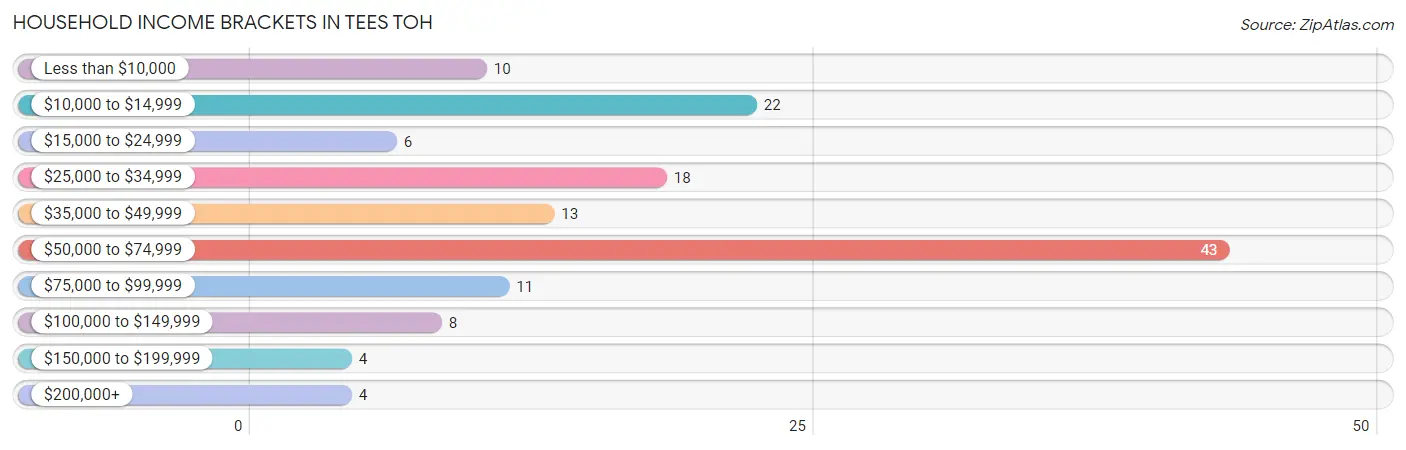
Household Income Brackets in Tees Toh
With 43 households falling in the category, the $50,000 to $74,999 income range is the most frequent in Tees Toh, accounting for 30.9% of all households. In contrast, only 4 households (2.9%) fall into the $150,000 to $199,999 income bracket, making it the least populous group.
| Income Bracket | # Households | % Households |
| Less than $10,000 | 10 | 7.2% |
| $10,000 to $14,999 | 22 | 15.8% |
| $15,000 to $24,999 | 6 | 4.3% |
| $25,000 to $34,999 | 18 | 12.9% |
| $35,000 to $49,999 | 13 | 9.4% |
| $50,000 to $74,999 | 43 | 30.9% |
| $75,000 to $99,999 | 11 | 7.9% |
| $100,000 to $149,999 | 8 | 5.8% |
| $150,000 to $199,999 | 4 | 2.9% |
| $200,000+ | 4 | 2.9% |
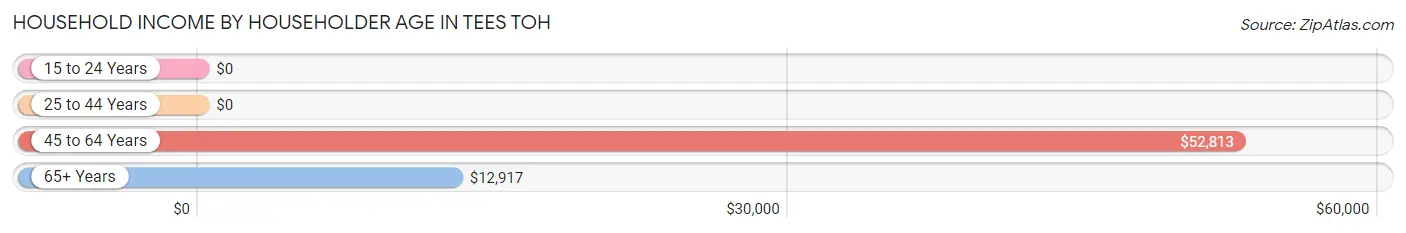
Household Income by Householder Age in Tees Toh
The median household income in Tees Toh is $52,639, with the highest median household income of $52,813 found in the 45 to 64 years age bracket for the primary householder. A total of 93 households (66.9%) fall into this category. Meanwhile, the 15 to 24 years age bracket for the primary householder has the lowest median household income of $0, with 4 households (2.9%) in this group.
| Income Bracket | # Households | Median Income |
| 15 to 24 Years | 4 (2.9%) | $0 |
| 25 to 44 Years | 21 (15.1%) | $0 |
| 45 to 64 Years | 93 (66.9%) | $52,813 |
| 65+ Years | 21 (15.1%) | $12,917 |
| Total | 139 (100.0%) | $52,639 |
Poverty in Tees Toh
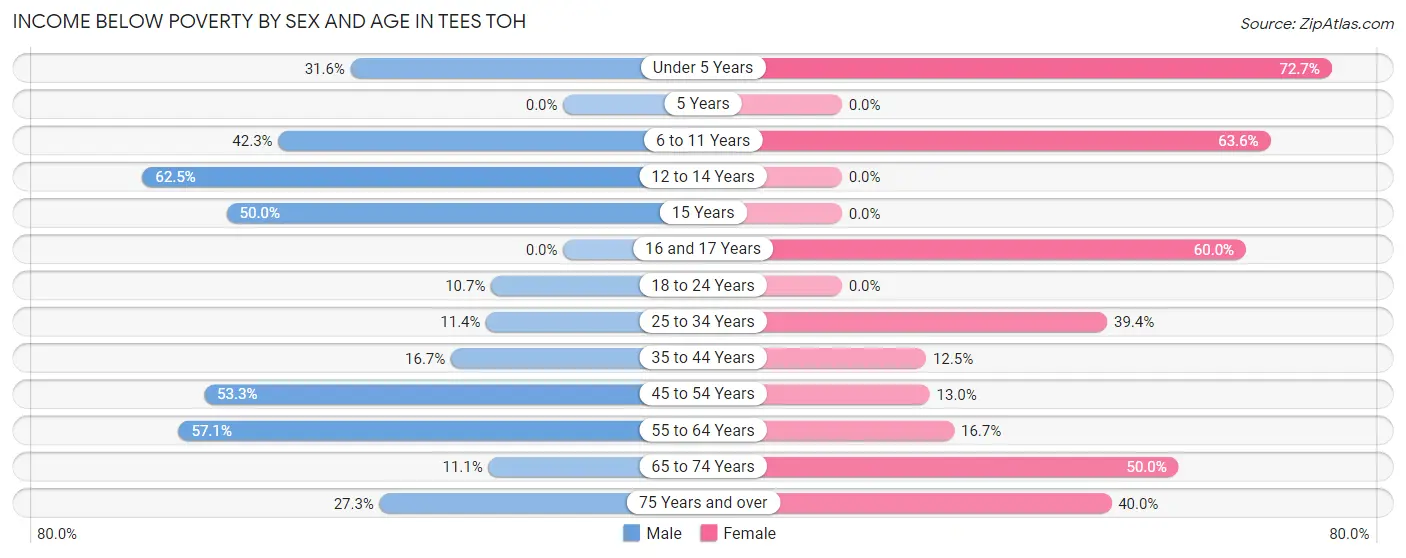
Income Below Poverty by Sex and Age in Tees Toh
With 27.9% poverty level for males and 26.4% for females among the residents of Tees Toh, 12 to 14 year old males and under 5 year old females are the most vulnerable to poverty, with 5 males (62.5%) and 8 females (72.7%) in their respective age groups living below the poverty level.
| Age Bracket | Male | Female |
| Under 5 Years | 6 (31.6%) | 8 (72.7%) |
| 5 Years | 0 (0.0%) | 0 (0.0%) |
| 6 to 11 Years | 11 (42.3%) | 7 (63.6%) |
| 12 to 14 Years | 5 (62.5%) | 0 (0.0%) |
| 15 Years | 3 (50.0%) | 0 (0.0%) |
| 16 and 17 Years | 0 (0.0%) | 6 (60.0%) |
| 18 to 24 Years | 3 (10.7%) | 0 (0.0%) |
| 25 to 34 Years | 4 (11.4%) | 13 (39.4%) |
| 35 to 44 Years | 6 (16.7%) | 3 (12.5%) |
| 45 to 54 Years | 8 (53.3%) | 3 (13.0%) |
| 55 to 64 Years | 16 (57.1%) | 9 (16.7%) |
| 65 to 74 Years | 2 (11.1%) | 3 (50.0%) |
| 75 Years and over | 3 (27.3%) | 4 (40.0%) |
| Total | 67 (27.9%) | 56 (26.4%) |
Income Above Poverty by Sex and Age in Tees Toh
According to the poverty statistics in Tees Toh, males aged 5 years and females aged 5 years are the age groups that are most secure financially, with 100.0% of males and 100.0% of females in these age groups living above the poverty line.
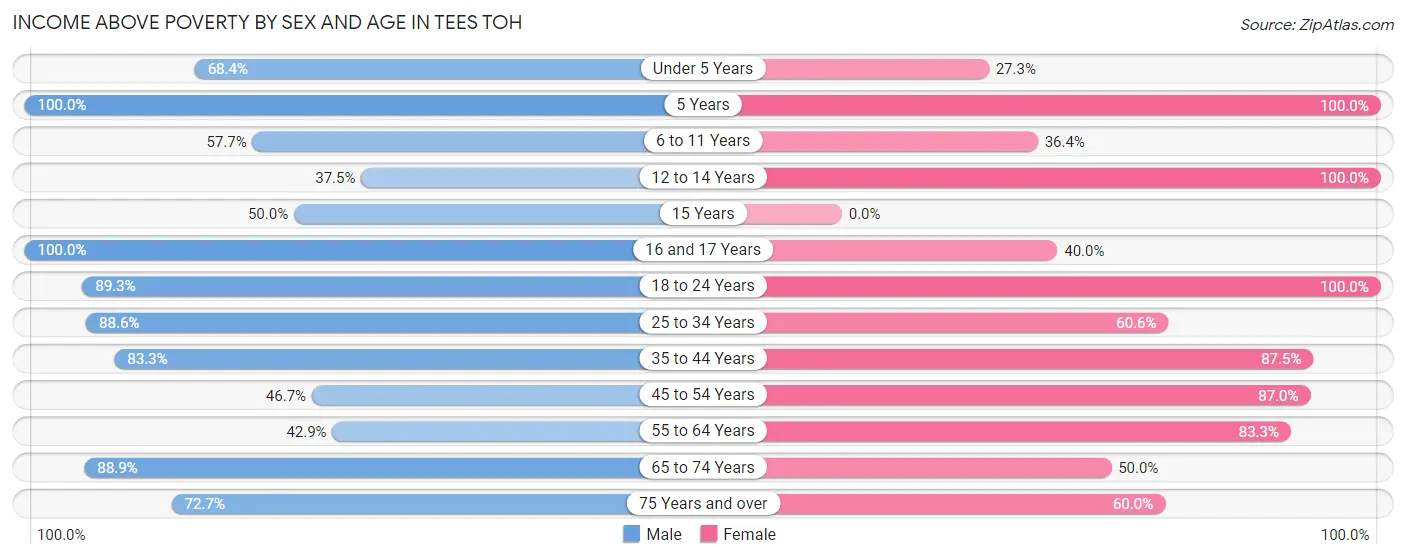
| Age Bracket | Male | Female |
| Under 5 Years | 13 (68.4%) | 3 (27.3%) |
| 5 Years | 3 (100.0%) | 7 (100.0%) |
| 6 to 11 Years | 15 (57.7%) | 4 (36.4%) |
| 12 to 14 Years | 3 (37.5%) | 13 (100.0%) |
| 15 Years | 3 (50.0%) | 0 (0.0%) |
| 16 and 17 Years | 7 (100.0%) | 4 (40.0%) |
| 18 to 24 Years | 25 (89.3%) | 10 (100.0%) |
| 25 to 34 Years | 31 (88.6%) | 20 (60.6%) |
| 35 to 44 Years | 30 (83.3%) | 21 (87.5%) |
| 45 to 54 Years | 7 (46.7%) | 20 (87.0%) |
| 55 to 64 Years | 12 (42.9%) | 45 (83.3%) |
| 65 to 74 Years | 16 (88.9%) | 3 (50.0%) |
| 75 Years and over | 8 (72.7%) | 6 (60.0%) |
| Total | 173 (72.1%) | 156 (73.6%) |
Income Below Poverty Among Married-Couple Families in Tees Toh
The poverty statistics for married-couple families in Tees Toh show that 20.0% or 8 of the total 40 families live below the poverty line. Families with 5 or more children have the highest poverty rate of 33.3%, comprising of 2 families. On the other hand, families with no children have the lowest poverty rate of 0.0%, which includes 0 families.
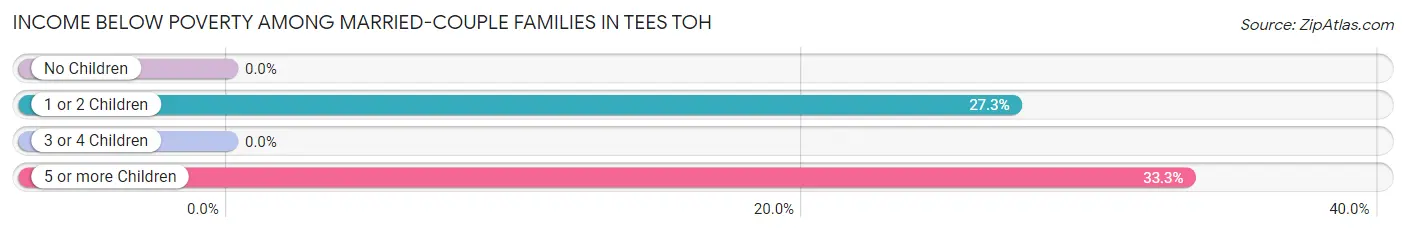
| Children | Above Poverty | Below Poverty |
| No Children | 12 (100.0%) | 0 (0.0%) |
| 1 or 2 Children | 16 (72.7%) | 6 (27.3%) |
| 3 or 4 Children | 0 (0.0%) | 0 (0.0%) |
| 5 or more Children | 4 (66.7%) | 2 (33.3%) |
| Total | 32 (80.0%) | 8 (20.0%) |
Income Below Poverty Among Single-Parent Households in Tees Toh
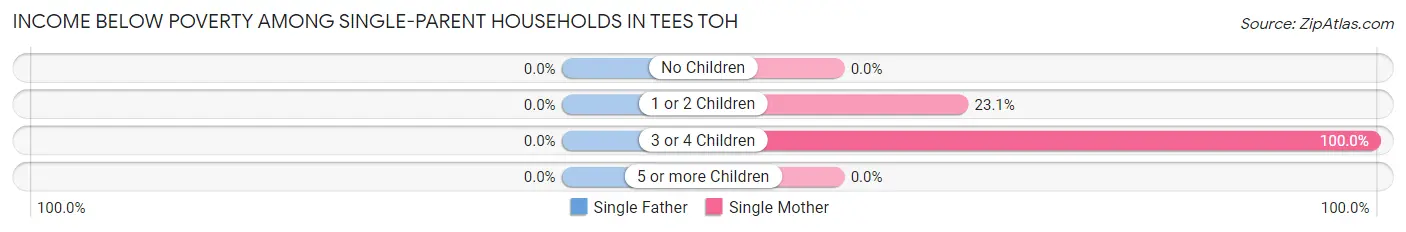
| Children | Single Father | Single Mother |
| No Children | 0 (0.0%) | 0 (0.0%) |
| 1 or 2 Children | 0 (0.0%) | 3 (23.1%) |
| 3 or 4 Children | 0 (0.0%) | 2 (100.0%) |
| 5 or more Children | 0 (0.0%) | 0 (0.0%) |
| Total | 0 (0.0%) | 5 (19.2%) |
Income Below Poverty Among Married-Couple vs Single-Parent Households in Tees Toh
The poverty data for Tees Toh shows that 8 of the married-couple family households (20.0%) and 5 of the single-parent households (12.5%) are living below the poverty level. Within the married-couple family households, those with 5 or more children have the highest poverty rate, with 2 households (33.3%) falling below the poverty line. Among the single-parent households, those with 3 or 4 children have the highest poverty rate, with 2 household (100.0%) living below poverty.
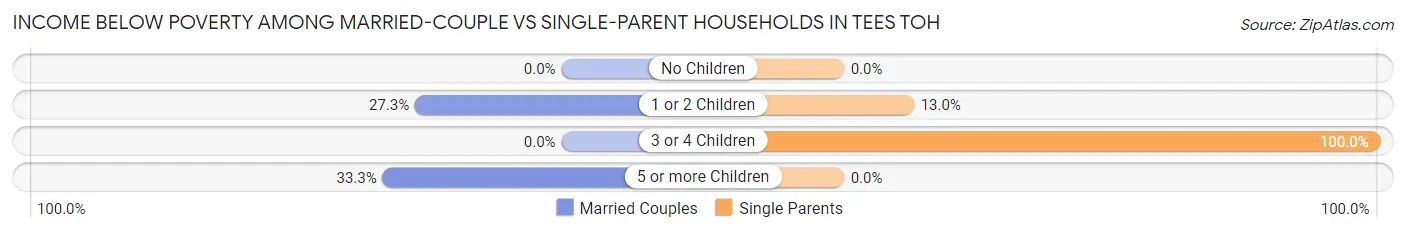
| Children | Married-Couple Families | Single-Parent Households |
| No Children | 0 (0.0%) | 0 (0.0%) |
| 1 or 2 Children | 6 (27.3%) | 3 (13.0%) |
| 3 or 4 Children | 0 (0.0%) | 2 (100.0%) |
| 5 or more Children | 2 (33.3%) | 0 (0.0%) |
| Total | 8 (20.0%) | 5 (12.5%) |
Employment Characteristics in Tees Toh
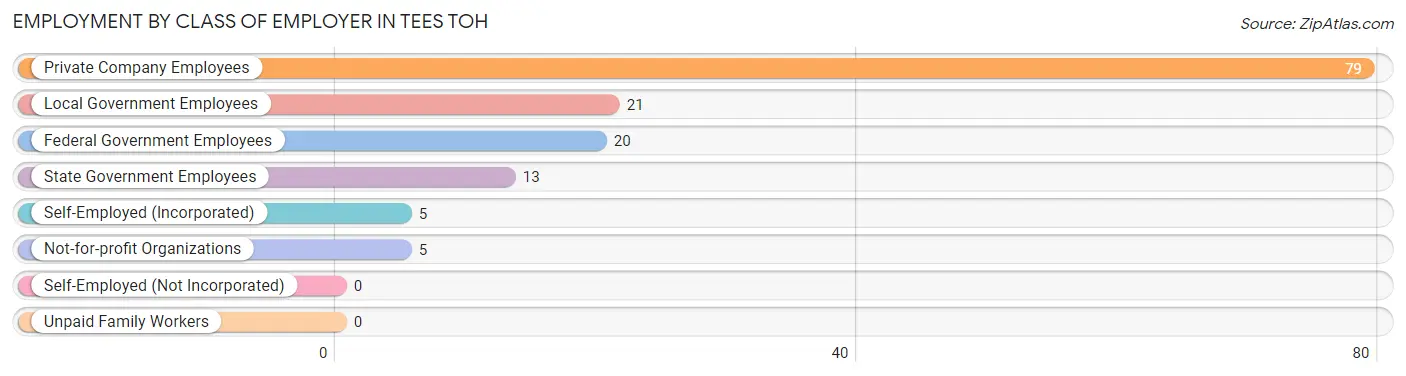
Employment by Class of Employer in Tees Toh
Among the 143 employed individuals in Tees Toh, private company employees (79 | 55.2%), local government employees (21 | 14.7%), and federal government employees (20 | 14.0%) make up the most common classes of employment.
| Employer Class | # Employees | % Employees |
| Private Company Employees | 79 | 55.2% |
| Self-Employed (Incorporated) | 5 | 3.5% |
| Self-Employed (Not Incorporated) | 0 | 0.0% |
| Not-for-profit Organizations | 5 | 3.5% |
| Local Government Employees | 21 | 14.7% |
| State Government Employees | 13 | 9.1% |
| Federal Government Employees | 20 | 14.0% |
| Unpaid Family Workers | 0 | 0.0% |
| Total | 143 | 100.0% |
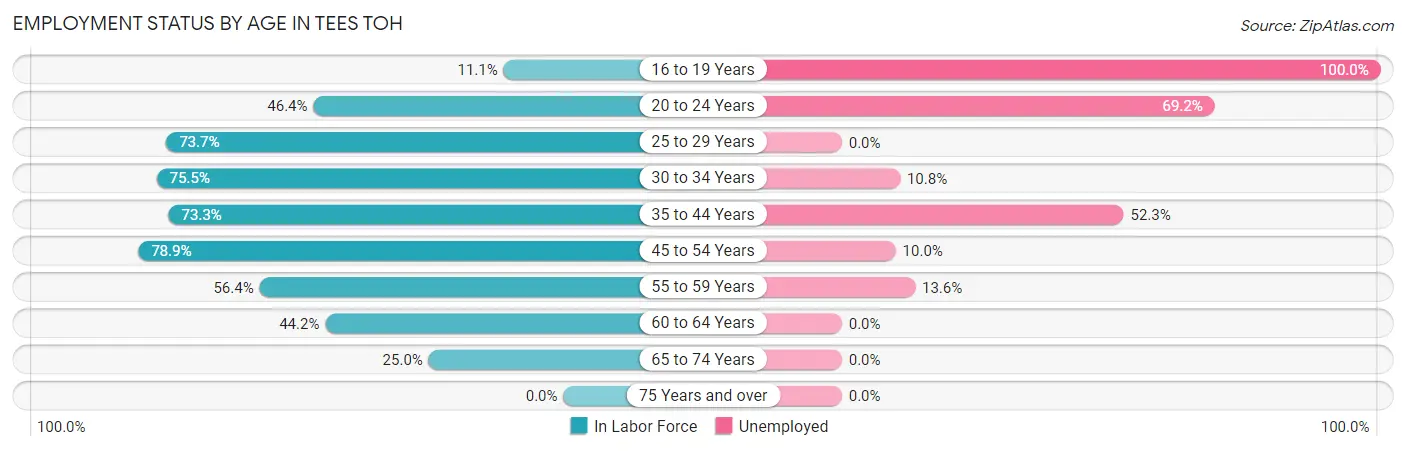
Employment Status by Age in Tees Toh
According to the labor force statistics for Tees Toh, out of the total population over 16 years of age (348), 54.0% or 188 individuals are in the labor force, with 23.9% or 45 of them unemployed. The age group with the highest labor force participation rate is 45 to 54 years, with 78.9% or 30 individuals in the labor force. Within the labor force, the 16 to 19 years age range has the highest percentage of unemployed individuals, with 100.0% or 3 of them being unemployed.
| Age Bracket | In Labor Force | Unemployed |
| 16 to 19 Years | 3 (11.1%) | 3 (100.0%) |
| 20 to 24 Years | 13 (46.4%) | 9 (69.2%) |
| 25 to 29 Years | 14 (73.7%) | 0 (0.0%) |
| 30 to 34 Years | 37 (75.5%) | 4 (10.8%) |
| 35 to 44 Years | 44 (73.3%) | 23 (52.3%) |
| 45 to 54 Years | 30 (78.9%) | 3 (10.0%) |
| 55 to 59 Years | 22 (56.4%) | 3 (13.6%) |
| 60 to 64 Years | 19 (44.2%) | 0 (0.0%) |
| 65 to 74 Years | 6 (25.0%) | 0 (0.0%) |
| 75 Years and over | 0 (0.0%) | 0 (0.0%) |
| Total | 188 (54.0%) | 45 (23.9%) |
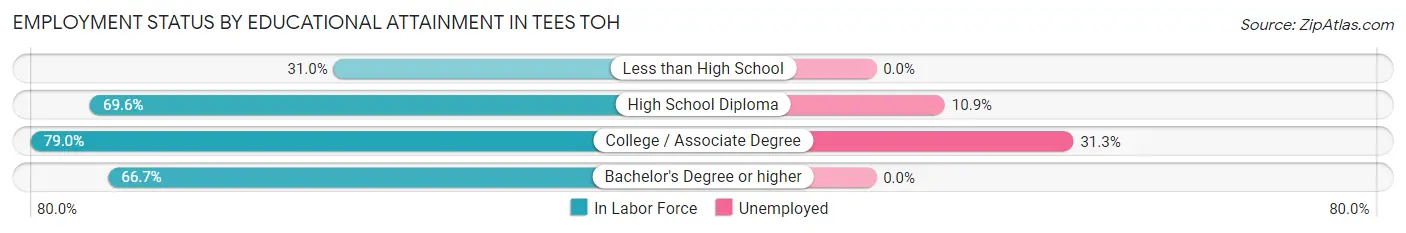
Employment Status by Educational Attainment in Tees Toh
According to labor force statistics for Tees Toh, 66.9% of individuals (166) out of the total population between 25 and 64 years of age (248) are in the labor force, with 19.9% or 33 of them being unemployed. The group with the highest labor force participation rate are those with the educational attainment of college / associate degree, with 79.0% or 83 individuals in the labor force. Within the labor force, individuals with college / associate degree education have the highest percentage of unemployment, with 31.3% or 26 of them being unemployed.
| Educational Attainment | In Labor Force | Unemployed |
| Less than High School | 13 (31.0%) | 0 (0.0%) |
| High School Diploma | 64 (69.6%) | 10 (10.9%) |
| College / Associate Degree | 83 (79.0%) | 33 (31.3%) |
| Bachelor's Degree or higher | 6 (66.7%) | 0 (0.0%) |
| Total | 166 (66.9%) | 49 (19.9%) |
Employment Occupations by Sex in Tees Toh
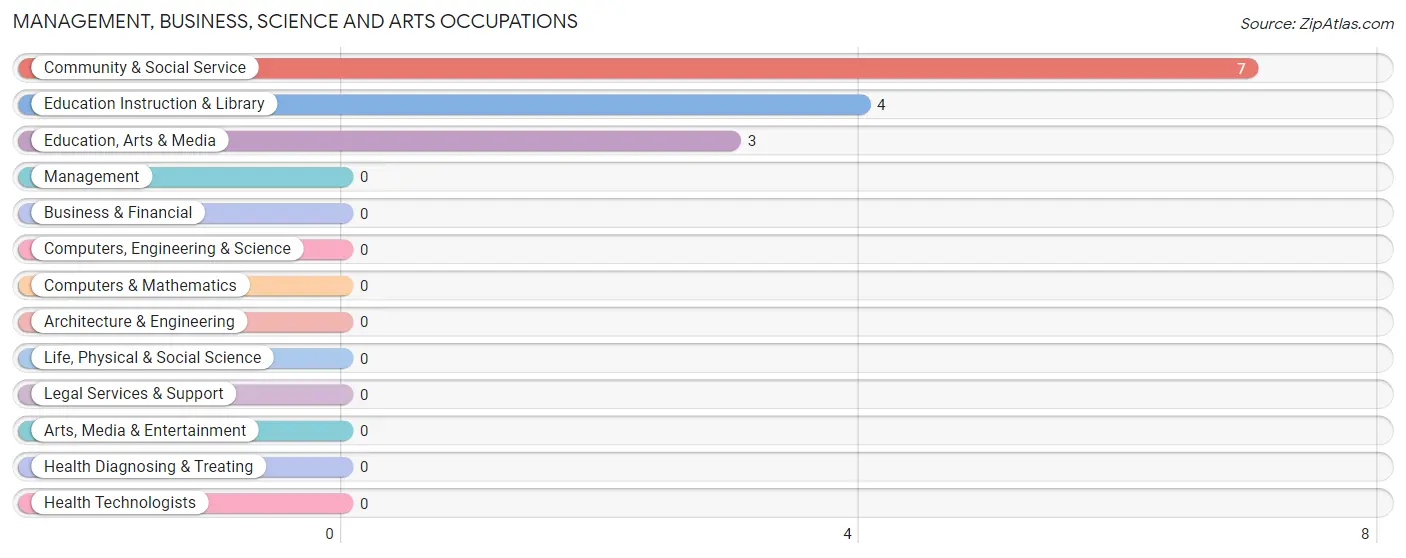
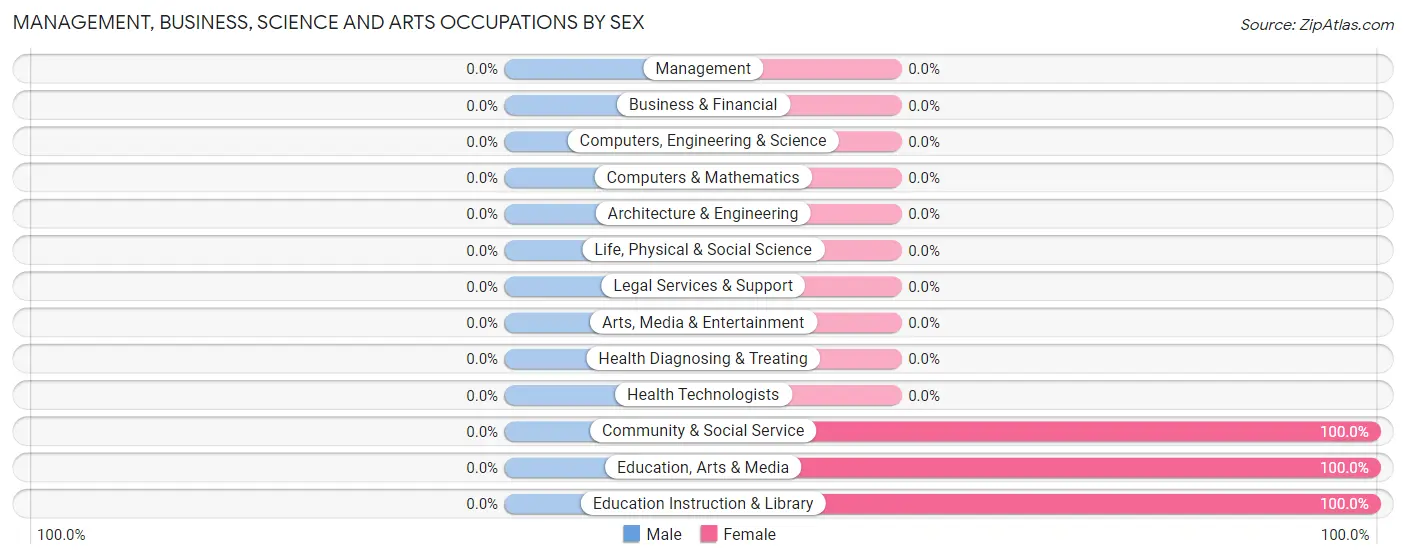
Management, Business, Science and Arts Occupations
The most common Management, Business, Science and Arts occupations in Tees Toh are Community & Social Service (7 | 4.9%), Education Instruction & Library (4 | 2.8%), and Education, Arts & Media (3 | 2.1%).
Management, Business, Science and Arts Occupations by Sex
| Occupation | Male | Female |
| Management | 0 (0.0%) | 0 (0.0%) |
| Business & Financial | 0 (0.0%) | 0 (0.0%) |
| Computers, Engineering & Science | 0 (0.0%) | 0 (0.0%) |
| Computers & Mathematics | 0 (0.0%) | 0 (0.0%) |
| Architecture & Engineering | 0 (0.0%) | 0 (0.0%) |
| Life, Physical & Social Science | 0 (0.0%) | 0 (0.0%) |
| Community & Social Service | 0 (0.0%) | 7 (100.0%) |
| Education, Arts & Media | 0 (0.0%) | 3 (100.0%) |
| Legal Services & Support | 0 (0.0%) | 0 (0.0%) |
| Education Instruction & Library | 0 (0.0%) | 4 (100.0%) |
| Arts, Media & Entertainment | 0 (0.0%) | 0 (0.0%) |
| Health Diagnosing & Treating | 0 (0.0%) | 0 (0.0%) |
| Health Technologists | 0 (0.0%) | 0 (0.0%) |
| Total (Category) | 0 (0.0%) | 7 (100.0%) |
| Total (Overall) | 51 (35.7%) | 92 (64.3%) |
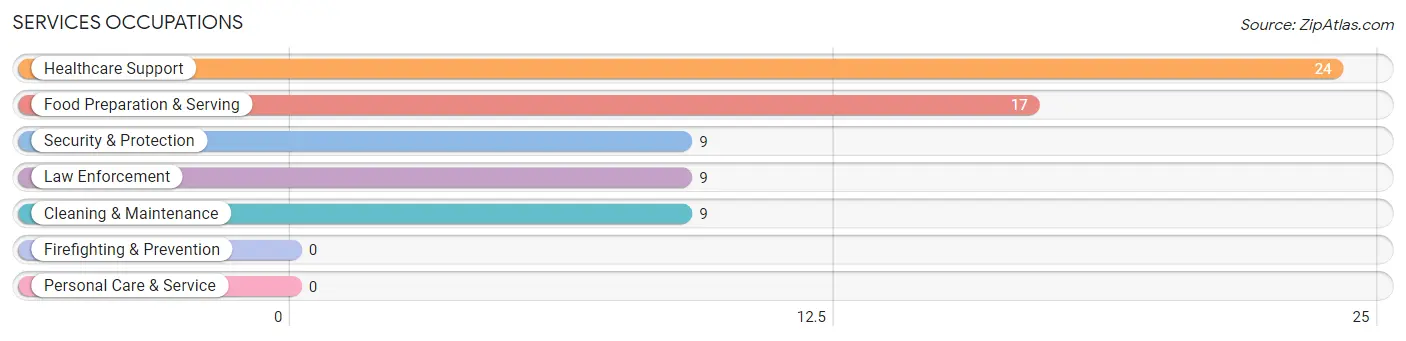
Services Occupations
The most common Services occupations in Tees Toh are Healthcare Support (24 | 16.8%), Food Preparation & Serving (17 | 11.9%), Security & Protection (9 | 6.3%), Law Enforcement (9 | 6.3%), and Cleaning & Maintenance (9 | 6.3%).
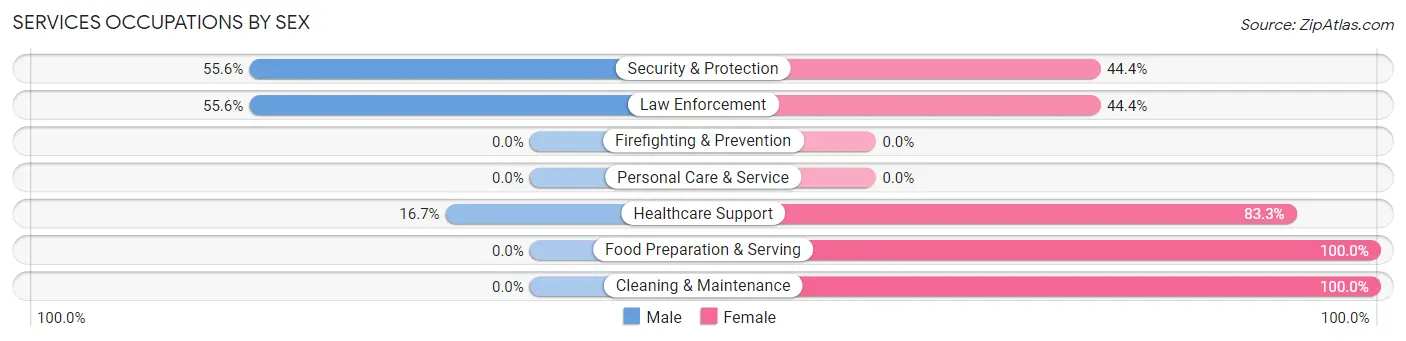
Services Occupations by Sex
Within the Services occupations in Tees Toh, the most male-oriented occupations are Security & Protection (55.6%), Law Enforcement (55.6%), and Healthcare Support (16.7%), while the most female-oriented occupations are Food Preparation & Serving (100.0%), Cleaning & Maintenance (100.0%), and Healthcare Support (83.3%).
| Occupation | Male | Female |
| Healthcare Support | 4 (16.7%) | 20 (83.3%) |
| Security & Protection | 5 (55.6%) | 4 (44.4%) |
| Firefighting & Prevention | 0 (0.0%) | 0 (0.0%) |
| Law Enforcement | 5 (55.6%) | 4 (44.4%) |
| Food Preparation & Serving | 0 (0.0%) | 17 (100.0%) |
| Cleaning & Maintenance | 0 (0.0%) | 9 (100.0%) |
| Personal Care & Service | 0 (0.0%) | 0 (0.0%) |
| Total (Category) | 9 (15.2%) | 50 (84.8%) |
| Total (Overall) | 51 (35.7%) | 92 (64.3%) |
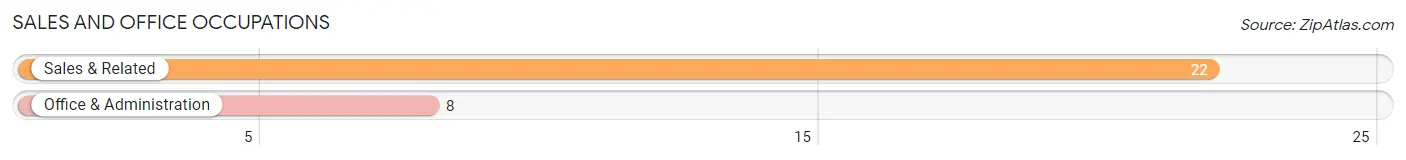
Sales and Office Occupations
The most common Sales and Office occupations in Tees Toh are Sales & Related (22 | 15.4%), and Office & Administration (8 | 5.6%).
Sales and Office Occupations by Sex

| Occupation | Male | Female |
| Sales & Related | 9 (40.9%) | 13 (59.1%) |
| Office & Administration | 0 (0.0%) | 8 (100.0%) |
| Total (Category) | 9 (30.0%) | 21 (70.0%) |
| Total (Overall) | 51 (35.7%) | 92 (64.3%) |
Natural Resources, Construction and Maintenance Occupations
The most common Natural Resources, Construction and Maintenance occupations in Tees Toh are , and Construction & Extraction (18 | 12.6%).
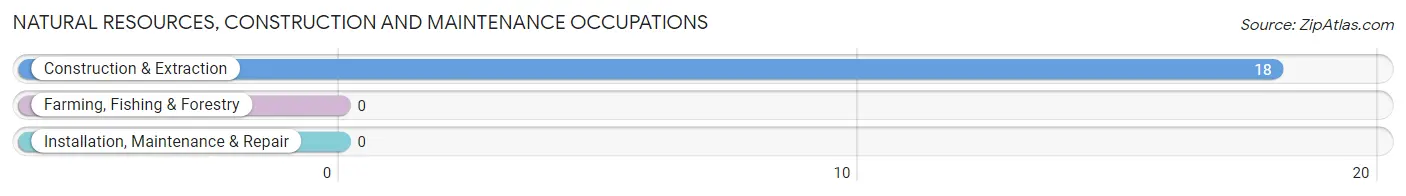
Natural Resources, Construction and Maintenance Occupations by Sex
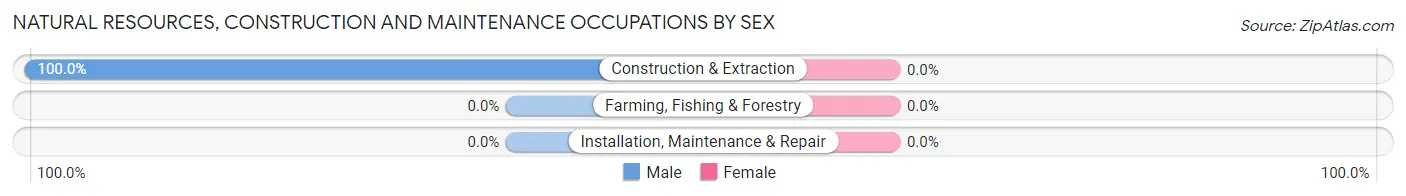
| Occupation | Male | Female |
| Farming, Fishing & Forestry | 0 (0.0%) | 0 (0.0%) |
| Construction & Extraction | 18 (100.0%) | 0 (0.0%) |
| Installation, Maintenance & Repair | 0 (0.0%) | 0 (0.0%) |
| Total (Category) | 18 (100.0%) | 0 (0.0%) |
| Total (Overall) | 51 (35.7%) | 92 (64.3%) |
Production, Transportation and Moving Occupations
The most common Production, Transportation and Moving occupations in Tees Toh are Transportation (19 | 13.3%), Production (6 | 4.2%), and Material Moving (4 | 2.8%).
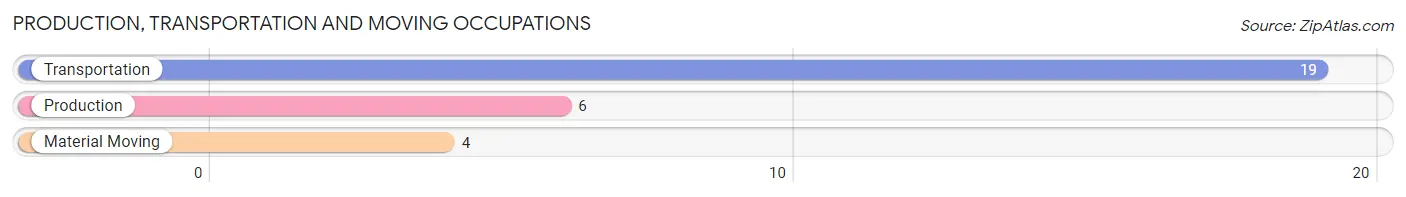
Production, Transportation and Moving Occupations by Sex
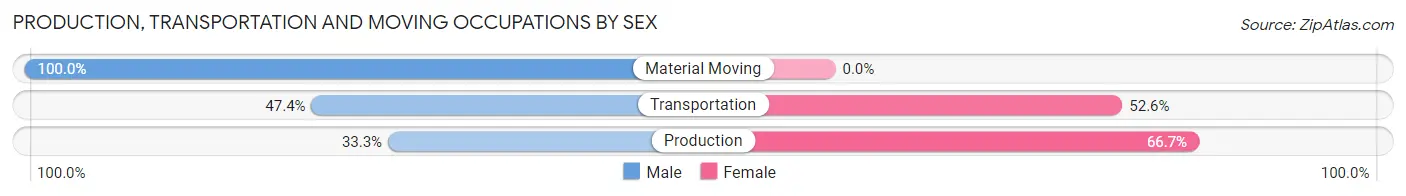
| Occupation | Male | Female |
| Production | 2 (33.3%) | 4 (66.7%) |
| Transportation | 9 (47.4%) | 10 (52.6%) |
| Material Moving | 4 (100.0%) | 0 (0.0%) |
| Total (Category) | 15 (51.7%) | 14 (48.3%) |
| Total (Overall) | 51 (35.7%) | 92 (64.3%) |
Employment Industries by Sex in Tees Toh
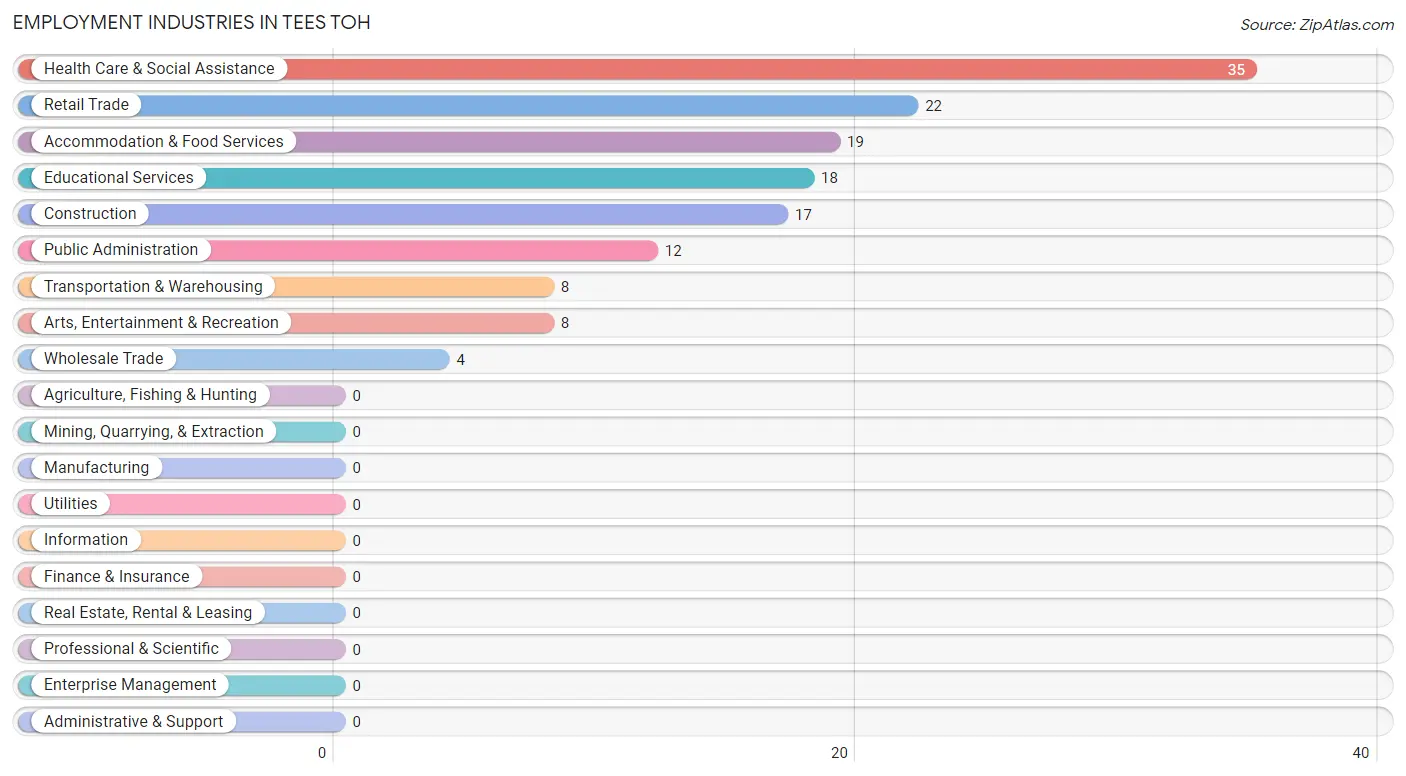
Employment Industries in Tees Toh
The major employment industries in Tees Toh include Health Care & Social Assistance (35 | 24.5%), Retail Trade (22 | 15.4%), Accommodation & Food Services (19 | 13.3%), Educational Services (18 | 12.6%), and Construction (17 | 11.9%).
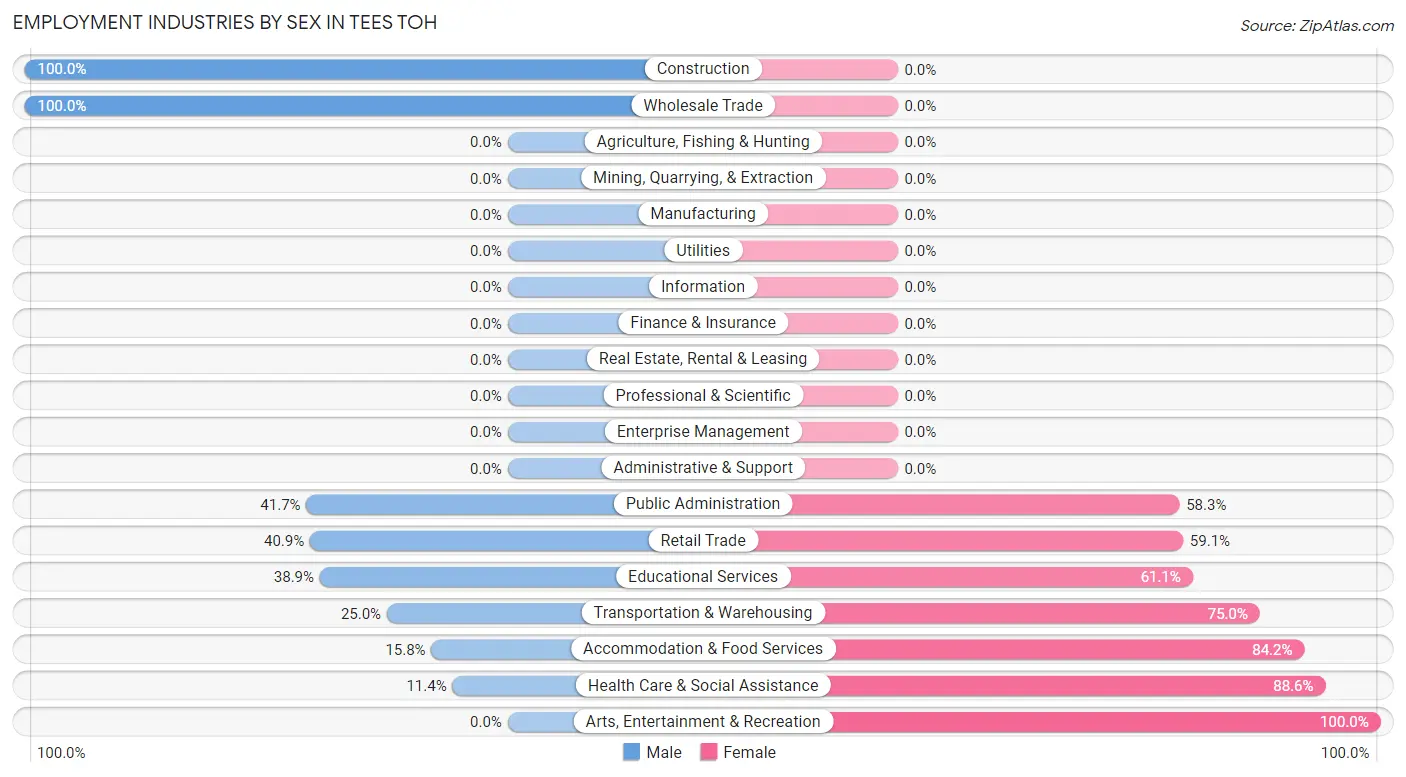
Employment Industries by Sex in Tees Toh
The Tees Toh industries that see more men than women are Construction (100.0%), Wholesale Trade (100.0%), and Public Administration (41.7%), whereas the industries that tend to have a higher number of women are Arts, Entertainment & Recreation (100.0%), Health Care & Social Assistance (88.6%), and Accommodation & Food Services (84.2%).
| Industry | Male | Female |
| Agriculture, Fishing & Hunting | 0 (0.0%) | 0 (0.0%) |
| Mining, Quarrying, & Extraction | 0 (0.0%) | 0 (0.0%) |
| Construction | 17 (100.0%) | 0 (0.0%) |
| Manufacturing | 0 (0.0%) | 0 (0.0%) |
| Wholesale Trade | 4 (100.0%) | 0 (0.0%) |
| Retail Trade | 9 (40.9%) | 13 (59.1%) |
| Transportation & Warehousing | 2 (25.0%) | 6 (75.0%) |
| Utilities | 0 (0.0%) | 0 (0.0%) |
| Information | 0 (0.0%) | 0 (0.0%) |
| Finance & Insurance | 0 (0.0%) | 0 (0.0%) |
| Real Estate, Rental & Leasing | 0 (0.0%) | 0 (0.0%) |
| Professional & Scientific | 0 (0.0%) | 0 (0.0%) |
| Enterprise Management | 0 (0.0%) | 0 (0.0%) |
| Administrative & Support | 0 (0.0%) | 0 (0.0%) |
| Educational Services | 7 (38.9%) | 11 (61.1%) |
| Health Care & Social Assistance | 4 (11.4%) | 31 (88.6%) |
| Arts, Entertainment & Recreation | 0 (0.0%) | 8 (100.0%) |
| Accommodation & Food Services | 3 (15.8%) | 16 (84.2%) |
| Public Administration | 5 (41.7%) | 7 (58.3%) |
| Total | 51 (35.7%) | 92 (64.3%) |
Education in Tees Toh
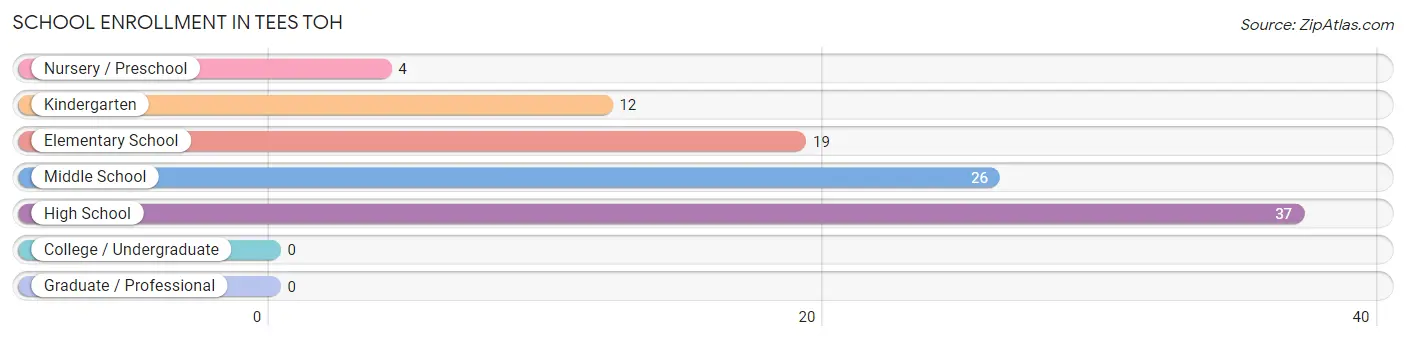
School Enrollment in Tees Toh
The most common levels of schooling among the 98 students in Tees Toh are high school (37 | 37.8%), middle school (26 | 26.5%), and elementary school (19 | 19.4%).
| School Level | # Students | % Students |
| Nursery / Preschool | 4 | 4.1% |
| Kindergarten | 12 | 12.2% |
| Elementary School | 19 | 19.4% |
| Middle School | 26 | 26.5% |
| High School | 37 | 37.8% |
| College / Undergraduate | 0 | 0.0% |
| Graduate / Professional | 0 | 0.0% |
| Total | 98 | 100.0% |
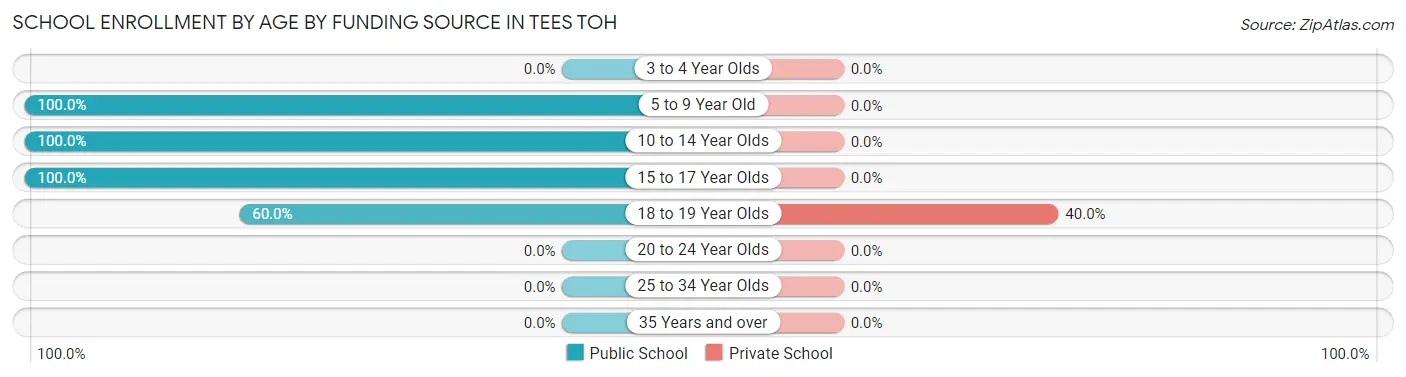
School Enrollment by Age by Funding Source in Tees Toh
Out of a total of 98 students who are enrolled in schools in Tees Toh, 4 (4.1%) attend a private institution, while the remaining 94 (95.9%) are enrolled in public schools. The age group of 18 to 19 year olds has the highest likelihood of being enrolled in private schools, with 4 (40.0% in the age bracket) enrolled. Conversely, the age group of 5 to 9 year old has the lowest likelihood of being enrolled in a private school, with 28 (100.0% in the age bracket) attending a public institution.
| Age Bracket | Public School | Private School |
| 3 to 4 Year Olds | 0 (0.0%) | 0 (0.0%) |
| 5 to 9 Year Old | 28 (100.0%) | 0 (0.0%) |
| 10 to 14 Year Olds | 40 (100.0%) | 0 (0.0%) |
| 15 to 17 Year Olds | 20 (100.0%) | 0 (0.0%) |
| 18 to 19 Year Olds | 6 (60.0%) | 4 (40.0%) |
| 20 to 24 Year Olds | 0 (0.0%) | 0 (0.0%) |
| 25 to 34 Year Olds | 0 (0.0%) | 0 (0.0%) |
| 35 Years and over | 0 (0.0%) | 0 (0.0%) |
| Total | 94 (95.9%) | 4 (4.1%) |
Educational Attainment by Field of Study in Tees Toh
Business (3 | 33.3%), education (3 | 33.3%), and arts & humanities (3 | 33.3%) are the most common fields of study among 9 individuals in Tees Toh who have obtained a bachelor's degree or higher.
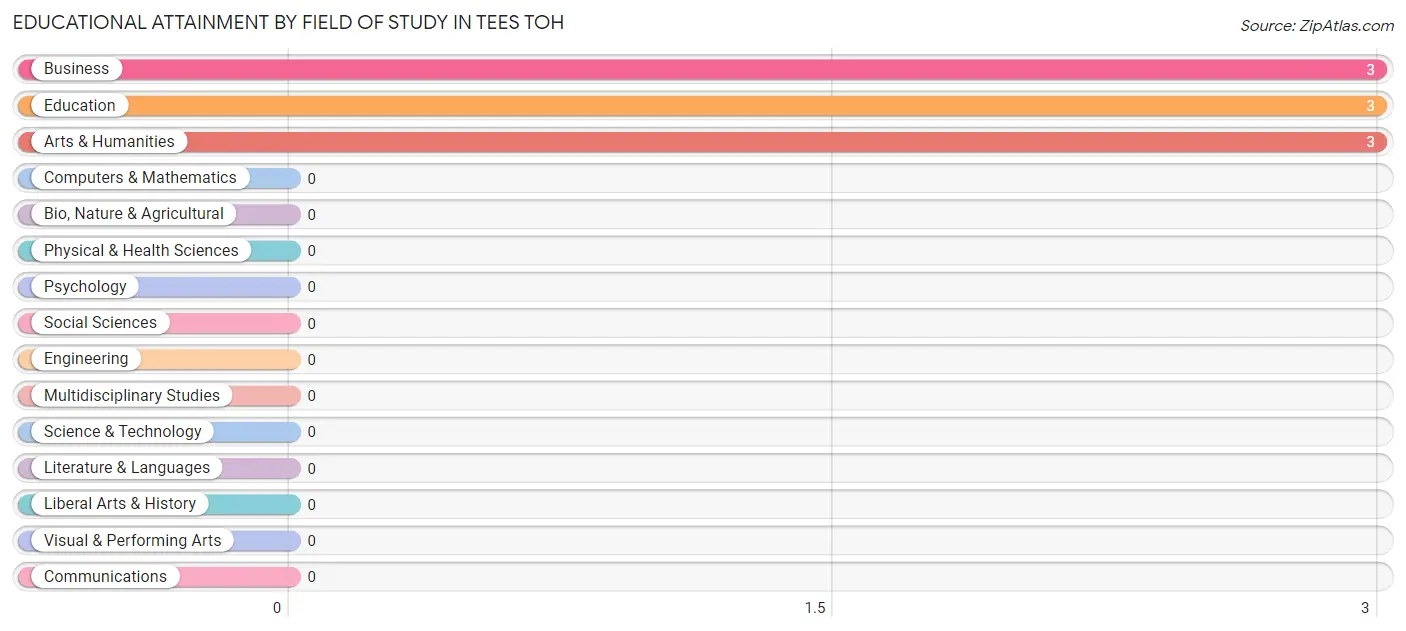
| Field of Study | # Graduates | % Graduates |
| Computers & Mathematics | 0 | 0.0% |
| Bio, Nature & Agricultural | 0 | 0.0% |
| Physical & Health Sciences | 0 | 0.0% |
| Psychology | 0 | 0.0% |
| Social Sciences | 0 | 0.0% |
| Engineering | 0 | 0.0% |
| Multidisciplinary Studies | 0 | 0.0% |
| Science & Technology | 0 | 0.0% |
| Business | 3 | 33.3% |
| Education | 3 | 33.3% |
| Literature & Languages | 0 | 0.0% |
| Liberal Arts & History | 0 | 0.0% |
| Visual & Performing Arts | 0 | 0.0% |
| Communications | 0 | 0.0% |
| Arts & Humanities | 3 | 33.3% |
| Total | 9 | 100.0% |
Transportation & Commute in Tees Toh
Vehicle Availability by Sex in Tees Toh
The most prevalent vehicle ownership categories in Tees Toh are males with 4 vehicles (22, accounting for 43.1%) and females with 4 vehicles (29, making up 23.9%).
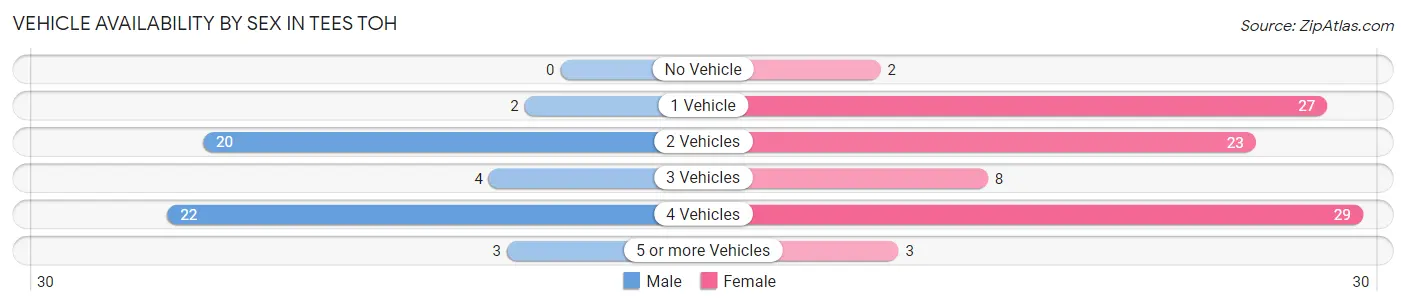
| Vehicles Available | Male | Female |
| No Vehicle | 0 (0.0%) | 2 (2.2%) |
| 1 Vehicle | 2 (3.9%) | 27 (29.3%) |
| 2 Vehicles | 20 (39.2%) | 23 (25.0%) |
| 3 Vehicles | 4 (7.8%) | 8 (8.7%) |
| 4 Vehicles | 22 (43.1%) | 29 (31.5%) |
| 5 or more Vehicles | 3 (5.9%) | 3 (3.3%) |
| Total | 51 (100.0%) | 92 (100.0%) |
Commute Time in Tees Toh
The most frequently occuring commute durations in Tees Toh are 60 to 89 minutes (35 commuters, 26.5%), 90 or more minutes (35 commuters, 26.5%), and 15 to 19 minutes (14 commuters, 10.6%).
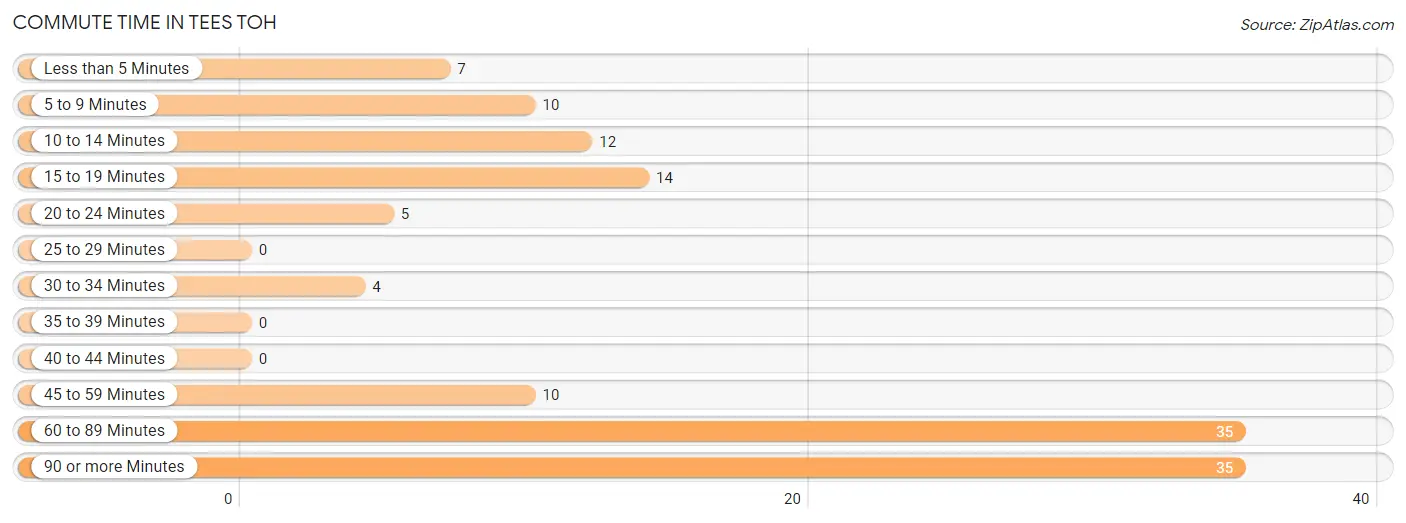
| Commute Time | # Commuters | % Commuters |
| Less than 5 Minutes | 7 | 5.3% |
| 5 to 9 Minutes | 10 | 7.6% |
| 10 to 14 Minutes | 12 | 9.1% |
| 15 to 19 Minutes | 14 | 10.6% |
| 20 to 24 Minutes | 5 | 3.8% |
| 25 to 29 Minutes | 0 | 0.0% |
| 30 to 34 Minutes | 4 | 3.0% |
| 35 to 39 Minutes | 0 | 0.0% |
| 40 to 44 Minutes | 0 | 0.0% |
| 45 to 59 Minutes | 10 | 7.6% |
| 60 to 89 Minutes | 35 | 26.5% |
| 90 or more Minutes | 35 | 26.5% |
Commute Time by Sex in Tees Toh
The most common commute times in Tees Toh are 15 to 19 minutes (12 commuters, 23.5%) for males and 60 to 89 minutes (30 commuters, 37.0%) for females.
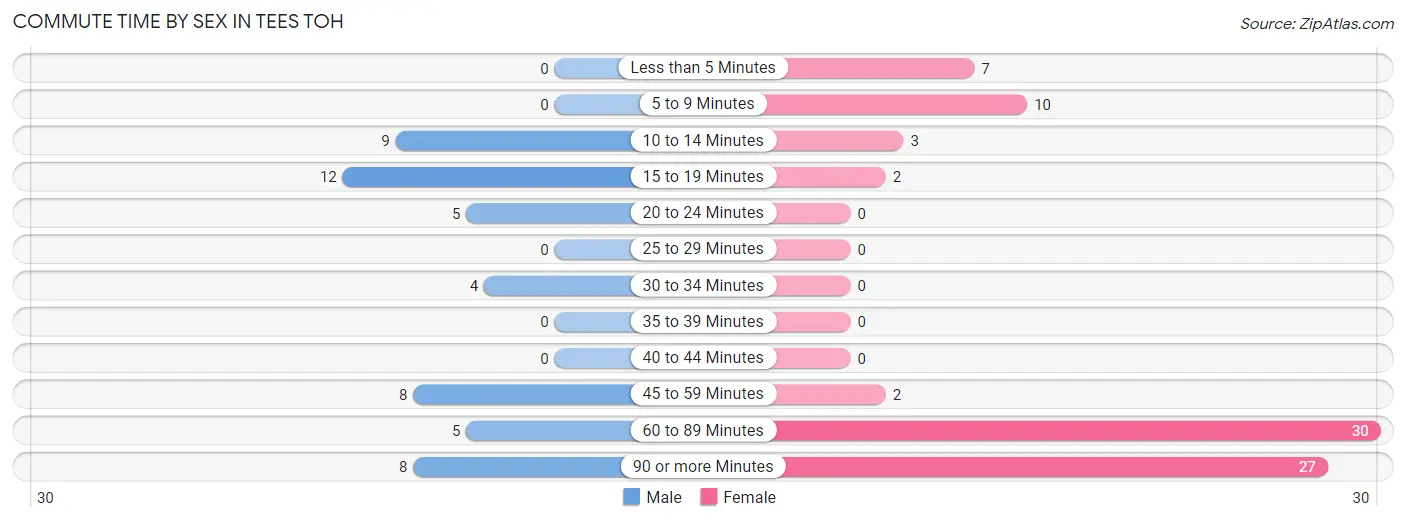
| Commute Time | Male | Female |
| Less than 5 Minutes | 0 (0.0%) | 7 (8.6%) |
| 5 to 9 Minutes | 0 (0.0%) | 10 (12.3%) |
| 10 to 14 Minutes | 9 (17.6%) | 3 (3.7%) |
| 15 to 19 Minutes | 12 (23.5%) | 2 (2.5%) |
| 20 to 24 Minutes | 5 (9.8%) | 0 (0.0%) |
| 25 to 29 Minutes | 0 (0.0%) | 0 (0.0%) |
| 30 to 34 Minutes | 4 (7.8%) | 0 (0.0%) |
| 35 to 39 Minutes | 0 (0.0%) | 0 (0.0%) |
| 40 to 44 Minutes | 0 (0.0%) | 0 (0.0%) |
| 45 to 59 Minutes | 8 (15.7%) | 2 (2.5%) |
| 60 to 89 Minutes | 5 (9.8%) | 30 (37.0%) |
| 90 or more Minutes | 8 (15.7%) | 27 (33.3%) |
Time of Departure to Work by Sex in Tees Toh
The most frequent times of departure to work in Tees Toh are 7:00 AM to 7:29 AM (14, 27.5%) for males and 6:00 AM to 6:29 AM (16, 19.8%) for females.
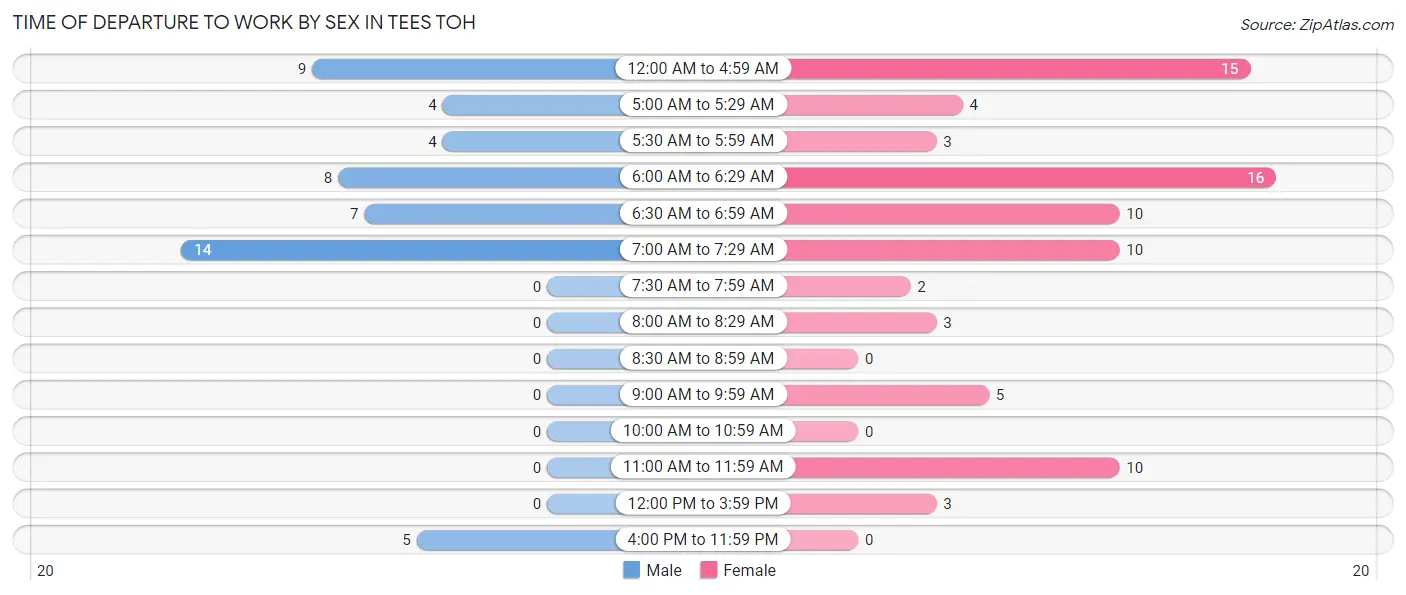
| Time of Departure | Male | Female |
| 12:00 AM to 4:59 AM | 9 (17.6%) | 15 (18.5%) |
| 5:00 AM to 5:29 AM | 4 (7.8%) | 4 (4.9%) |
| 5:30 AM to 5:59 AM | 4 (7.8%) | 3 (3.7%) |
| 6:00 AM to 6:29 AM | 8 (15.7%) | 16 (19.8%) |
| 6:30 AM to 6:59 AM | 7 (13.7%) | 10 (12.3%) |
| 7:00 AM to 7:29 AM | 14 (27.5%) | 10 (12.3%) |
| 7:30 AM to 7:59 AM | 0 (0.0%) | 2 (2.5%) |
| 8:00 AM to 8:29 AM | 0 (0.0%) | 3 (3.7%) |
| 8:30 AM to 8:59 AM | 0 (0.0%) | 0 (0.0%) |
| 9:00 AM to 9:59 AM | 0 (0.0%) | 5 (6.2%) |
| 10:00 AM to 10:59 AM | 0 (0.0%) | 0 (0.0%) |
| 11:00 AM to 11:59 AM | 0 (0.0%) | 10 (12.3%) |
| 12:00 PM to 3:59 PM | 0 (0.0%) | 3 (3.7%) |
| 4:00 PM to 11:59 PM | 5 (9.8%) | 0 (0.0%) |
| Total | 51 (100.0%) | 81 (100.0%) |
Housing Occupancy in Tees Toh
Occupancy by Ownership in Tees Toh
Of the total 139 dwellings in Tees Toh, owner-occupied units account for 101 (72.7%), while renter-occupied units make up 38 (27.3%).
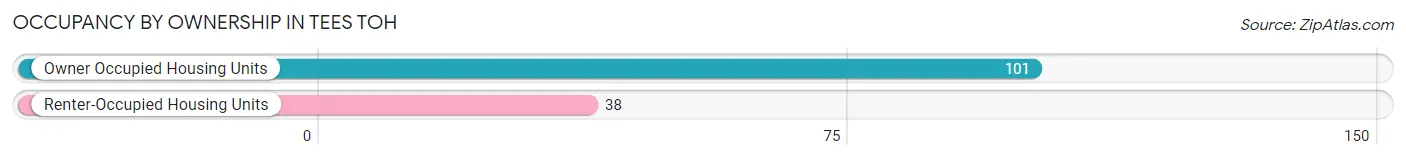
| Occupancy | # Housing Units | % Housing Units |
| Owner Occupied Housing Units | 101 | 72.7% |
| Renter-Occupied Housing Units | 38 | 27.3% |
| Total Occupied Housing Units | 139 | 100.0% |
Occupancy by Household Size in Tees Toh
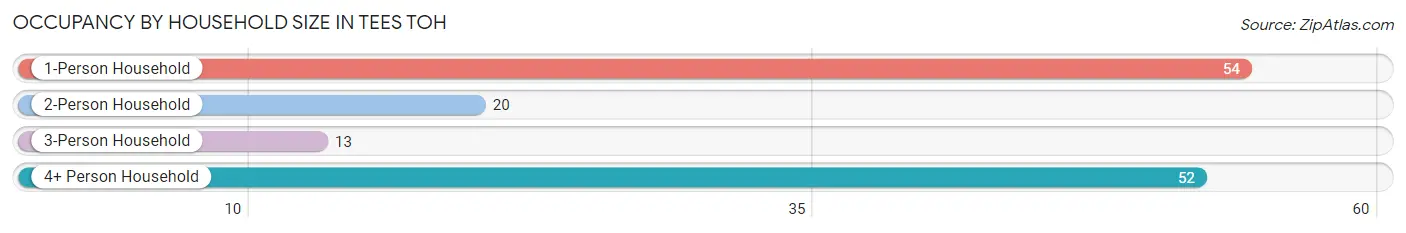
| Household Size | # Housing Units | % Housing Units |
| 1-Person Household | 54 | 38.9% |
| 2-Person Household | 20 | 14.4% |
| 3-Person Household | 13 | 9.3% |
| 4+ Person Household | 52 | 37.4% |
| Total Housing Units | 139 | 100.0% |
Occupancy by Ownership by Household Size in Tees Toh
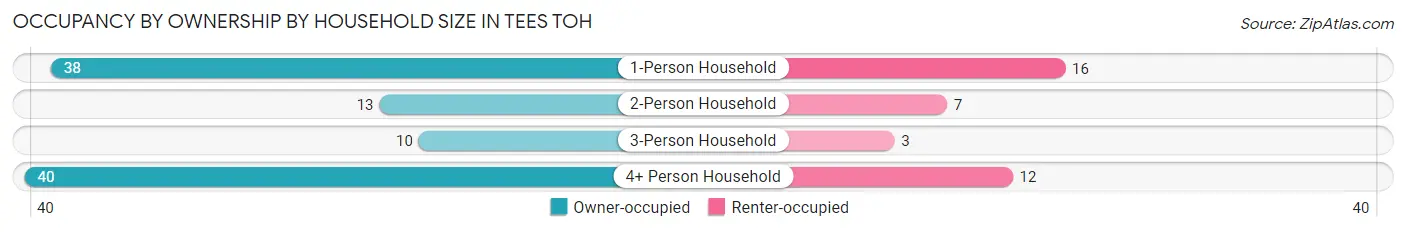
| Household Size | Owner-occupied | Renter-occupied |
| 1-Person Household | 38 (70.4%) | 16 (29.6%) |
| 2-Person Household | 13 (65.0%) | 7 (35.0%) |
| 3-Person Household | 10 (76.9%) | 3 (23.1%) |
| 4+ Person Household | 40 (76.9%) | 12 (23.1%) |
| Total Housing Units | 101 (72.7%) | 38 (27.3%) |
Occupancy by Educational Attainment in Tees Toh
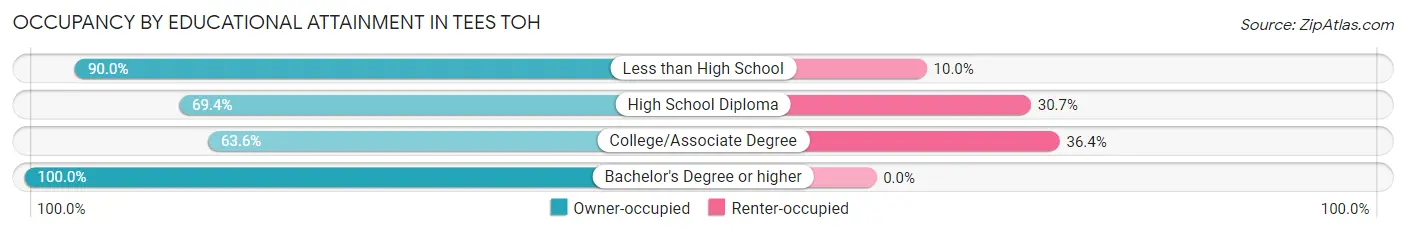
| Household Size | Owner-occupied | Renter-occupied |
| Less than High School | 27 (90.0%) | 3 (10.0%) |
| High School Diploma | 43 (69.4%) | 19 (30.6%) |
| College/Associate Degree | 28 (63.6%) | 16 (36.4%) |
| Bachelor's Degree or higher | 3 (100.0%) | 0 (0.0%) |
Occupancy by Age of Householder in Tees Toh
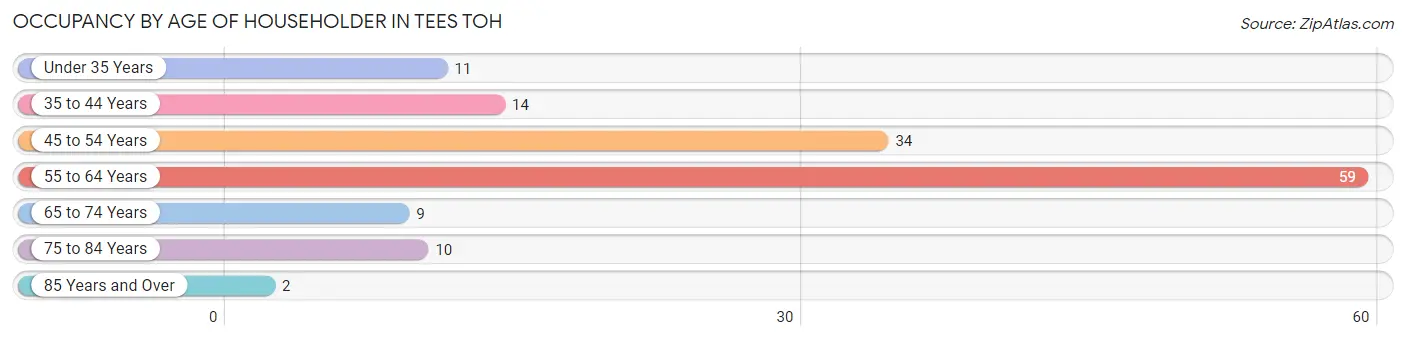
| Age Bracket | # Households | % Households |
| Under 35 Years | 11 | 7.9% |
| 35 to 44 Years | 14 | 10.1% |
| 45 to 54 Years | 34 | 24.5% |
| 55 to 64 Years | 59 | 42.4% |
| 65 to 74 Years | 9 | 6.5% |
| 75 to 84 Years | 10 | 7.2% |
| 85 Years and Over | 2 | 1.4% |
| Total | 139 | 100.0% |
Housing Finances in Tees Toh
Median Income by Occupancy in Tees Toh
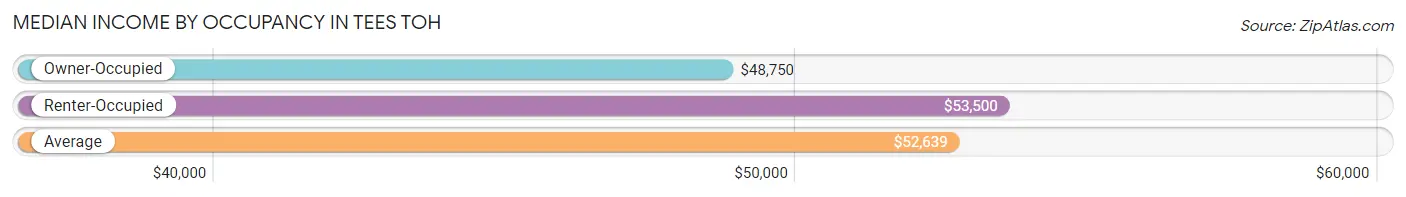
| Occupancy Type | # Households | Median Income |
| Owner-Occupied | 101 (72.7%) | $48,750 |
| Renter-Occupied | 38 (27.3%) | $53,500 |
| Average | 139 (100.0%) | $52,639 |
Occupancy by Householder Income Bracket in Tees Toh
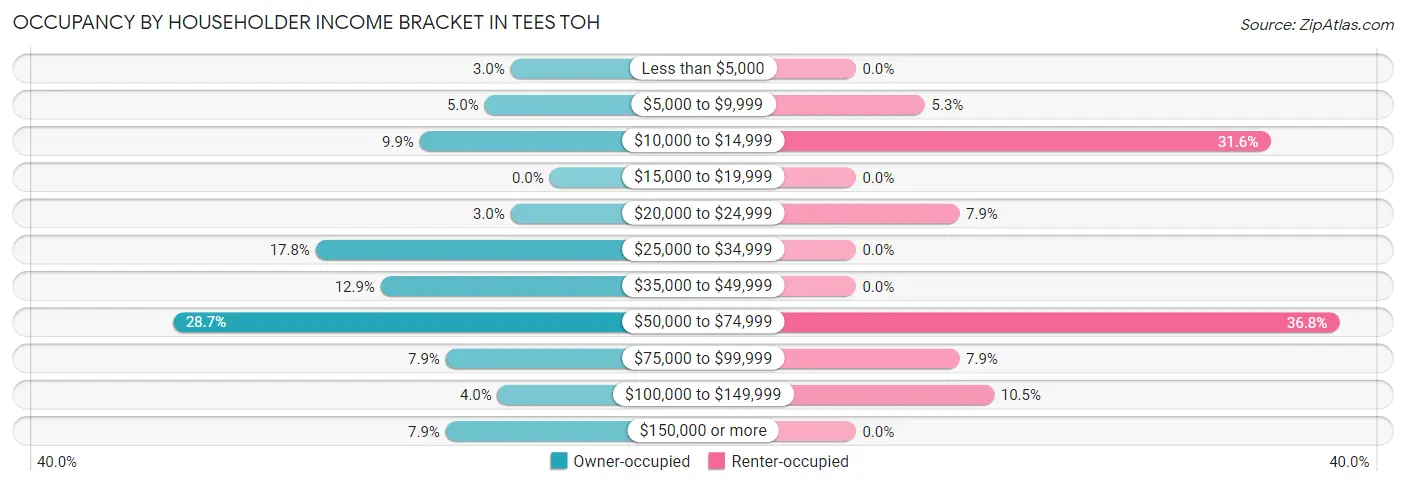
| Income Bracket | Owner-occupied | Renter-occupied |
| Less than $5,000 | 3 (3.0%) | 0 (0.0%) |
| $5,000 to $9,999 | 5 (5.0%) | 2 (5.3%) |
| $10,000 to $14,999 | 10 (9.9%) | 12 (31.6%) |
| $15,000 to $19,999 | 0 (0.0%) | 0 (0.0%) |
| $20,000 to $24,999 | 3 (3.0%) | 3 (7.9%) |
| $25,000 to $34,999 | 18 (17.8%) | 0 (0.0%) |
| $35,000 to $49,999 | 13 (12.9%) | 0 (0.0%) |
| $50,000 to $74,999 | 29 (28.7%) | 14 (36.8%) |
| $75,000 to $99,999 | 8 (7.9%) | 3 (7.9%) |
| $100,000 to $149,999 | 4 (4.0%) | 4 (10.5%) |
| $150,000 or more | 8 (7.9%) | 0 (0.0%) |
| Total | 101 (100.0%) | 38 (100.0%) |
Monthly Housing Cost Tiers in Tees Toh
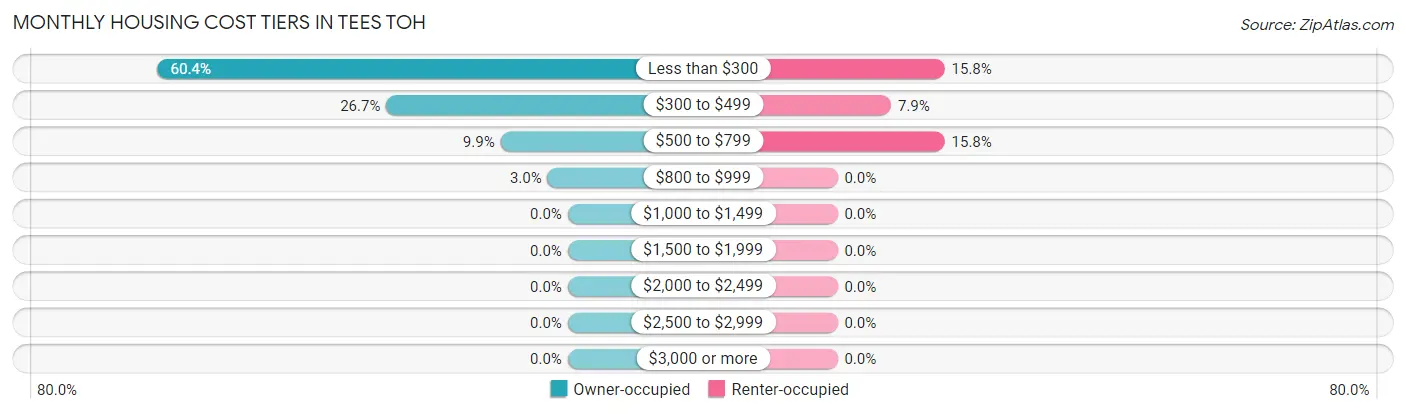
| Monthly Cost | Owner-occupied | Renter-occupied |
| Less than $300 | 61 (60.4%) | 6 (15.8%) |
| $300 to $499 | 27 (26.7%) | 3 (7.9%) |
| $500 to $799 | 10 (9.9%) | 6 (15.8%) |
| $800 to $999 | 3 (3.0%) | 0 (0.0%) |
| $1,000 to $1,499 | 0 (0.0%) | 0 (0.0%) |
| $1,500 to $1,999 | 0 (0.0%) | 0 (0.0%) |
| $2,000 to $2,499 | 0 (0.0%) | 0 (0.0%) |
| $2,500 to $2,999 | 0 (0.0%) | 0 (0.0%) |
| $3,000 or more | 0 (0.0%) | 0 (0.0%) |
| Total | 101 (100.0%) | 38 (100.0%) |
Physical Housing Characteristics in Tees Toh
Housing Structures in Tees Toh
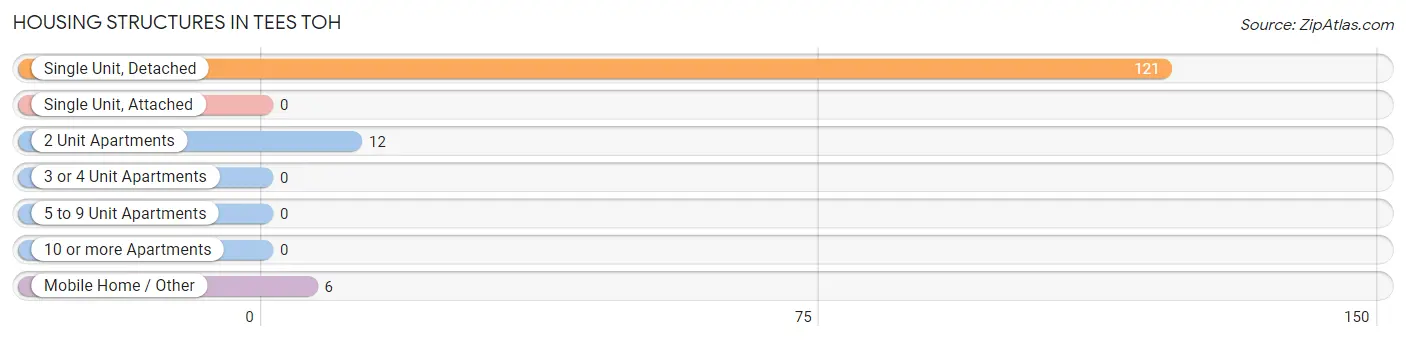
| Structure Type | # Housing Units | % Housing Units |
| Single Unit, Detached | 121 | 87.1% |
| Single Unit, Attached | 0 | 0.0% |
| 2 Unit Apartments | 12 | 8.6% |
| 3 or 4 Unit Apartments | 0 | 0.0% |
| 5 to 9 Unit Apartments | 0 | 0.0% |
| 10 or more Apartments | 0 | 0.0% |
| Mobile Home / Other | 6 | 4.3% |
| Total | 139 | 100.0% |
Housing Structures by Occupancy in Tees Toh
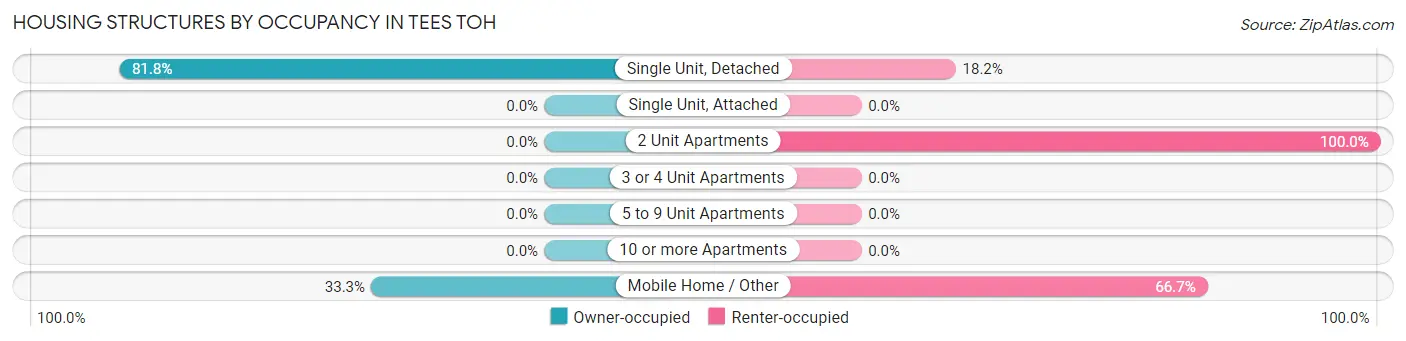
| Structure Type | Owner-occupied | Renter-occupied |
| Single Unit, Detached | 99 (81.8%) | 22 (18.2%) |
| Single Unit, Attached | 0 (0.0%) | 0 (0.0%) |
| 2 Unit Apartments | 0 (0.0%) | 12 (100.0%) |
| 3 or 4 Unit Apartments | 0 (0.0%) | 0 (0.0%) |
| 5 to 9 Unit Apartments | 0 (0.0%) | 0 (0.0%) |
| 10 or more Apartments | 0 (0.0%) | 0 (0.0%) |
| Mobile Home / Other | 2 (33.3%) | 4 (66.7%) |
| Total | 101 (72.7%) | 38 (27.3%) |
Housing Structures by Number of Rooms in Tees Toh
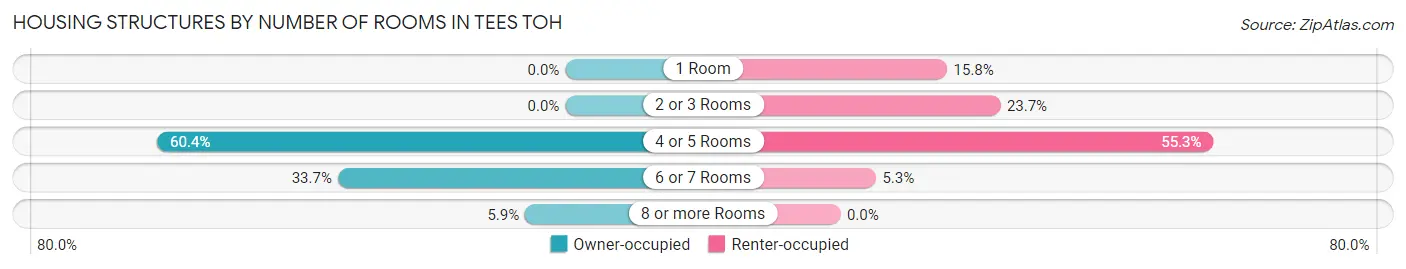
| Number of Rooms | Owner-occupied | Renter-occupied |
| 1 Room | 0 (0.0%) | 6 (15.8%) |
| 2 or 3 Rooms | 0 (0.0%) | 9 (23.7%) |
| 4 or 5 Rooms | 61 (60.4%) | 21 (55.3%) |
| 6 or 7 Rooms | 34 (33.7%) | 2 (5.3%) |
| 8 or more Rooms | 6 (5.9%) | 0 (0.0%) |
| Total | 101 (100.0%) | 38 (100.0%) |
Housing Structure by Heating Type in Tees Toh
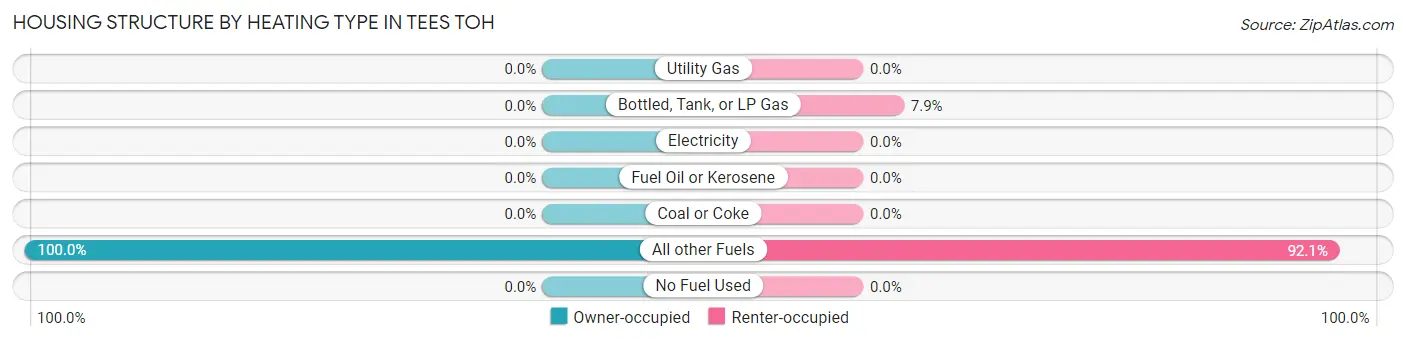
| Heating Type | Owner-occupied | Renter-occupied |
| Utility Gas | 0 (0.0%) | 0 (0.0%) |
| Bottled, Tank, or LP Gas | 0 (0.0%) | 3 (7.9%) |
| Electricity | 0 (0.0%) | 0 (0.0%) |
| Fuel Oil or Kerosene | 0 (0.0%) | 0 (0.0%) |
| Coal or Coke | 0 (0.0%) | 0 (0.0%) |
| All other Fuels | 101 (100.0%) | 35 (92.1%) |
| No Fuel Used | 0 (0.0%) | 0 (0.0%) |
| Total | 101 (100.0%) | 38 (100.0%) |
Household Vehicle Usage in Tees Toh
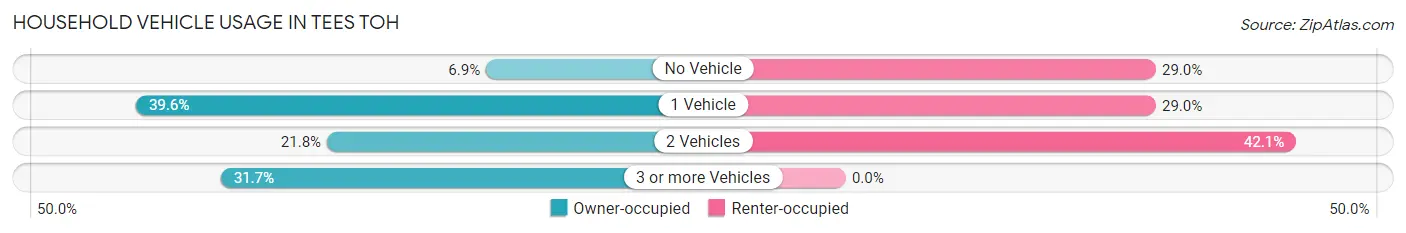
| Vehicles per Household | Owner-occupied | Renter-occupied |
| No Vehicle | 7 (6.9%) | 11 (28.9%) |
| 1 Vehicle | 40 (39.6%) | 11 (28.9%) |
| 2 Vehicles | 22 (21.8%) | 16 (42.1%) |
| 3 or more Vehicles | 32 (31.7%) | 0 (0.0%) |
| Total | 101 (100.0%) | 38 (100.0%) |
Real Estate & Mortgages in Tees Toh
Real Estate and Mortgage Overview in Tees Toh
| Characteristic | Without Mortgage | With Mortgage |
| Housing Units | 91 | 10 |
| Median Property Value | $86,500 | $0 |
| Median Household Income | $54,688 | $0 |
| Monthly Housing Costs | $254 | $0 |
| Real Estate Taxes | - | - |
Property Value by Mortgage Status in Tees Toh
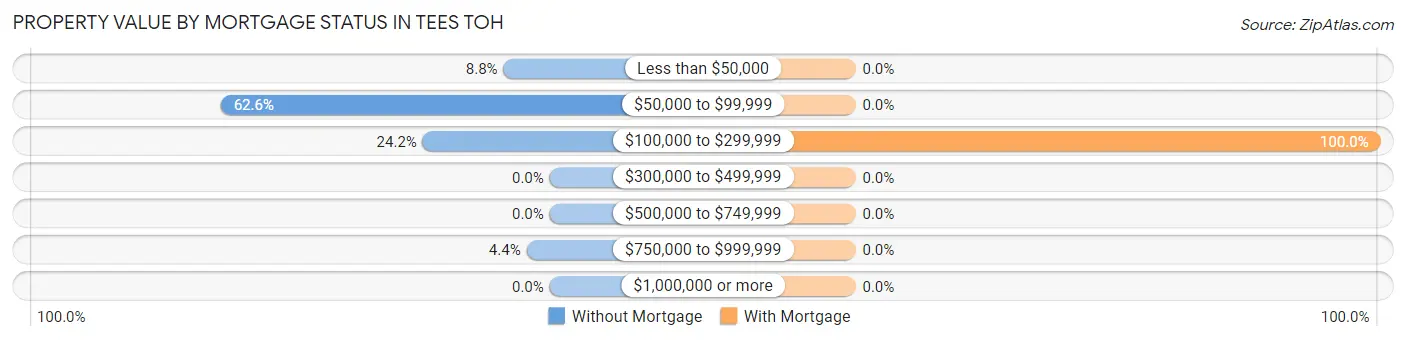
| Property Value | Without Mortgage | With Mortgage |
| Less than $50,000 | 8 (8.8%) | 0 (0.0%) |
| $50,000 to $99,999 | 57 (62.6%) | 0 (0.0%) |
| $100,000 to $299,999 | 22 (24.2%) | 10 (100.0%) |
| $300,000 to $499,999 | 0 (0.0%) | 0 (0.0%) |
| $500,000 to $749,999 | 0 (0.0%) | 0 (0.0%) |
| $750,000 to $999,999 | 4 (4.4%) | 0 (0.0%) |
| $1,000,000 or more | 0 (0.0%) | 0 (0.0%) |
| Total | 91 (100.0%) | 10 (100.0%) |
Household Income by Mortgage Status in Tees Toh
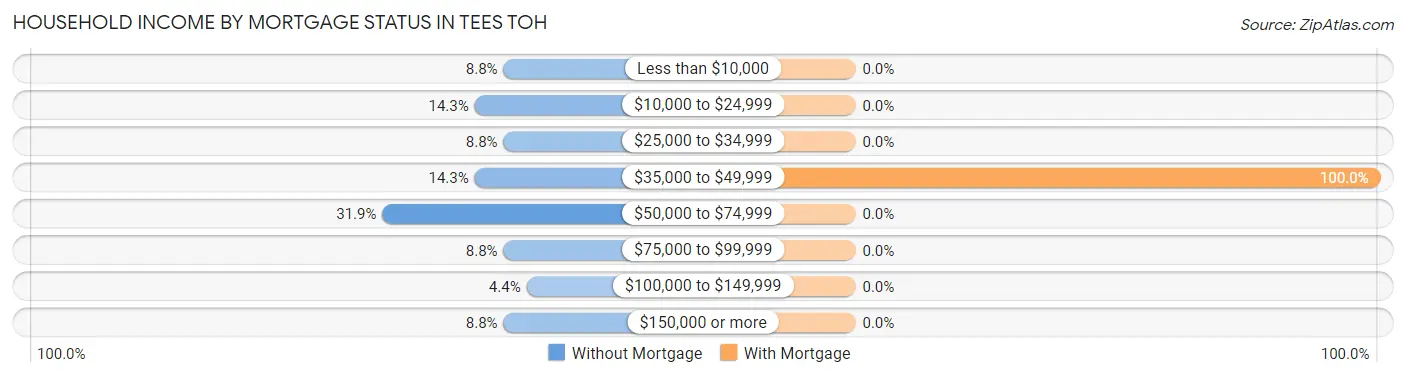
| Household Income | Without Mortgage | With Mortgage |
| Less than $10,000 | 8 (8.8%) | 0 (0.0%) |
| $10,000 to $24,999 | 13 (14.3%) | 0 (0.0%) |
| $25,000 to $34,999 | 8 (8.8%) | 0 (0.0%) |
| $35,000 to $49,999 | 13 (14.3%) | 10 (100.0%) |
| $50,000 to $74,999 | 29 (31.9%) | 0 (0.0%) |
| $75,000 to $99,999 | 8 (8.8%) | 0 (0.0%) |
| $100,000 to $149,999 | 4 (4.4%) | 0 (0.0%) |
| $150,000 or more | 8 (8.8%) | 0 (0.0%) |
| Total | 91 (100.0%) | 10 (100.0%) |
Property Value to Household Income Ratio in Tees Toh
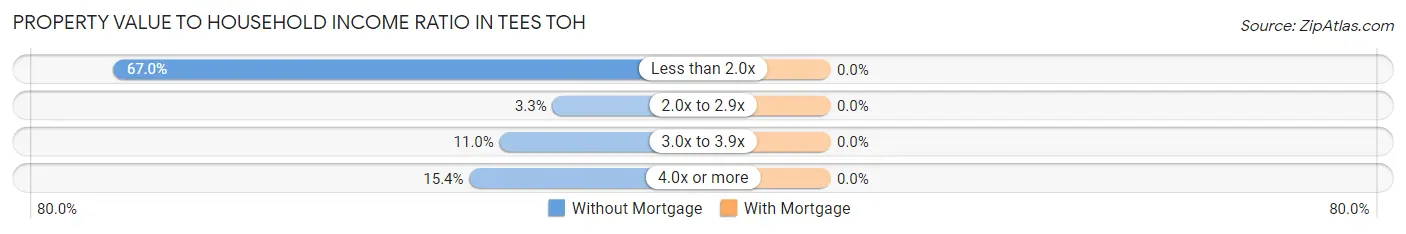
| Value-to-Income Ratio | Without Mortgage | With Mortgage |
| Less than 2.0x | 61 (67.0%) | 0 (0.0%) |
| 2.0x to 2.9x | 3 (3.3%) | 0 (0.0%) |
| 3.0x to 3.9x | 10 (11.0%) | 0 (0.0%) |
| 4.0x or more | 14 (15.4%) | 0 (0.0%) |
| Total | 91 (100.0%) | 10 (100.0%) |
Real Estate Taxes by Mortgage Status in Tees Toh
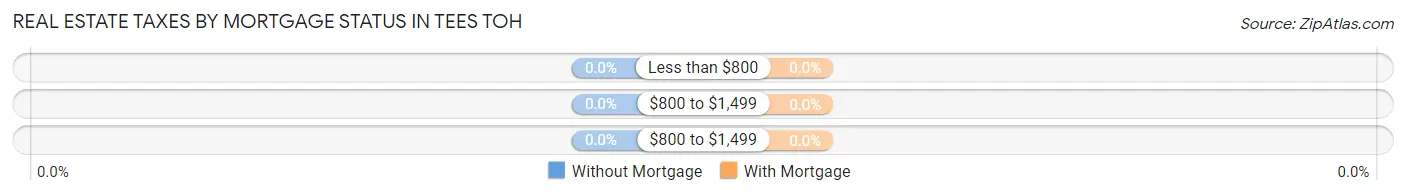
| Property Taxes | Without Mortgage | With Mortgage |
| Less than $800 | 0 (0.0%) | 0 (0.0%) |
| $800 to $1,499 | 0 (0.0%) | 0 (0.0%) |
| $800 to $1,499 | 0 (0.0%) | 0 (0.0%) |
| Total | 91 (100.0%) | 10 (100.0%) |
Health & Disability in Tees Toh
Health Insurance Coverage by Age in Tees Toh
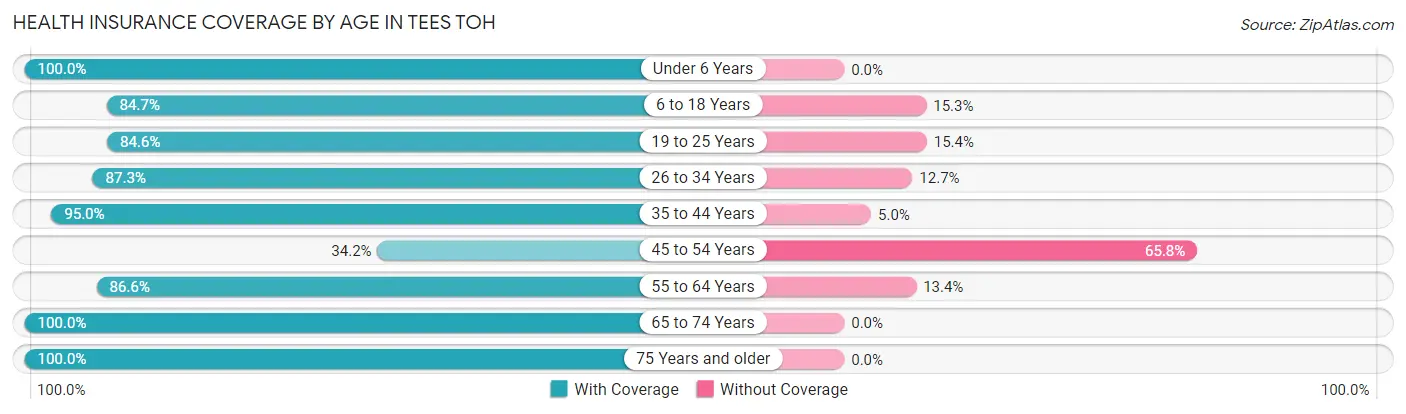
| Age Bracket | With Coverage | Without Coverage |
| Under 6 Years | 40 (100.0%) | 0 (0.0%) |
| 6 to 18 Years | 72 (84.7%) | 13 (15.3%) |
| 19 to 25 Years | 33 (84.6%) | 6 (15.4%) |
| 26 to 34 Years | 55 (87.3%) | 8 (12.7%) |
| 35 to 44 Years | 57 (95.0%) | 3 (5.0%) |
| 45 to 54 Years | 13 (34.2%) | 25 (65.8%) |
| 55 to 64 Years | 71 (86.6%) | 11 (13.4%) |
| 65 to 74 Years | 24 (100.0%) | 0 (0.0%) |
| 75 Years and older | 21 (100.0%) | 0 (0.0%) |
| Total | 386 (85.4%) | 66 (14.6%) |
Health Insurance Coverage by Citizenship Status in Tees Toh
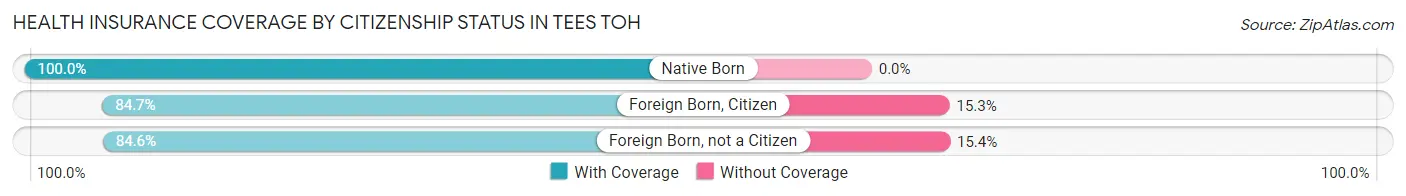
| Citizenship Status | With Coverage | Without Coverage |
| Native Born | 40 (100.0%) | 0 (0.0%) |
| Foreign Born, Citizen | 72 (84.7%) | 13 (15.3%) |
| Foreign Born, not a Citizen | 33 (84.6%) | 6 (15.4%) |
Health Insurance Coverage by Household Income in Tees Toh
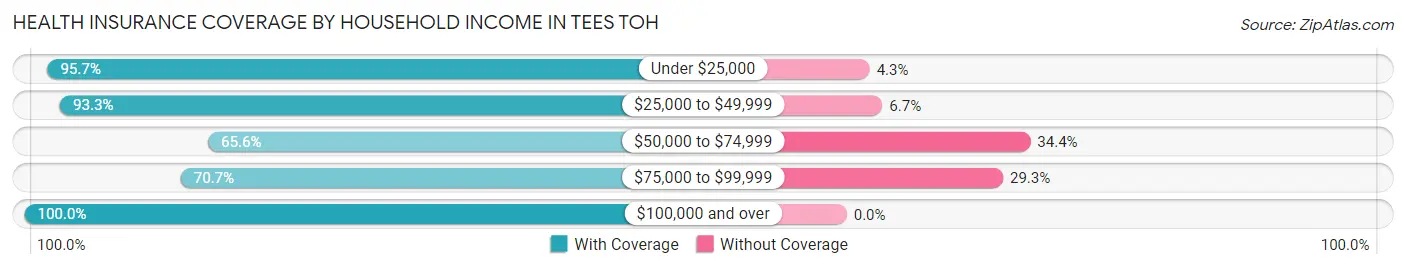
| Household Income | With Coverage | Without Coverage |
| Under $25,000 | 67 (95.7%) | 3 (4.3%) |
| $25,000 to $49,999 | 112 (93.3%) | 8 (6.7%) |
| $50,000 to $74,999 | 82 (65.6%) | 43 (34.4%) |
| $75,000 to $99,999 | 29 (70.7%) | 12 (29.3%) |
| $100,000 and over | 96 (100.0%) | 0 (0.0%) |
Public vs Private Health Insurance Coverage by Age in Tees Toh
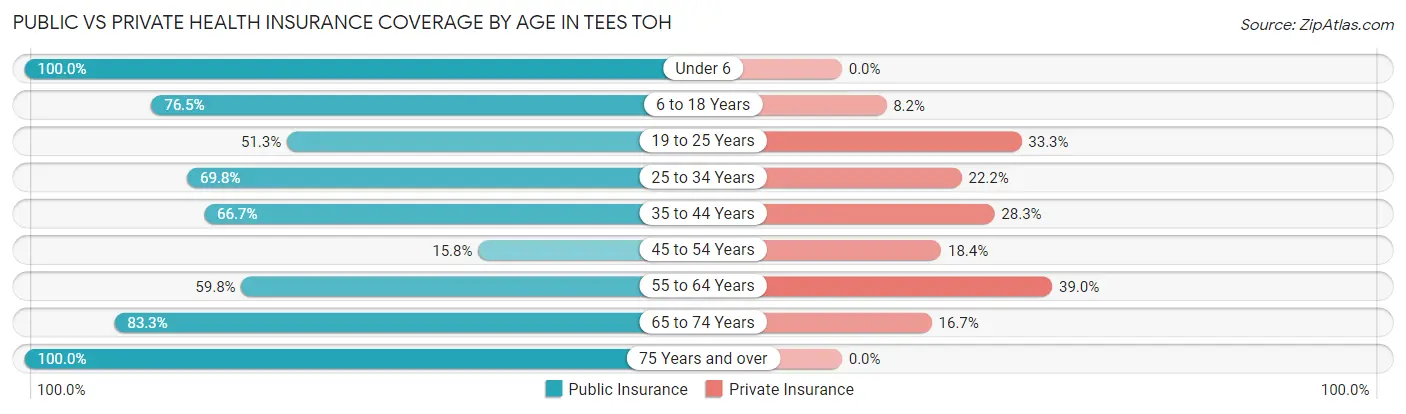
| Age Bracket | Public Insurance | Private Insurance |
| Under 6 | 40 (100.0%) | 0 (0.0%) |
| 6 to 18 Years | 65 (76.5%) | 7 (8.2%) |
| 19 to 25 Years | 20 (51.3%) | 13 (33.3%) |
| 25 to 34 Years | 44 (69.8%) | 14 (22.2%) |
| 35 to 44 Years | 40 (66.7%) | 17 (28.3%) |
| 45 to 54 Years | 6 (15.8%) | 7 (18.4%) |
| 55 to 64 Years | 49 (59.8%) | 32 (39.0%) |
| 65 to 74 Years | 20 (83.3%) | 4 (16.7%) |
| 75 Years and over | 21 (100.0%) | 0 (0.0%) |
| Total | 305 (67.5%) | 94 (20.8%) |
Disability Status by Sex by Age in Tees Toh
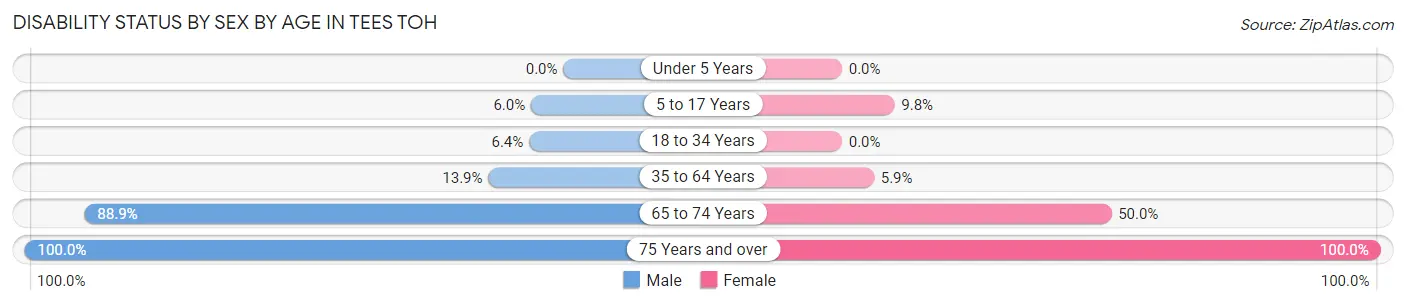
| Age Bracket | Male | Female |
| Under 5 Years | 0 (0.0%) | 0 (0.0%) |
| 5 to 17 Years | 3 (6.0%) | 4 (9.8%) |
| 18 to 34 Years | 4 (6.4%) | 0 (0.0%) |
| 35 to 64 Years | 11 (13.9%) | 6 (5.9%) |
| 65 to 74 Years | 16 (88.9%) | 3 (50.0%) |
| 75 Years and over | 11 (100.0%) | 10 (100.0%) |
Disability Class by Sex by Age in Tees Toh
Disability Class: Hearing Difficulty
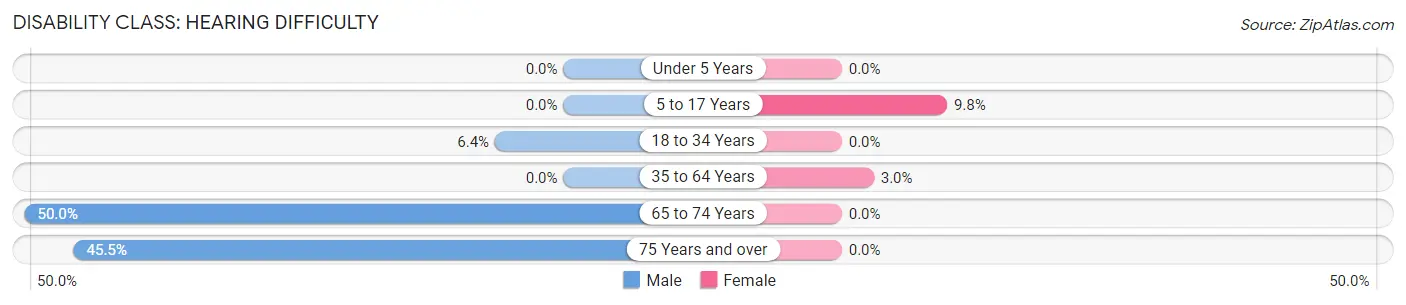
| Age Bracket | Male | Female |
| Under 5 Years | 0 (0.0%) | 0 (0.0%) |
| 5 to 17 Years | 0 (0.0%) | 4 (9.8%) |
| 18 to 34 Years | 4 (6.4%) | 0 (0.0%) |
| 35 to 64 Years | 0 (0.0%) | 3 (3.0%) |
| 65 to 74 Years | 9 (50.0%) | 0 (0.0%) |
| 75 Years and over | 5 (45.5%) | 0 (0.0%) |
Disability Class: Vision Difficulty
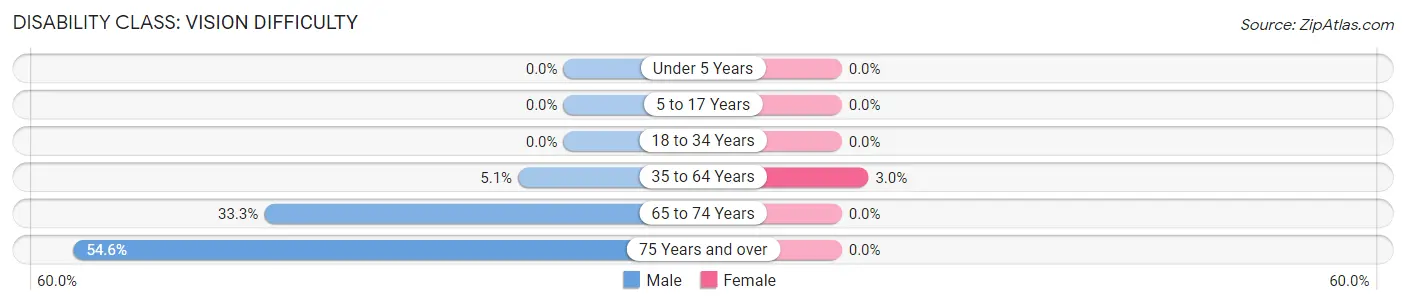
| Age Bracket | Male | Female |
| Under 5 Years | 0 (0.0%) | 0 (0.0%) |
| 5 to 17 Years | 0 (0.0%) | 0 (0.0%) |
| 18 to 34 Years | 0 (0.0%) | 0 (0.0%) |
| 35 to 64 Years | 4 (5.1%) | 3 (3.0%) |
| 65 to 74 Years | 6 (33.3%) | 0 (0.0%) |
| 75 Years and over | 6 (54.5%) | 0 (0.0%) |
Disability Class: Cognitive Difficulty
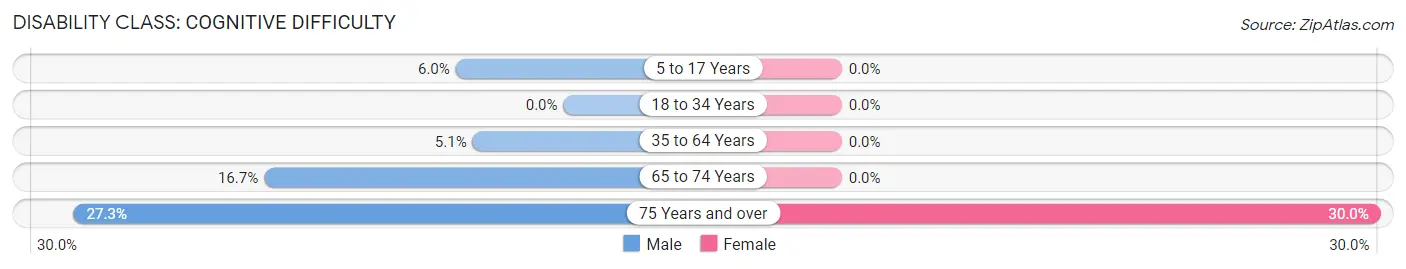
| Age Bracket | Male | Female |
| 5 to 17 Years | 3 (6.0%) | 0 (0.0%) |
| 18 to 34 Years | 0 (0.0%) | 0 (0.0%) |
| 35 to 64 Years | 4 (5.1%) | 0 (0.0%) |
| 65 to 74 Years | 3 (16.7%) | 0 (0.0%) |
| 75 Years and over | 3 (27.3%) | 3 (30.0%) |
Disability Class: Ambulatory Difficulty
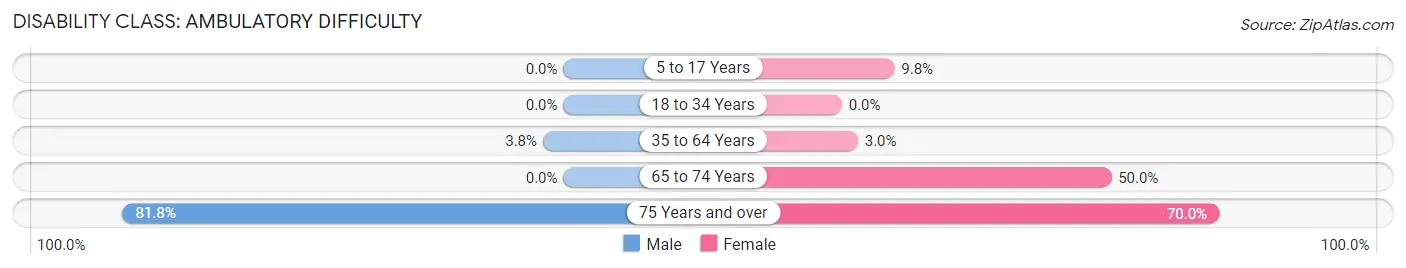
| Age Bracket | Male | Female |
| 5 to 17 Years | 0 (0.0%) | 4 (9.8%) |
| 18 to 34 Years | 0 (0.0%) | 0 (0.0%) |
| 35 to 64 Years | 3 (3.8%) | 3 (3.0%) |
| 65 to 74 Years | 0 (0.0%) | 3 (50.0%) |
| 75 Years and over | 9 (81.8%) | 7 (70.0%) |
Disability Class: Self-Care Difficulty
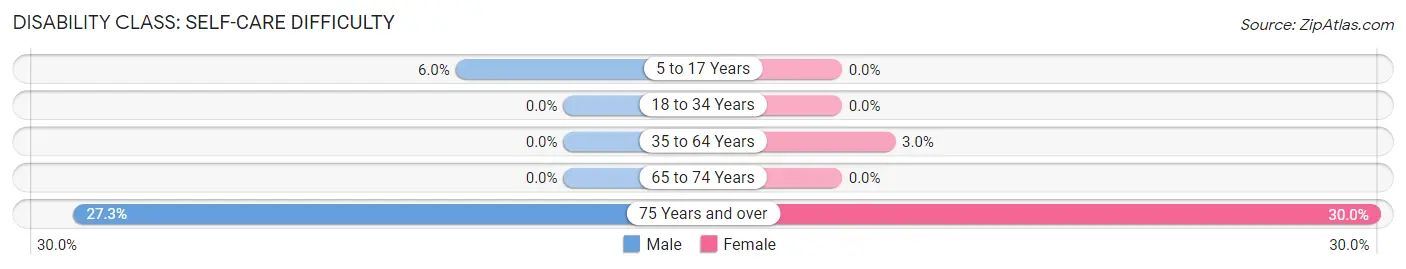
| Age Bracket | Male | Female |
| 5 to 17 Years | 3 (6.0%) | 0 (0.0%) |
| 18 to 34 Years | 0 (0.0%) | 0 (0.0%) |
| 35 to 64 Years | 0 (0.0%) | 3 (3.0%) |
| 65 to 74 Years | 0 (0.0%) | 0 (0.0%) |
| 75 Years and over | 3 (27.3%) | 3 (30.0%) |
Technology Access in Tees Toh
Computing Device Access in Tees Toh
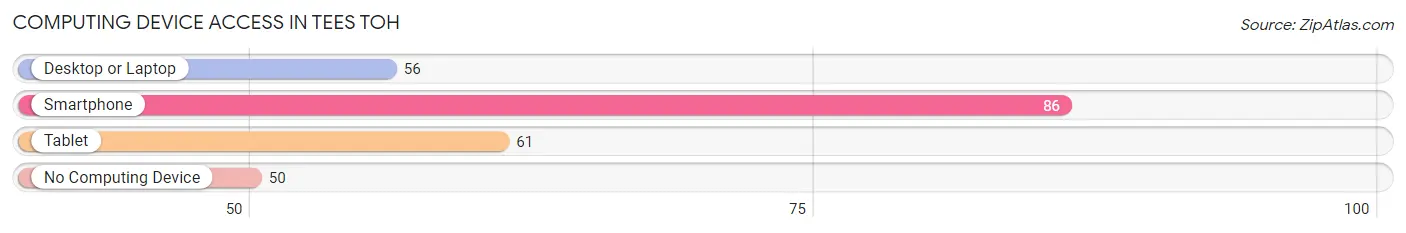
| Device Type | # Households | % Households |
| Desktop or Laptop | 56 | 40.3% |
| Smartphone | 86 | 61.9% |
| Tablet | 61 | 43.9% |
| No Computing Device | 50 | 36.0% |
| Total | 139 | 100.0% |
Internet Access in Tees Toh
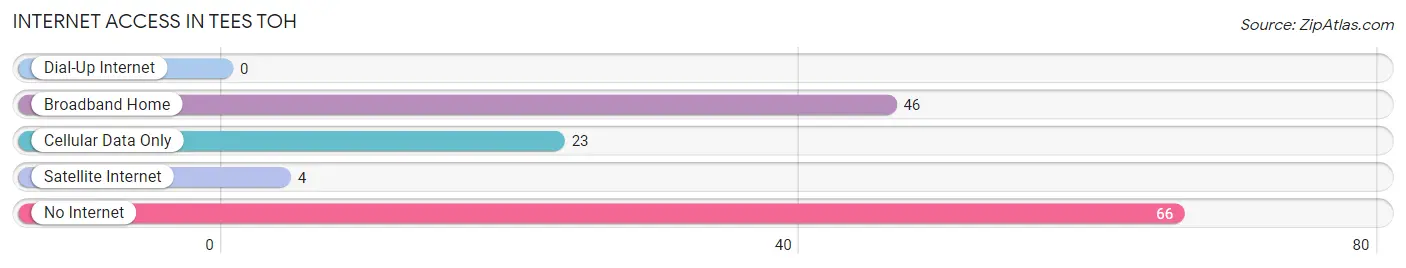
| Internet Type | # Households | % Households |
| Dial-Up Internet | 0 | 0.0% |
| Broadband Home | 46 | 33.1% |
| Cellular Data Only | 23 | 16.6% |
| Satellite Internet | 4 | 2.9% |
| No Internet | 66 | 47.5% |
| Total | 139 | 100.0% |
Tees Toh Summary
Arizona is a state located in the southwestern region of the United States. It is the sixth largest state in the country and is bordered by California, Nevada, Utah, New Mexico, and Mexico. Arizona is known for its desert climate, its diverse landscape, and its rich cultural heritage.
History
Arizona has a long and varied history. The area was first inhabited by Native American tribes, including the Hohokam, the Pima, and the Apache. The first Europeans to explore the area were Spanish explorers in the 16th century. In 1853, the Gadsden Purchase established the southern boundary of Arizona, and the area became part of the United States. In 1912, Arizona became the 48th state in the Union.
Geography
Arizona is a land of great diversity. It is home to the Grand Canyon, one of the seven natural wonders of the world. The state is also home to the Sonoran Desert, the largest desert in North America. Other geographical features include the Colorado Plateau, the Mogollon Rim, and the White Mountains.
Economy
Arizona’s economy is largely based on tourism, agriculture, and mining. Tourism is a major industry in the state, with visitors drawn to the Grand Canyon, Monument Valley, and other natural attractions. Agriculture is also important, with cotton, hay, and citrus fruits being the main crops. Mining is also a major industry, with copper, molybdenum, and uranium being the main minerals mined.
Demographics
As of 2020, the population of Arizona was estimated to be 7.3 million. The majority of the population is white (77.2%), followed by Hispanic or Latino (30.2%), Native American (5.3%), and Asian (3.9%). The median household income in Arizona is $58,945, and the median age is 37.
Arizona is a state with a rich history, diverse geography, and vibrant economy. Its population is diverse and growing, and its economy is strong and diverse. Arizona is a great place to live, work, and visit.
Common Questions
What is the Total Population of Tees Toh?
Total Population of Tees Toh is 452.
What is the Total Male Population of Tees Toh?
Total Male Population of Tees Toh is 240.
What is the Total Female Population of Tees Toh?
Total Female Population of Tees Toh is 212.
What is the Ratio of Males per 100 Females in Tees Toh?
There are 113.21 Males per 100 Females in Tees Toh.
What is the Ratio of Females per 100 Males in Tees Toh?
There are 88.33 Females per 100 Males in Tees Toh.
What is the Median Population Age in Tees Toh?
Median Population Age in Tees Toh is 34.9 Years.
What is the Average Family Size in Tees Toh
Average Family Size in Tees Toh is 4.7 People.
What is the Average Household Size in Tees Toh
Average Household Size in Tees Toh is 3.2 People.
What is Per Capita Income in Tees Toh?
Per Capita income in Tees Toh is $16,754.
What is the Median Family Income in Tees Toh?
Median Family Income in Tees Toh is $54,167.
What is the Median Household income in Tees Toh?
Median Household Income in Tees Toh is $52,639.
What is Income or Wage Gap in Tees Toh?
Income or Wage Gap in Tees Toh is 7.5%.
Women in Tees Toh earn 92.5 cents for every dollar earned by a man.
What is Inequality or Gini Index in Tees Toh?
Inequality or Gini Index in Tees Toh is 0.43.
How Large is the Labor Force in Tees Toh?
There are 188 People in the Labor Forcein in Tees Toh.
What is the Percentage of People in the Labor Force in Tees Toh?
54.0% of People are in the Labor Force in Tees Toh.
What is the Unemployment Rate in Tees Toh?
Unemployment Rate in Tees Toh is 23.9%.