Cities with the Most Births per 1,000 Women Over the Age of 35 in South Dakota
RELATED REPORTS & OPTIONS
Highest Birth Rate | Women 35+
South Dakota
Compare Cities
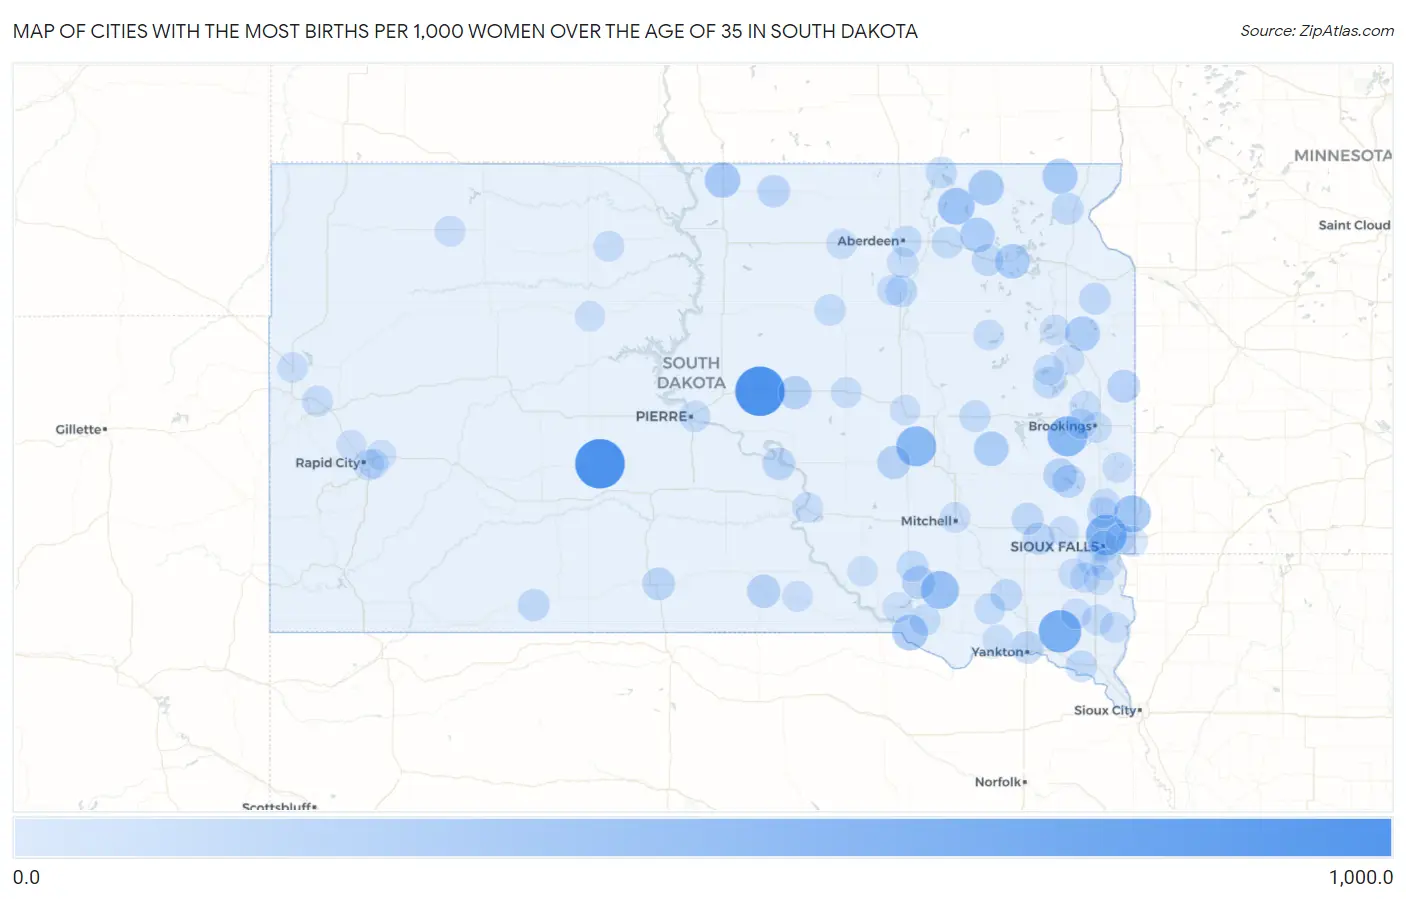
Map of Cities with the Most Births per 1,000 Women Over the Age of 35 in South Dakota
0.0
1,000.0
Cities with the Most Births per 1,000 Women Over the Age of 35 in South Dakota
| City | Births / 1,000 Women | vs State | vs National | |
| 1. | Midland | 1,000.0 | 35.0(+965)#1 | 32.0(+968)#25 |
| 2. | Harrold | 1,000.0 | 35.0(+965)#2 | 32.0(+968)#37 |
| 3. | Wakonda | 632.0 | 35.0(+597)#3 | 32.0(+600)#90 |
| 4. | Prairiewood | 545.0 | 35.0(+510)#4 | 32.0(+513)#113 |
| 5. | Meadow View Addition | 529.0 | 35.0(+494)#5 | 32.0(+497)#115 |
| 6. | Alpena | 500.0 | 35.0(+465)#6 | 32.0(+468)#125 |
| 7. | Sinai | 500.0 | 35.0(+465)#7 | 32.0(+468)#135 |
| 8. | Delmont | 385.0 | 35.0(+350)#8 | 32.0(+353)#221 |
| 9. | Oahe Acres | 333.0 | 35.0(+298)#9 | 32.0(+301)#279 |
| 10. | Claremont | 333.0 | 35.0(+298)#10 | 32.0(+301)#300 |
| 11. | Sherman | 333.0 | 35.0(+298)#11 | 32.0(+301)#302 |
| 12. | Marty | 278.0 | 35.0(+243)#12 | 32.0(+246)#386 |
| 13. | Herreid | 268.0 | 35.0(+233)#13 | 32.0(+236)#414 |
| 14. | Britton | 255.0 | 35.0(+220)#14 | 32.0(+223)#453 |
| 15. | Claire City | 250.0 | 35.0(+215)#15 | 32.0(+218)#485 |
| 16. | Mina | 229.0 | 35.0(+194)#16 | 32.0(+197)#547 |
| 17. | Kranzburg | 227.0 | 35.0(+192)#17 | 32.0(+195)#555 |
| 18. | Webster | 224.0 | 35.0(+189)#18 | 32.0(+192)#566 |
| 19. | Carthage | 222.0 | 35.0(+187)#19 | 32.0(+190)#585 |
| 20. | Pierpont | 222.0 | 35.0(+187)#20 | 32.0(+190)#587 |
| 21. | Armour | 158.0 | 35.0(+123)#21 | 32.0(+126)#992 |
| 22. | Madison | 154.0 | 35.0(+119)#22 | 32.0(+122)#1,017 |
| 23. | Highmore | 152.0 | 35.0(+117)#23 | 32.0(+120)#1,044 |
| 24. | Wessington Springs | 148.0 | 35.0(+113)#24 | 32.0(+116)#1,097 |
| 25. | Colome | 148.0 | 35.0(+113)#25 | 32.0(+116)#1,100 |
| 26. | Astoria | 143.0 | 35.0(+108)#26 | 32.0(+111)#1,165 |
| 27. | Lake Madison | 130.0 | 35.0(+95.0)#27 | 32.0(+98.0)#1,338 |
| 28. | Antelope | 122.0 | 35.0(+87.0)#28 | 32.0(+90.0)#1,474 |
| 29. | Eureka | 115.0 | 35.0(+80.0)#29 | 32.0(+83.0)#1,592 |
| 30. | Lower Brule | 113.0 | 35.0(+78.0)#30 | 32.0(+81.0)#1,635 |
| 31. | Yankton | 104.0 | 35.0(+69.0)#31 | 32.0(+72.0)#1,850 |
| 32. | Canistota | 98.0 | 35.0(+63.0)#32 | 32.0(+66.0)#2,013 |
| 33. | Sisseton | 94.0 | 35.0(+59.0)#33 | 32.0(+62.0)#2,116 |
| 34. | Salem | 93.0 | 35.0(+58.0)#34 | 32.0(+61.0)#2,148 |
| 35. | Martin | 88.0 | 35.0(+53.0)#35 | 32.0(+56.0)#2,300 |
| 36. | Bristol | 83.0 | 35.0(+48.0)#36 | 32.0(+51.0)#2,474 |
| 37. | Mellette | 83.0 | 35.0(+48.0)#37 | 32.0(+51.0)#2,481 |
| 38. | Stockholm | 83.0 | 35.0(+48.0)#38 | 32.0(+51.0)#2,483 |
| 39. | Menno | 81.0 | 35.0(+46.0)#39 | 32.0(+49.0)#2,541 |
| 40. | Groton | 80.0 | 35.0(+45.0)#40 | 32.0(+48.0)#2,564 |
| 41. | Lake Norden | 80.0 | 35.0(+45.0)#41 | 32.0(+48.0)#2,573 |
| 42. | Vermillion | 74.0 | 35.0(+39.0)#42 | 32.0(+42.0)#2,797 |
| 43. | Iroquois | 73.0 | 35.0(+38.0)#43 | 32.0(+41.0)#2,893 |
| 44. | Hecla | 67.0 | 35.0(+32.0)#44 | 32.0(+35.0)#3,200 |
| 45. | Corsica | 65.0 | 35.0(+30.0)#45 | 32.0(+33.0)#3,300 |
| 46. | Faulkton | 60.0 | 35.0(+25.0)#46 | 32.0(+28.0)#3,643 |
| 47. | Wagner | 57.0 | 35.0(+22.0)#47 | 32.0(+25.0)#3,835 |
| 48. | Baltic | 56.0 | 35.0(+21.0)#48 | 32.0(+24.0)#3,904 |
| 49. | Pierre | 50.0 | 35.0(+15.0)#49 | 32.0(+18.0)#4,440 |
| 50. | Scotland | 50.0 | 35.0(+15.0)#50 | 32.0(+18.0)#4,491 |
| 51. | Aberdeen | 48.0 | 35.0(+13.0)#51 | 32.0(+16.0)#4,631 |
| 52. | Beresford | 47.0 | 35.0(+12.0)#52 | 32.0(+15.0)#4,797 |
| 53. | Bruce | 45.0 | 35.0(+10.00)#53 | 32.0(+13.0)#5,039 |
| 54. | Sioux Falls | 43.0 | 35.0(+8.00)#54 | 32.0(+11.0)#5,143 |
| 55. | Whitewood | 39.0 | 35.0(+4.00)#55 | 32.0(+7.00)#5,787 |
| 56. | Northville | 38.0 | 35.0(+3.00)#56 | 32.0(+6.00)#5,971 |
| 57. | Rapid City | 37.0 | 35.0(+2.00)#57 | 32.0(+5.00)#5,989 |
| 58. | Tea | 36.0 | 35.0(+1.000)#58 | 32.0(+4.00)#6,233 |
| 59. | Miller | 36.0 | 35.0(+1.000)#59 | 32.0(+4.00)#6,285 |
| 60. | Harrisburg | 35.0 | 35.0(=0.000)#60 | 32.0(+3.00)#6,383 |
| 61. | Warner | 34.0 | 35.0(-1.000)#61 | 32.0(+2.00)#6,608 |
| 62. | Brookings | 33.0 | 35.0(-2.00)#62 | 32.0(+1.000)#6,663 |
| 63. | Timber Lake | 33.0 | 35.0(-2.00)#63 | 32.0(+1.000)#6,791 |
| 64. | Volga | 31.0 | 35.0(-4.00)#64 | 32.0(-1.000)#7,095 |
| 65. | Clark | 31.0 | 35.0(-4.00)#65 | 32.0(-1.000)#7,115 |
| 66. | Gregory | 30.0 | 35.0(-5.00)#66 | 32.0(-2.00)#7,309 |
| 67. | Alcester | 30.0 | 35.0(-5.00)#67 | 32.0(-2.00)#7,317 |
| 68. | Bison | 29.0 | 35.0(-6.00)#68 | 32.0(-3.00)#7,513 |
| 69. | Tabor | 29.0 | 35.0(-6.00)#69 | 32.0(-3.00)#7,516 |
| 70. | Castlewood | 28.0 | 35.0(-7.00)#70 | 32.0(-4.00)#7,686 |
| 71. | Humboldt | 28.0 | 35.0(-7.00)#71 | 32.0(-4.00)#7,687 |
| 72. | Chancellor | 28.0 | 35.0(-7.00)#72 | 32.0(-4.00)#7,693 |
| 73. | Belle Fourche | 27.0 | 35.0(-8.00)#73 | 32.0(-5.00)#7,808 |
| 74. | Chamberlain | 27.0 | 35.0(-8.00)#74 | 32.0(-5.00)#7,825 |
| 75. | Valley Springs | 27.0 | 35.0(-8.00)#75 | 32.0(-5.00)#7,861 |
| 76. | Mitchell | 26.0 | 35.0(-9.00)#76 | 32.0(-6.00)#7,933 |
| 77. | Wolsey | 26.0 | 35.0(-9.00)#77 | 32.0(-6.00)#8,041 |
| 78. | Centerville | 23.0 | 35.0(-12.0)#78 | 32.0(-9.00)#8,577 |
| 79. | Hayti | 23.0 | 35.0(-12.0)#79 | 32.0(-9.00)#8,589 |
| 80. | Watertown | 22.0 | 35.0(-13.0)#80 | 32.0(-10.00)#8,637 |
| 81. | Ipswich | 22.0 | 35.0(-13.0)#81 | 32.0(-10.00)#8,746 |
| 82. | Flandreau | 17.0 | 35.0(-18.0)#82 | 32.0(-15.0)#9,577 |
| 83. | Lennox | 16.0 | 35.0(-19.0)#83 | 32.0(-16.0)#9,731 |
| 84. | Dell Rapids | 15.0 | 35.0(-20.0)#84 | 32.0(-17.0)#9,858 |
| 85. | Worthing | 14.0 | 35.0(-21.0)#85 | 32.0(-18.0)#10,024 |
| 86. | Eagle Butte | 13.0 | 35.0(-22.0)#86 | 32.0(-19.0)#10,157 |
| 87. | Lake Andes | 11.0 | 35.0(-24.0)#87 | 32.0(-21.0)#10,418 |
| 88. | Box Elder | 10.0 | 35.0(-25.0)#88 | 32.0(-22.0)#10,482 |
| 89. | Platte | 10.0 | 35.0(-25.0)#89 | 32.0(-22.0)#10,552 |
| 90. | Summerset | 9.0 | 35.0(-26.0)#90 | 32.0(-23.0)#10,644 |
| 91. | Brandon | 7.0 | 35.0(-28.0)#91 | 32.0(-25.0)#10,790 |
| 92. | Rapid Valley | 6.0 | 35.0(-29.0)#92 | 32.0(-26.0)#10,891 |
Common Questions
What are the Top 10 Cities with the Most Births per 1,000 Women Over the Age of 35 in South Dakota?
Top 10 Cities with the Most Births per 1,000 Women Over the Age of 35 in South Dakota are:
What city has the Most Births per 1,000 Women Over the Age of 35 in South Dakota?
Midland has the Most Births per 1,000 Women Over the Age of 35 in South Dakota with 1,000.0.
What is the Number of Births per 1,000 Women Over the Age of 35 in the State of South Dakota?
Number of Births per 1,000 Women Over the Age of 35 in South Dakota is 35.0.
What is the Number of Births per 1,000 Women Over the Age of 35 in the United States?
Number of Births per 1,000 Women Over the Age of 35 in the United States is 32.0.