Crocker, WA
Crocker Map
Crocker Overview
1,218
TOTAL POPULATION
583
MALE POPULATION
635
FEMALE POPULATION
91.81
MALES / 100 FEMALES
108.92
FEMALES / 100 MALES
49.0
MEDIAN AGE
2.9
AVG FAMILY SIZE
2.7
AVG HOUSEHOLD SIZE
$43,575
PER CAPITA INCOME
$112,000
AVG FAMILY INCOME
$109,091
AVG HOUSEHOLD INCOME
48.6%
WAGE / INCOME GAP [ % ]
51.4¢/ $1
WAGE / INCOME GAP [ $ ]
0.35
INEQUALITY / GINI INDEX
503
LABOR FORCE [ PEOPLE ]
54.5%
PERCENT IN LABOR FORCE
2.2%
UNEMPLOYMENT RATE
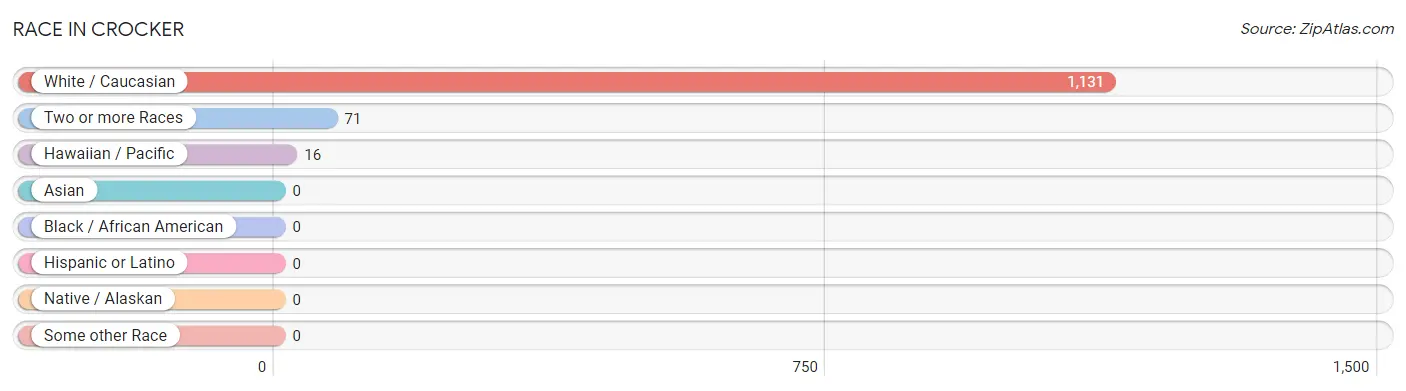
Race in Crocker
The most populous races in Crocker are White / Caucasian (1,131 | 92.9%), Two or more Races (71 | 5.8%), and Hawaiian / Pacific (16 | 1.3%).
| Race | # Population | % Population |
| Asian | 0 | 0.0% |
| Black / African American | 0 | 0.0% |
| Hawaiian / Pacific | 16 | 1.3% |
| Hispanic or Latino | 0 | 0.0% |
| Native / Alaskan | 0 | 0.0% |
| White / Caucasian | 1,131 | 92.9% |
| Two or more Races | 71 | 5.8% |
| Some other Race | 0 | 0.0% |
| Total | 1,218 | 100.0% |
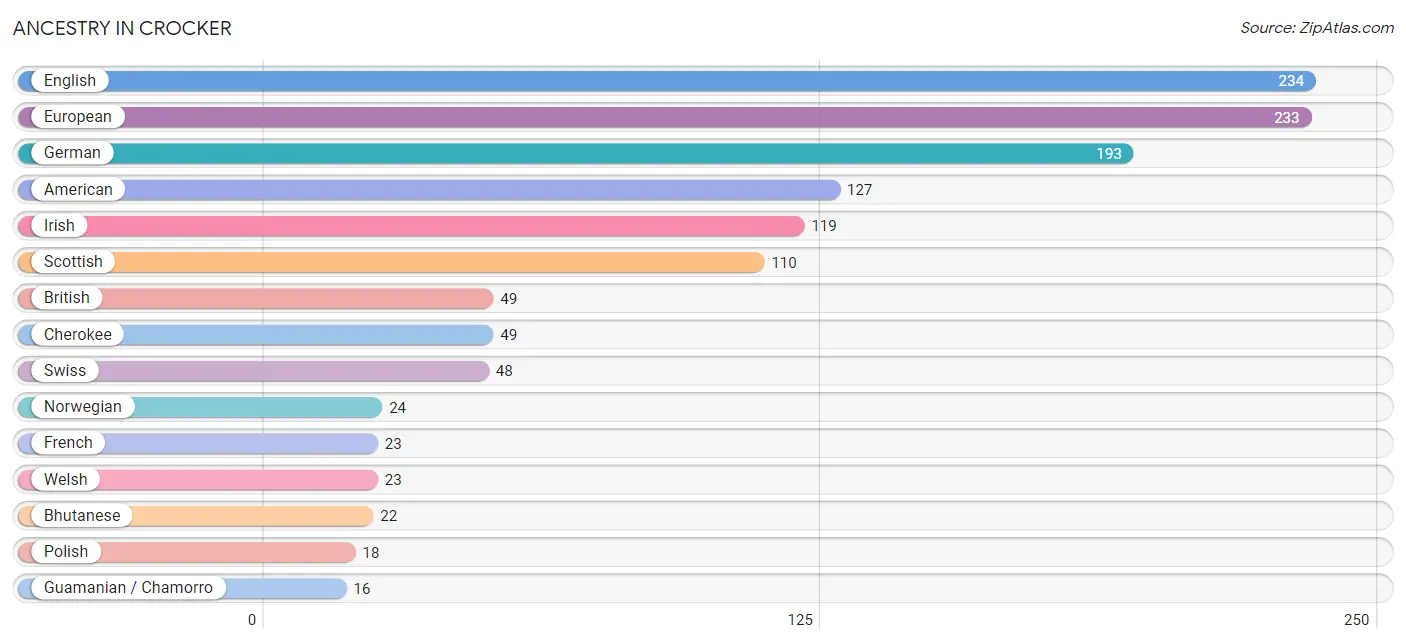
Ancestry in Crocker
The most populous ancestries reported in Crocker are English (234 | 19.2%), European (233 | 19.1%), German (193 | 15.9%), American (127 | 10.4%), and Irish (119 | 9.8%), together accounting for 74.4% of all Crocker residents.
| Ancestry | # Population | % Population |
| American | 127 | 10.4% |
| Bhutanese | 22 | 1.8% |
| British | 49 | 4.0% |
| Cherokee | 49 | 4.0% |
| English | 234 | 19.2% |
| European | 233 | 19.1% |
| Finnish | 7 | 0.6% |
| French | 23 | 1.9% |
| French Canadian | 11 | 0.9% |
| German | 193 | 15.9% |
| Guamanian / Chamorro | 16 | 1.3% |
| Hungarian | 12 | 1.0% |
| Irish | 119 | 9.8% |
| Italian | 15 | 1.2% |
| Norwegian | 24 | 2.0% |
| Polish | 18 | 1.5% |
| Scottish | 110 | 9.0% |
| Swedish | 11 | 0.9% |
| Swiss | 48 | 3.9% |
| Welsh | 23 | 1.9% | View All 20 Rows |
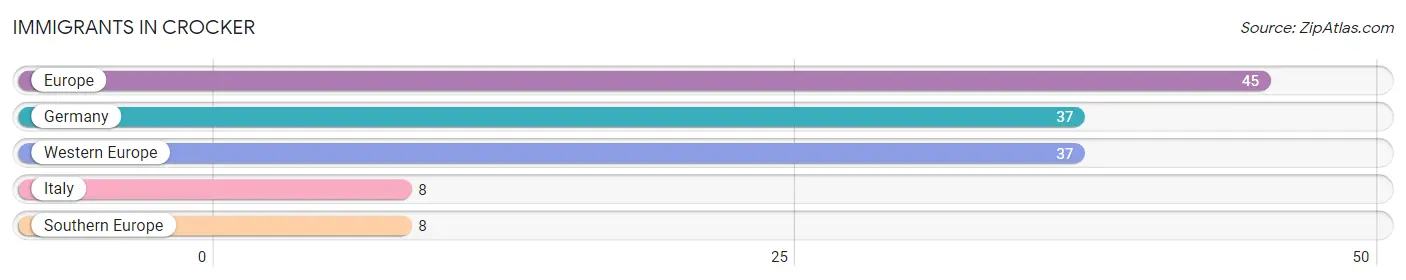
Immigrants in Crocker
The most numerous immigrant groups reported in Crocker came from Europe (45 | 3.7%), Germany (37 | 3.0%), Western Europe (37 | 3.0%), Italy (8 | 0.7%), and Southern Europe (8 | 0.7%), together accounting for 11.1% of all Crocker residents.
| Immigration Origin | # Population | % Population |
| Europe | 45 | 3.7% |
| Germany | 37 | 3.0% |
| Italy | 8 | 0.7% |
| Southern Europe | 8 | 0.7% |
| Western Europe | 37 | 3.0% | View All 5 Rows |
Sex and Age in Crocker
Sex and Age in Crocker
The most populous age groups in Crocker are 60 to 64 Years (94 | 16.1%) for men and 45 to 49 Years (102 | 16.1%) for women.
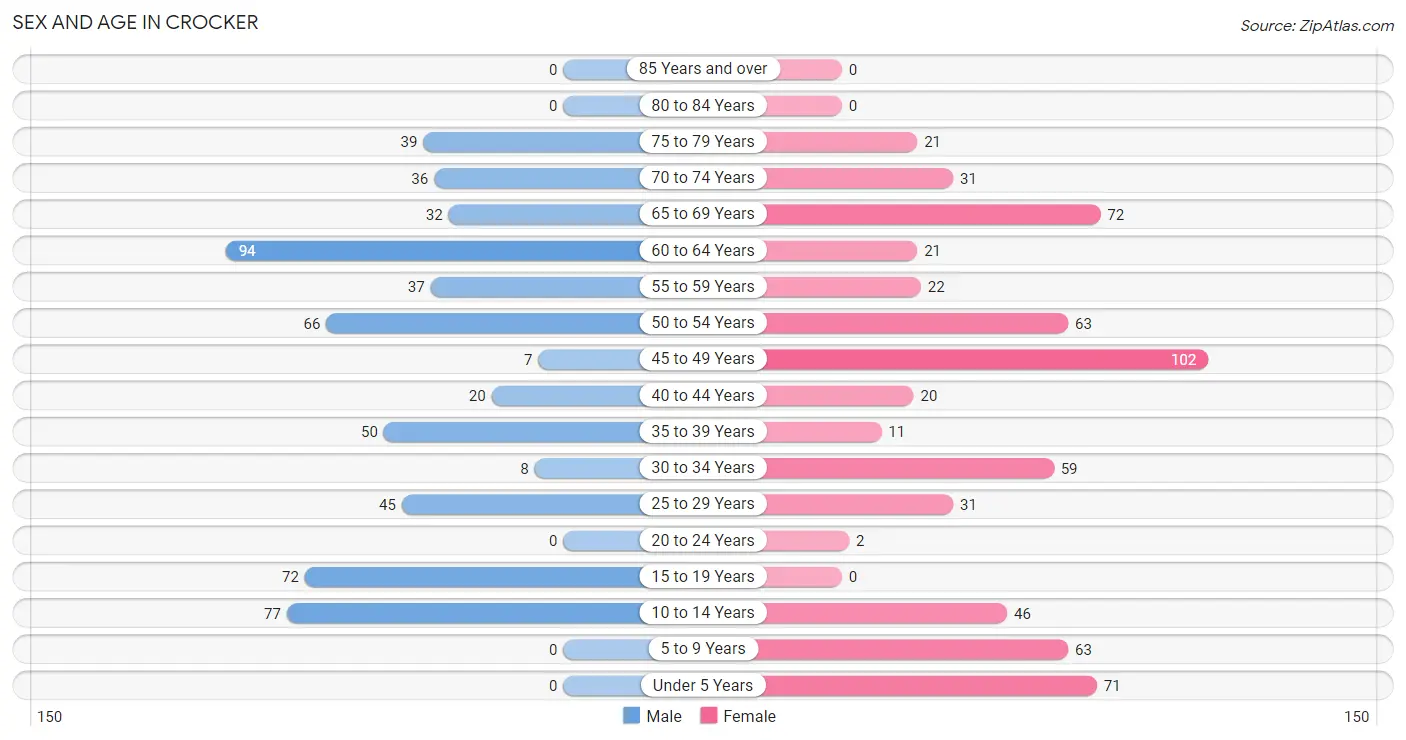
| Age Bracket | Male | Female |
| Under 5 Years | 0 (0.0%) | 71 (11.2%) |
| 5 to 9 Years | 0 (0.0%) | 63 (9.9%) |
| 10 to 14 Years | 77 (13.2%) | 46 (7.2%) |
| 15 to 19 Years | 72 (12.3%) | 0 (0.0%) |
| 20 to 24 Years | 0 (0.0%) | 2 (0.3%) |
| 25 to 29 Years | 45 (7.7%) | 31 (4.9%) |
| 30 to 34 Years | 8 (1.4%) | 59 (9.3%) |
| 35 to 39 Years | 50 (8.6%) | 11 (1.7%) |
| 40 to 44 Years | 20 (3.4%) | 20 (3.2%) |
| 45 to 49 Years | 7 (1.2%) | 102 (16.1%) |
| 50 to 54 Years | 66 (11.3%) | 63 (9.9%) |
| 55 to 59 Years | 37 (6.4%) | 22 (3.5%) |
| 60 to 64 Years | 94 (16.1%) | 21 (3.3%) |
| 65 to 69 Years | 32 (5.5%) | 72 (11.3%) |
| 70 to 74 Years | 36 (6.2%) | 31 (4.9%) |
| 75 to 79 Years | 39 (6.7%) | 21 (3.3%) |
| 80 to 84 Years | 0 (0.0%) | 0 (0.0%) |
| 85 Years and over | 0 (0.0%) | 0 (0.0%) |
| Total | 583 (100.0%) | 635 (100.0%) |
Families and Households in Crocker
Median Family Size in Crocker

| Family Type | # Families | Family Size |
| Married-Couple | 282 (82.0%) | 3.00 |
| Single Male/Father | 62 (18.0%) | 2.65 |
| Single Female/Mother | 0 (0.0%) | - |
| Total Families | 344 (100.0%) | 2.94 |
Median Household Size in Crocker
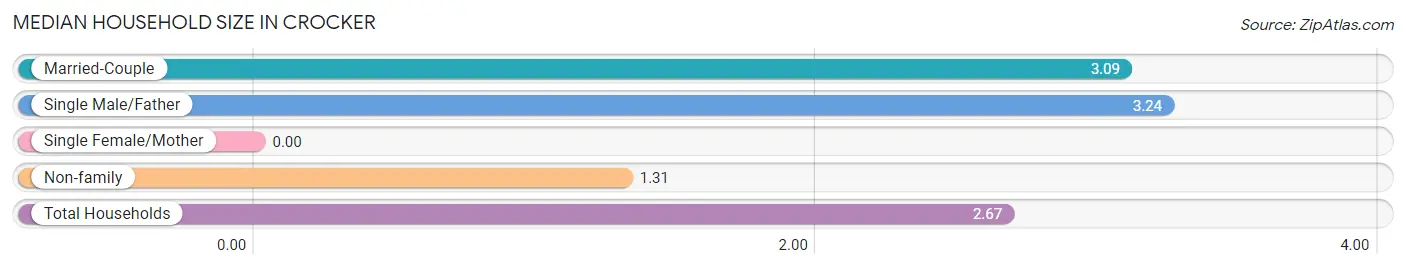
| Household Type | # Households | Household Size |
| Married-Couple | 282 (61.8%) | 3.09 |
| Single Male/Father | 62 (13.6%) | 3.24 |
| Single Female/Mother | 0 (0.0%) | - |
| Non-family | 112 (24.6%) | 1.31 |
| Total Households | 456 (100.0%) | 2.67 |
Household Size by Marriage Status in Crocker
Out of a total of 456 households in Crocker, 344 (75.4%) are family households, while 112 (24.6%) are nonfamily households. The most numerous type of family households are 2-person households, comprising 160, and the most common type of nonfamily households are 1-person households, comprising 85.
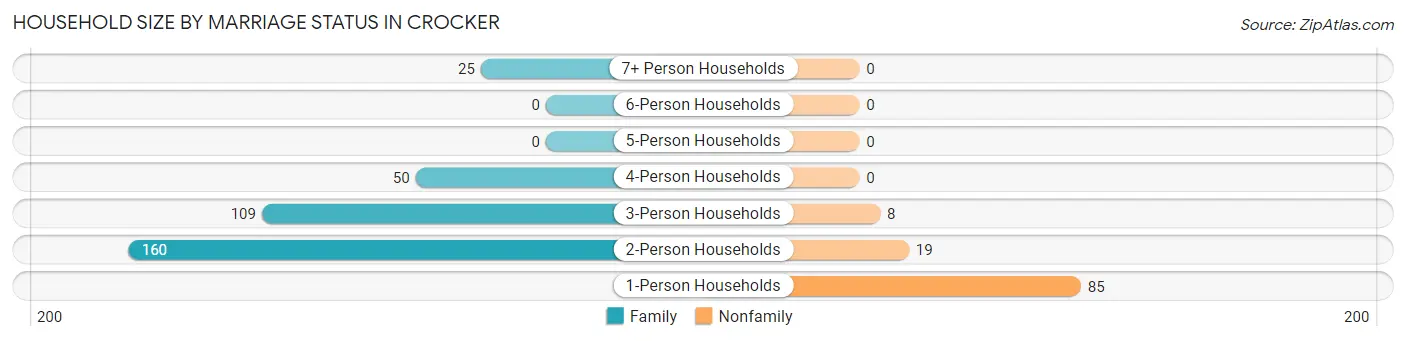
| Household Size | Family Households | Nonfamily Households |
| 1-Person Households | - | 85 (18.6%) |
| 2-Person Households | 160 (35.1%) | 19 (4.2%) |
| 3-Person Households | 109 (23.9%) | 8 (1.8%) |
| 4-Person Households | 50 (11.0%) | 0 (0.0%) |
| 5-Person Households | 0 (0.0%) | 0 (0.0%) |
| 6-Person Households | 0 (0.0%) | 0 (0.0%) |
| 7+ Person Households | 25 (5.5%) | 0 (0.0%) |
| Total | 344 (75.4%) | 112 (24.6%) |
Female Fertility in Crocker
Fertility by Age in Crocker
Average fertility rate in Crocker is 200.0 births per 1,000 women. Women in the age bracket of 20 to 34 years have the highest fertility rate with 489.0 births per 1,000 women. Women in the age bracket of 20 to 34 years acount for 100.0% of all women with births.
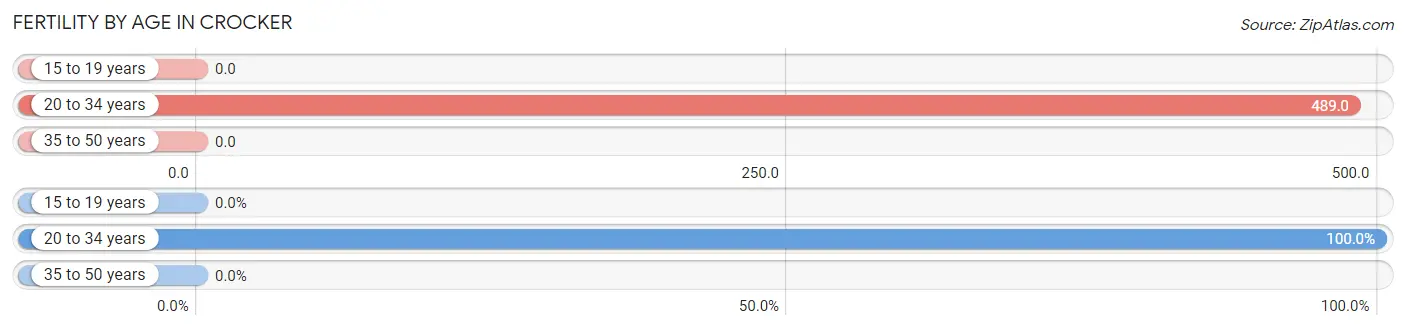
| Age Bracket | Women with Births | Births / 1,000 Women |
| 15 to 19 years | 0 (0.0%) | 0.0 |
| 20 to 34 years | 45 (100.0%) | 489.0 |
| 35 to 50 years | 0 (0.0%) | 0.0 |
| Total | 45 (100.0%) | 200.0 |
Fertility by Age by Marriage Status in Crocker
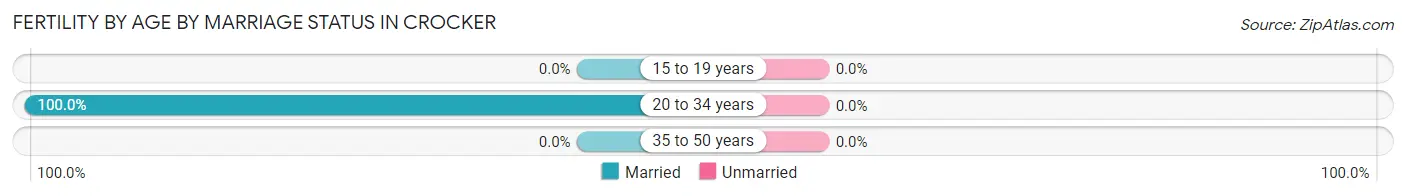
| Age Bracket | Married | Unmarried |
| 15 to 19 years | 0 (0.0%) | 0 (0.0%) |
| 20 to 34 years | 45 (100.0%) | 0 (0.0%) |
| 35 to 50 years | 0 (0.0%) | 0 (0.0%) |
| Total | 45 (100.0%) | 0 (0.0%) |
Fertility by Education in Crocker
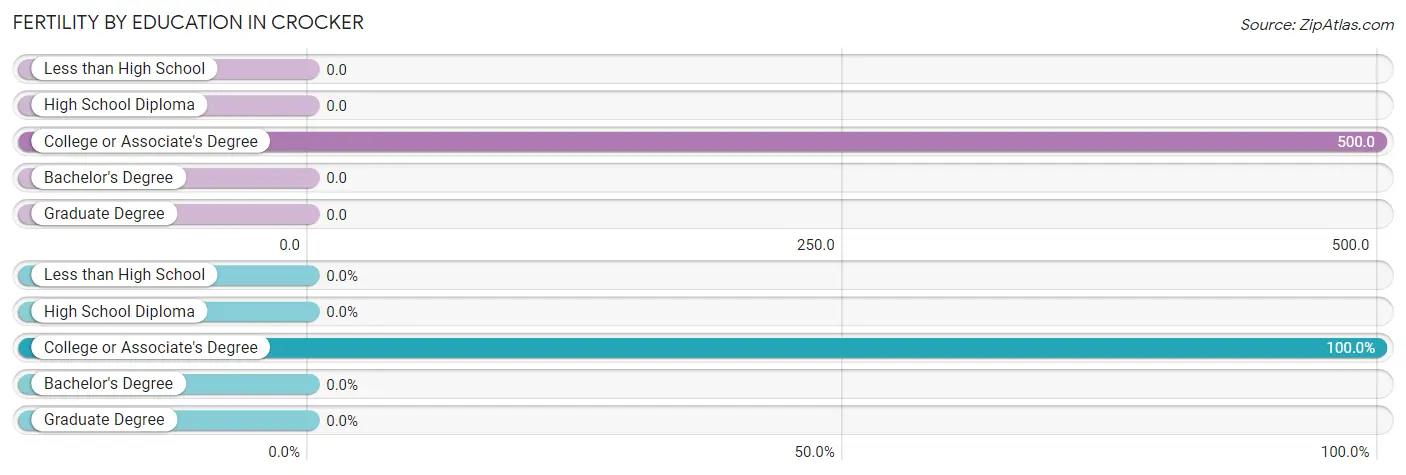
| Educational Attainment | Women with Births | Births / 1,000 Women |
| Less than High School | 0 (0.0%) | 0.0 |
| High School Diploma | 0 (0.0%) | 0.0 |
| College or Associate's Degree | 45 (100.0%) | 500.0 |
| Bachelor's Degree | 0 (0.0%) | 0.0 |
| Graduate Degree | 0 (0.0%) | 0.0 |
| Total | 45 (100.0%) | 200.0 |
Fertility by Education by Marriage Status in Crocker
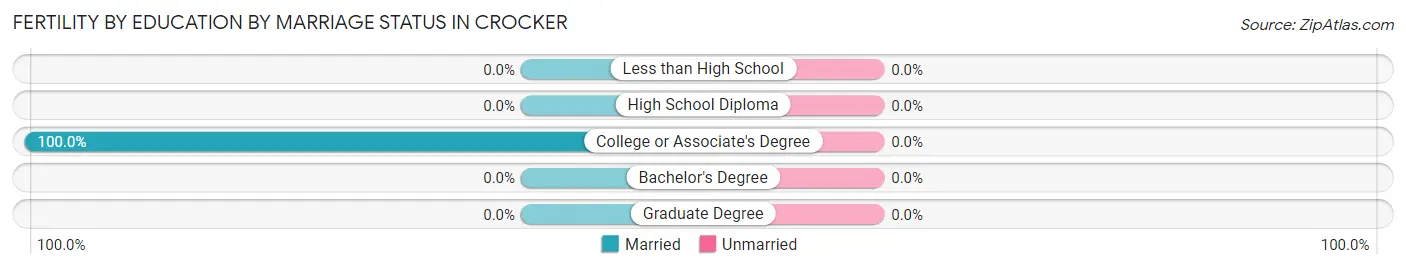
| Educational Attainment | Married | Unmarried |
| Less than High School | 0 (0.0%) | 0 (0.0%) |
| High School Diploma | 0 (0.0%) | 0 (0.0%) |
| College or Associate's Degree | 45 (100.0%) | 0 (0.0%) |
| Bachelor's Degree | 0 (0.0%) | 0 (0.0%) |
| Graduate Degree | 0 (0.0%) | 0 (0.0%) |
| Total | 45 (100.0%) | 0 (0.0%) |
Income in Crocker
Income Overview in Crocker
Per Capita Income in Crocker is $43,575, while median incomes of families and households are $112,000 and $109,091 respectively.
| Characteristic | Number | Measure |
| Per Capita Income | 1,218 | $43,575 |
| Median Family Income | 344 | $112,000 |
| Mean Family Income | 344 | $124,387 |
| Median Household Income | 456 | $109,091 |
| Mean Household Income | 456 | $115,622 |
| Income Deficit | 344 | $0 |
| Wage / Income Gap (%) | 1,218 | 48.60% |
| Wage / Income Gap ($) | 1,218 | 51.40¢ per $1 |
| Gini / Inequality Index | 1,218 | 0.35 |
Earnings by Sex in Crocker
Average Earnings in Crocker are $53,066, $84,545 for men and $43,452 for women, a difference of 48.6%.
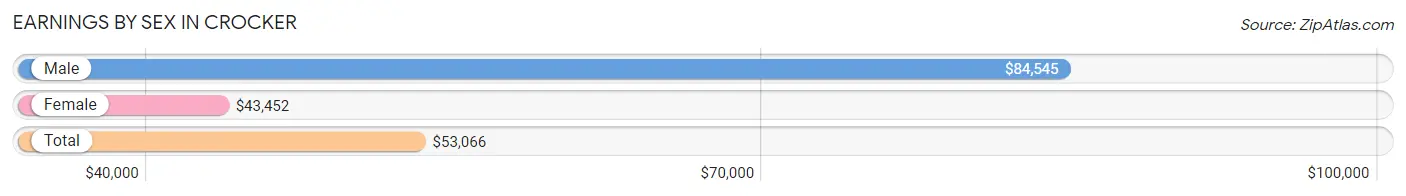
| Sex | Number | Average Earnings |
| Male | 310 (54.2%) | $84,545 |
| Female | 262 (45.8%) | $43,452 |
| Total | 572 (100.0%) | $53,066 |
Earnings by Sex by Income Bracket in Crocker
The most common earnings brackets in Crocker are $100,000+ for men (153 | 49.3%) and $50,000 to $54,999 for women (53 | 20.2%).
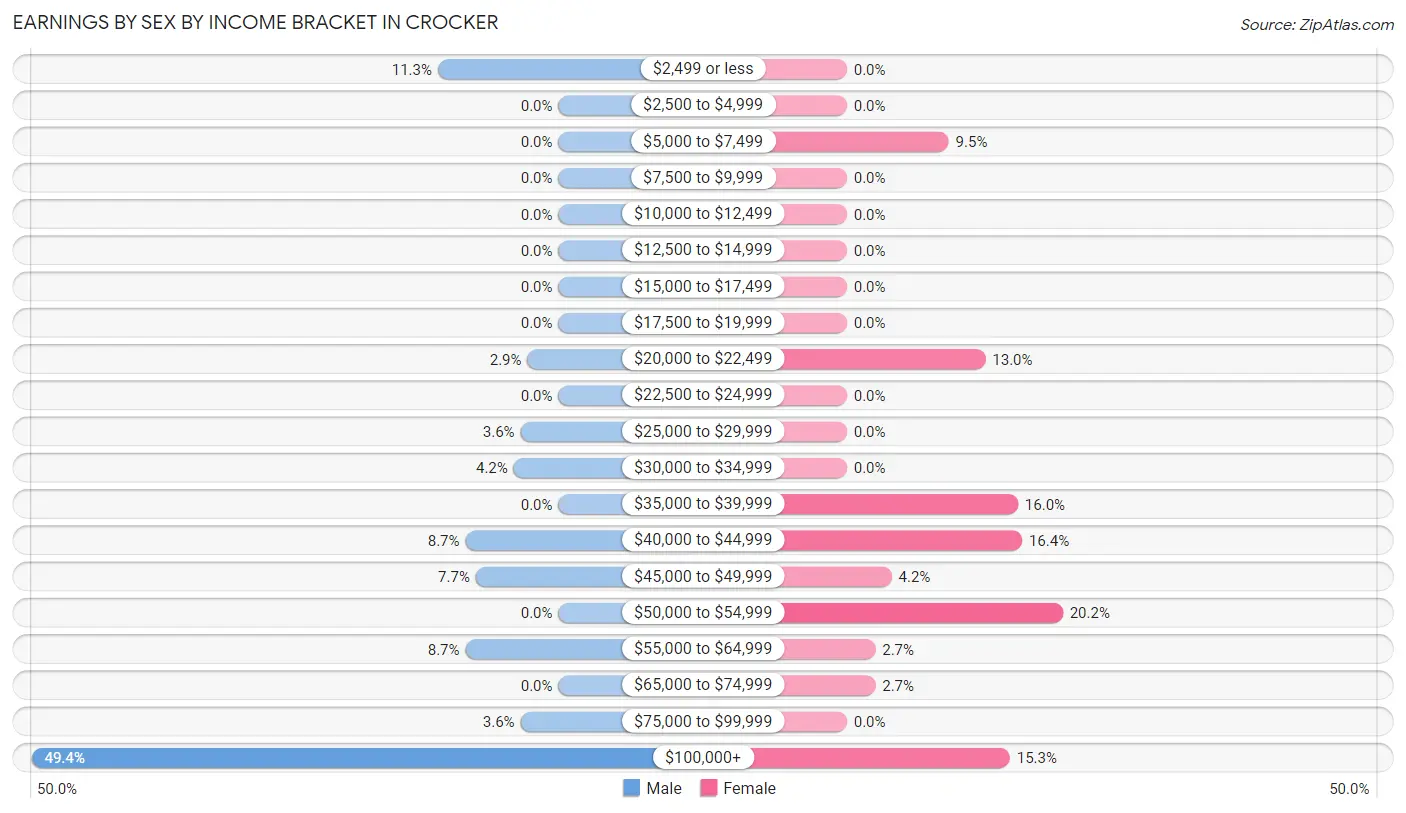
| Income | Male | Female |
| $2,499 or less | 35 (11.3%) | 0 (0.0%) |
| $2,500 to $4,999 | 0 (0.0%) | 0 (0.0%) |
| $5,000 to $7,499 | 0 (0.0%) | 25 (9.5%) |
| $7,500 to $9,999 | 0 (0.0%) | 0 (0.0%) |
| $10,000 to $12,499 | 0 (0.0%) | 0 (0.0%) |
| $12,500 to $14,999 | 0 (0.0%) | 0 (0.0%) |
| $15,000 to $17,499 | 0 (0.0%) | 0 (0.0%) |
| $17,500 to $19,999 | 0 (0.0%) | 0 (0.0%) |
| $20,000 to $22,499 | 9 (2.9%) | 34 (13.0%) |
| $22,500 to $24,999 | 0 (0.0%) | 0 (0.0%) |
| $25,000 to $29,999 | 11 (3.5%) | 0 (0.0%) |
| $30,000 to $34,999 | 13 (4.2%) | 0 (0.0%) |
| $35,000 to $39,999 | 0 (0.0%) | 42 (16.0%) |
| $40,000 to $44,999 | 27 (8.7%) | 43 (16.4%) |
| $45,000 to $49,999 | 24 (7.7%) | 11 (4.2%) |
| $50,000 to $54,999 | 0 (0.0%) | 53 (20.2%) |
| $55,000 to $64,999 | 27 (8.7%) | 7 (2.7%) |
| $65,000 to $74,999 | 0 (0.0%) | 7 (2.7%) |
| $75,000 to $99,999 | 11 (3.5%) | 0 (0.0%) |
| $100,000+ | 153 (49.3%) | 40 (15.3%) |
| Total | 310 (100.0%) | 262 (100.0%) |
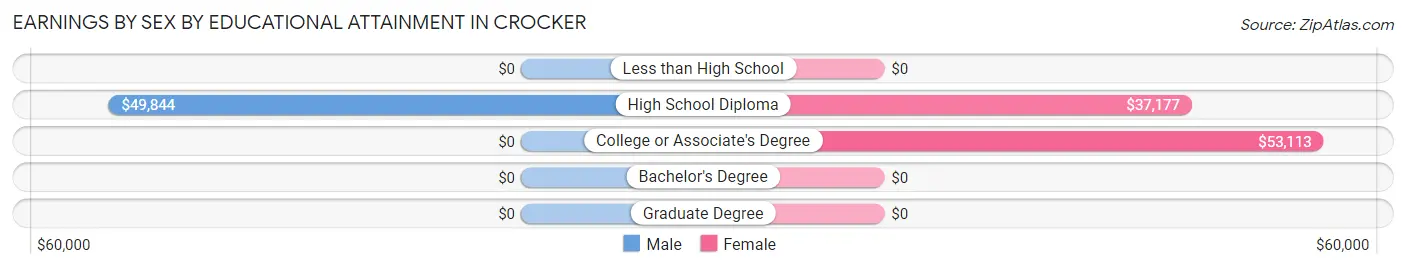
Earnings by Sex by Educational Attainment in Crocker
Average earnings in Crocker are $84,545 for men and $43,571 for women, a difference of 48.5%. Men with an educational attainment of high school diploma enjoy the highest average annual earnings of $49,844, while those with high school diploma education earn the least with $49,844. Women with an educational attainment of college or associate's degree earn the most with the average annual earnings of $53,113, while those with high school diploma education have the smallest earnings of $37,177.
| Educational Attainment | Male Income | Female Income |
| Less than High School | - | - |
| High School Diploma | $49,844 | $37,177 |
| College or Associate's Degree | - | - |
| Bachelor's Degree | - | - |
| Graduate Degree | - | - |
| Total | $84,545 | $43,571 |
Family Income in Crocker
Family Income Brackets in Crocker
According to the Crocker family income data, there are 144 families falling into the $100,000 to $149,999 income range, which is the most common income bracket and makes up 41.9% of all families.
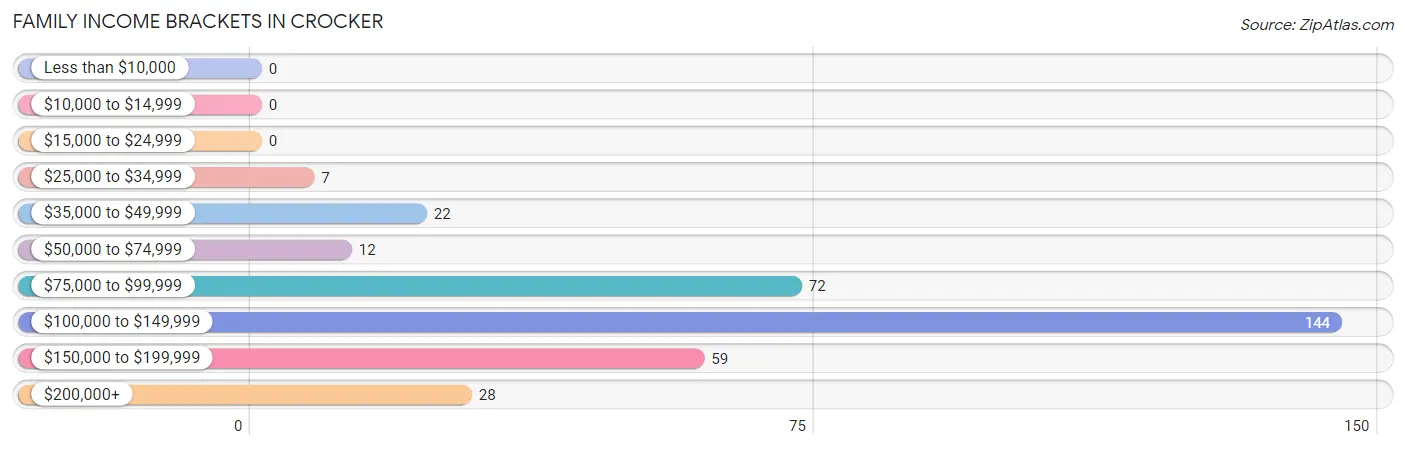
| Income Bracket | # Families | % Families |
| Less than $10,000 | 0 | 0.0% |
| $10,000 to $14,999 | 0 | 0.0% |
| $15,000 to $24,999 | 0 | 0.0% |
| $25,000 to $34,999 | 7 | 2.0% |
| $35,000 to $49,999 | 22 | 6.4% |
| $50,000 to $74,999 | 12 | 3.5% |
| $75,000 to $99,999 | 72 | 20.9% |
| $100,000 to $149,999 | 144 | 41.9% |
| $150,000 to $199,999 | 59 | 17.2% |
| $200,000+ | 28 | 8.1% |
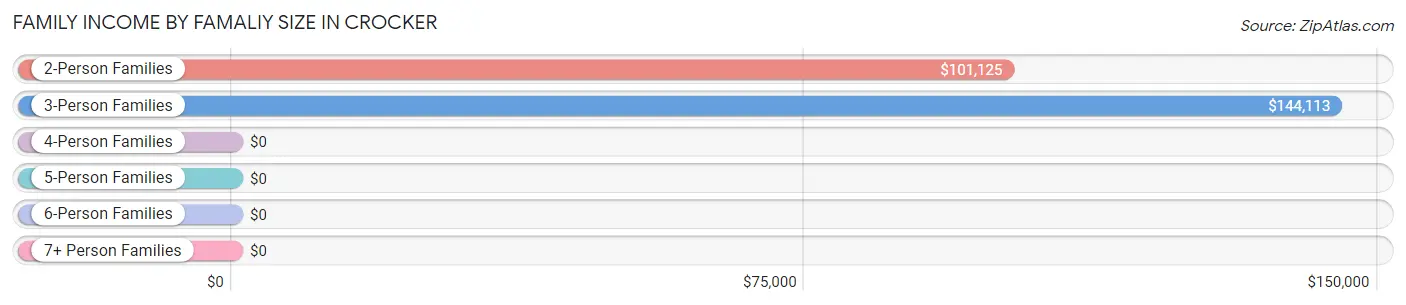
Family Income by Famaliy Size in Crocker
3-person families (124 | 36.0%) account for the highest median family income in Crocker with $144,113 per family, while 2-person families (182 | 52.9%) have the highest median income of $50,562 per family member.
| Income Bracket | # Families | Median Income |
| 2-Person Families | 182 (52.9%) | $101,125 |
| 3-Person Families | 124 (36.0%) | $144,113 |
| 4-Person Families | 13 (3.8%) | $0 |
| 5-Person Families | 0 (0.0%) | $0 |
| 6-Person Families | 0 (0.0%) | $0 |
| 7+ Person Families | 25 (7.3%) | $0 |
| Total | 344 (100.0%) | $112,000 |
Family Income by Number of Earners in Crocker
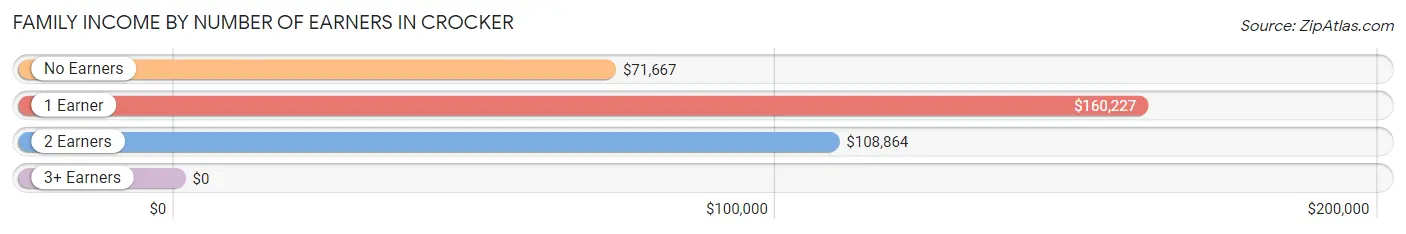
| Number of Earners | # Families | Median Income |
| No Earners | 30 (8.7%) | $71,667 |
| 1 Earner | 144 (41.9%) | $160,227 |
| 2 Earners | 156 (45.4%) | $108,864 |
| 3+ Earners | 14 (4.1%) | $0 |
| Total | 344 (100.0%) | $112,000 |
Household Income in Crocker
Household Income Brackets in Crocker
With 168 households falling in the category, the $100,000 to $149,999 income range is the most frequent in Crocker, accounting for 36.8% of all households.
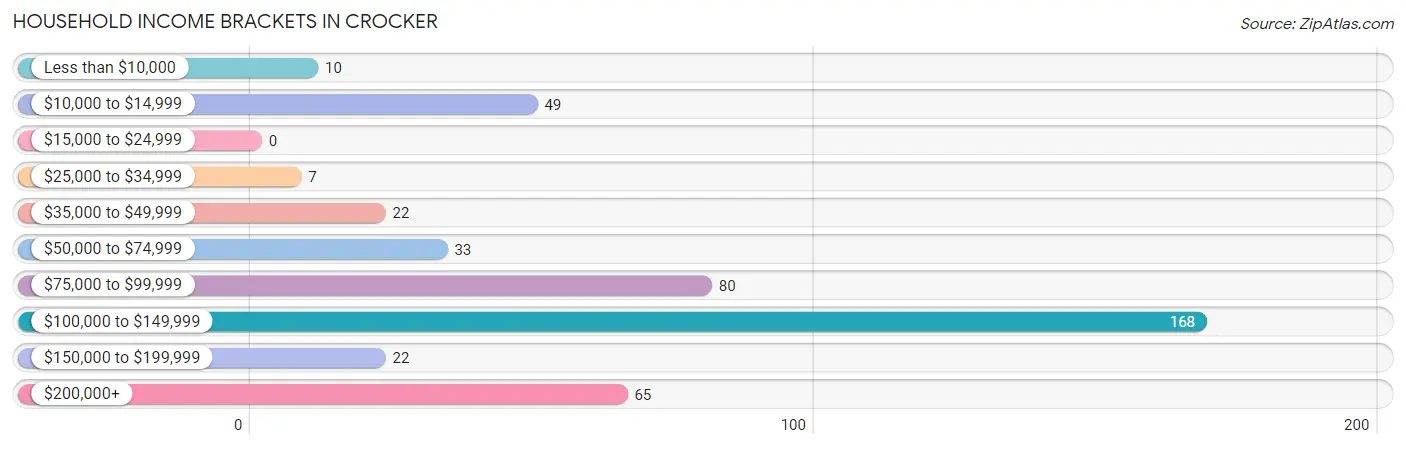
| Income Bracket | # Households | % Households |
| Less than $10,000 | 10 | 2.2% |
| $10,000 to $14,999 | 49 | 10.7% |
| $15,000 to $24,999 | 0 | 0.0% |
| $25,000 to $34,999 | 7 | 1.5% |
| $35,000 to $49,999 | 22 | 4.8% |
| $50,000 to $74,999 | 33 | 7.2% |
| $75,000 to $99,999 | 80 | 17.5% |
| $100,000 to $149,999 | 168 | 36.8% |
| $150,000 to $199,999 | 22 | 4.8% |
| $200,000+ | 65 | 14.3% |
Household Income by Householder Age in Crocker
The median household income in Crocker is $109,091, with the highest median household income of $143,185 found in the 25 to 44 years age bracket for the primary householder. A total of 95 households (20.8%) fall into this category.

| Income Bracket | # Households | Median Income |
| 15 to 24 Years | 0 (0.0%) | $0 |
| 25 to 44 Years | 95 (20.8%) | $143,185 |
| 45 to 64 Years | 195 (42.8%) | $111,464 |
| 65+ Years | 166 (36.4%) | $70,625 |
| Total | 456 (100.0%) | $109,091 |
Poverty in Crocker
Income Below Poverty by Sex and Age in Crocker
With 1.5% poverty level for males and 11.0% for females among the residents of Crocker, 45 to 54 year old males and 65 to 74 year old females are the most vulnerable to poverty, with 9 males (12.3%) and 57 females (55.3%) in their respective age groups living below the poverty level.
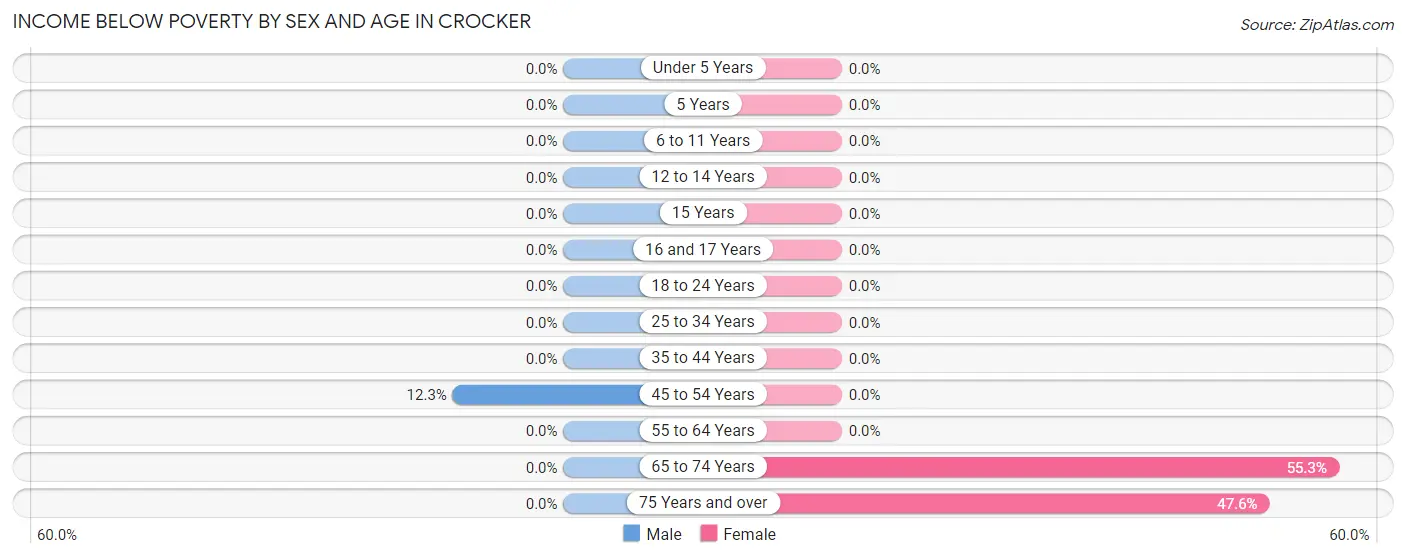
| Age Bracket | Male | Female |
| Under 5 Years | 0 (0.0%) | 0 (0.0%) |
| 5 Years | 0 (0.0%) | 0 (0.0%) |
| 6 to 11 Years | 0 (0.0%) | 0 (0.0%) |
| 12 to 14 Years | 0 (0.0%) | 0 (0.0%) |
| 15 Years | 0 (0.0%) | 0 (0.0%) |
| 16 and 17 Years | 0 (0.0%) | 0 (0.0%) |
| 18 to 24 Years | 0 (0.0%) | 0 (0.0%) |
| 25 to 34 Years | 0 (0.0%) | 0 (0.0%) |
| 35 to 44 Years | 0 (0.0%) | 0 (0.0%) |
| 45 to 54 Years | 9 (12.3%) | 0 (0.0%) |
| 55 to 64 Years | 0 (0.0%) | 0 (0.0%) |
| 65 to 74 Years | 0 (0.0%) | 57 (55.3%) |
| 75 Years and over | 0 (0.0%) | 10 (47.6%) |
| Total | 9 (1.5%) | 67 (11.0%) |
Income Above Poverty by Sex and Age in Crocker
According to the poverty statistics in Crocker, males aged 12 to 14 years and females aged under 5 years are the age groups that are most secure financially, with 100.0% of males and 100.0% of females in these age groups living above the poverty line.

| Age Bracket | Male | Female |
| Under 5 Years | 0 (0.0%) | 48 (100.0%) |
| 5 Years | 0 (0.0%) | 0 (0.0%) |
| 6 to 11 Years | 0 (0.0%) | 96 (100.0%) |
| 12 to 14 Years | 77 (100.0%) | 13 (100.0%) |
| 15 Years | 38 (100.0%) | 0 (0.0%) |
| 16 and 17 Years | 16 (100.0%) | 0 (0.0%) |
| 18 to 24 Years | 18 (100.0%) | 2 (100.0%) |
| 25 to 34 Years | 53 (100.0%) | 90 (100.0%) |
| 35 to 44 Years | 70 (100.0%) | 31 (100.0%) |
| 45 to 54 Years | 64 (87.7%) | 165 (100.0%) |
| 55 to 64 Years | 131 (100.0%) | 43 (100.0%) |
| 65 to 74 Years | 68 (100.0%) | 46 (44.7%) |
| 75 Years and over | 39 (100.0%) | 11 (52.4%) |
| Total | 574 (98.5%) | 545 (89.0%) |
Income Below Poverty Among Married-Couple Families in Crocker
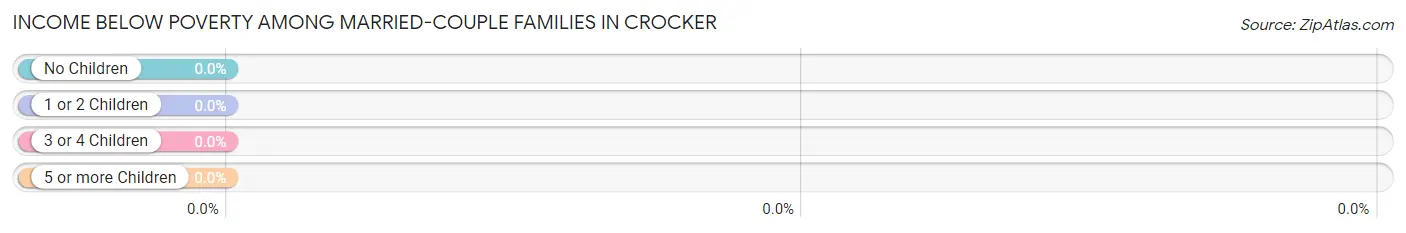
| Children | Above Poverty | Below Poverty |
| No Children | 202 (100.0%) | 0 (0.0%) |
| 1 or 2 Children | 55 (100.0%) | 0 (0.0%) |
| 3 or 4 Children | 0 (0.0%) | 0 (0.0%) |
| 5 or more Children | 25 (100.0%) | 0 (0.0%) |
| Total | 282 (100.0%) | 0 (0.0%) |
Income Below Poverty Among Single-Parent Households in Crocker
| Children | Single Father | Single Mother |
| No Children | 0 (0.0%) | 0 (0.0%) |
| 1 or 2 Children | 0 (0.0%) | 0 (0.0%) |
| 3 or 4 Children | 0 (0.0%) | 0 (0.0%) |
| 5 or more Children | 0 (0.0%) | 0 (0.0%) |
| Total | 0 (0.0%) | 0 (0.0%) |
Income Below Poverty Among Married-Couple vs Single-Parent Households in Crocker
| Children | Married-Couple Families | Single-Parent Households |
| No Children | 0 (0.0%) | 0 (0.0%) |
| 1 or 2 Children | 0 (0.0%) | 0 (0.0%) |
| 3 or 4 Children | 0 (0.0%) | 0 (0.0%) |
| 5 or more Children | 0 (0.0%) | 0 (0.0%) |
| Total | 0 (0.0%) | 0 (0.0%) |
Employment Characteristics in Crocker
Employment by Class of Employer in Crocker
Among the 455 employed individuals in Crocker, private company employees (305 | 67.0%), self-employed (not incorporated) (55 | 12.1%), and local government employees (39 | 8.6%) make up the most common classes of employment.
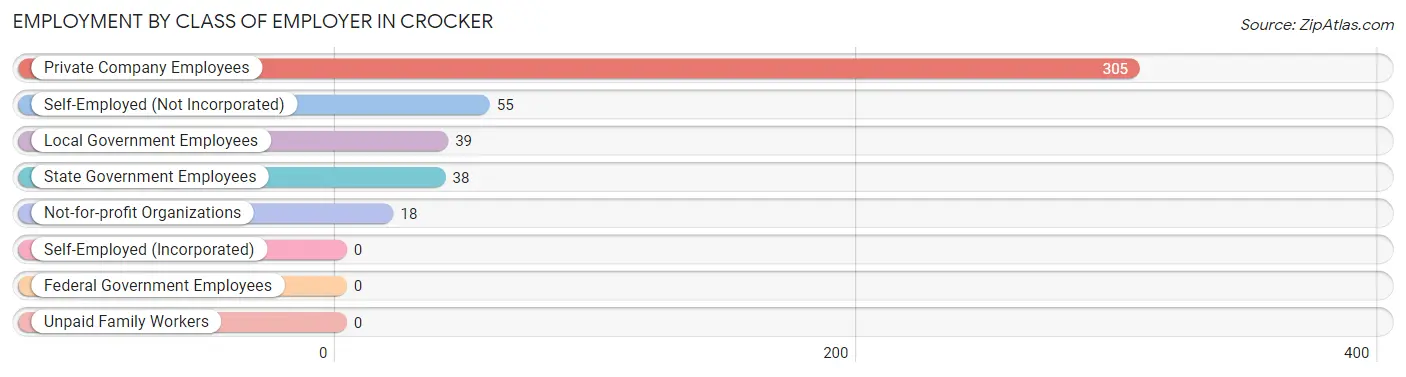
| Employer Class | # Employees | % Employees |
| Private Company Employees | 305 | 67.0% |
| Self-Employed (Incorporated) | 0 | 0.0% |
| Self-Employed (Not Incorporated) | 55 | 12.1% |
| Not-for-profit Organizations | 18 | 4.0% |
| Local Government Employees | 39 | 8.6% |
| State Government Employees | 38 | 8.4% |
| Federal Government Employees | 0 | 0.0% |
| Unpaid Family Workers | 0 | 0.0% |
| Total | 455 | 100.0% |
Employment Status by Age in Crocker
According to the labor force statistics for Crocker, out of the total population over 16 years of age (923), 54.5% or 503 individuals are in the labor force, with 2.2% or 11 of them unemployed. The age group with the highest labor force participation rate is 20 to 24 years, with 100.0% or 2 individuals in the labor force. Within the labor force, the 65 to 74 years age range has the highest percentage of unemployed individuals, with 24.4% or 11 of them being unemployed.
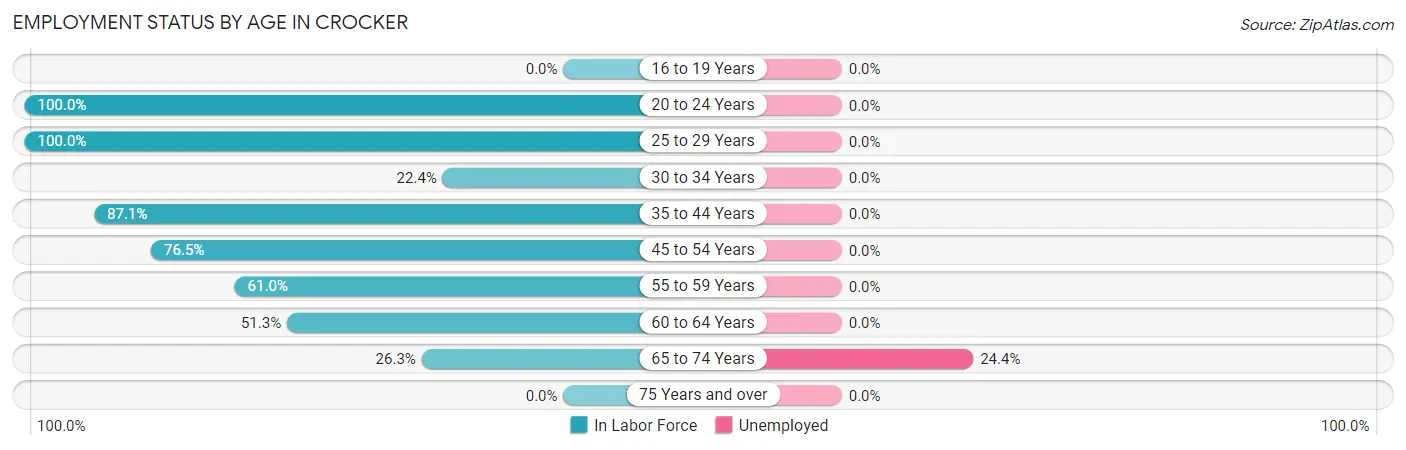
| Age Bracket | In Labor Force | Unemployed |
| 16 to 19 Years | 0 (0.0%) | 0 (0.0%) |
| 20 to 24 Years | 2 (100.0%) | 0 (0.0%) |
| 25 to 29 Years | 76 (100.0%) | 0 (0.0%) |
| 30 to 34 Years | 15 (22.4%) | 0 (0.0%) |
| 35 to 44 Years | 88 (87.1%) | 0 (0.0%) |
| 45 to 54 Years | 182 (76.5%) | 0 (0.0%) |
| 55 to 59 Years | 36 (61.0%) | 0 (0.0%) |
| 60 to 64 Years | 59 (51.3%) | 0 (0.0%) |
| 65 to 74 Years | 45 (26.3%) | 11 (24.4%) |
| 75 Years and over | 0 (0.0%) | 0 (0.0%) |
| Total | 503 (54.5%) | 11 (2.2%) |
Employment Status by Educational Attainment in Crocker
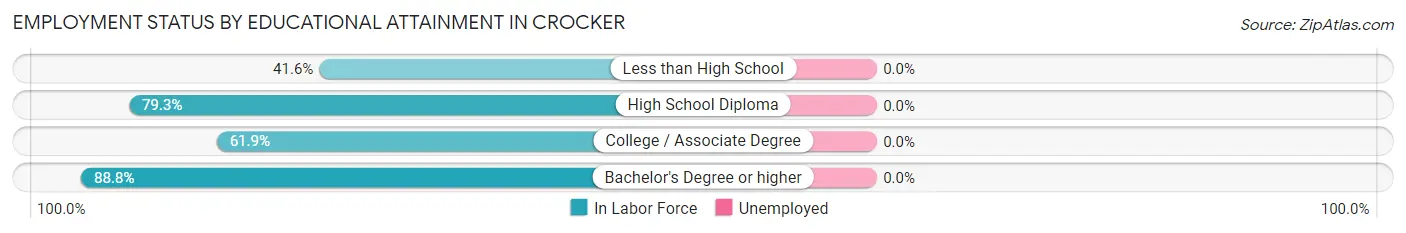
| Educational Attainment | In Labor Force | Unemployed |
| Less than High School | 32 (41.6%) | 0 (0.0%) |
| High School Diploma | 157 (79.3%) | 0 (0.0%) |
| College / Associate Degree | 164 (61.9%) | 0 (0.0%) |
| Bachelor's Degree or higher | 103 (88.8%) | 0 (0.0%) |
| Total | 456 (69.5%) | 0 (0.0%) |
Employment Occupations by Sex in Crocker
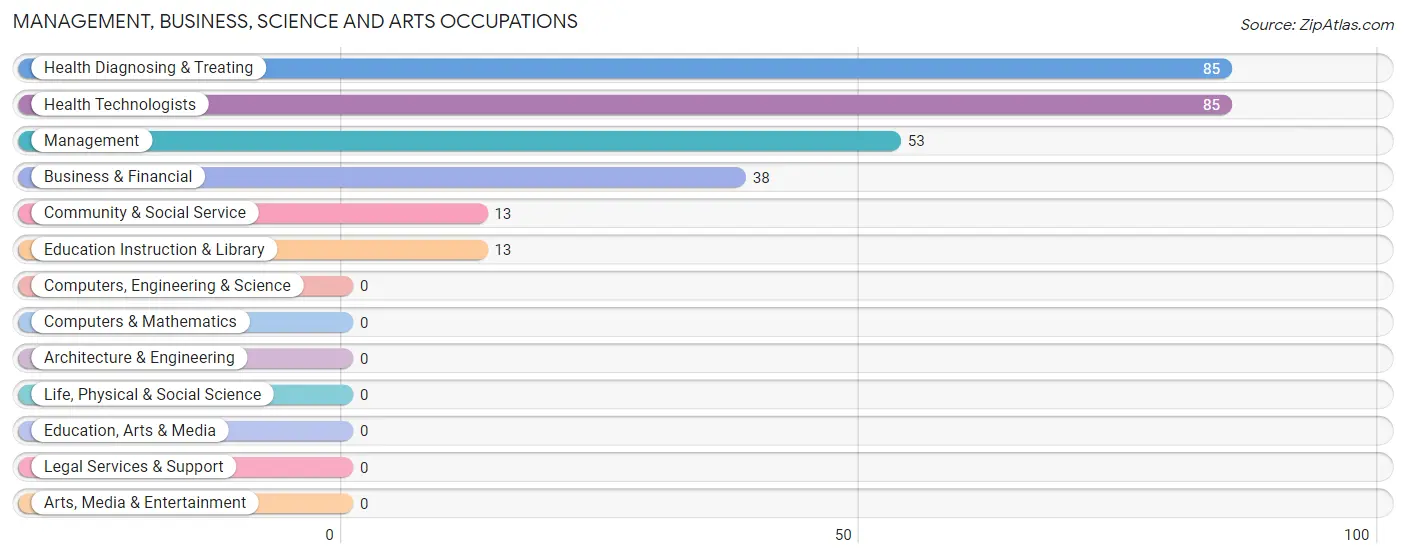
Management, Business, Science and Arts Occupations
The most common Management, Business, Science and Arts occupations in Crocker are Health Diagnosing & Treating (85 | 17.3%), Health Technologists (85 | 17.3%), Management (53 | 10.8%), Business & Financial (38 | 7.7%), and Community & Social Service (13 | 2.6%).
Management, Business, Science and Arts Occupations by Sex
Within the Management, Business, Science and Arts occupations in Crocker, the most male-oriented occupations are Community & Social Service (100.0%), Education Instruction & Library (100.0%), and Health Diagnosing & Treating (56.5%), while the most female-oriented occupations are Business & Financial (100.0%), Management (47.2%), and Health Diagnosing & Treating (43.5%).
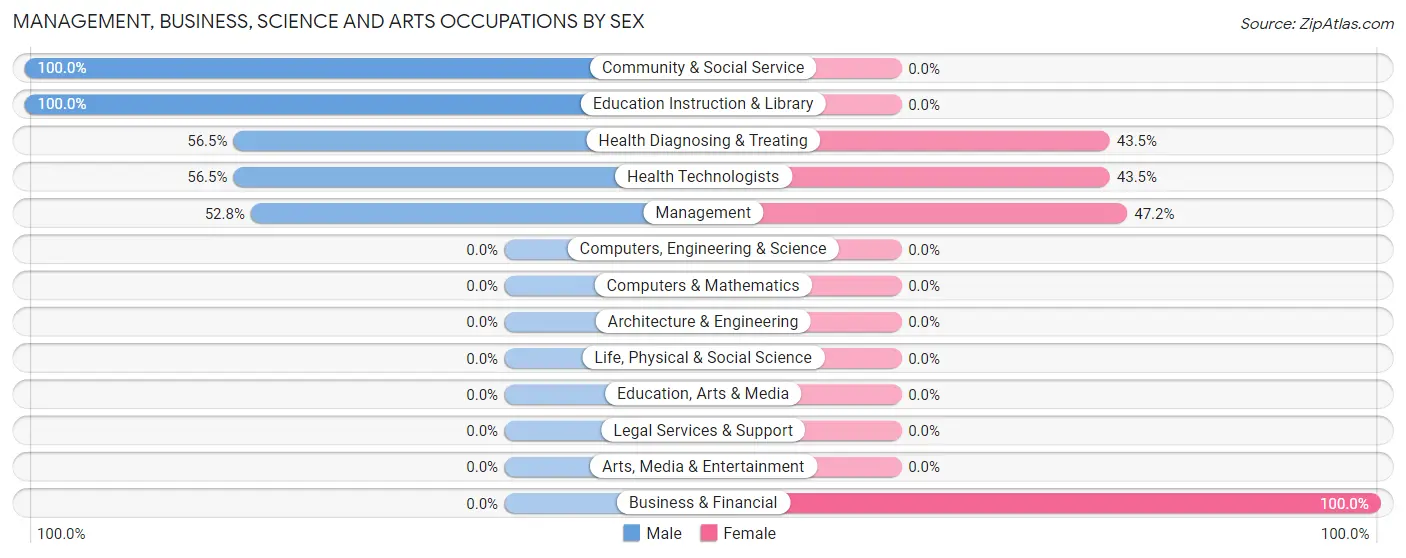
| Occupation | Male | Female |
| Management | 28 (52.8%) | 25 (47.2%) |
| Business & Financial | 0 (0.0%) | 38 (100.0%) |
| Computers, Engineering & Science | 0 (0.0%) | 0 (0.0%) |
| Computers & Mathematics | 0 (0.0%) | 0 (0.0%) |
| Architecture & Engineering | 0 (0.0%) | 0 (0.0%) |
| Life, Physical & Social Science | 0 (0.0%) | 0 (0.0%) |
| Community & Social Service | 13 (100.0%) | 0 (0.0%) |
| Education, Arts & Media | 0 (0.0%) | 0 (0.0%) |
| Legal Services & Support | 0 (0.0%) | 0 (0.0%) |
| Education Instruction & Library | 13 (100.0%) | 0 (0.0%) |
| Arts, Media & Entertainment | 0 (0.0%) | 0 (0.0%) |
| Health Diagnosing & Treating | 48 (56.5%) | 37 (43.5%) |
| Health Technologists | 48 (56.5%) | 37 (43.5%) |
| Total (Category) | 89 (47.1%) | 100 (52.9%) |
| Total (Overall) | 264 (53.7%) | 228 (46.3%) |
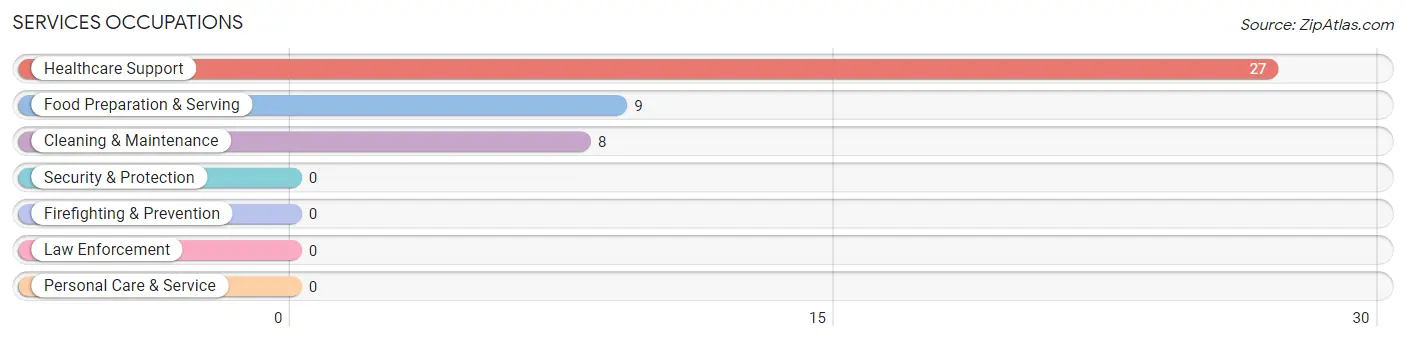
Services Occupations
The most common Services occupations in Crocker are Healthcare Support (27 | 5.5%), Food Preparation & Serving (9 | 1.8%), and Cleaning & Maintenance (8 | 1.6%).
Services Occupations by Sex
Within the Services occupations in Crocker, the most male-oriented occupations are Cleaning & Maintenance (100.0%), and Healthcare Support (59.3%), while the most female-oriented occupations are Food Preparation & Serving (100.0%), and Healthcare Support (40.7%).
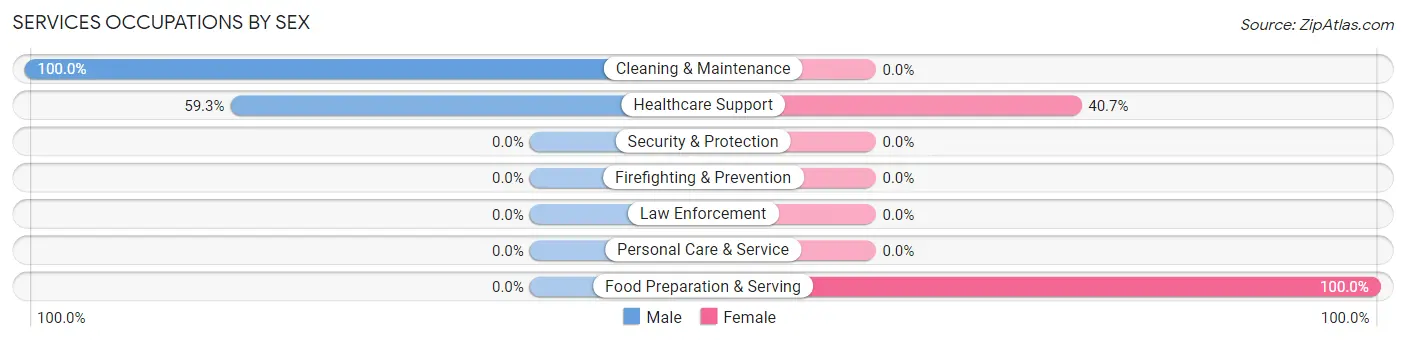
| Occupation | Male | Female |
| Healthcare Support | 16 (59.3%) | 11 (40.7%) |
| Security & Protection | 0 (0.0%) | 0 (0.0%) |
| Firefighting & Prevention | 0 (0.0%) | 0 (0.0%) |
| Law Enforcement | 0 (0.0%) | 0 (0.0%) |
| Food Preparation & Serving | 0 (0.0%) | 9 (100.0%) |
| Cleaning & Maintenance | 8 (100.0%) | 0 (0.0%) |
| Personal Care & Service | 0 (0.0%) | 0 (0.0%) |
| Total (Category) | 24 (54.5%) | 20 (45.5%) |
| Total (Overall) | 264 (53.7%) | 228 (46.3%) |
Sales and Office Occupations
The most common Sales and Office occupations in Crocker are Office & Administration (22 | 4.5%), and Sales & Related (19 | 3.9%).
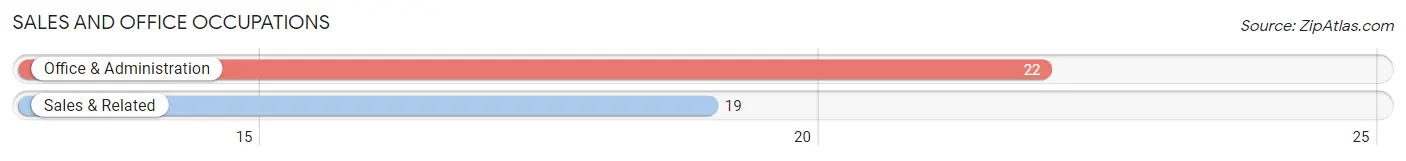
Sales and Office Occupations by Sex

| Occupation | Male | Female |
| Sales & Related | 16 (84.2%) | 3 (15.8%) |
| Office & Administration | 0 (0.0%) | 22 (100.0%) |
| Total (Category) | 16 (39.0%) | 25 (61.0%) |
| Total (Overall) | 264 (53.7%) | 228 (46.3%) |
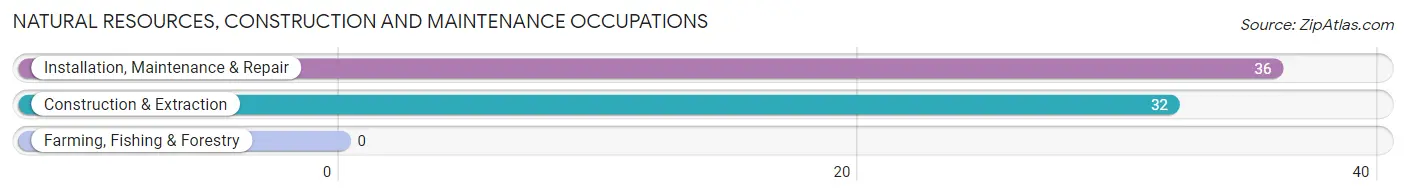
Natural Resources, Construction and Maintenance Occupations
The most common Natural Resources, Construction and Maintenance occupations in Crocker are Installation, Maintenance & Repair (36 | 7.3%), and Construction & Extraction (32 | 6.5%).
Natural Resources, Construction and Maintenance Occupations by Sex
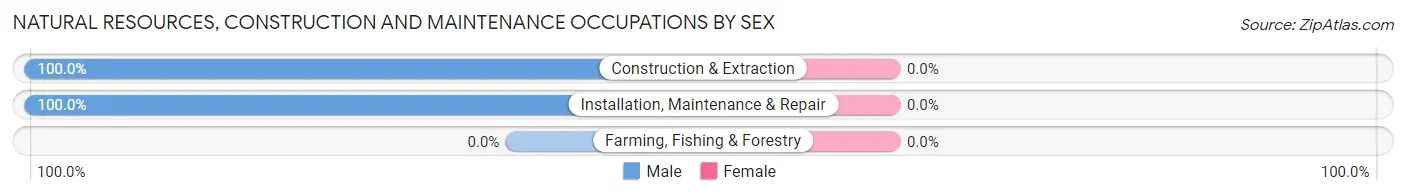
| Occupation | Male | Female |
| Farming, Fishing & Forestry | 0 (0.0%) | 0 (0.0%) |
| Construction & Extraction | 32 (100.0%) | 0 (0.0%) |
| Installation, Maintenance & Repair | 36 (100.0%) | 0 (0.0%) |
| Total (Category) | 68 (100.0%) | 0 (0.0%) |
| Total (Overall) | 264 (53.7%) | 228 (46.3%) |
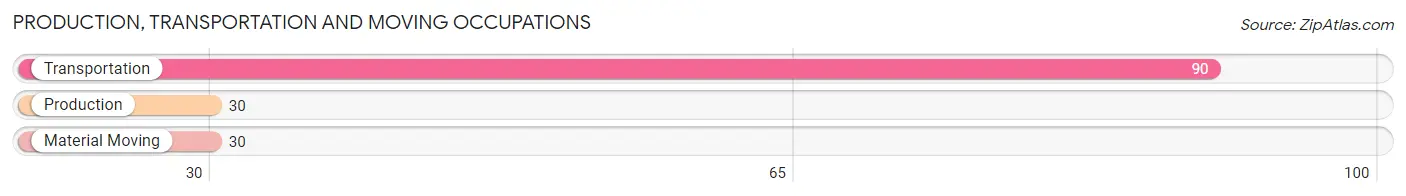
Production, Transportation and Moving Occupations
The most common Production, Transportation and Moving occupations in Crocker are Transportation (90 | 18.3%), Production (30 | 6.1%), and Material Moving (30 | 6.1%).
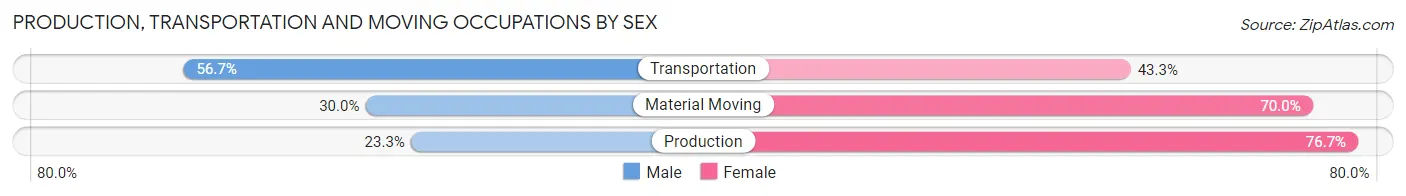
Production, Transportation and Moving Occupations by Sex
| Occupation | Male | Female |
| Production | 7 (23.3%) | 23 (76.7%) |
| Transportation | 51 (56.7%) | 39 (43.3%) |
| Material Moving | 9 (30.0%) | 21 (70.0%) |
| Total (Category) | 67 (44.7%) | 83 (55.3%) |
| Total (Overall) | 264 (53.7%) | 228 (46.3%) |
Employment Industries by Sex in Crocker
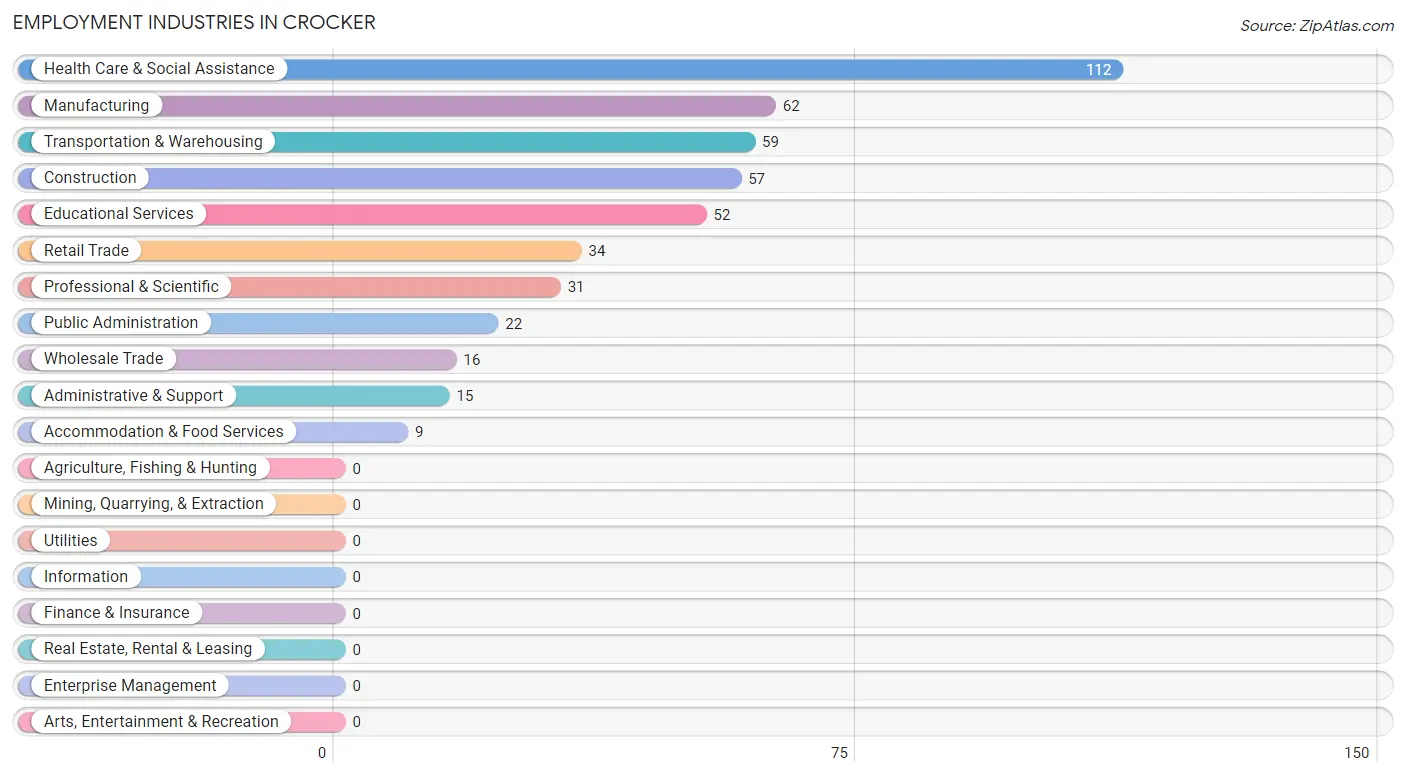
Employment Industries in Crocker
The major employment industries in Crocker include Health Care & Social Assistance (112 | 22.8%), Manufacturing (62 | 12.6%), Transportation & Warehousing (59 | 12.0%), Construction (57 | 11.6%), and Educational Services (52 | 10.6%).
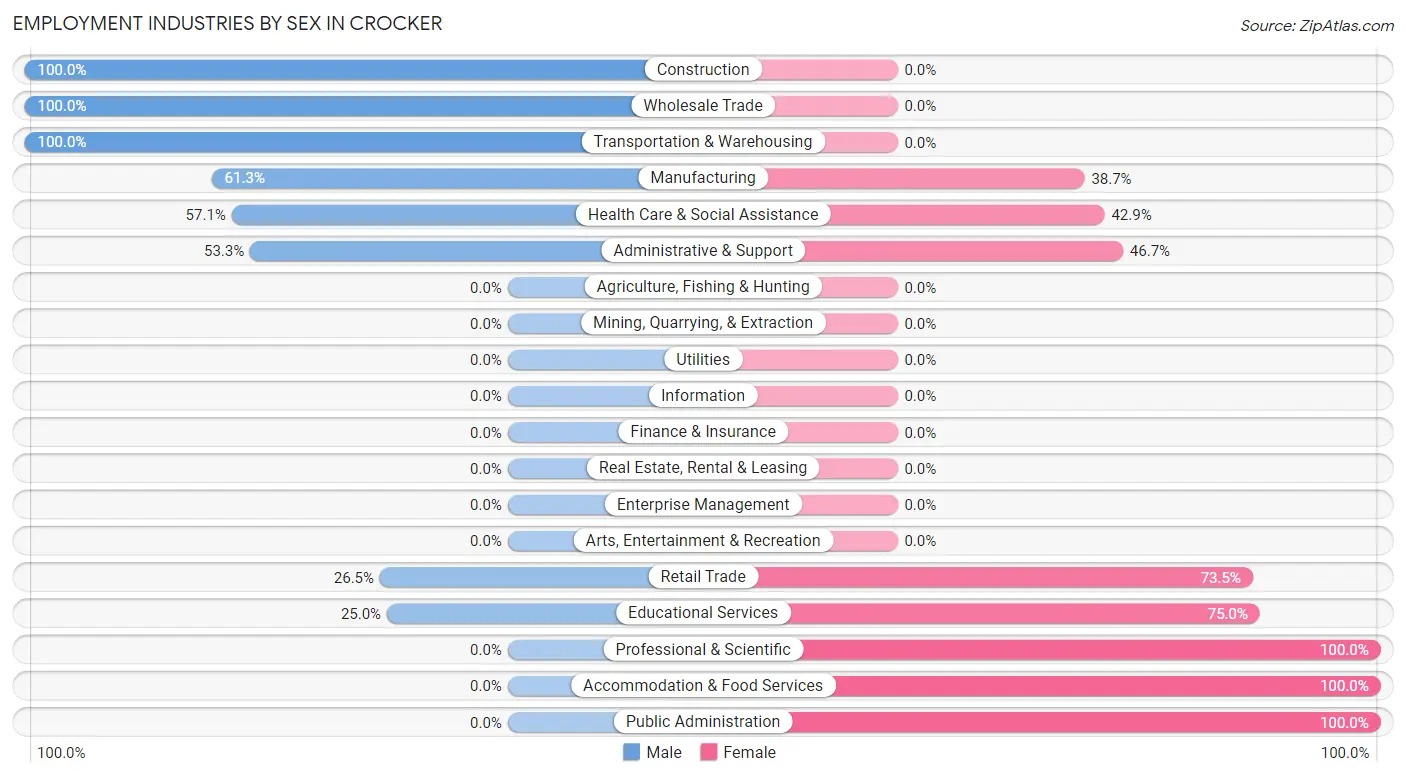
Employment Industries by Sex in Crocker
The Crocker industries that see more men than women are Construction (100.0%), Wholesale Trade (100.0%), and Transportation & Warehousing (100.0%), whereas the industries that tend to have a higher number of women are Professional & Scientific (100.0%), Accommodation & Food Services (100.0%), and Public Administration (100.0%).
| Industry | Male | Female |
| Agriculture, Fishing & Hunting | 0 (0.0%) | 0 (0.0%) |
| Mining, Quarrying, & Extraction | 0 (0.0%) | 0 (0.0%) |
| Construction | 57 (100.0%) | 0 (0.0%) |
| Manufacturing | 38 (61.3%) | 24 (38.7%) |
| Wholesale Trade | 16 (100.0%) | 0 (0.0%) |
| Retail Trade | 9 (26.5%) | 25 (73.5%) |
| Transportation & Warehousing | 59 (100.0%) | 0 (0.0%) |
| Utilities | 0 (0.0%) | 0 (0.0%) |
| Information | 0 (0.0%) | 0 (0.0%) |
| Finance & Insurance | 0 (0.0%) | 0 (0.0%) |
| Real Estate, Rental & Leasing | 0 (0.0%) | 0 (0.0%) |
| Professional & Scientific | 0 (0.0%) | 31 (100.0%) |
| Enterprise Management | 0 (0.0%) | 0 (0.0%) |
| Administrative & Support | 8 (53.3%) | 7 (46.7%) |
| Educational Services | 13 (25.0%) | 39 (75.0%) |
| Health Care & Social Assistance | 64 (57.1%) | 48 (42.9%) |
| Arts, Entertainment & Recreation | 0 (0.0%) | 0 (0.0%) |
| Accommodation & Food Services | 0 (0.0%) | 9 (100.0%) |
| Public Administration | 0 (0.0%) | 22 (100.0%) |
| Total | 264 (53.7%) | 228 (46.3%) |
Education in Crocker
School Enrollment in Crocker
The most common levels of schooling among the 288 students in Crocker are middle school (110 | 38.2%), high school (85 | 29.5%), and elementary school (33 | 11.5%).
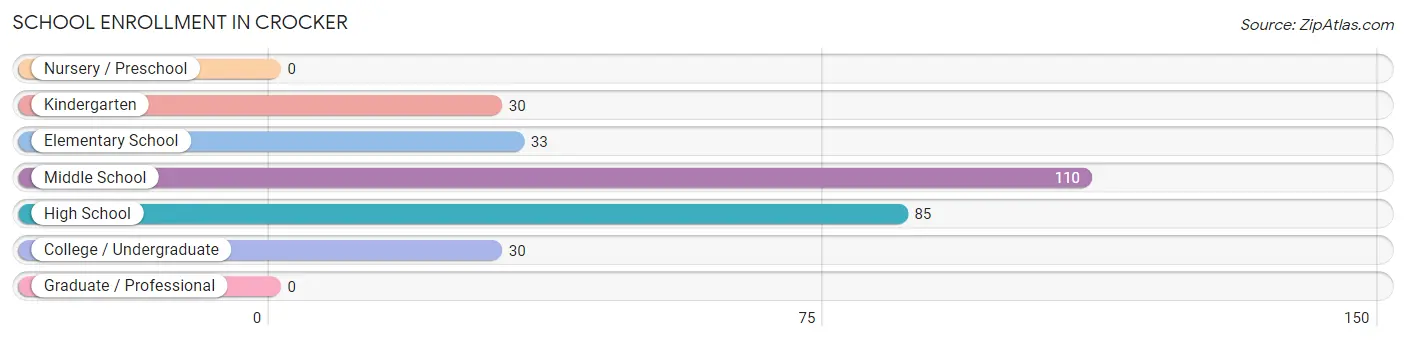
| School Level | # Students | % Students |
| Nursery / Preschool | 0 | 0.0% |
| Kindergarten | 30 | 10.4% |
| Elementary School | 33 | 11.5% |
| Middle School | 110 | 38.2% |
| High School | 85 | 29.5% |
| College / Undergraduate | 30 | 10.4% |
| Graduate / Professional | 0 | 0.0% |
| Total | 288 | 100.0% |
School Enrollment by Age by Funding Source in Crocker
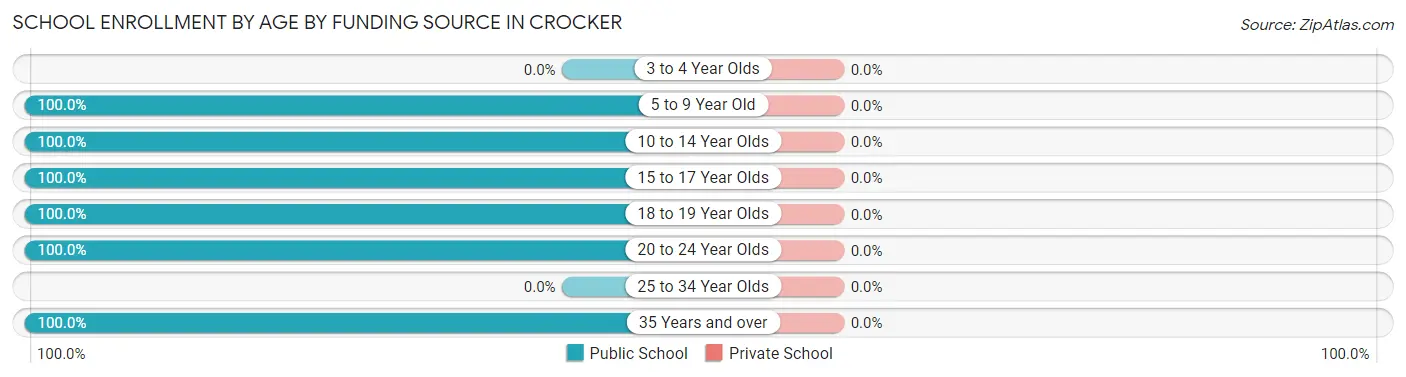
| Age Bracket | Public School | Private School |
| 3 to 4 Year Olds | 0 (0.0%) | 0 (0.0%) |
| 5 to 9 Year Old | 63 (100.0%) | 0 (0.0%) |
| 10 to 14 Year Olds | 123 (100.0%) | 0 (0.0%) |
| 15 to 17 Year Olds | 54 (100.0%) | 0 (0.0%) |
| 18 to 19 Year Olds | 18 (100.0%) | 0 (0.0%) |
| 20 to 24 Year Olds | 2 (100.0%) | 0 (0.0%) |
| 25 to 34 Year Olds | 0 (0.0%) | 0 (0.0%) |
| 35 Years and over | 28 (100.0%) | 0 (0.0%) |
| Total | 288 (100.0%) | 0 (0.0%) |
Educational Attainment by Field of Study in Crocker
Arts & humanities (49 | 24.0%), bio, nature & agricultural (46 | 22.6%), science & technology (37 | 18.1%), education (37 | 18.1%), and psychology (17 | 8.3%) are the most common fields of study among 204 individuals in Crocker who have obtained a bachelor's degree or higher.
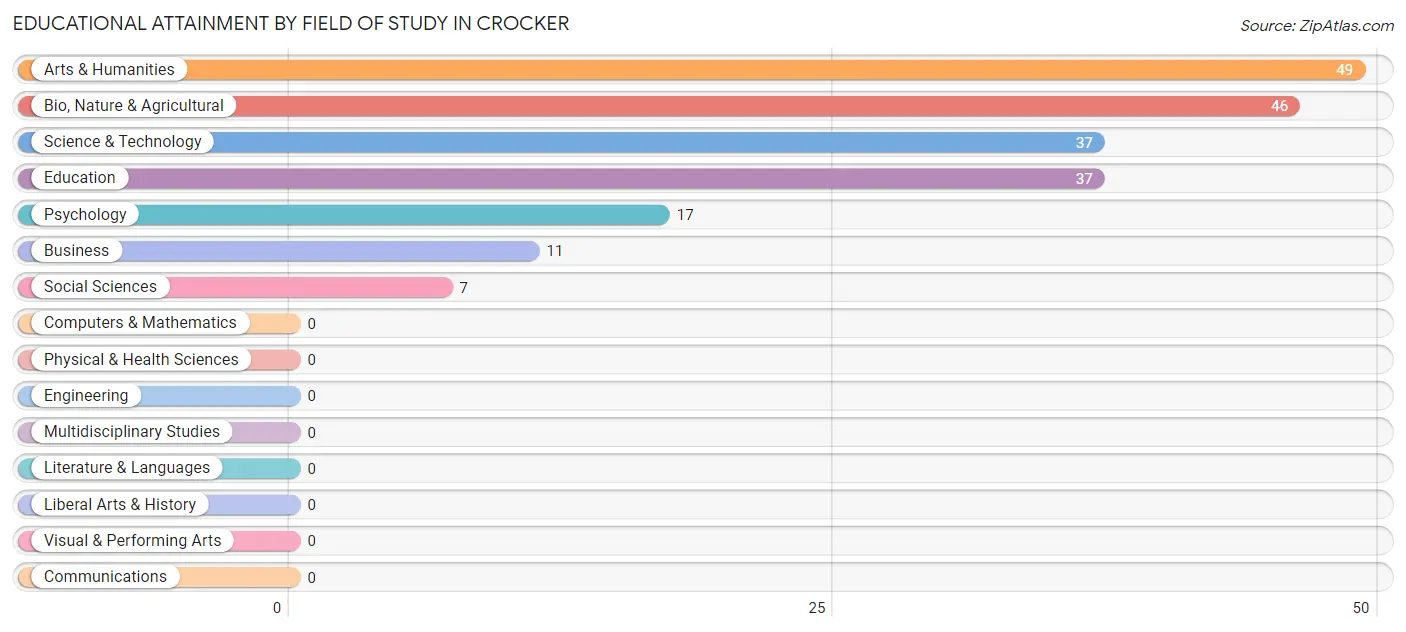
| Field of Study | # Graduates | % Graduates |
| Computers & Mathematics | 0 | 0.0% |
| Bio, Nature & Agricultural | 46 | 22.6% |
| Physical & Health Sciences | 0 | 0.0% |
| Psychology | 17 | 8.3% |
| Social Sciences | 7 | 3.4% |
| Engineering | 0 | 0.0% |
| Multidisciplinary Studies | 0 | 0.0% |
| Science & Technology | 37 | 18.1% |
| Business | 11 | 5.4% |
| Education | 37 | 18.1% |
| Literature & Languages | 0 | 0.0% |
| Liberal Arts & History | 0 | 0.0% |
| Visual & Performing Arts | 0 | 0.0% |
| Communications | 0 | 0.0% |
| Arts & Humanities | 49 | 24.0% |
| Total | 204 | 100.0% |
Transportation & Commute in Crocker
Vehicle Availability by Sex in Crocker
The most prevalent vehicle ownership categories in Crocker are males with 2 vehicles (120, accounting for 45.5%) and females with 2 vehicles (82, making up 62.8%).
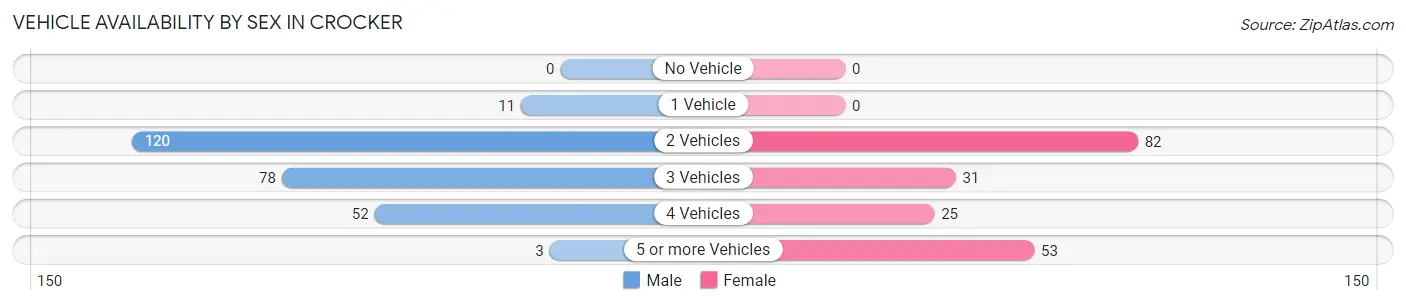
| Vehicles Available | Male | Female |
| No Vehicle | 0 (0.0%) | 0 (0.0%) |
| 1 Vehicle | 11 (4.2%) | 0 (0.0%) |
| 2 Vehicles | 120 (45.5%) | 82 (42.9%) |
| 3 Vehicles | 78 (29.5%) | 31 (16.2%) |
| 4 Vehicles | 52 (19.7%) | 25 (13.1%) |
| 5 or more Vehicles | 3 (1.1%) | 53 (27.8%) |
| Total | 264 (100.0%) | 191 (100.0%) |
Commute Time in Crocker
The most frequently occuring commute durations in Crocker are 45 to 59 minutes (139 commuters, 30.7%), 40 to 44 minutes (110 commuters, 24.3%), and 60 to 89 minutes (87 commuters, 19.3%).
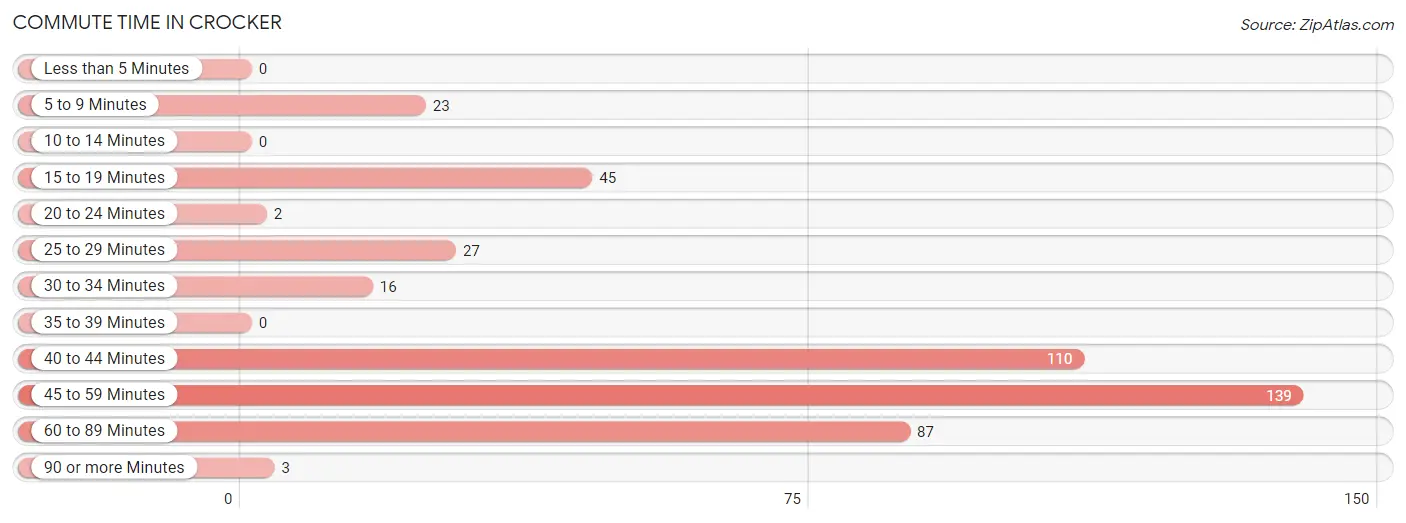
| Commute Time | # Commuters | % Commuters |
| Less than 5 Minutes | 0 | 0.0% |
| 5 to 9 Minutes | 23 | 5.1% |
| 10 to 14 Minutes | 0 | 0.0% |
| 15 to 19 Minutes | 45 | 10.0% |
| 20 to 24 Minutes | 2 | 0.4% |
| 25 to 29 Minutes | 27 | 6.0% |
| 30 to 34 Minutes | 16 | 3.5% |
| 35 to 39 Minutes | 0 | 0.0% |
| 40 to 44 Minutes | 110 | 24.3% |
| 45 to 59 Minutes | 139 | 30.7% |
| 60 to 89 Minutes | 87 | 19.3% |
| 90 or more Minutes | 3 | 0.7% |
Commute Time by Sex in Crocker
The most common commute times in Crocker are 60 to 89 minutes (66 commuters, 25.0%) for males and 45 to 59 minutes (89 commuters, 47.3%) for females.
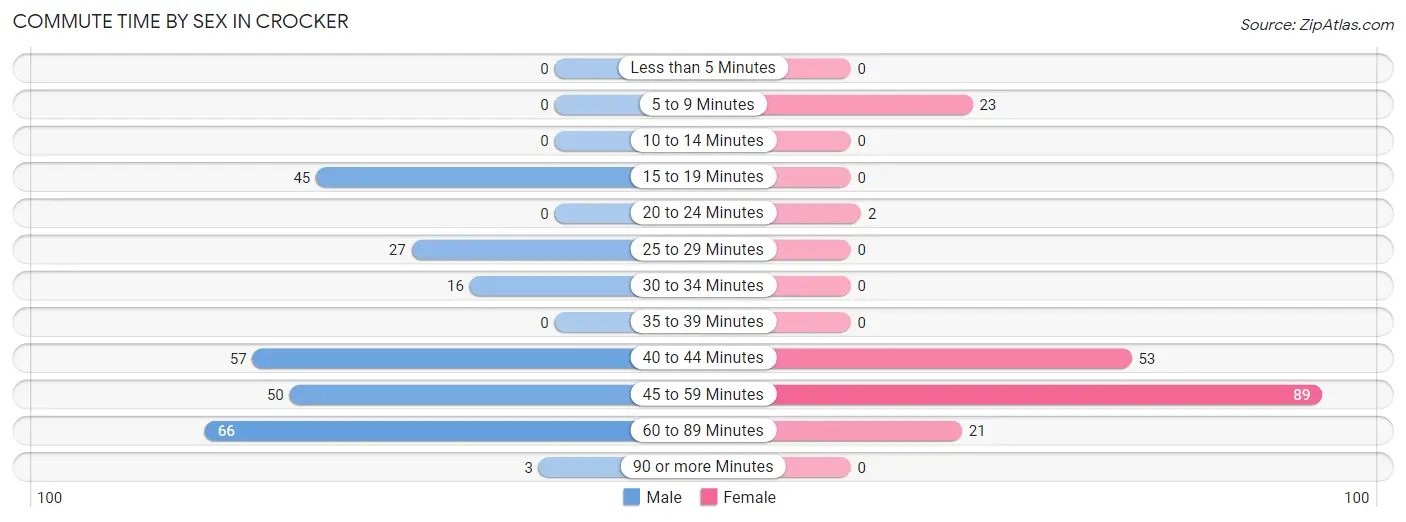
| Commute Time | Male | Female |
| Less than 5 Minutes | 0 (0.0%) | 0 (0.0%) |
| 5 to 9 Minutes | 0 (0.0%) | 23 (12.2%) |
| 10 to 14 Minutes | 0 (0.0%) | 0 (0.0%) |
| 15 to 19 Minutes | 45 (17.1%) | 0 (0.0%) |
| 20 to 24 Minutes | 0 (0.0%) | 2 (1.1%) |
| 25 to 29 Minutes | 27 (10.2%) | 0 (0.0%) |
| 30 to 34 Minutes | 16 (6.1%) | 0 (0.0%) |
| 35 to 39 Minutes | 0 (0.0%) | 0 (0.0%) |
| 40 to 44 Minutes | 57 (21.6%) | 53 (28.2%) |
| 45 to 59 Minutes | 50 (18.9%) | 89 (47.3%) |
| 60 to 89 Minutes | 66 (25.0%) | 21 (11.2%) |
| 90 or more Minutes | 3 (1.1%) | 0 (0.0%) |
Time of Departure to Work by Sex in Crocker
The most frequent times of departure to work in Crocker are 6:30 AM to 6:59 AM (101, 38.3%) for males and 5:00 AM to 5:29 AM (70, 37.2%) for females.
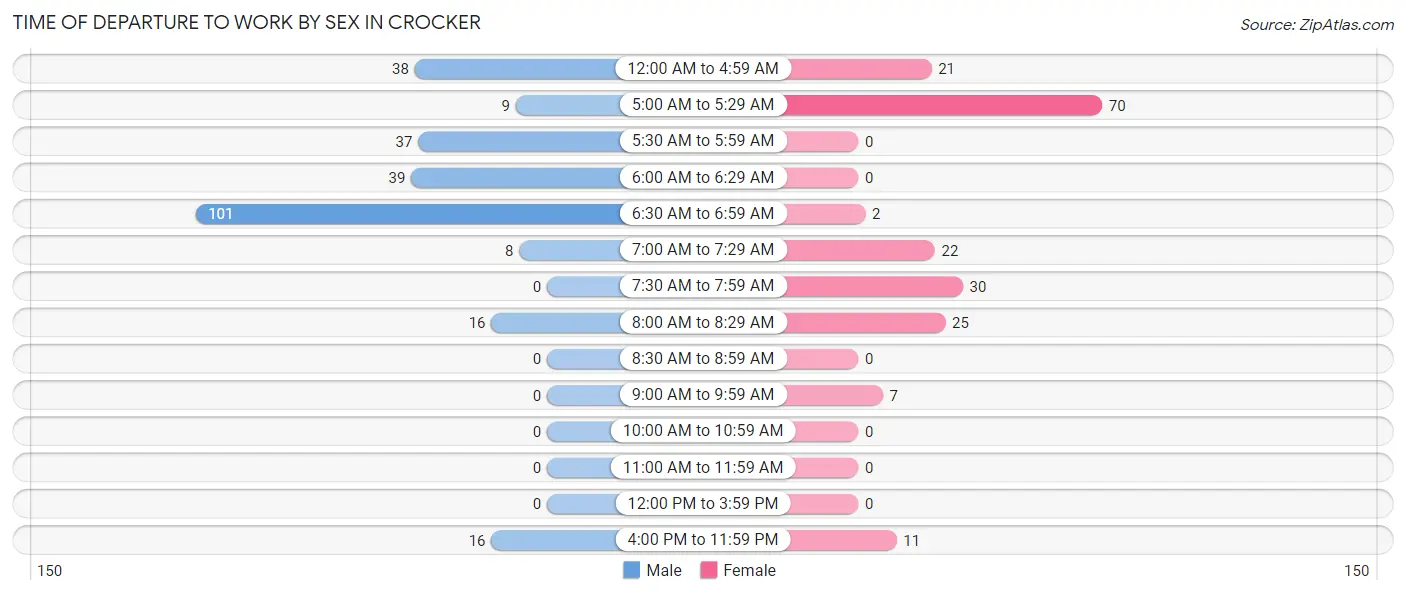
| Time of Departure | Male | Female |
| 12:00 AM to 4:59 AM | 38 (14.4%) | 21 (11.2%) |
| 5:00 AM to 5:29 AM | 9 (3.4%) | 70 (37.2%) |
| 5:30 AM to 5:59 AM | 37 (14.0%) | 0 (0.0%) |
| 6:00 AM to 6:29 AM | 39 (14.8%) | 0 (0.0%) |
| 6:30 AM to 6:59 AM | 101 (38.3%) | 2 (1.1%) |
| 7:00 AM to 7:29 AM | 8 (3.0%) | 22 (11.7%) |
| 7:30 AM to 7:59 AM | 0 (0.0%) | 30 (16.0%) |
| 8:00 AM to 8:29 AM | 16 (6.1%) | 25 (13.3%) |
| 8:30 AM to 8:59 AM | 0 (0.0%) | 0 (0.0%) |
| 9:00 AM to 9:59 AM | 0 (0.0%) | 7 (3.7%) |
| 10:00 AM to 10:59 AM | 0 (0.0%) | 0 (0.0%) |
| 11:00 AM to 11:59 AM | 0 (0.0%) | 0 (0.0%) |
| 12:00 PM to 3:59 PM | 0 (0.0%) | 0 (0.0%) |
| 4:00 PM to 11:59 PM | 16 (6.1%) | 11 (5.9%) |
| Total | 264 (100.0%) | 188 (100.0%) |
Housing Occupancy in Crocker
Occupancy by Ownership in Crocker
Of the total 456 dwellings in Crocker, owner-occupied units account for 427 (93.6%), while renter-occupied units make up 29 (6.4%).
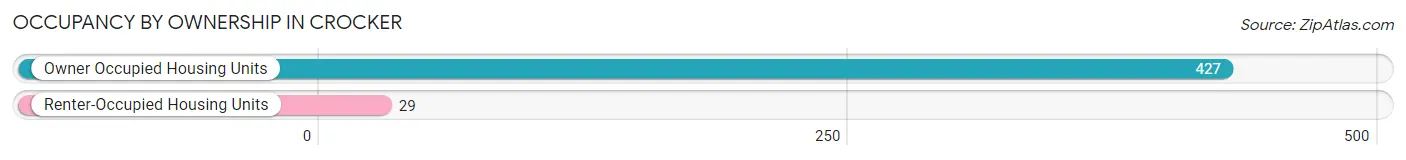
| Occupancy | # Housing Units | % Housing Units |
| Owner Occupied Housing Units | 427 | 93.6% |
| Renter-Occupied Housing Units | 29 | 6.4% |
| Total Occupied Housing Units | 456 | 100.0% |
Occupancy by Household Size in Crocker
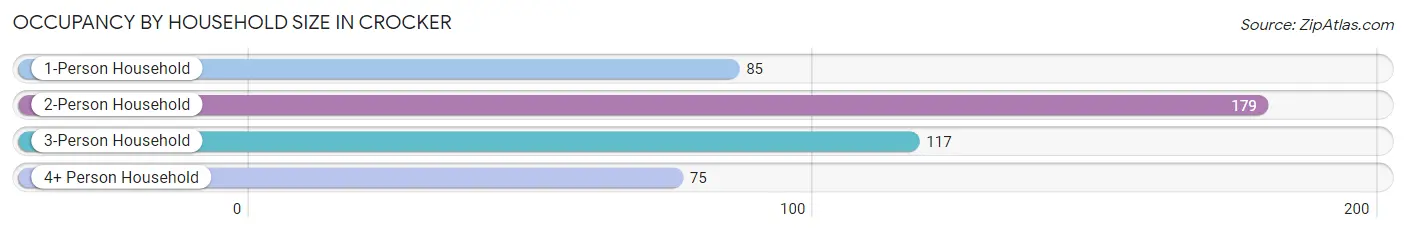
| Household Size | # Housing Units | % Housing Units |
| 1-Person Household | 85 | 18.6% |
| 2-Person Household | 179 | 39.3% |
| 3-Person Household | 117 | 25.7% |
| 4+ Person Household | 75 | 16.5% |
| Total Housing Units | 456 | 100.0% |
Occupancy by Ownership by Household Size in Crocker
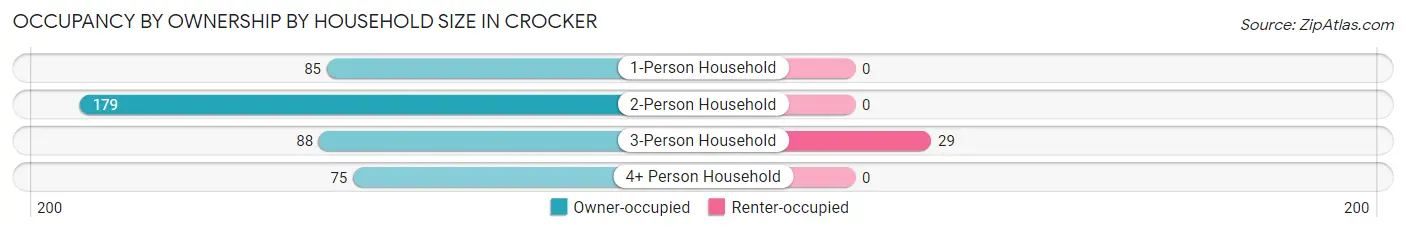
| Household Size | Owner-occupied | Renter-occupied |
| 1-Person Household | 85 (100.0%) | 0 (0.0%) |
| 2-Person Household | 179 (100.0%) | 0 (0.0%) |
| 3-Person Household | 88 (75.2%) | 29 (24.8%) |
| 4+ Person Household | 75 (100.0%) | 0 (0.0%) |
| Total Housing Units | 427 (93.6%) | 29 (6.4%) |
Occupancy by Educational Attainment in Crocker
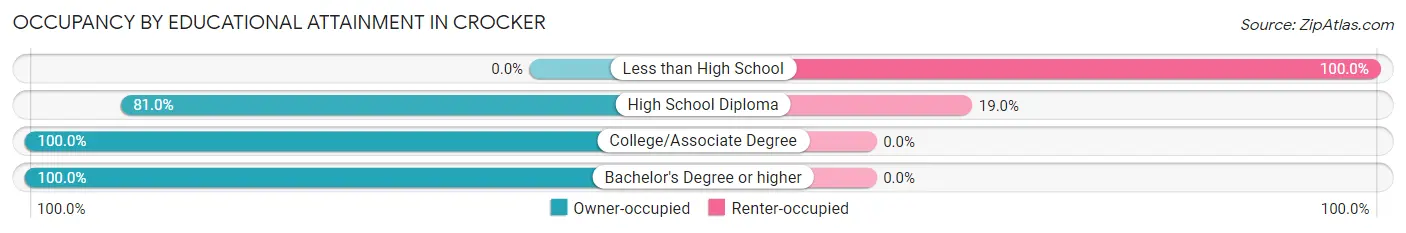
| Household Size | Owner-occupied | Renter-occupied |
| Less than High School | 0 (0.0%) | 7 (100.0%) |
| High School Diploma | 94 (81.0%) | 22 (19.0%) |
| College/Associate Degree | 213 (100.0%) | 0 (0.0%) |
| Bachelor's Degree or higher | 120 (100.0%) | 0 (0.0%) |
Occupancy by Age of Householder in Crocker
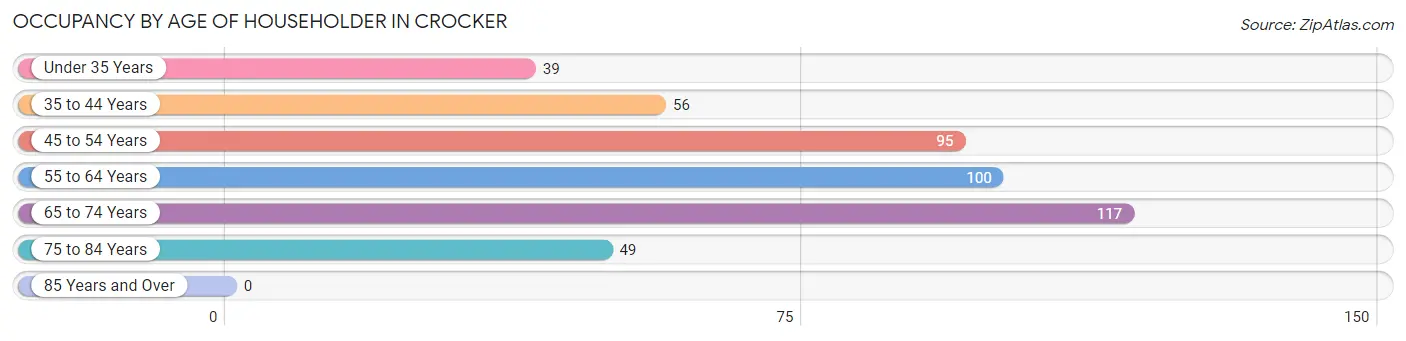
| Age Bracket | # Households | % Households |
| Under 35 Years | 39 | 8.6% |
| 35 to 44 Years | 56 | 12.3% |
| 45 to 54 Years | 95 | 20.8% |
| 55 to 64 Years | 100 | 21.9% |
| 65 to 74 Years | 117 | 25.7% |
| 75 to 84 Years | 49 | 10.7% |
| 85 Years and Over | 0 | 0.0% |
| Total | 456 | 100.0% |
Housing Finances in Crocker
Median Income by Occupancy in Crocker
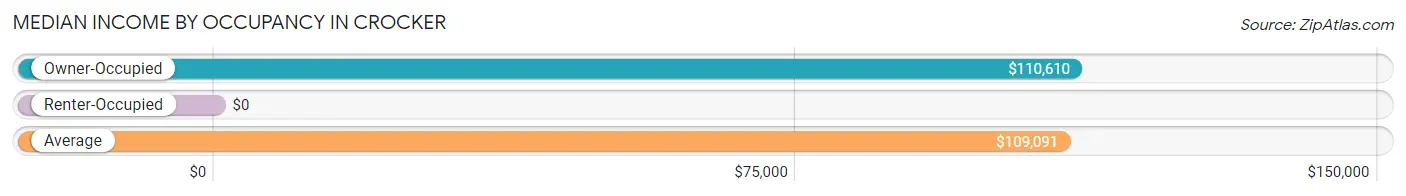
| Occupancy Type | # Households | Median Income |
| Owner-Occupied | 427 (93.6%) | $110,610 |
| Renter-Occupied | 29 (6.4%) | $0 |
| Average | 456 (100.0%) | $109,091 |
Occupancy by Householder Income Bracket in Crocker
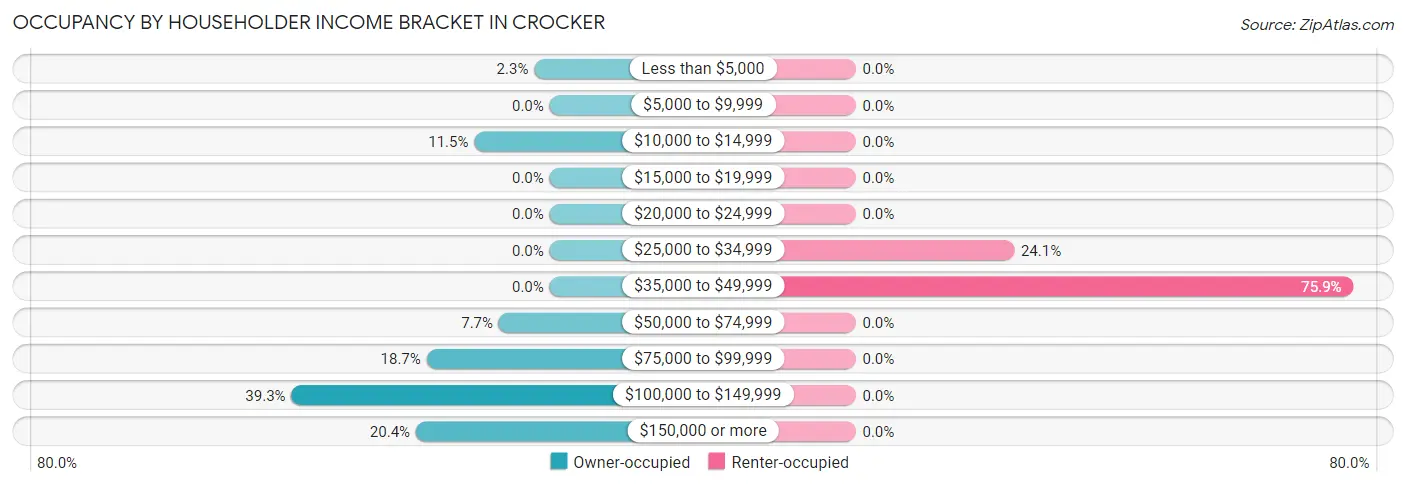
| Income Bracket | Owner-occupied | Renter-occupied |
| Less than $5,000 | 10 (2.3%) | 0 (0.0%) |
| $5,000 to $9,999 | 0 (0.0%) | 0 (0.0%) |
| $10,000 to $14,999 | 49 (11.5%) | 0 (0.0%) |
| $15,000 to $19,999 | 0 (0.0%) | 0 (0.0%) |
| $20,000 to $24,999 | 0 (0.0%) | 0 (0.0%) |
| $25,000 to $34,999 | 0 (0.0%) | 7 (24.1%) |
| $35,000 to $49,999 | 0 (0.0%) | 22 (75.9%) |
| $50,000 to $74,999 | 33 (7.7%) | 0 (0.0%) |
| $75,000 to $99,999 | 80 (18.7%) | 0 (0.0%) |
| $100,000 to $149,999 | 168 (39.3%) | 0 (0.0%) |
| $150,000 or more | 87 (20.4%) | 0 (0.0%) |
| Total | 427 (100.0%) | 29 (100.0%) |
Monthly Housing Cost Tiers in Crocker
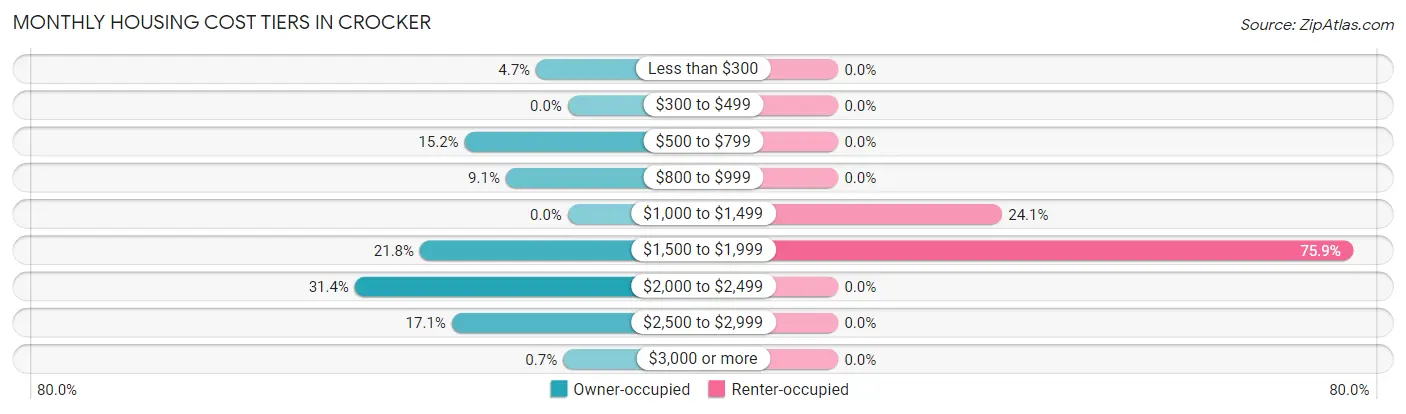
| Monthly Cost | Owner-occupied | Renter-occupied |
| Less than $300 | 20 (4.7%) | 0 (0.0%) |
| $300 to $499 | 0 (0.0%) | 0 (0.0%) |
| $500 to $799 | 65 (15.2%) | 0 (0.0%) |
| $800 to $999 | 39 (9.1%) | 0 (0.0%) |
| $1,000 to $1,499 | 0 (0.0%) | 7 (24.1%) |
| $1,500 to $1,999 | 93 (21.8%) | 22 (75.9%) |
| $2,000 to $2,499 | 134 (31.4%) | 0 (0.0%) |
| $2,500 to $2,999 | 73 (17.1%) | 0 (0.0%) |
| $3,000 or more | 3 (0.7%) | 0 (0.0%) |
| Total | 427 (100.0%) | 29 (100.0%) |
Physical Housing Characteristics in Crocker
Housing Structures in Crocker
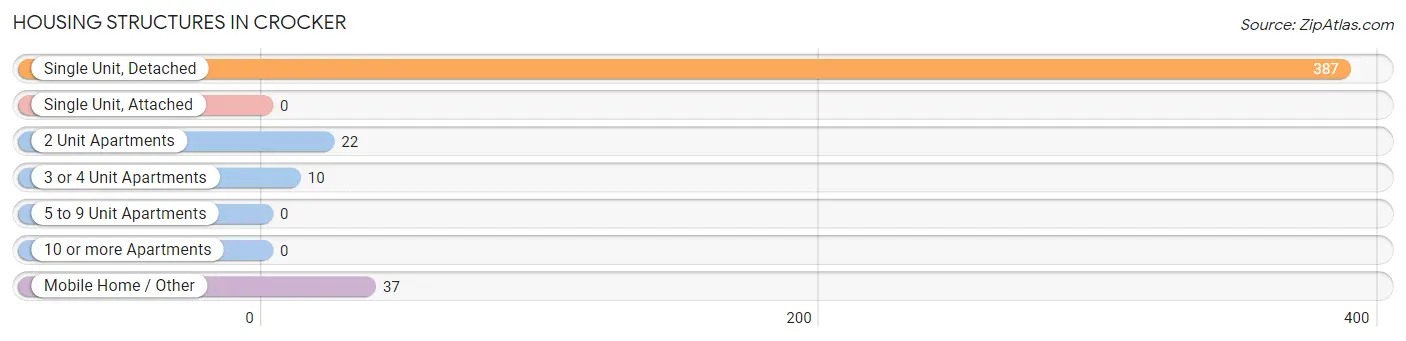
| Structure Type | # Housing Units | % Housing Units |
| Single Unit, Detached | 387 | 84.9% |
| Single Unit, Attached | 0 | 0.0% |
| 2 Unit Apartments | 22 | 4.8% |
| 3 or 4 Unit Apartments | 10 | 2.2% |
| 5 to 9 Unit Apartments | 0 | 0.0% |
| 10 or more Apartments | 0 | 0.0% |
| Mobile Home / Other | 37 | 8.1% |
| Total | 456 | 100.0% |
Housing Structures by Occupancy in Crocker
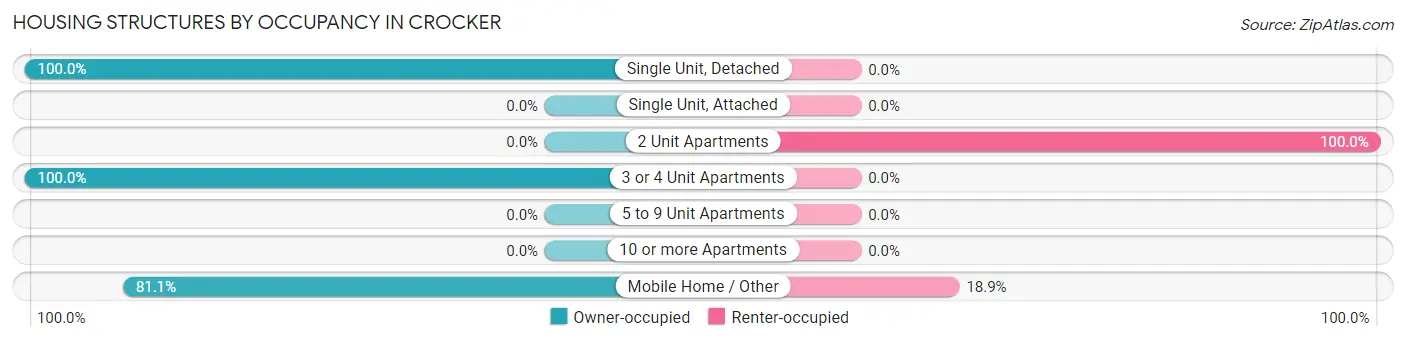
| Structure Type | Owner-occupied | Renter-occupied |
| Single Unit, Detached | 387 (100.0%) | 0 (0.0%) |
| Single Unit, Attached | 0 (0.0%) | 0 (0.0%) |
| 2 Unit Apartments | 0 (0.0%) | 22 (100.0%) |
| 3 or 4 Unit Apartments | 10 (100.0%) | 0 (0.0%) |
| 5 to 9 Unit Apartments | 0 (0.0%) | 0 (0.0%) |
| 10 or more Apartments | 0 (0.0%) | 0 (0.0%) |
| Mobile Home / Other | 30 (81.1%) | 7 (18.9%) |
| Total | 427 (93.6%) | 29 (6.4%) |
Housing Structures by Number of Rooms in Crocker
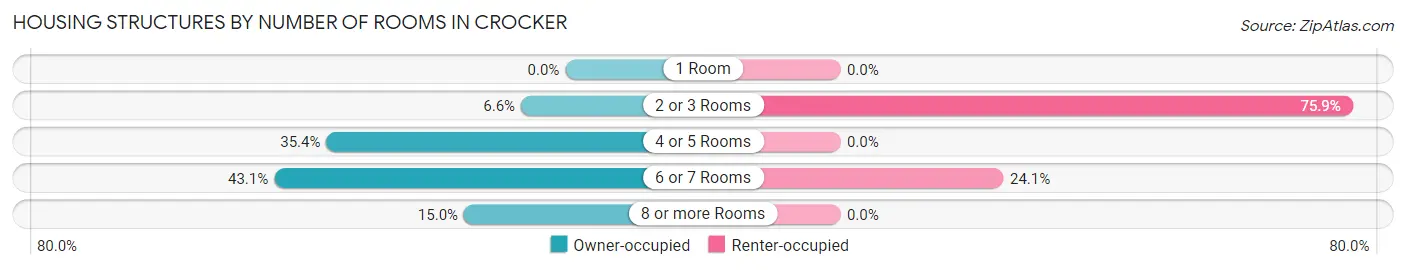
| Number of Rooms | Owner-occupied | Renter-occupied |
| 1 Room | 0 (0.0%) | 0 (0.0%) |
| 2 or 3 Rooms | 28 (6.6%) | 22 (75.9%) |
| 4 or 5 Rooms | 151 (35.4%) | 0 (0.0%) |
| 6 or 7 Rooms | 184 (43.1%) | 7 (24.1%) |
| 8 or more Rooms | 64 (15.0%) | 0 (0.0%) |
| Total | 427 (100.0%) | 29 (100.0%) |
Housing Structure by Heating Type in Crocker
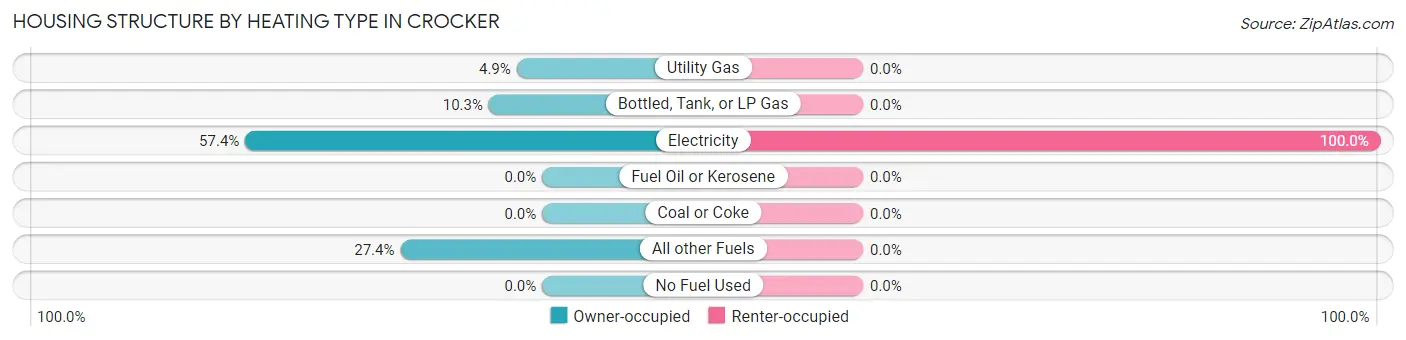
| Heating Type | Owner-occupied | Renter-occupied |
| Utility Gas | 21 (4.9%) | 0 (0.0%) |
| Bottled, Tank, or LP Gas | 44 (10.3%) | 0 (0.0%) |
| Electricity | 245 (57.4%) | 29 (100.0%) |
| Fuel Oil or Kerosene | 0 (0.0%) | 0 (0.0%) |
| Coal or Coke | 0 (0.0%) | 0 (0.0%) |
| All other Fuels | 117 (27.4%) | 0 (0.0%) |
| No Fuel Used | 0 (0.0%) | 0 (0.0%) |
| Total | 427 (100.0%) | 29 (100.0%) |
Household Vehicle Usage in Crocker
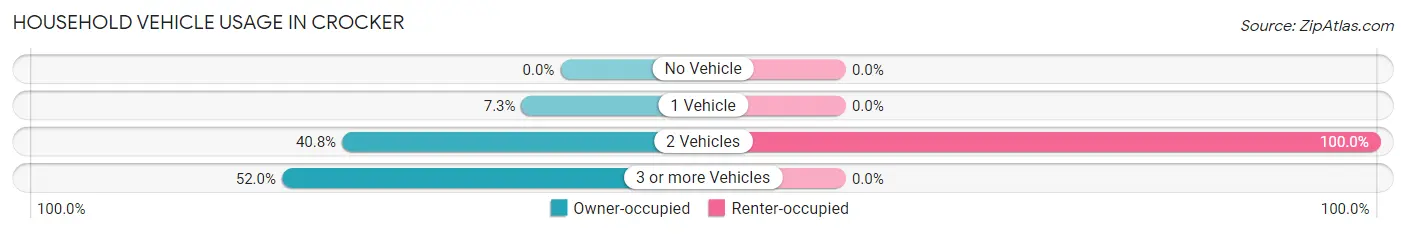
| Vehicles per Household | Owner-occupied | Renter-occupied |
| No Vehicle | 0 (0.0%) | 0 (0.0%) |
| 1 Vehicle | 31 (7.3%) | 0 (0.0%) |
| 2 Vehicles | 174 (40.7%) | 29 (100.0%) |
| 3 or more Vehicles | 222 (52.0%) | 0 (0.0%) |
| Total | 427 (100.0%) | 29 (100.0%) |
Real Estate & Mortgages in Crocker
Real Estate and Mortgage Overview in Crocker
| Characteristic | Without Mortgage | With Mortgage |
| Housing Units | 114 | 313 |
| Median Property Value | $237,800 | $430,000 |
| Median Household Income | - | - |
| Monthly Housing Costs | $676 | $3 |
| Real Estate Taxes | - | - |
Property Value by Mortgage Status in Crocker
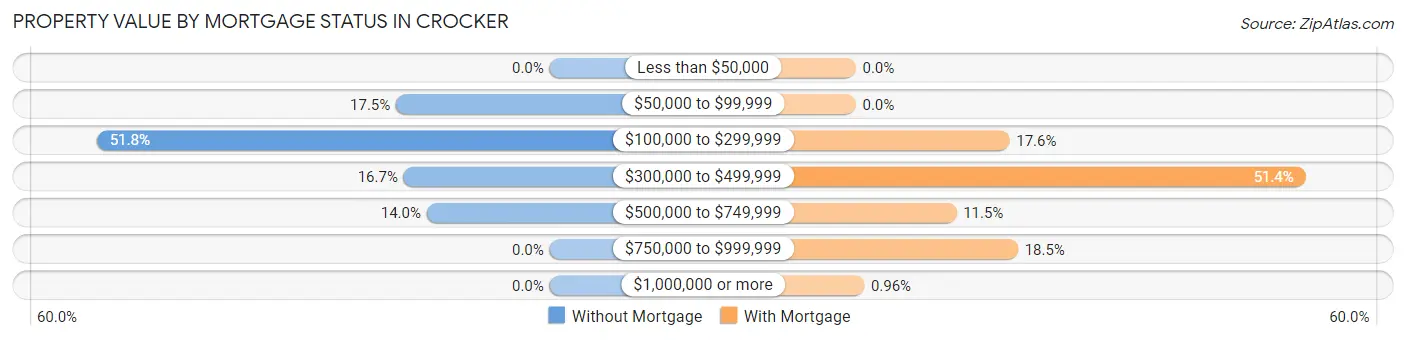
| Property Value | Without Mortgage | With Mortgage |
| Less than $50,000 | 0 (0.0%) | 0 (0.0%) |
| $50,000 to $99,999 | 20 (17.5%) | 0 (0.0%) |
| $100,000 to $299,999 | 59 (51.7%) | 55 (17.6%) |
| $300,000 to $499,999 | 19 (16.7%) | 161 (51.4%) |
| $500,000 to $749,999 | 16 (14.0%) | 36 (11.5%) |
| $750,000 to $999,999 | 0 (0.0%) | 58 (18.5%) |
| $1,000,000 or more | 0 (0.0%) | 3 (1.0%) |
| Total | 114 (100.0%) | 313 (100.0%) |
Household Income by Mortgage Status in Crocker
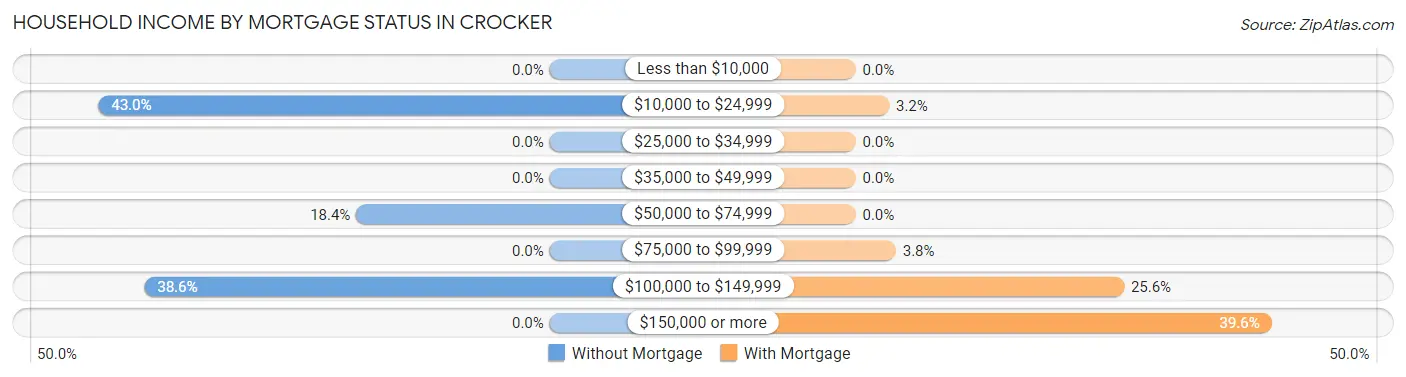
| Household Income | Without Mortgage | With Mortgage |
| Less than $10,000 | 0 (0.0%) | 0 (0.0%) |
| $10,000 to $24,999 | 49 (43.0%) | 10 (3.2%) |
| $25,000 to $34,999 | 0 (0.0%) | 0 (0.0%) |
| $35,000 to $49,999 | 0 (0.0%) | 0 (0.0%) |
| $50,000 to $74,999 | 21 (18.4%) | 0 (0.0%) |
| $75,000 to $99,999 | 0 (0.0%) | 12 (3.8%) |
| $100,000 to $149,999 | 44 (38.6%) | 80 (25.6%) |
| $150,000 or more | 0 (0.0%) | 124 (39.6%) |
| Total | 114 (100.0%) | 313 (100.0%) |
Property Value to Household Income Ratio in Crocker
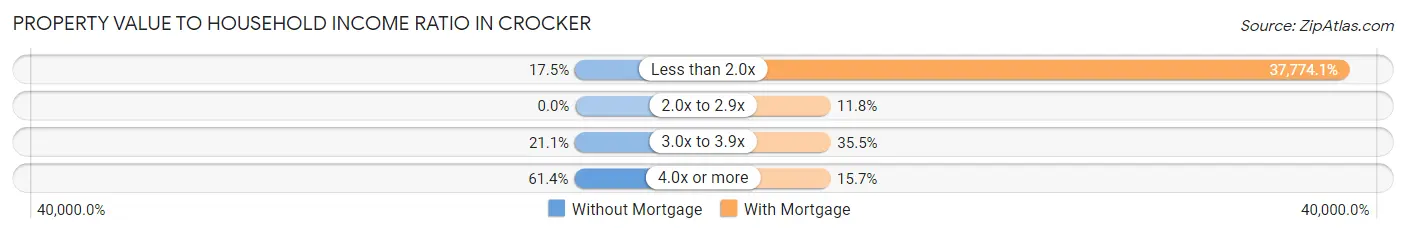
| Value-to-Income Ratio | Without Mortgage | With Mortgage |
| Less than 2.0x | 20 (17.5%) | 118,233 (37,774.1%) |
| 2.0x to 2.9x | 0 (0.0%) | 37 (11.8%) |
| 3.0x to 3.9x | 24 (21.0%) | 111 (35.5%) |
| 4.0x or more | 70 (61.4%) | 49 (15.7%) |
| Total | 114 (100.0%) | 313 (100.0%) |
Real Estate Taxes by Mortgage Status in Crocker
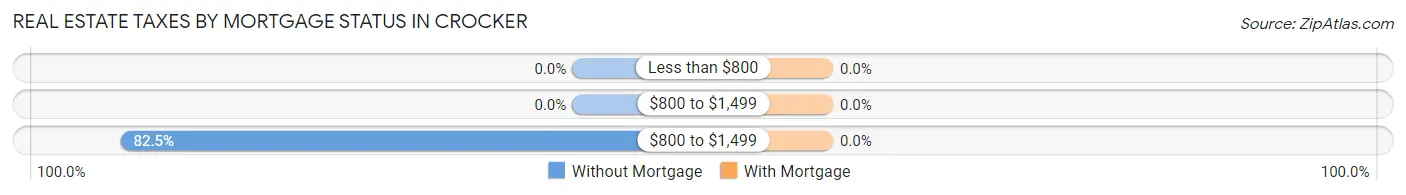
| Property Taxes | Without Mortgage | With Mortgage |
| Less than $800 | 0 (0.0%) | 0 (0.0%) |
| $800 to $1,499 | 0 (0.0%) | 0 (0.0%) |
| $800 to $1,499 | 94 (82.5%) | 0 (0.0%) |
| Total | 114 (100.0%) | 313 (100.0%) |
Health & Disability in Crocker
Health Insurance Coverage by Age in Crocker
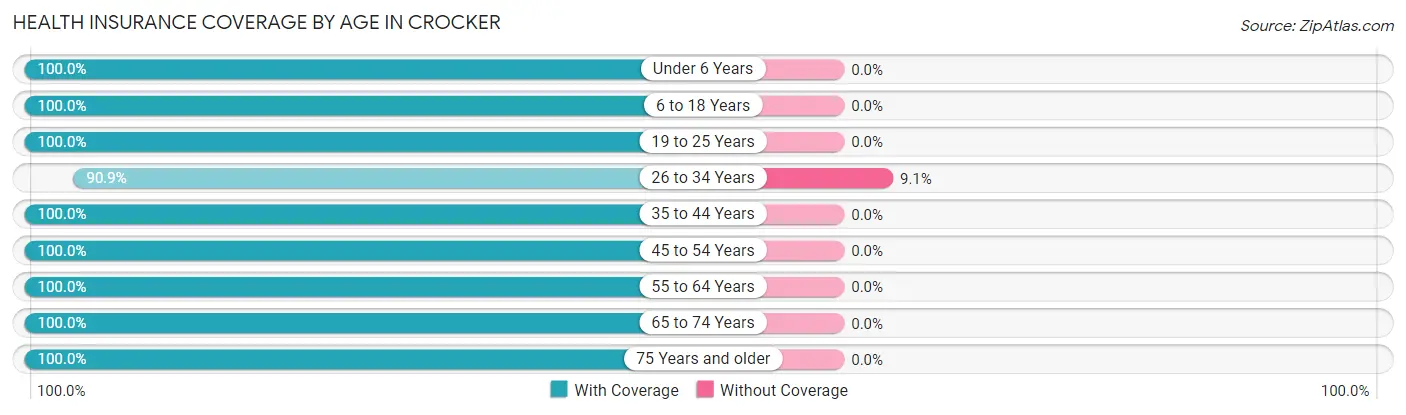
| Age Bracket | With Coverage | Without Coverage |
| Under 6 Years | 71 (100.0%) | 0 (0.0%) |
| 6 to 18 Years | 258 (100.0%) | 0 (0.0%) |
| 19 to 25 Years | 2 (100.0%) | 0 (0.0%) |
| 26 to 34 Years | 130 (90.9%) | 13 (9.1%) |
| 35 to 44 Years | 101 (100.0%) | 0 (0.0%) |
| 45 to 54 Years | 238 (100.0%) | 0 (0.0%) |
| 55 to 64 Years | 174 (100.0%) | 0 (0.0%) |
| 65 to 74 Years | 171 (100.0%) | 0 (0.0%) |
| 75 Years and older | 60 (100.0%) | 0 (0.0%) |
| Total | 1,205 (98.9%) | 13 (1.1%) |
Health Insurance Coverage by Citizenship Status in Crocker
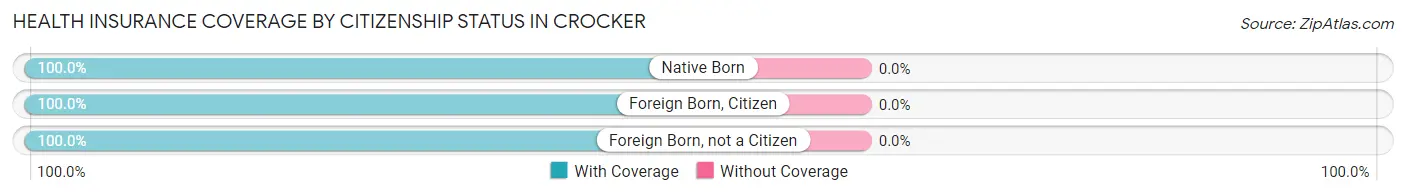
| Citizenship Status | With Coverage | Without Coverage |
| Native Born | 71 (100.0%) | 0 (0.0%) |
| Foreign Born, Citizen | 258 (100.0%) | 0 (0.0%) |
| Foreign Born, not a Citizen | 2 (100.0%) | 0 (0.0%) |
Health Insurance Coverage by Household Income in Crocker
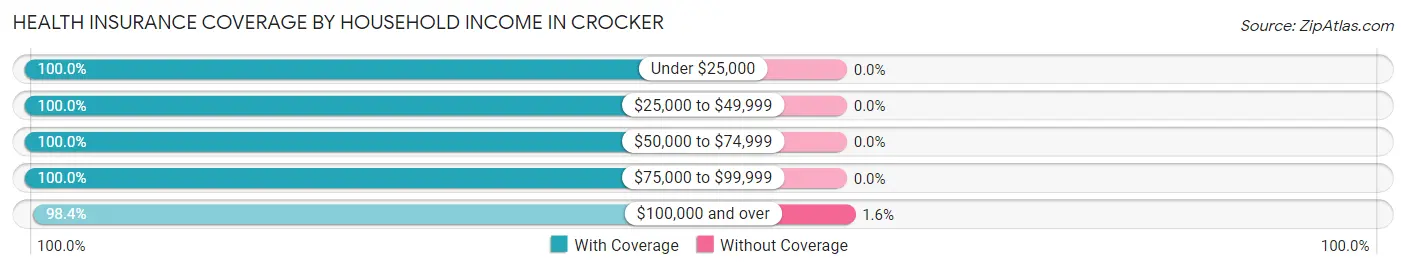
| Household Income | With Coverage | Without Coverage |
| Under $25,000 | 59 (100.0%) | 0 (0.0%) |
| $25,000 to $49,999 | 88 (100.0%) | 0 (0.0%) |
| $50,000 to $74,999 | 56 (100.0%) | 0 (0.0%) |
| $75,000 to $99,999 | 191 (100.0%) | 0 (0.0%) |
| $100,000 and over | 811 (98.4%) | 13 (1.6%) |
Public vs Private Health Insurance Coverage by Age in Crocker
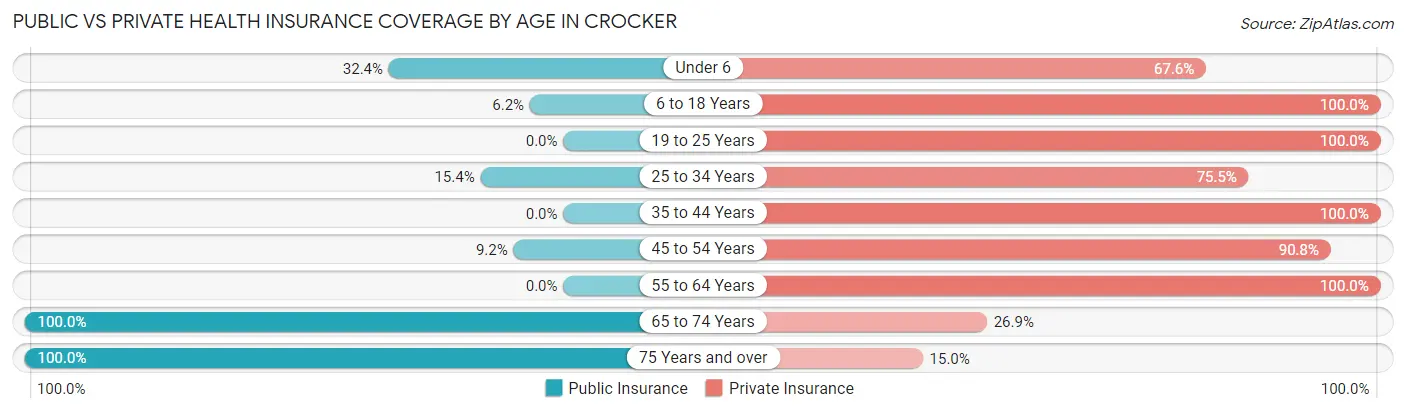
| Age Bracket | Public Insurance | Private Insurance |
| Under 6 | 23 (32.4%) | 48 (67.6%) |
| 6 to 18 Years | 16 (6.2%) | 258 (100.0%) |
| 19 to 25 Years | 0 (0.0%) | 2 (100.0%) |
| 25 to 34 Years | 22 (15.4%) | 108 (75.5%) |
| 35 to 44 Years | 0 (0.0%) | 101 (100.0%) |
| 45 to 54 Years | 22 (9.2%) | 216 (90.8%) |
| 55 to 64 Years | 0 (0.0%) | 174 (100.0%) |
| 65 to 74 Years | 171 (100.0%) | 46 (26.9%) |
| 75 Years and over | 60 (100.0%) | 9 (15.0%) |
| Total | 314 (25.8%) | 962 (79.0%) |
Disability Status by Sex by Age in Crocker
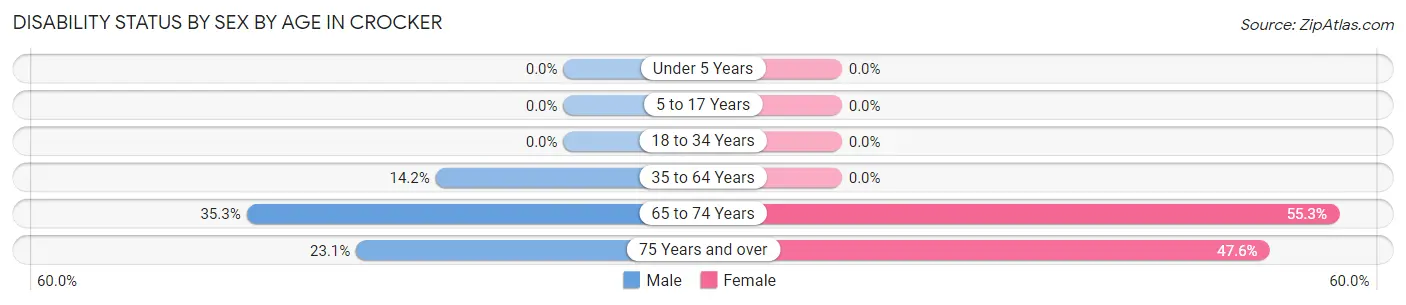
| Age Bracket | Male | Female |
| Under 5 Years | 0 (0.0%) | 0 (0.0%) |
| 5 to 17 Years | 0 (0.0%) | 0 (0.0%) |
| 18 to 34 Years | 0 (0.0%) | 0 (0.0%) |
| 35 to 64 Years | 39 (14.2%) | 0 (0.0%) |
| 65 to 74 Years | 24 (35.3%) | 57 (55.3%) |
| 75 Years and over | 9 (23.1%) | 10 (47.6%) |
Disability Class by Sex by Age in Crocker
Disability Class: Hearing Difficulty
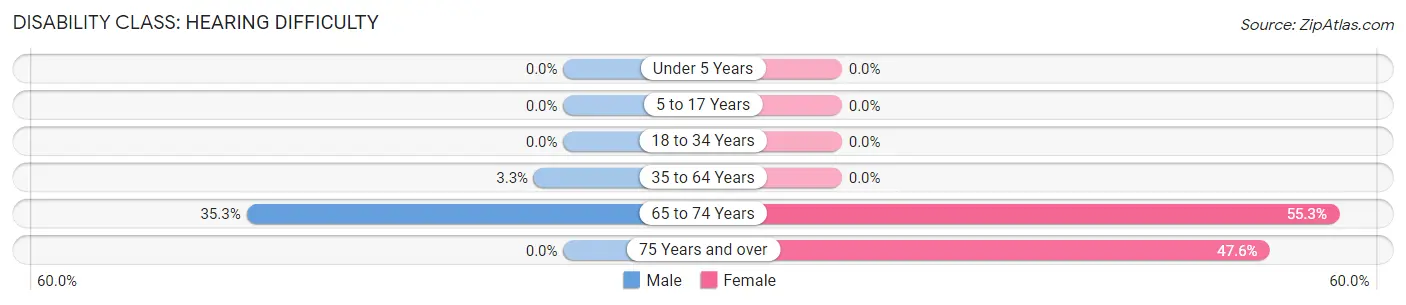
| Age Bracket | Male | Female |
| Under 5 Years | 0 (0.0%) | 0 (0.0%) |
| 5 to 17 Years | 0 (0.0%) | 0 (0.0%) |
| 18 to 34 Years | 0 (0.0%) | 0 (0.0%) |
| 35 to 64 Years | 9 (3.3%) | 0 (0.0%) |
| 65 to 74 Years | 24 (35.3%) | 57 (55.3%) |
| 75 Years and over | 0 (0.0%) | 10 (47.6%) |
Disability Class: Vision Difficulty
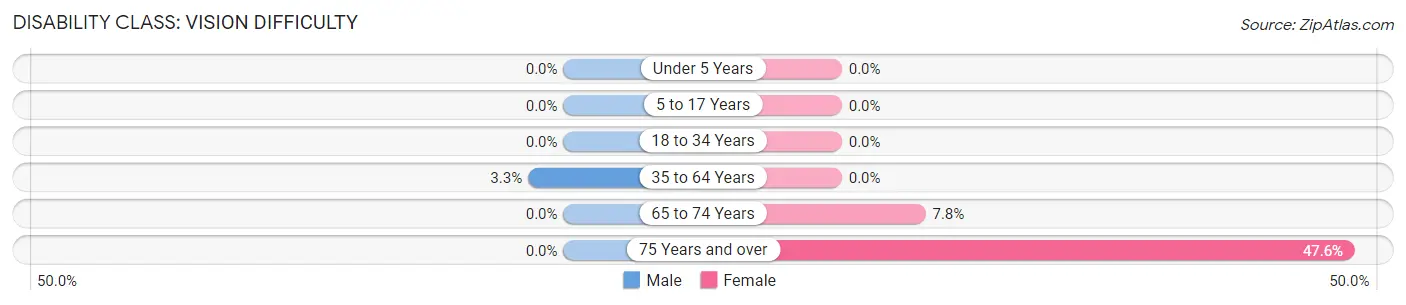
| Age Bracket | Male | Female |
| Under 5 Years | 0 (0.0%) | 0 (0.0%) |
| 5 to 17 Years | 0 (0.0%) | 0 (0.0%) |
| 18 to 34 Years | 0 (0.0%) | 0 (0.0%) |
| 35 to 64 Years | 9 (3.3%) | 0 (0.0%) |
| 65 to 74 Years | 0 (0.0%) | 8 (7.8%) |
| 75 Years and over | 0 (0.0%) | 10 (47.6%) |
Disability Class: Cognitive Difficulty
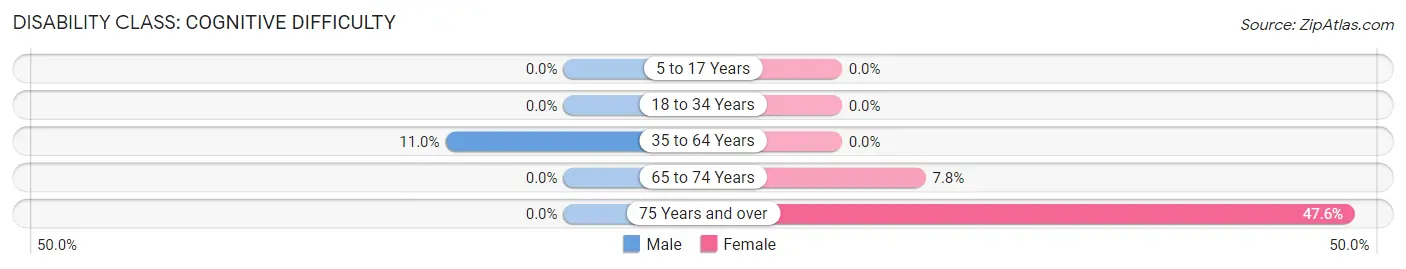
| Age Bracket | Male | Female |
| 5 to 17 Years | 0 (0.0%) | 0 (0.0%) |
| 18 to 34 Years | 0 (0.0%) | 0 (0.0%) |
| 35 to 64 Years | 30 (11.0%) | 0 (0.0%) |
| 65 to 74 Years | 0 (0.0%) | 8 (7.8%) |
| 75 Years and over | 0 (0.0%) | 10 (47.6%) |
Disability Class: Ambulatory Difficulty
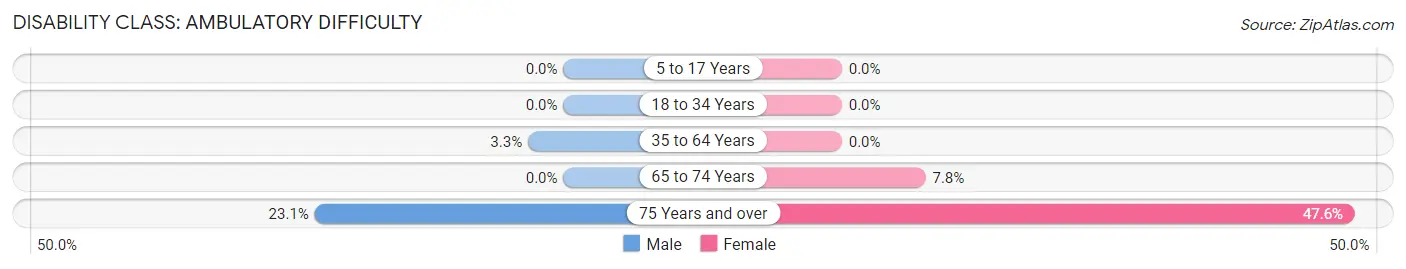
| Age Bracket | Male | Female |
| 5 to 17 Years | 0 (0.0%) | 0 (0.0%) |
| 18 to 34 Years | 0 (0.0%) | 0 (0.0%) |
| 35 to 64 Years | 9 (3.3%) | 0 (0.0%) |
| 65 to 74 Years | 0 (0.0%) | 8 (7.8%) |
| 75 Years and over | 9 (23.1%) | 10 (47.6%) |
Disability Class: Self-Care Difficulty
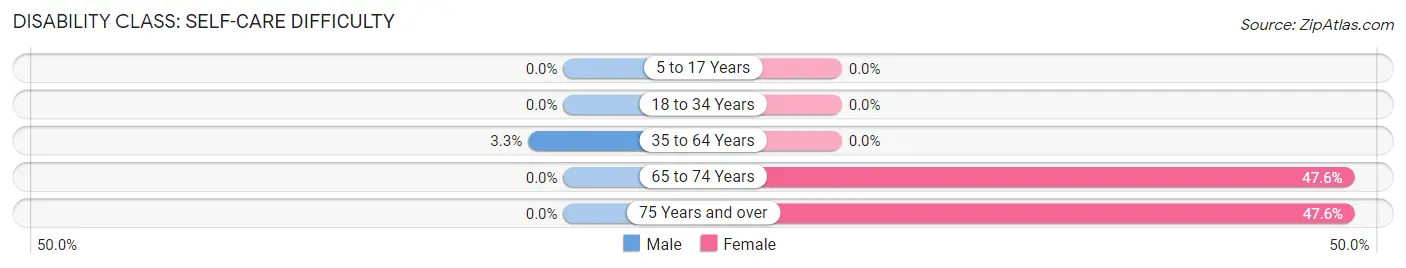
| Age Bracket | Male | Female |
| 5 to 17 Years | 0 (0.0%) | 0 (0.0%) |
| 18 to 34 Years | 0 (0.0%) | 0 (0.0%) |
| 35 to 64 Years | 9 (3.3%) | 0 (0.0%) |
| 65 to 74 Years | 0 (0.0%) | 49 (47.6%) |
| 75 Years and over | 0 (0.0%) | 10 (47.6%) |
Technology Access in Crocker
Computing Device Access in Crocker

| Device Type | # Households | % Households |
| Desktop or Laptop | 369 | 80.9% |
| Smartphone | 416 | 91.2% |
| Tablet | 305 | 66.9% |
| No Computing Device | 20 | 4.4% |
| Total | 456 | 100.0% |
Internet Access in Crocker
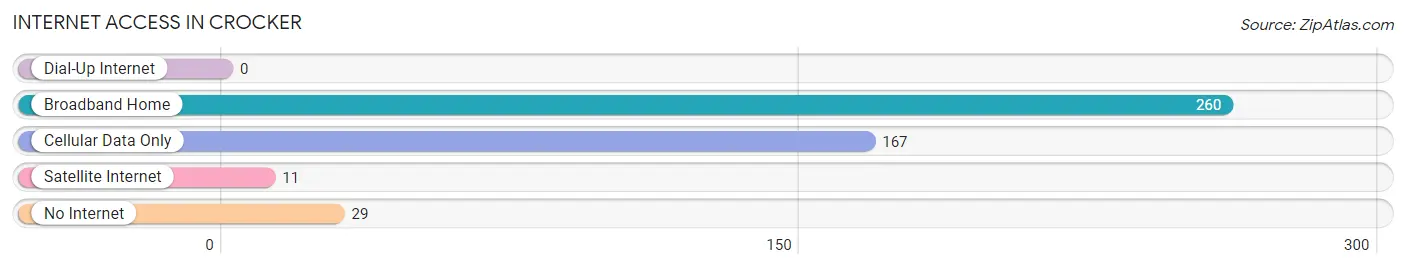
| Internet Type | # Households | % Households |
| Dial-Up Internet | 0 | 0.0% |
| Broadband Home | 260 | 57.0% |
| Cellular Data Only | 167 | 36.6% |
| Satellite Internet | 11 | 2.4% |
| No Internet | 29 | 6.4% |
| Total | 456 | 100.0% |
Crocker Summary
Crocker is a small town located in the state of Washington, in the United States. It is situated in the foothills of the Cascade Mountains, about 25 miles east of Seattle. The town has a population of about 1,500 people, and is known for its rural charm and small-town atmosphere.
History
Crocker was founded in 1883 by a group of settlers from the Midwest. The town was named after the Crocker family, who were among the first settlers. The town was originally a logging and farming community, and the first post office was established in 1884.
In the early 1900s, the town began to grow and develop. The first school was built in 1906, and the first church was built in 1908. The town also had a general store, a blacksmith shop, and a sawmill.
In the 1920s, the town began to experience a decline in population as people moved away to larger cities. However, the town was able to survive and remain a small, rural community.
Geography
Crocker is located in the foothills of the Cascade Mountains, about 25 miles east of Seattle. The town is situated in a valley, surrounded by rolling hills and forests. The climate is mild, with warm summers and cool winters.
The town is located near several rivers, including the Snoqualmie River, the Skykomish River, and the Tolt River. The town is also close to several lakes, including Lake Sammamish, Lake Washington, and Lake Stevens.
Economy
Crocker’s economy is largely based on agriculture and tourism. The town is home to several farms, which produce a variety of crops, including apples, cherries, and vegetables. The town also has several wineries, which produce a variety of wines.
Tourism is also an important part of the town’s economy. The town is home to several parks and outdoor recreation areas, including the Crocker State Park and the Snoqualmie National Forest. The town also has several restaurants, shops, and other attractions.
Demographics
As of the 2010 census, the population of Crocker was 1,500 people. The town is predominantly white, with about 90% of the population being Caucasian. The median household income is about $50,000, and the median age is about 40 years old.
Crocker is a small, rural town with a unique charm and atmosphere. The town is known for its friendly people, its beautiful scenery, and its strong sense of community. It is a great place to live, work, and raise a family.
Common Questions
What is the Total Population of Crocker?
Total Population of Crocker is 1,218.
What is the Total Male Population of Crocker?
Total Male Population of Crocker is 583.
What is the Total Female Population of Crocker?
Total Female Population of Crocker is 635.
What is the Ratio of Males per 100 Females in Crocker?
There are 91.81 Males per 100 Females in Crocker.
What is the Ratio of Females per 100 Males in Crocker?
There are 108.92 Females per 100 Males in Crocker.
What is the Median Population Age in Crocker?
Median Population Age in Crocker is 49.0 Years.
What is the Average Family Size in Crocker
Average Family Size in Crocker is 2.9 People.
What is the Average Household Size in Crocker
Average Household Size in Crocker is 2.7 People.
What is Per Capita Income in Crocker?
Per Capita income in Crocker is $43,575.
What is the Median Family Income in Crocker?
Median Family Income in Crocker is $112,000.
What is the Median Household income in Crocker?
Median Household Income in Crocker is $109,091.
What is Income or Wage Gap in Crocker?
Income or Wage Gap in Crocker is 48.6%.
Women in Crocker earn 51.4 cents for every dollar earned by a man.
What is Inequality or Gini Index in Crocker?
Inequality or Gini Index in Crocker is 0.35.
How Large is the Labor Force in Crocker?
There are 503 People in the Labor Forcein in Crocker.
What is the Percentage of People in the Labor Force in Crocker?
54.5% of People are in the Labor Force in Crocker.
What is the Unemployment Rate in Crocker?
Unemployment Rate in Crocker is 2.2%.