Rosedale, WA
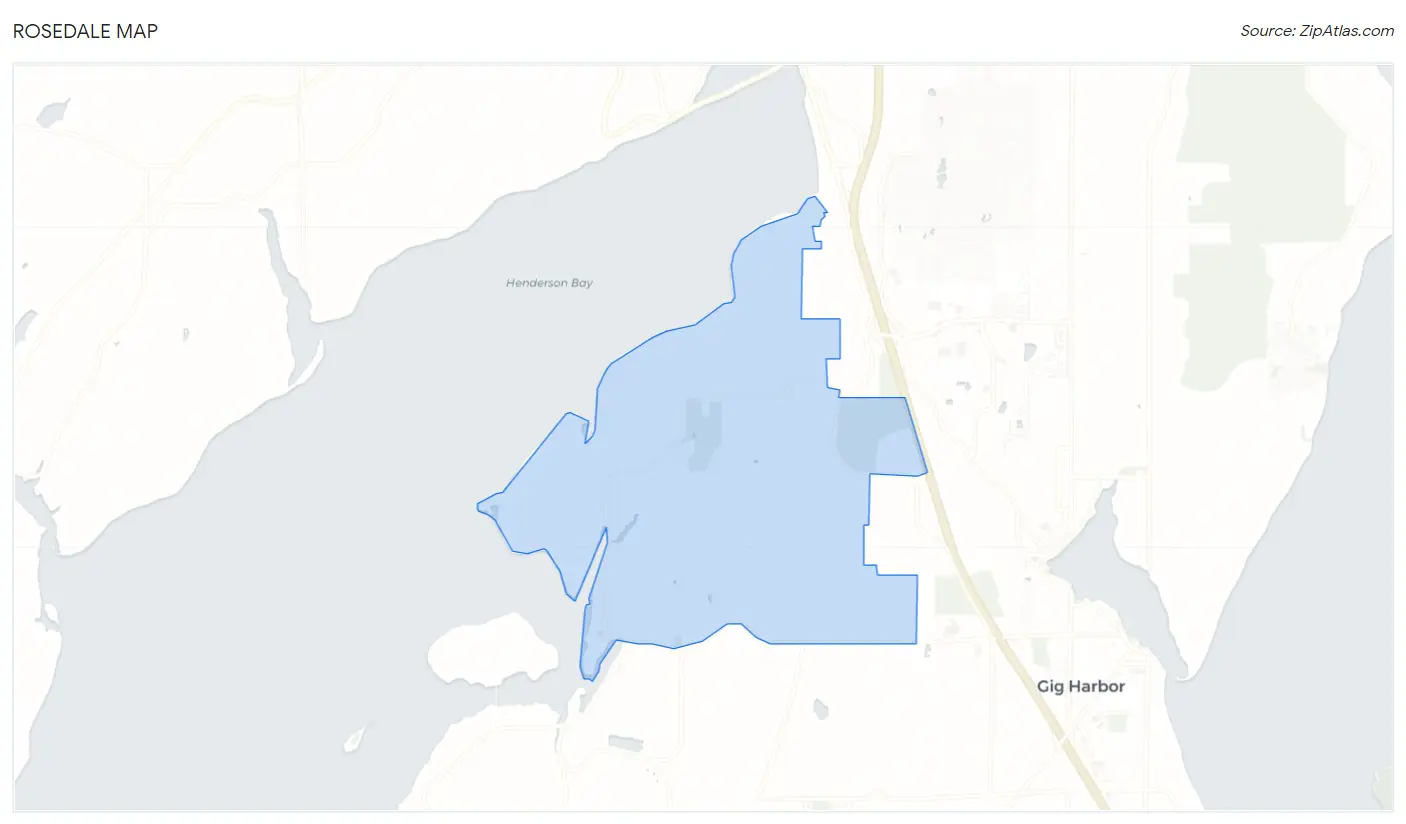
Rosedale Map
Rosedale Overview
4,273
TOTAL POPULATION
1,784
MALE POPULATION
2,489
FEMALE POPULATION
71.68
MALES / 100 FEMALES
139.52
FEMALES / 100 MALES
44.7
MEDIAN AGE
3.1
AVG FAMILY SIZE
2.7
AVG HOUSEHOLD SIZE
$66,604
PER CAPITA INCOME
$149,342
AVG FAMILY INCOME
$141,490
AVG HOUSEHOLD INCOME
80.1%
WAGE / INCOME GAP [ % ]
19.9¢/ $1
WAGE / INCOME GAP [ $ ]
0.51
INEQUALITY / GINI INDEX
1,732
LABOR FORCE [ PEOPLE ]
47.3%
PERCENT IN LABOR FORCE
7.9%
UNEMPLOYMENT RATE
Race in Rosedale
The most populous races in Rosedale are White / Caucasian (3,528 | 82.6%), Two or more Races (308 | 7.2%), and Black / African American (194 | 4.5%).
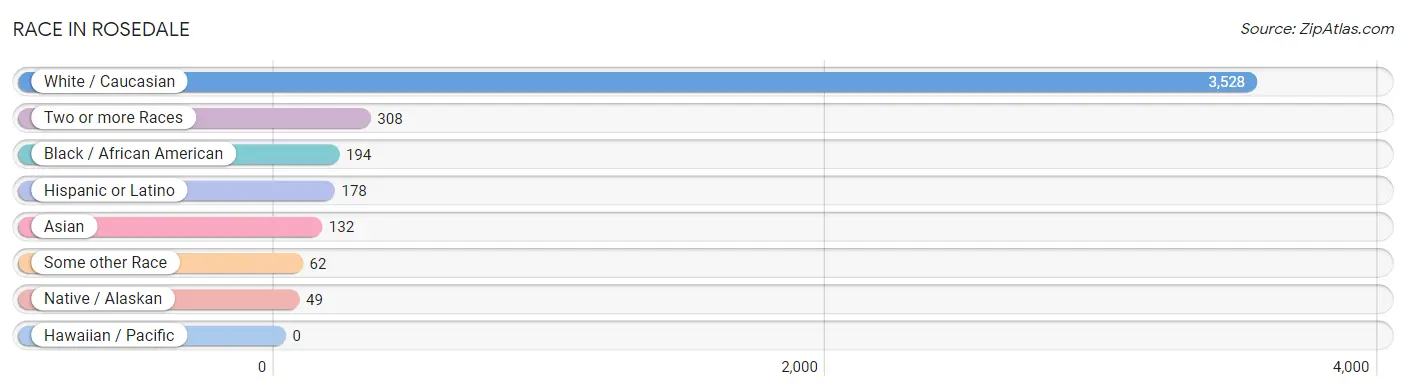
| Race | # Population | % Population |
| Asian | 132 | 3.1% |
| Black / African American | 194 | 4.5% |
| Hawaiian / Pacific | 0 | 0.0% |
| Hispanic or Latino | 178 | 4.2% |
| Native / Alaskan | 49 | 1.1% |
| White / Caucasian | 3,528 | 82.6% |
| Two or more Races | 308 | 7.2% |
| Some other Race | 62 | 1.5% |
| Total | 4,273 | 100.0% |
Ancestry in Rosedale
The most populous ancestries reported in Rosedale are German (778 | 18.2%), English (643 | 15.0%), Irish (436 | 10.2%), Italian (325 | 7.6%), and European (253 | 5.9%), together accounting for 57.0% of all Rosedale residents.
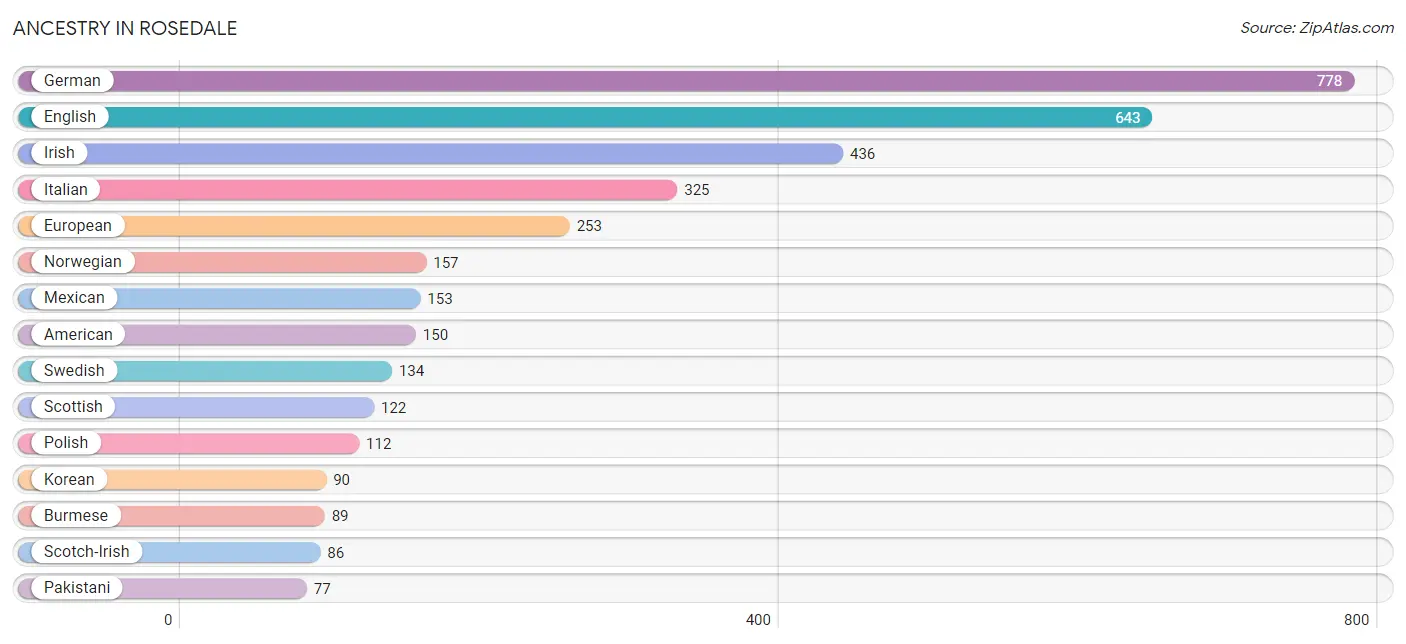
| Ancestry | # Population | % Population |
| Alaska Native | 5 | 0.1% |
| Albanian | 12 | 0.3% |
| American | 150 | 3.5% |
| Arab | 9 | 0.2% |
| Armenian | 19 | 0.4% |
| Bhutanese | 41 | 1.0% |
| Blackfeet | 40 | 0.9% |
| British | 36 | 0.8% |
| Burmese | 89 | 2.1% |
| Canadian | 27 | 0.6% |
| Chippewa | 13 | 0.3% |
| Choctaw | 9 | 0.2% |
| Colville | 4 | 0.1% |
| Croatian | 9 | 0.2% |
| Czech | 7 | 0.2% |
| Danish | 61 | 1.4% |
| Dutch | 29 | 0.7% |
| Eastern European | 11 | 0.3% |
| English | 643 | 15.0% |
| Ethiopian | 12 | 0.3% |
| European | 253 | 5.9% |
| Finnish | 17 | 0.4% |
| French | 57 | 1.3% |
| French American Indian | 40 | 0.9% |
| French Canadian | 23 | 0.5% |
| German | 778 | 18.2% |
| Greek | 11 | 0.3% |
| Guamanian / Chamorro | 12 | 0.3% |
| Hungarian | 12 | 0.3% |
| Indian (Asian) | 75 | 1.8% |
| Irish | 436 | 10.2% |
| Italian | 325 | 7.6% |
| Korean | 90 | 2.1% |
| Laotian | 27 | 0.6% |
| Lebanese | 9 | 0.2% |
| Mexican | 153 | 3.6% |
| Native Hawaiian | 22 | 0.5% |
| New Zealander | 10 | 0.2% |
| Northern European | 5 | 0.1% |
| Norwegian | 157 | 3.7% |
| Pakistani | 77 | 1.8% |
| Polish | 112 | 2.6% |
| Portuguese | 43 | 1.0% |
| Puerto Rican | 15 | 0.4% |
| Puget Sound Salish | 6 | 0.1% |
| Russian | 26 | 0.6% |
| Scandinavian | 47 | 1.1% |
| Scotch-Irish | 86 | 2.0% |
| Scottish | 122 | 2.9% |
| Sioux | 7 | 0.2% |
| Spanish | 10 | 0.2% |
| Subsaharan African | 12 | 0.3% |
| Swedish | 134 | 3.1% |
| Swiss | 57 | 1.3% |
| Welsh | 28 | 0.7% |
| Yakama | 5 | 0.1% | View All 56 Rows |
Immigrants in Rosedale
The most numerous immigrant groups reported in Rosedale came from Asia (46 | 1.1%), Europe (37 | 0.9%), Canada (32 | 0.7%), Eastern Asia (32 | 0.7%), and Central America (31 | 0.7%), together accounting for 4.2% of all Rosedale residents.
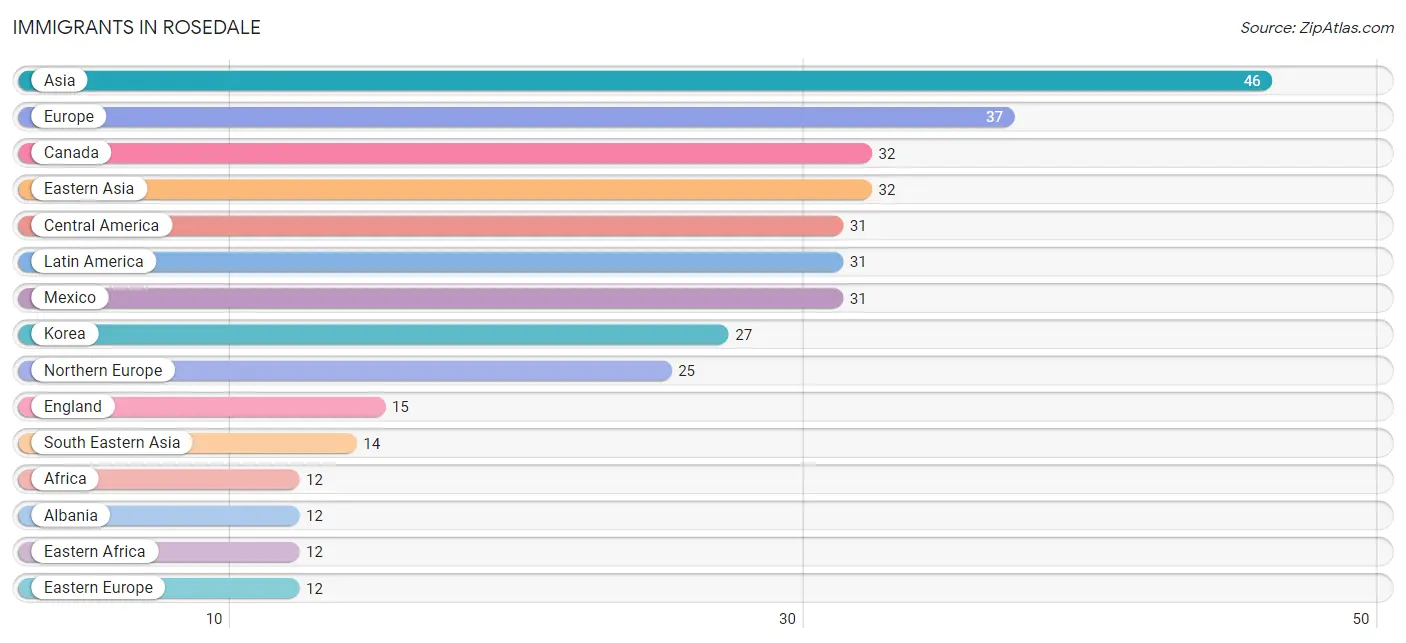
| Immigration Origin | # Population | % Population |
| Africa | 12 | 0.3% |
| Albania | 12 | 0.3% |
| Asia | 46 | 1.1% |
| Canada | 32 | 0.7% |
| Central America | 31 | 0.7% |
| China | 5 | 0.1% |
| Eastern Africa | 12 | 0.3% |
| Eastern Asia | 32 | 0.7% |
| Eastern Europe | 12 | 0.3% |
| England | 15 | 0.4% |
| Ethiopia | 12 | 0.3% |
| Europe | 37 | 0.9% |
| Korea | 27 | 0.6% |
| Latin America | 31 | 0.7% |
| Mexico | 31 | 0.7% |
| Northern Europe | 25 | 0.6% |
| Philippines | 8 | 0.2% |
| Scotland | 10 | 0.2% |
| South Eastern Asia | 14 | 0.3% |
| Thailand | 6 | 0.1% | View All 20 Rows |
Sex and Age in Rosedale
Sex and Age in Rosedale
The most populous age groups in Rosedale are 60 to 64 Years (214 | 12.0%) for men and 45 to 49 Years (386 | 15.5%) for women.
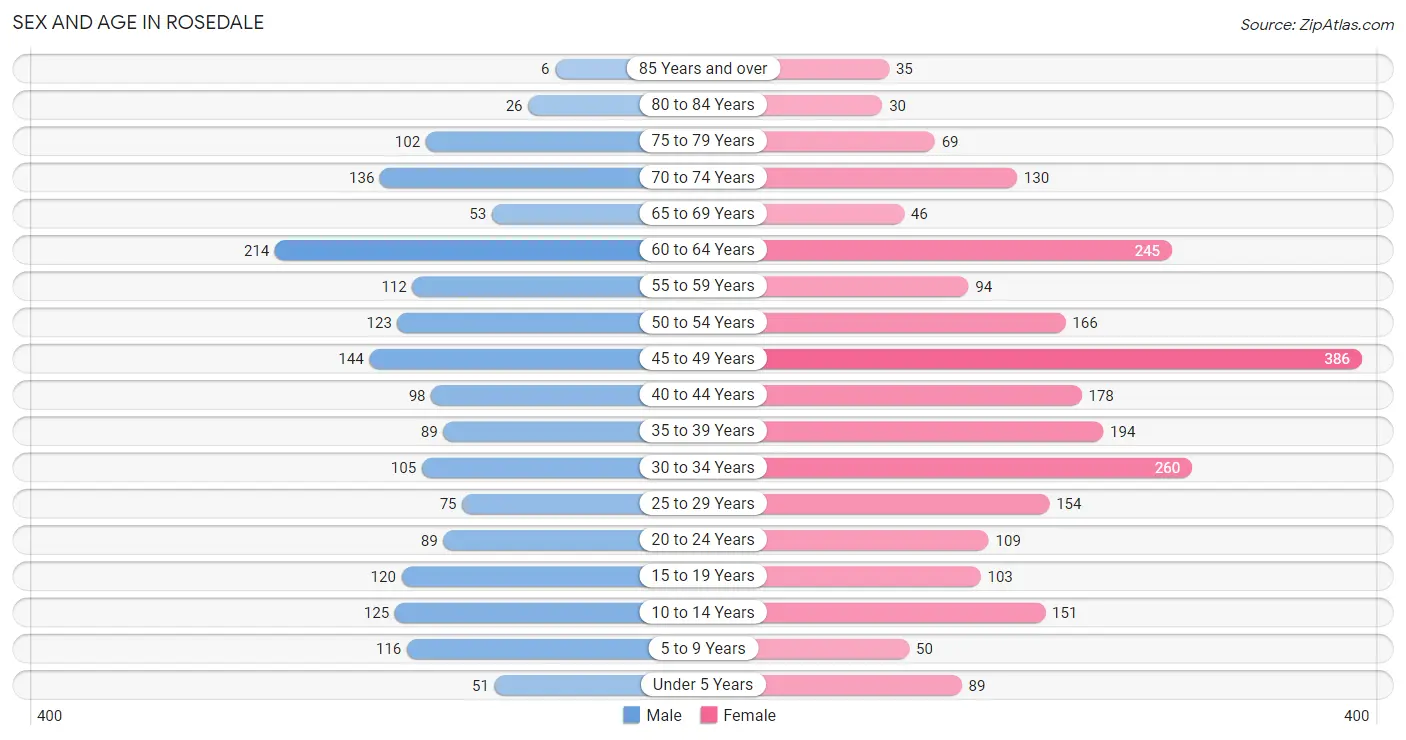
| Age Bracket | Male | Female |
| Under 5 Years | 51 (2.9%) | 89 (3.6%) |
| 5 to 9 Years | 116 (6.5%) | 50 (2.0%) |
| 10 to 14 Years | 125 (7.0%) | 151 (6.1%) |
| 15 to 19 Years | 120 (6.7%) | 103 (4.1%) |
| 20 to 24 Years | 89 (5.0%) | 109 (4.4%) |
| 25 to 29 Years | 75 (4.2%) | 154 (6.2%) |
| 30 to 34 Years | 105 (5.9%) | 260 (10.4%) |
| 35 to 39 Years | 89 (5.0%) | 194 (7.8%) |
| 40 to 44 Years | 98 (5.5%) | 178 (7.1%) |
| 45 to 49 Years | 144 (8.1%) | 386 (15.5%) |
| 50 to 54 Years | 123 (6.9%) | 166 (6.7%) |
| 55 to 59 Years | 112 (6.3%) | 94 (3.8%) |
| 60 to 64 Years | 214 (12.0%) | 245 (9.8%) |
| 65 to 69 Years | 53 (3.0%) | 46 (1.8%) |
| 70 to 74 Years | 136 (7.6%) | 130 (5.2%) |
| 75 to 79 Years | 102 (5.7%) | 69 (2.8%) |
| 80 to 84 Years | 26 (1.5%) | 30 (1.2%) |
| 85 Years and over | 6 (0.3%) | 35 (1.4%) |
| Total | 1,784 (100.0%) | 2,489 (100.0%) |
Families and Households in Rosedale
Median Family Size in Rosedale
The median family size in Rosedale is 3.12 persons per family, with married-couple families (911 | 92.2%) accounting for the largest median family size of 3.18 persons per family. On the other hand, single female/mother families (55 | 5.6%) represent the smallest median family size with 2.20 persons per family.
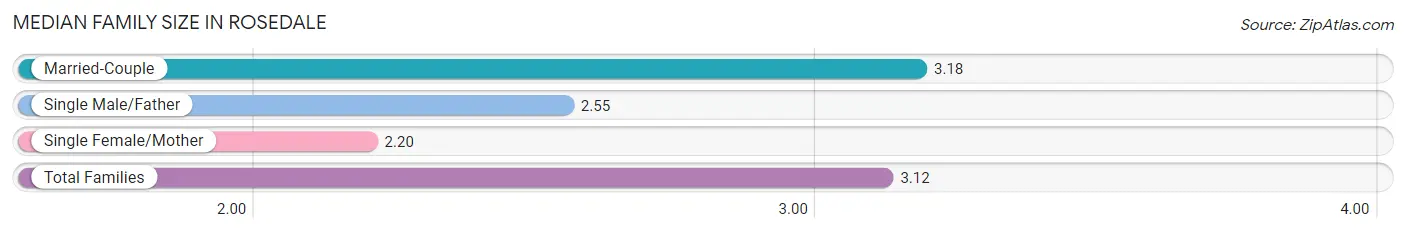
| Family Type | # Families | Family Size |
| Married-Couple | 911 (92.2%) | 3.18 |
| Single Male/Father | 22 (2.2%) | 2.55 |
| Single Female/Mother | 55 (5.6%) | 2.20 |
| Total Families | 988 (100.0%) | 3.12 |
Median Household Size in Rosedale
The median household size in Rosedale is 2.74 persons per household, with married-couple households (911 | 72.3%) accounting for the largest median household size of 3.2 persons per household. non-family households (272 | 21.6%) represent the smallest median household size with 1.21 persons per household.
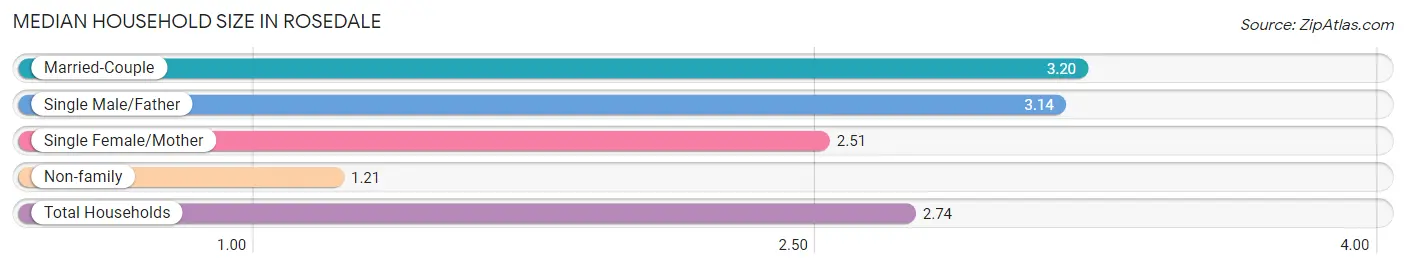
| Household Type | # Households | Household Size |
| Married-Couple | 911 (72.3%) | 3.20 |
| Single Male/Father | 22 (1.8%) | 3.14 |
| Single Female/Mother | 55 (4.4%) | 2.51 |
| Non-family | 272 (21.6%) | 1.21 |
| Total Households | 1,260 (100.0%) | 2.74 |
Household Size by Marriage Status in Rosedale
Out of a total of 1,260 households in Rosedale, 988 (78.4%) are family households, while 272 (21.6%) are nonfamily households. The most numerous type of family households are 2-person households, comprising 431, and the most common type of nonfamily households are 1-person households, comprising 234.
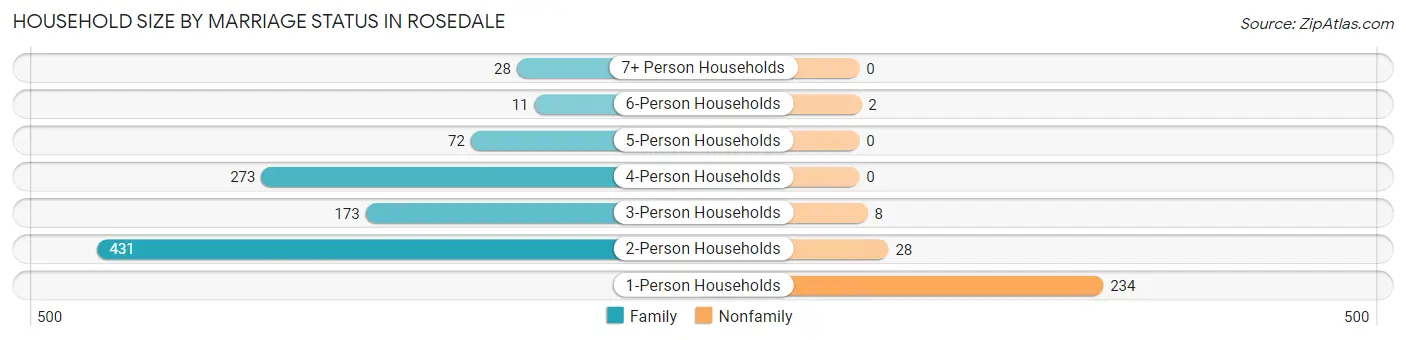
| Household Size | Family Households | Nonfamily Households |
| 1-Person Households | - | 234 (18.6%) |
| 2-Person Households | 431 (34.2%) | 28 (2.2%) |
| 3-Person Households | 173 (13.7%) | 8 (0.6%) |
| 4-Person Households | 273 (21.7%) | 0 (0.0%) |
| 5-Person Households | 72 (5.7%) | 0 (0.0%) |
| 6-Person Households | 11 (0.9%) | 2 (0.2%) |
| 7+ Person Households | 28 (2.2%) | 0 (0.0%) |
| Total | 988 (78.4%) | 272 (21.6%) |
Female Fertility in Rosedale
Fertility by Age in Rosedale
Average fertility rate in Rosedale is 30.0 births per 1,000 women. Women in the age bracket of 35 to 50 years have the highest fertility rate with 44.0 births per 1,000 women. Women in the age bracket of 35 to 50 years acount for 83.3% of all women with births.
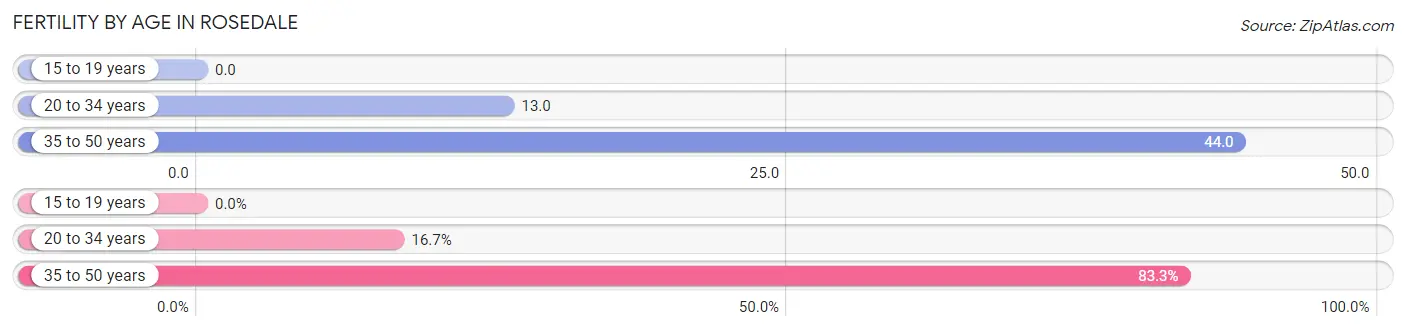
| Age Bracket | Women with Births | Births / 1,000 Women |
| 15 to 19 years | 0 (0.0%) | 0.0 |
| 20 to 34 years | 7 (16.7%) | 13.0 |
| 35 to 50 years | 35 (83.3%) | 44.0 |
| Total | 42 (100.0%) | 30.0 |
Fertility by Age by Marriage Status in Rosedale
73.8% of women with births (42) in Rosedale are married. The highest percentage of unmarried women with births falls into 35 to 50 years age bracket with 31.4% of them unmarried at the time of birth, while the lowest percentage of unmarried women with births belong to 20 to 34 years age bracket with 0.0% of them unmarried.

| Age Bracket | Married | Unmarried |
| 15 to 19 years | 0 (0.0%) | 0 (0.0%) |
| 20 to 34 years | 7 (100.0%) | 0 (0.0%) |
| 35 to 50 years | 24 (68.6%) | 11 (31.4%) |
| Total | 31 (73.8%) | 11 (26.2%) |
Fertility by Education in Rosedale

| Educational Attainment | Women with Births | Births / 1,000 Women |
| Less than High School | 11 (26.2%) | 55.0 |
| High School Diploma | 0 (0.0%) | 0.0 |
| College or Associate's Degree | 24 (57.1%) | 67.0 |
| Bachelor's Degree | 0 (0.0%) | 0.0 |
| Graduate Degree | 7 (16.7%) | 61.0 |
| Total | 42 (100.0%) | 30.0 |
Fertility by Education by Marriage Status in Rosedale
26.2% of women with births in Rosedale are unmarried. Women with the educational attainment of college or associate's degree are most likely to be married with 100.0% of them married at childbirth, while women with the educational attainment of less than high school are least likely to be married with 100.0% of them unmarried at childbirth.
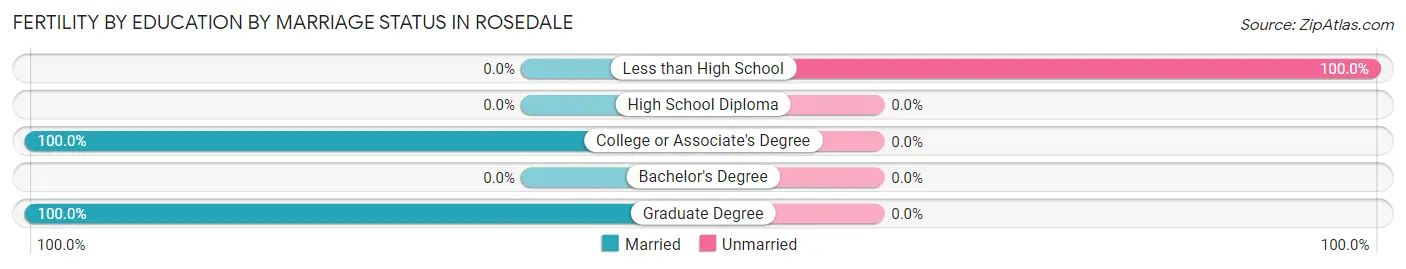
| Educational Attainment | Married | Unmarried |
| Less than High School | 0 (0.0%) | 11 (100.0%) |
| High School Diploma | 0 (0.0%) | 0 (0.0%) |
| College or Associate's Degree | 24 (100.0%) | 0 (0.0%) |
| Bachelor's Degree | 0 (0.0%) | 0 (0.0%) |
| Graduate Degree | 7 (100.0%) | 0 (0.0%) |
| Total | 31 (73.8%) | 11 (26.2%) |
Income in Rosedale
Income Overview in Rosedale
Per Capita Income in Rosedale is $66,604, while median incomes of families and households are $149,342 and $141,490 respectively.
| Characteristic | Number | Measure |
| Per Capita Income | 4,273 | $66,604 |
| Median Family Income | 988 | $149,342 |
| Mean Family Income | 988 | $259,309 |
| Median Household Income | 1,260 | $141,490 |
| Mean Household Income | 1,260 | $220,031 |
| Income Deficit | 988 | $0 |
| Wage / Income Gap (%) | 4,273 | 80.15% |
| Wage / Income Gap ($) | 4,273 | 19.85¢ per $1 |
| Gini / Inequality Index | 4,273 | 0.51 |
Earnings by Sex in Rosedale
Average Earnings in Rosedale are $40,217, $85,000 for men and $16,875 for women, a difference of 80.1%.
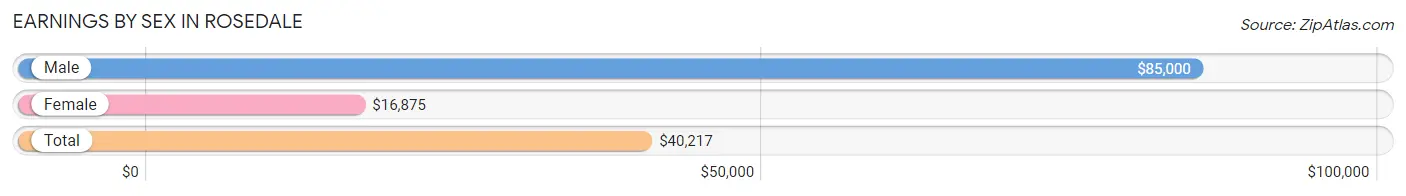
| Sex | Number | Average Earnings |
| Male | 1,084 (43.6%) | $85,000 |
| Female | 1,401 (56.4%) | $16,875 |
| Total | 2,485 (100.0%) | $40,217 |
Earnings by Sex by Income Bracket in Rosedale
The most common earnings brackets in Rosedale are $100,000+ for men (494 | 45.6%) and $2,499 or less for women (250 | 17.8%).
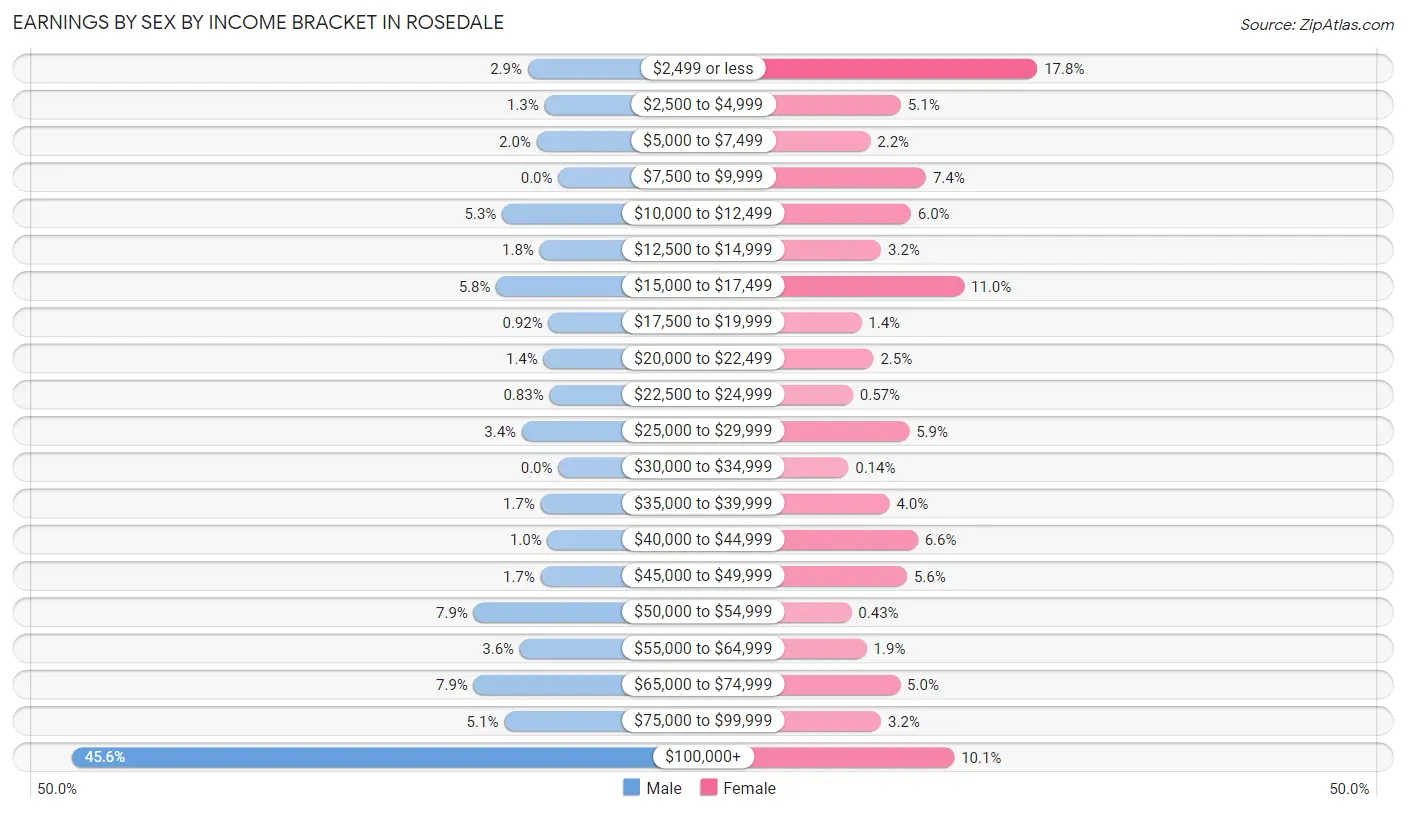
| Income | Male | Female |
| $2,499 or less | 31 (2.9%) | 250 (17.8%) |
| $2,500 to $4,999 | 14 (1.3%) | 71 (5.1%) |
| $5,000 to $7,499 | 22 (2.0%) | 31 (2.2%) |
| $7,500 to $9,999 | 0 (0.0%) | 104 (7.4%) |
| $10,000 to $12,499 | 57 (5.3%) | 84 (6.0%) |
| $12,500 to $14,999 | 19 (1.8%) | 45 (3.2%) |
| $15,000 to $17,499 | 63 (5.8%) | 154 (11.0%) |
| $17,500 to $19,999 | 10 (0.9%) | 19 (1.4%) |
| $20,000 to $22,499 | 15 (1.4%) | 35 (2.5%) |
| $22,500 to $24,999 | 9 (0.8%) | 8 (0.6%) |
| $25,000 to $29,999 | 37 (3.4%) | 82 (5.9%) |
| $30,000 to $34,999 | 0 (0.0%) | 2 (0.1%) |
| $35,000 to $39,999 | 18 (1.7%) | 56 (4.0%) |
| $40,000 to $44,999 | 11 (1.0%) | 93 (6.6%) |
| $45,000 to $49,999 | 18 (1.7%) | 79 (5.6%) |
| $50,000 to $54,999 | 86 (7.9%) | 6 (0.4%) |
| $55,000 to $64,999 | 39 (3.6%) | 26 (1.9%) |
| $65,000 to $74,999 | 86 (7.9%) | 70 (5.0%) |
| $75,000 to $99,999 | 55 (5.1%) | 45 (3.2%) |
| $100,000+ | 494 (45.6%) | 141 (10.1%) |
| Total | 1,084 (100.0%) | 1,401 (100.0%) |
Earnings by Sex by Educational Attainment in Rosedale
Average earnings in Rosedale are $100,689 for men and $16,867 for women, a difference of 83.3%. Men with an educational attainment of graduate degree enjoy the highest average annual earnings of $123,958, while those with bachelor's degree education earn the least with $87,411. Women with an educational attainment of graduate degree earn the most with the average annual earnings of $103,523, while those with high school diploma education have the smallest earnings of $15,489.
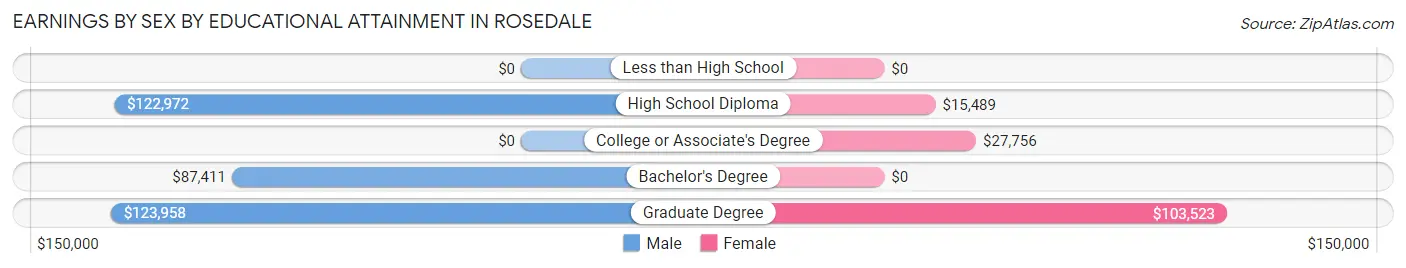
| Educational Attainment | Male Income | Female Income |
| Less than High School | - | - |
| High School Diploma | $122,972 | $15,489 |
| College or Associate's Degree | - | - |
| Bachelor's Degree | $87,411 | $0 |
| Graduate Degree | $123,958 | $103,523 |
| Total | $100,689 | $16,867 |
Family Income in Rosedale
Family Income Brackets in Rosedale
According to the Rosedale family income data, there are 327 families falling into the $200,000+ income range, which is the most common income bracket and makes up 33.1% of all families.
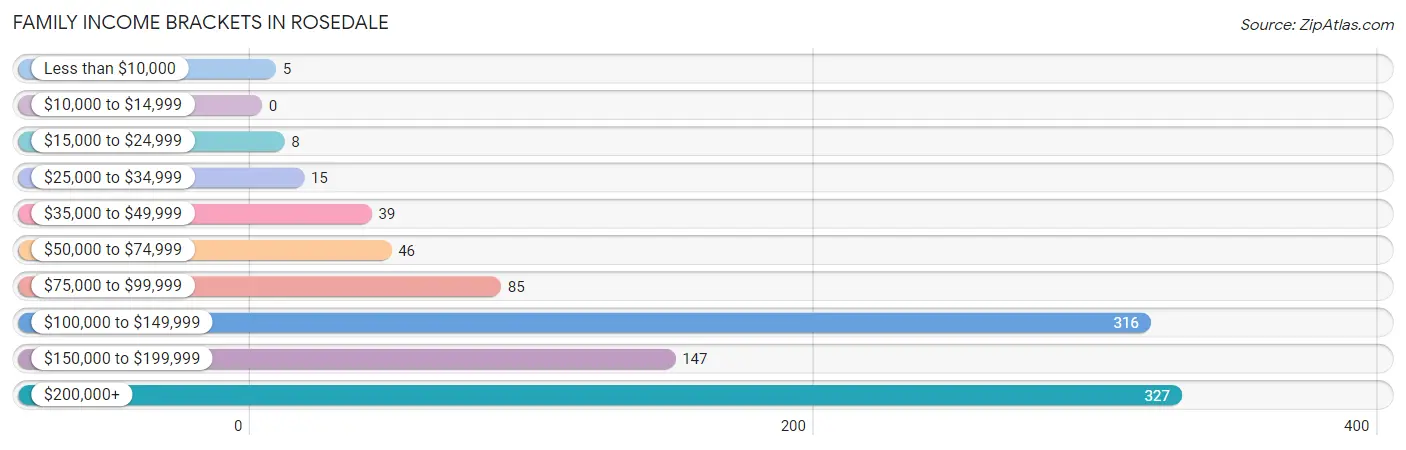
| Income Bracket | # Families | % Families |
| Less than $10,000 | 5 | 0.5% |
| $10,000 to $14,999 | 0 | 0.0% |
| $15,000 to $24,999 | 8 | 0.8% |
| $25,000 to $34,999 | 15 | 1.5% |
| $35,000 to $49,999 | 39 | 3.9% |
| $50,000 to $74,999 | 46 | 4.7% |
| $75,000 to $99,999 | 85 | 8.6% |
| $100,000 to $149,999 | 316 | 32.0% |
| $150,000 to $199,999 | 147 | 14.9% |
| $200,000+ | 327 | 33.1% |
Family Income by Famaliy Size in Rosedale
4-person families (263 | 26.6%) account for the highest median family income in Rosedale with $243,250 per family, while 2-person families (451 | 45.7%) have the highest median income of $68,403 per family member.
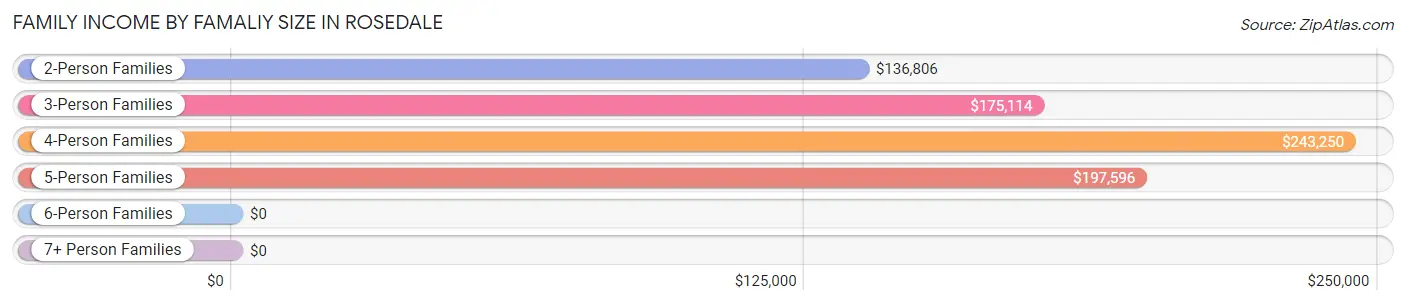
| Income Bracket | # Families | Median Income |
| 2-Person Families | 451 (45.7%) | $136,806 |
| 3-Person Families | 166 (16.8%) | $175,114 |
| 4-Person Families | 263 (26.6%) | $243,250 |
| 5-Person Families | 69 (7.0%) | $197,596 |
| 6-Person Families | 11 (1.1%) | $0 |
| 7+ Person Families | 28 (2.8%) | $0 |
| Total | 988 (100.0%) | $149,342 |
Family Income by Number of Earners in Rosedale
The median family income in Rosedale is $149,342, with families comprising 3+ earners (147) having the highest median family income of $250,001, while families with no earners (146) have the lowest median family income of $100,500, accounting for 14.9% and 14.8% of families, respectively.
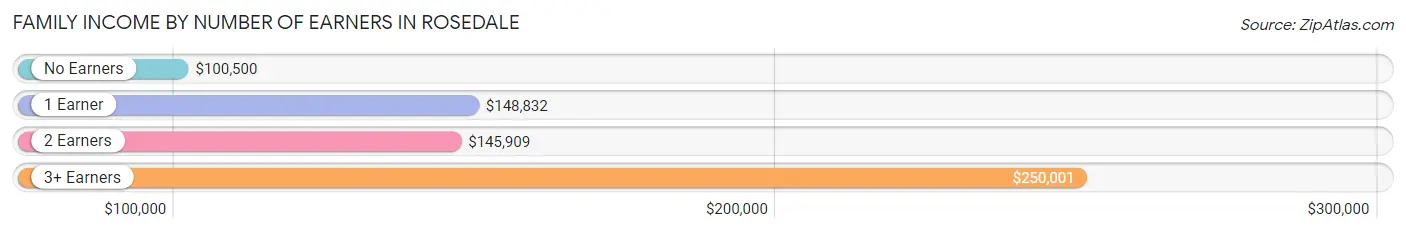
| Number of Earners | # Families | Median Income |
| No Earners | 146 (14.8%) | $100,500 |
| 1 Earner | 291 (29.4%) | $148,832 |
| 2 Earners | 404 (40.9%) | $145,909 |
| 3+ Earners | 147 (14.9%) | $250,001 |
| Total | 988 (100.0%) | $149,342 |
Household Income in Rosedale
Household Income Brackets in Rosedale
With 344 households falling in the category, the $200,000+ income range is the most frequent in Rosedale, accounting for 27.3% of all households. In contrast, only 13 households (1.0%) fall into the $10,000 to $14,999 income bracket, making it the least populous group.
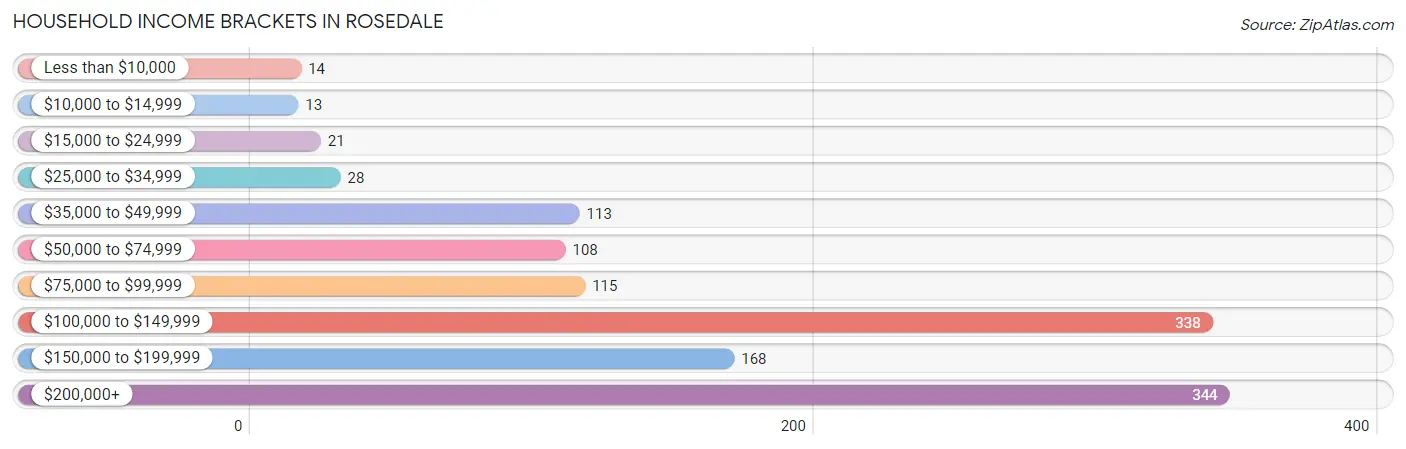
| Income Bracket | # Households | % Households |
| Less than $10,000 | 14 | 1.1% |
| $10,000 to $14,999 | 13 | 1.0% |
| $15,000 to $24,999 | 21 | 1.7% |
| $25,000 to $34,999 | 28 | 2.2% |
| $35,000 to $49,999 | 113 | 9.0% |
| $50,000 to $74,999 | 108 | 8.6% |
| $75,000 to $99,999 | 115 | 9.1% |
| $100,000 to $149,999 | 338 | 26.8% |
| $150,000 to $199,999 | 168 | 13.3% |
| $200,000+ | 344 | 27.3% |
Household Income by Householder Age in Rosedale
The median household income in Rosedale is $141,490, with the highest median household income of $165,893 found in the 45 to 64 years age bracket for the primary householder. A total of 643 households (51.0%) fall into this category.

| Income Bracket | # Households | Median Income |
| 15 to 24 Years | 0 (0.0%) | $0 |
| 25 to 44 Years | 234 (18.6%) | $139,167 |
| 45 to 64 Years | 643 (51.0%) | $165,893 |
| 65+ Years | 383 (30.4%) | $97,596 |
| Total | 1,260 (100.0%) | $141,490 |
Poverty in Rosedale
Income Below Poverty by Sex and Age in Rosedale
With 3.0% poverty level for males and 1.5% for females among the residents of Rosedale, 18 to 24 year old males and 25 to 34 year old females are the most vulnerable to poverty, with 11 males (7.4%) and 13 females (12.4%) in their respective age groups living below the poverty level.
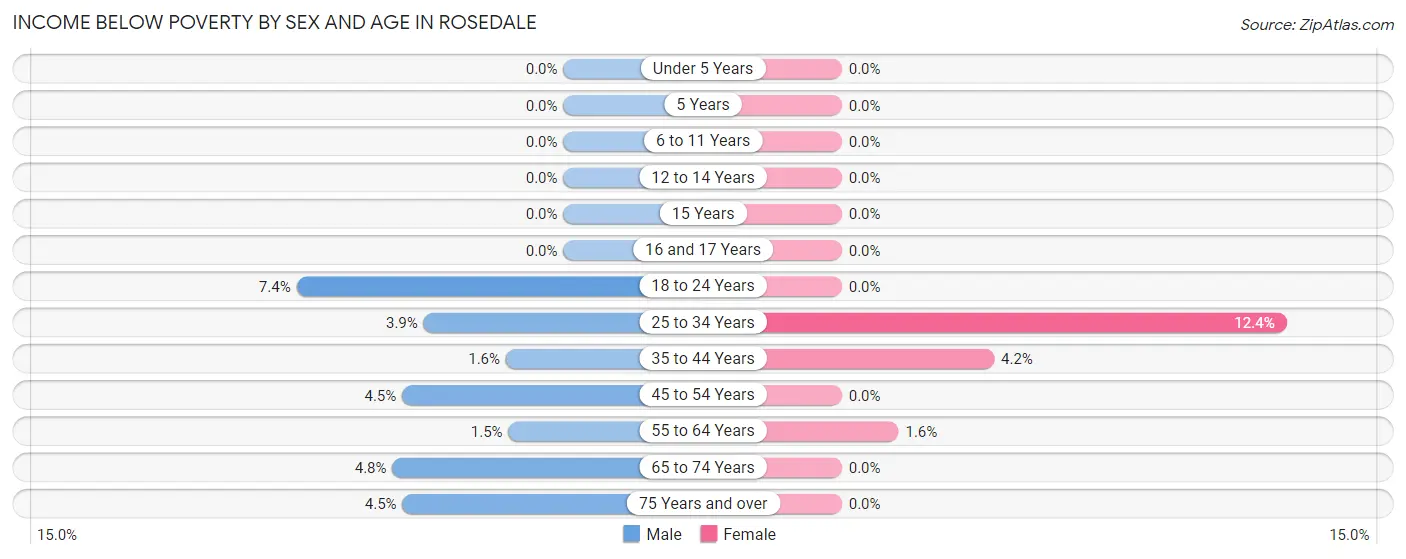
| Age Bracket | Male | Female |
| Under 5 Years | 0 (0.0%) | 0 (0.0%) |
| 5 Years | 0 (0.0%) | 0 (0.0%) |
| 6 to 11 Years | 0 (0.0%) | 0 (0.0%) |
| 12 to 14 Years | 0 (0.0%) | 0 (0.0%) |
| 15 Years | 0 (0.0%) | 0 (0.0%) |
| 16 and 17 Years | 0 (0.0%) | 0 (0.0%) |
| 18 to 24 Years | 11 (7.4%) | 0 (0.0%) |
| 25 to 34 Years | 7 (3.9%) | 13 (12.4%) |
| 35 to 44 Years | 3 (1.6%) | 7 (4.2%) |
| 45 to 54 Years | 12 (4.5%) | 0 (0.0%) |
| 55 to 64 Years | 5 (1.5%) | 5 (1.6%) |
| 65 to 74 Years | 9 (4.8%) | 0 (0.0%) |
| 75 Years and over | 6 (4.5%) | 0 (0.0%) |
| Total | 53 (3.0%) | 25 (1.5%) |
Income Above Poverty by Sex and Age in Rosedale
According to the poverty statistics in Rosedale, males aged under 5 years and females aged under 5 years are the age groups that are most secure financially, with 100.0% of males and 100.0% of females in these age groups living above the poverty line.

| Age Bracket | Male | Female |
| Under 5 Years | 51 (100.0%) | 89 (100.0%) |
| 5 Years | 29 (100.0%) | 0 (0.0%) |
| 6 to 11 Years | 132 (100.0%) | 83 (100.0%) |
| 12 to 14 Years | 80 (100.0%) | 118 (100.0%) |
| 15 Years | 20 (100.0%) | 10 (100.0%) |
| 16 and 17 Years | 38 (100.0%) | 57 (100.0%) |
| 18 to 24 Years | 137 (92.6%) | 130 (100.0%) |
| 25 to 34 Years | 173 (96.1%) | 92 (87.6%) |
| 35 to 44 Years | 184 (98.4%) | 158 (95.8%) |
| 45 to 54 Years | 255 (95.5%) | 296 (100.0%) |
| 55 to 64 Years | 321 (98.5%) | 312 (98.4%) |
| 65 to 74 Years | 180 (95.2%) | 164 (100.0%) |
| 75 Years and over | 128 (95.5%) | 134 (100.0%) |
| Total | 1,728 (97.0%) | 1,643 (98.5%) |
Income Below Poverty Among Married-Couple Families in Rosedale
The poverty statistics for married-couple families in Rosedale show that 0.5% or 5 of the total 911 families live below the poverty line. Families with no children have the highest poverty rate of 0.9%, comprising of 5 families. On the other hand, families with 1 or 2 children have the lowest poverty rate of 0.0%, which includes 0 families.
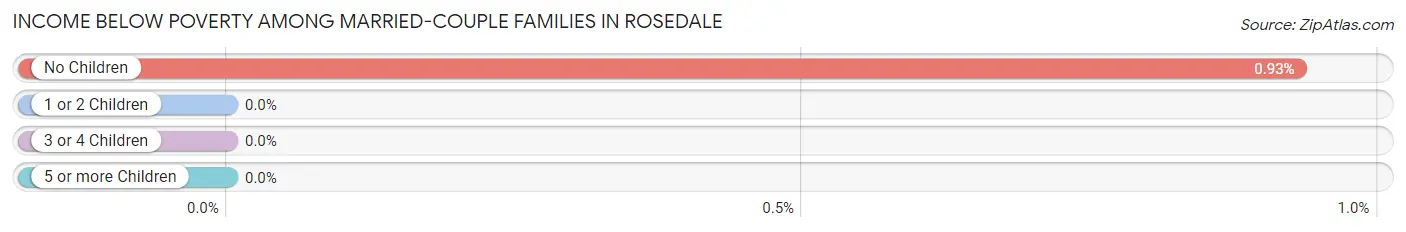
| Children | Above Poverty | Below Poverty |
| No Children | 535 (99.1%) | 5 (0.9%) |
| 1 or 2 Children | 314 (100.0%) | 0 (0.0%) |
| 3 or 4 Children | 57 (100.0%) | 0 (0.0%) |
| 5 or more Children | 0 (0.0%) | 0 (0.0%) |
| Total | 906 (99.5%) | 5 (0.5%) |
Income Below Poverty Among Single-Parent Households in Rosedale
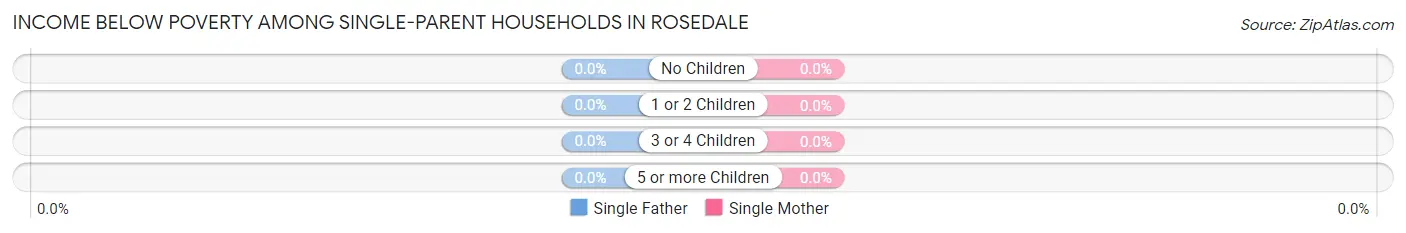
| Children | Single Father | Single Mother |
| No Children | 0 (0.0%) | 0 (0.0%) |
| 1 or 2 Children | 0 (0.0%) | 0 (0.0%) |
| 3 or 4 Children | 0 (0.0%) | 0 (0.0%) |
| 5 or more Children | 0 (0.0%) | 0 (0.0%) |
| Total | 0 (0.0%) | 0 (0.0%) |
Income Below Poverty Among Married-Couple vs Single-Parent Households in Rosedale
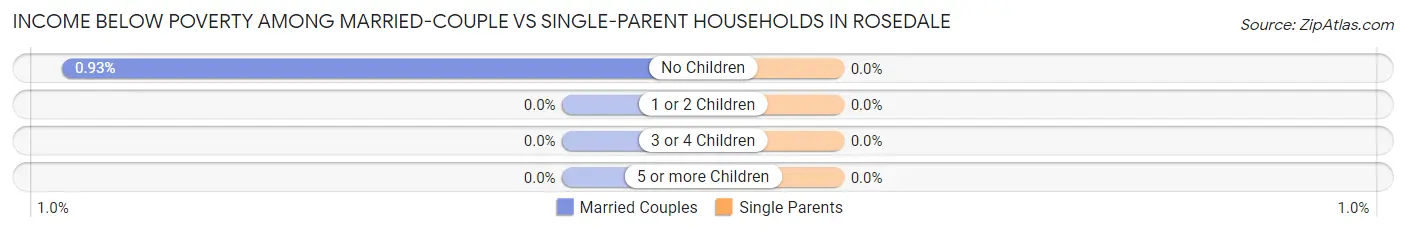
| Children | Married-Couple Families | Single-Parent Households |
| No Children | 5 (0.9%) | 0 (0.0%) |
| 1 or 2 Children | 0 (0.0%) | 0 (0.0%) |
| 3 or 4 Children | 0 (0.0%) | 0 (0.0%) |
| 5 or more Children | 0 (0.0%) | 0 (0.0%) |
| Total | 5 (0.5%) | 0 (0.0%) |
Employment Characteristics in Rosedale
Employment by Class of Employer in Rosedale
Among the 1,555 employed individuals in Rosedale, private company employees (927 | 59.6%), not-for-profit organizations (171 | 11.0%), and self-employed (incorporated) (153 | 9.8%) make up the most common classes of employment.
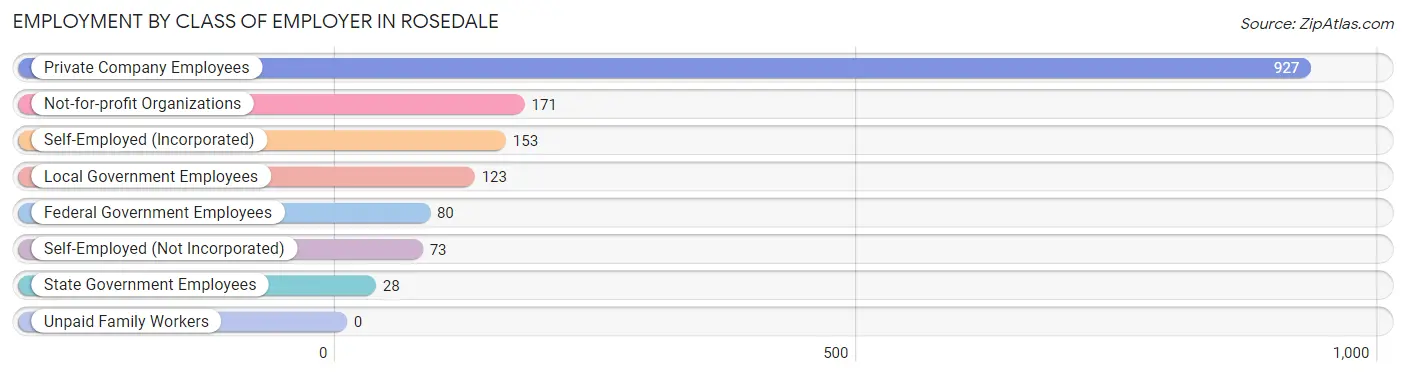
| Employer Class | # Employees | % Employees |
| Private Company Employees | 927 | 59.6% |
| Self-Employed (Incorporated) | 153 | 9.8% |
| Self-Employed (Not Incorporated) | 73 | 4.7% |
| Not-for-profit Organizations | 171 | 11.0% |
| Local Government Employees | 123 | 7.9% |
| State Government Employees | 28 | 1.8% |
| Federal Government Employees | 80 | 5.1% |
| Unpaid Family Workers | 0 | 0.0% |
| Total | 1,555 | 100.0% |
Employment Status by Age in Rosedale
According to the labor force statistics for Rosedale, out of the total population over 16 years of age (3,661), 47.3% or 1,732 individuals are in the labor force, with 7.9% or 137 of them unemployed. The age group with the highest labor force participation rate is 55 to 59 years, with 82.0% or 169 individuals in the labor force. Within the labor force, the 25 to 29 years age range has the highest percentage of unemployed individuals, with 51.6% or 63 of them being unemployed.
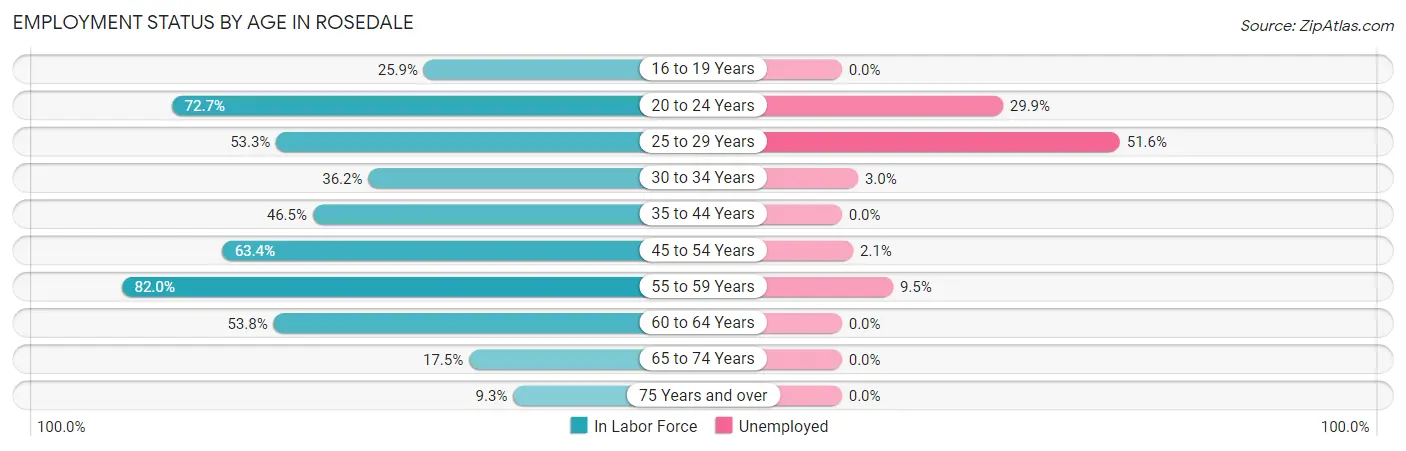
| Age Bracket | In Labor Force | Unemployed |
| 16 to 19 Years | 50 (25.9%) | 0 (0.0%) |
| 20 to 24 Years | 144 (72.7%) | 43 (29.9%) |
| 25 to 29 Years | 122 (53.3%) | 63 (51.6%) |
| 30 to 34 Years | 132 (36.2%) | 4 (3.0%) |
| 35 to 44 Years | 260 (46.5%) | 0 (0.0%) |
| 45 to 54 Years | 519 (63.4%) | 11 (2.1%) |
| 55 to 59 Years | 169 (82.0%) | 16 (9.5%) |
| 60 to 64 Years | 247 (53.8%) | 0 (0.0%) |
| 65 to 74 Years | 64 (17.5%) | 0 (0.0%) |
| 75 Years and over | 25 (9.3%) | 0 (0.0%) |
| Total | 1,732 (47.3%) | 137 (7.9%) |
Employment Status by Educational Attainment in Rosedale
According to labor force statistics for Rosedale, 54.9% of individuals (1,448) out of the total population between 25 and 64 years of age (2,637) are in the labor force, with 6.5% or 94 of them being unemployed. The group with the highest labor force participation rate are those with the educational attainment of bachelor's degree or higher, with 77.0% or 772 individuals in the labor force. Within the labor force, individuals with bachelor's degree or higher education have the highest percentage of unemployment, with 8.9% or 69 of them being unemployed.
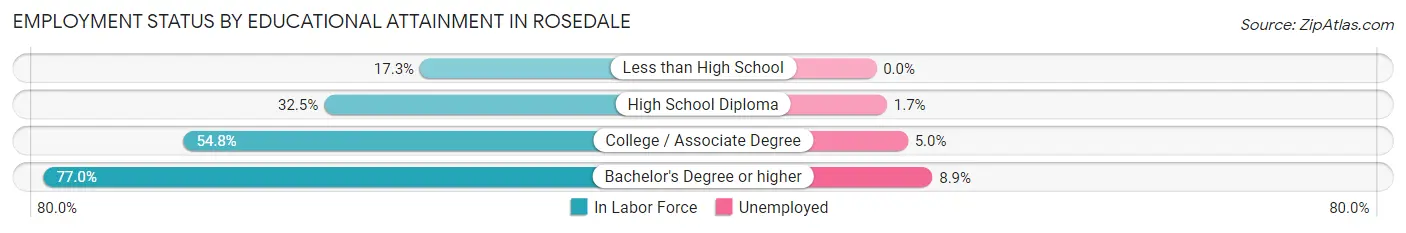
| Educational Attainment | In Labor Force | Unemployed |
| Less than High School | 28 (17.3%) | 0 (0.0%) |
| High School Diploma | 230 (32.5%) | 12 (1.7%) |
| College / Associate Degree | 419 (54.8%) | 38 (5.0%) |
| Bachelor's Degree or higher | 772 (77.0%) | 89 (8.9%) |
| Total | 1,448 (54.9%) | 171 (6.5%) |
Employment Occupations by Sex in Rosedale
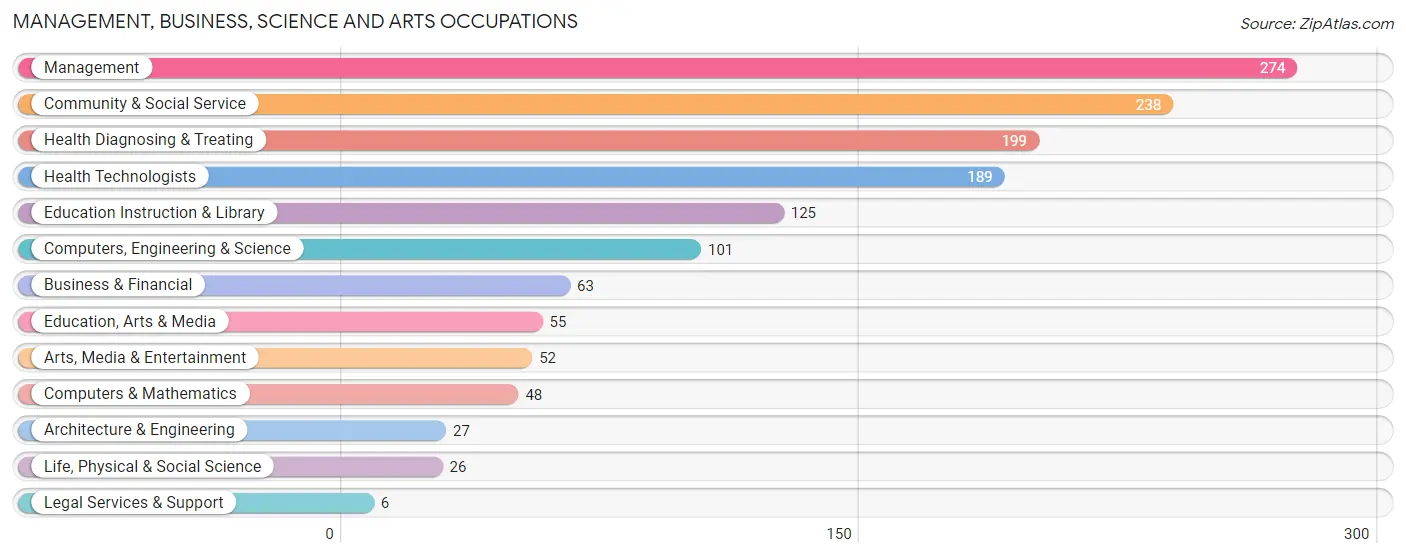
Management, Business, Science and Arts Occupations
The most common Management, Business, Science and Arts occupations in Rosedale are Management (274 | 17.2%), Community & Social Service (238 | 14.9%), Health Diagnosing & Treating (199 | 12.5%), Health Technologists (189 | 11.8%), and Education Instruction & Library (125 | 7.8%).
Management, Business, Science and Arts Occupations by Sex
Within the Management, Business, Science and Arts occupations in Rosedale, the most male-oriented occupations are Architecture & Engineering (100.0%), Business & Financial (77.8%), and Computers & Mathematics (77.1%), while the most female-oriented occupations are Life, Physical & Social Science (100.0%), Legal Services & Support (100.0%), and Arts, Media & Entertainment (86.5%).
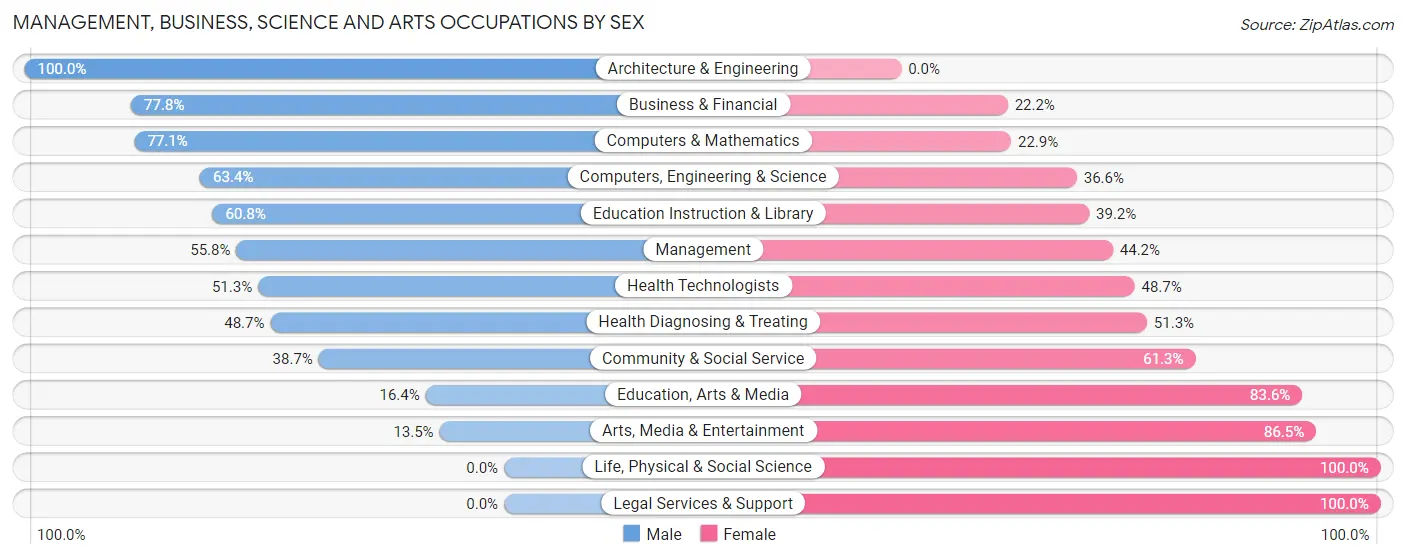
| Occupation | Male | Female |
| Management | 153 (55.8%) | 121 (44.2%) |
| Business & Financial | 49 (77.8%) | 14 (22.2%) |
| Computers, Engineering & Science | 64 (63.4%) | 37 (36.6%) |
| Computers & Mathematics | 37 (77.1%) | 11 (22.9%) |
| Architecture & Engineering | 27 (100.0%) | 0 (0.0%) |
| Life, Physical & Social Science | 0 (0.0%) | 26 (100.0%) |
| Community & Social Service | 92 (38.7%) | 146 (61.3%) |
| Education, Arts & Media | 9 (16.4%) | 46 (83.6%) |
| Legal Services & Support | 0 (0.0%) | 6 (100.0%) |
| Education Instruction & Library | 76 (60.8%) | 49 (39.2%) |
| Arts, Media & Entertainment | 7 (13.5%) | 45 (86.5%) |
| Health Diagnosing & Treating | 97 (48.7%) | 102 (51.3%) |
| Health Technologists | 97 (51.3%) | 92 (48.7%) |
| Total (Category) | 455 (52.0%) | 420 (48.0%) |
| Total (Overall) | 934 (58.6%) | 661 (41.4%) |
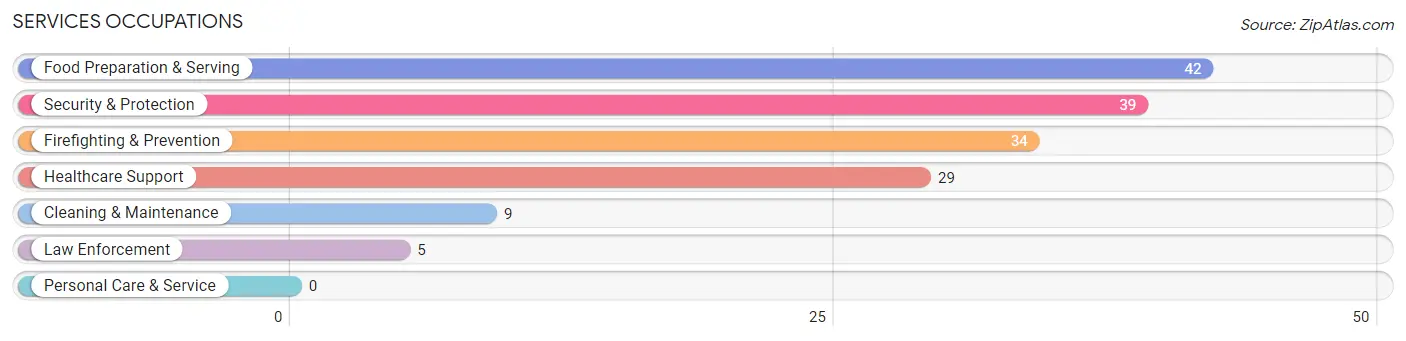
Services Occupations
The most common Services occupations in Rosedale are Food Preparation & Serving (42 | 2.6%), Security & Protection (39 | 2.5%), Firefighting & Prevention (34 | 2.1%), Healthcare Support (29 | 1.8%), and Cleaning & Maintenance (9 | 0.6%).
Services Occupations by Sex
Within the Services occupations in Rosedale, the most male-oriented occupations are Security & Protection (100.0%), Firefighting & Prevention (100.0%), and Law Enforcement (100.0%), while the most female-oriented occupations are Healthcare Support (100.0%), and Food Preparation & Serving (19.1%).
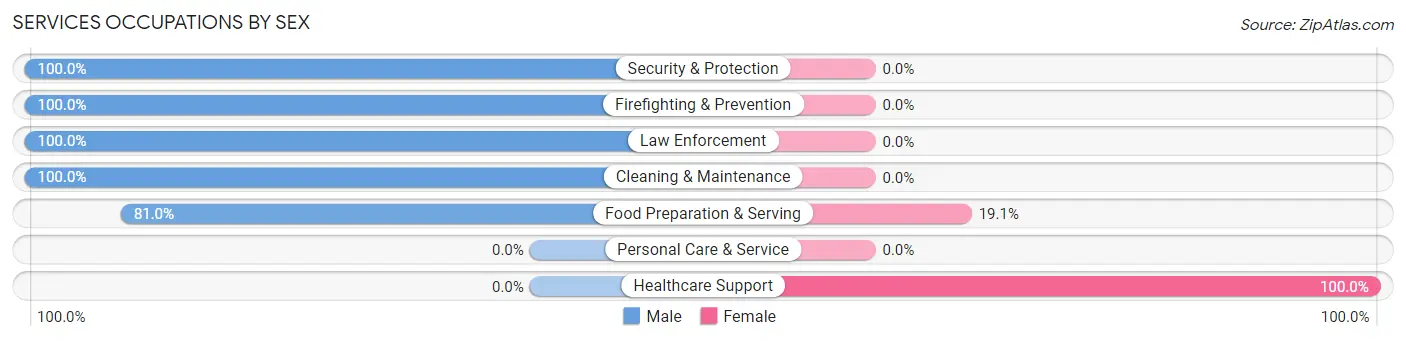
| Occupation | Male | Female |
| Healthcare Support | 0 (0.0%) | 29 (100.0%) |
| Security & Protection | 39 (100.0%) | 0 (0.0%) |
| Firefighting & Prevention | 34 (100.0%) | 0 (0.0%) |
| Law Enforcement | 5 (100.0%) | 0 (0.0%) |
| Food Preparation & Serving | 34 (80.9%) | 8 (19.1%) |
| Cleaning & Maintenance | 9 (100.0%) | 0 (0.0%) |
| Personal Care & Service | 0 (0.0%) | 0 (0.0%) |
| Total (Category) | 82 (68.9%) | 37 (31.1%) |
| Total (Overall) | 934 (58.6%) | 661 (41.4%) |
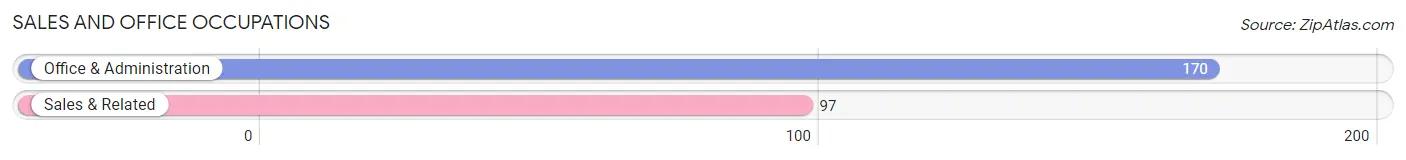
Sales and Office Occupations
The most common Sales and Office occupations in Rosedale are Office & Administration (170 | 10.7%), and Sales & Related (97 | 6.1%).
Sales and Office Occupations by Sex
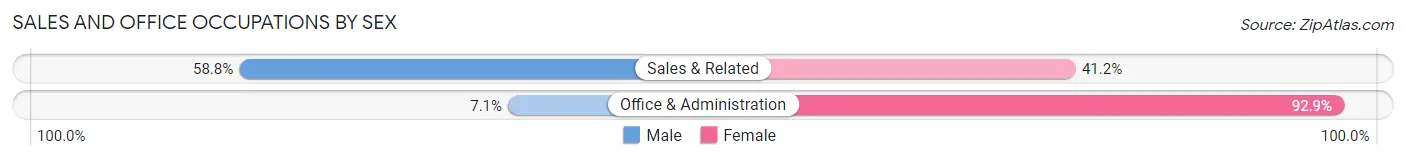
| Occupation | Male | Female |
| Sales & Related | 57 (58.8%) | 40 (41.2%) |
| Office & Administration | 12 (7.1%) | 158 (92.9%) |
| Total (Category) | 69 (25.8%) | 198 (74.2%) |
| Total (Overall) | 934 (58.6%) | 661 (41.4%) |
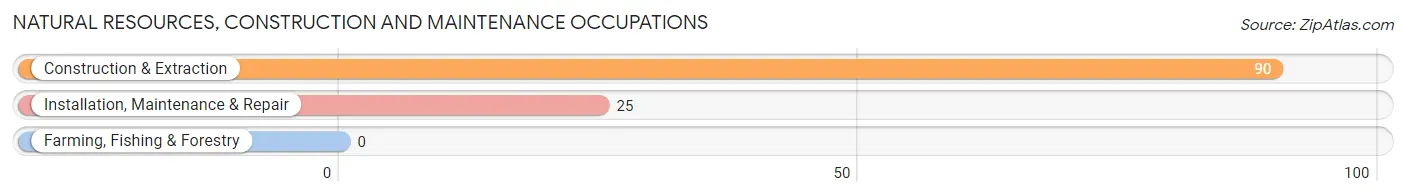
Natural Resources, Construction and Maintenance Occupations
The most common Natural Resources, Construction and Maintenance occupations in Rosedale are Construction & Extraction (90 | 5.6%), and Installation, Maintenance & Repair (25 | 1.6%).
Natural Resources, Construction and Maintenance Occupations by Sex
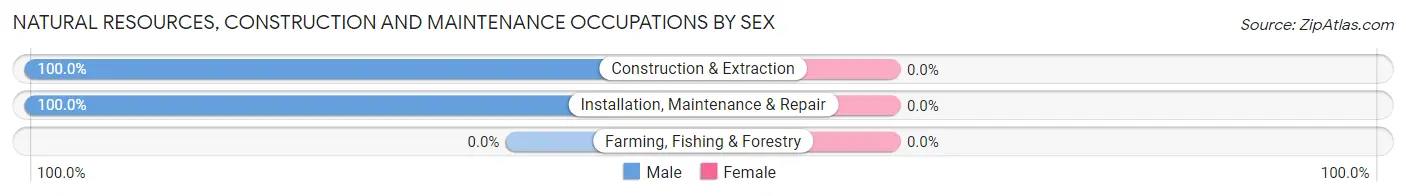
| Occupation | Male | Female |
| Farming, Fishing & Forestry | 0 (0.0%) | 0 (0.0%) |
| Construction & Extraction | 90 (100.0%) | 0 (0.0%) |
| Installation, Maintenance & Repair | 25 (100.0%) | 0 (0.0%) |
| Total (Category) | 115 (100.0%) | 0 (0.0%) |
| Total (Overall) | 934 (58.6%) | 661 (41.4%) |
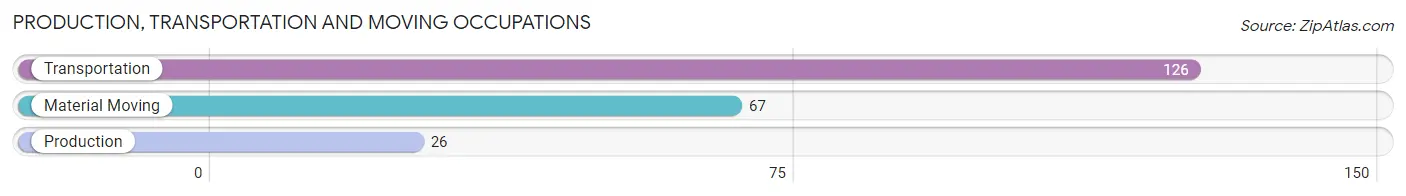
Production, Transportation and Moving Occupations
The most common Production, Transportation and Moving occupations in Rosedale are Transportation (126 | 7.9%), Material Moving (67 | 4.2%), and Production (26 | 1.6%).
Production, Transportation and Moving Occupations by Sex
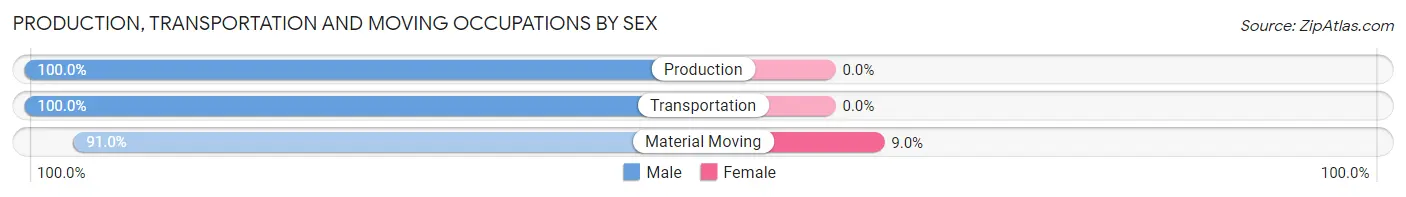
| Occupation | Male | Female |
| Production | 26 (100.0%) | 0 (0.0%) |
| Transportation | 126 (100.0%) | 0 (0.0%) |
| Material Moving | 61 (91.0%) | 6 (9.0%) |
| Total (Category) | 213 (97.3%) | 6 (2.7%) |
| Total (Overall) | 934 (58.6%) | 661 (41.4%) |
Employment Industries by Sex in Rosedale
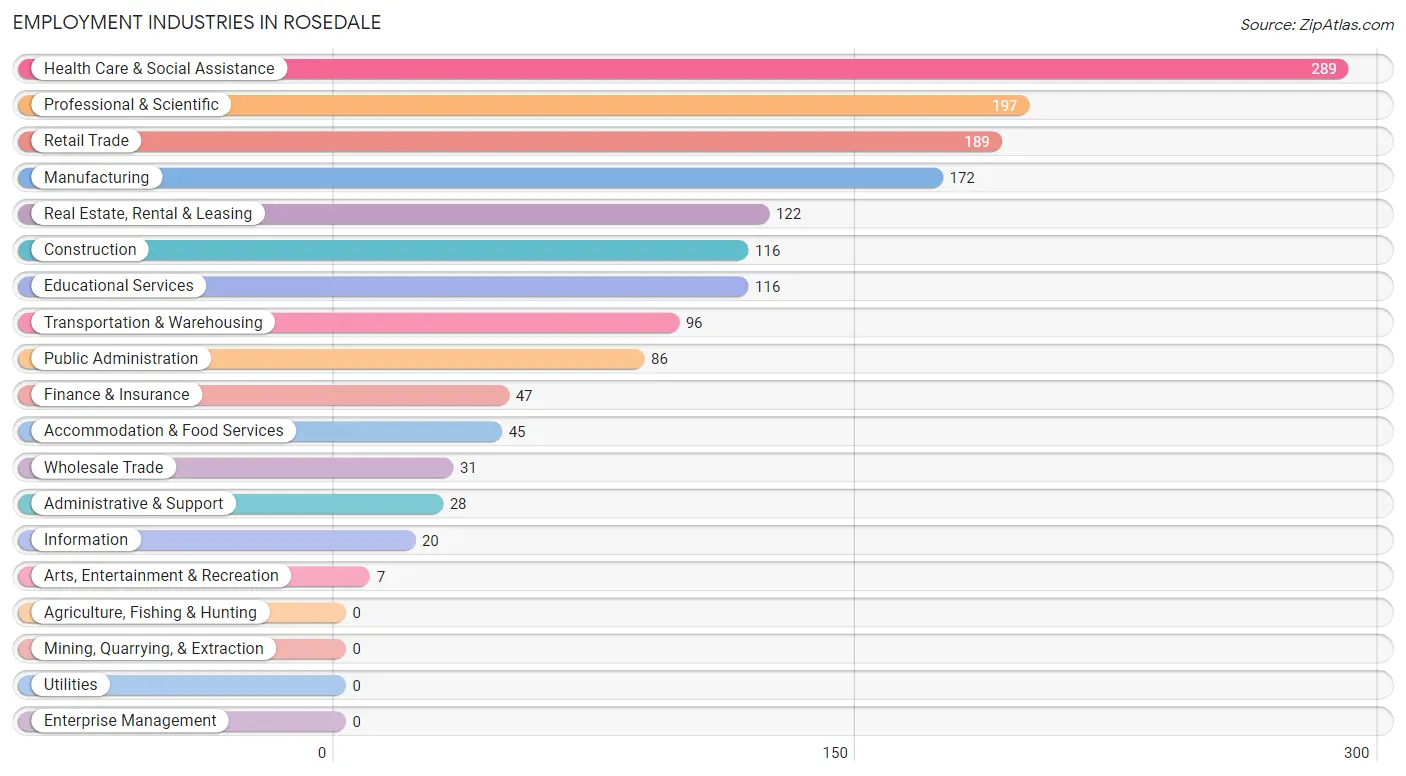
Employment Industries in Rosedale
The major employment industries in Rosedale include Health Care & Social Assistance (289 | 18.1%), Professional & Scientific (197 | 12.3%), Retail Trade (189 | 11.8%), Manufacturing (172 | 10.8%), and Real Estate, Rental & Leasing (122 | 7.6%).
Employment Industries by Sex in Rosedale
The Rosedale industries that see more men than women are Construction (100.0%), Transportation & Warehousing (100.0%), and Administrative & Support (100.0%), whereas the industries that tend to have a higher number of women are Finance & Insurance (80.8%), Educational Services (78.4%), and Health Care & Social Assistance (74.7%).
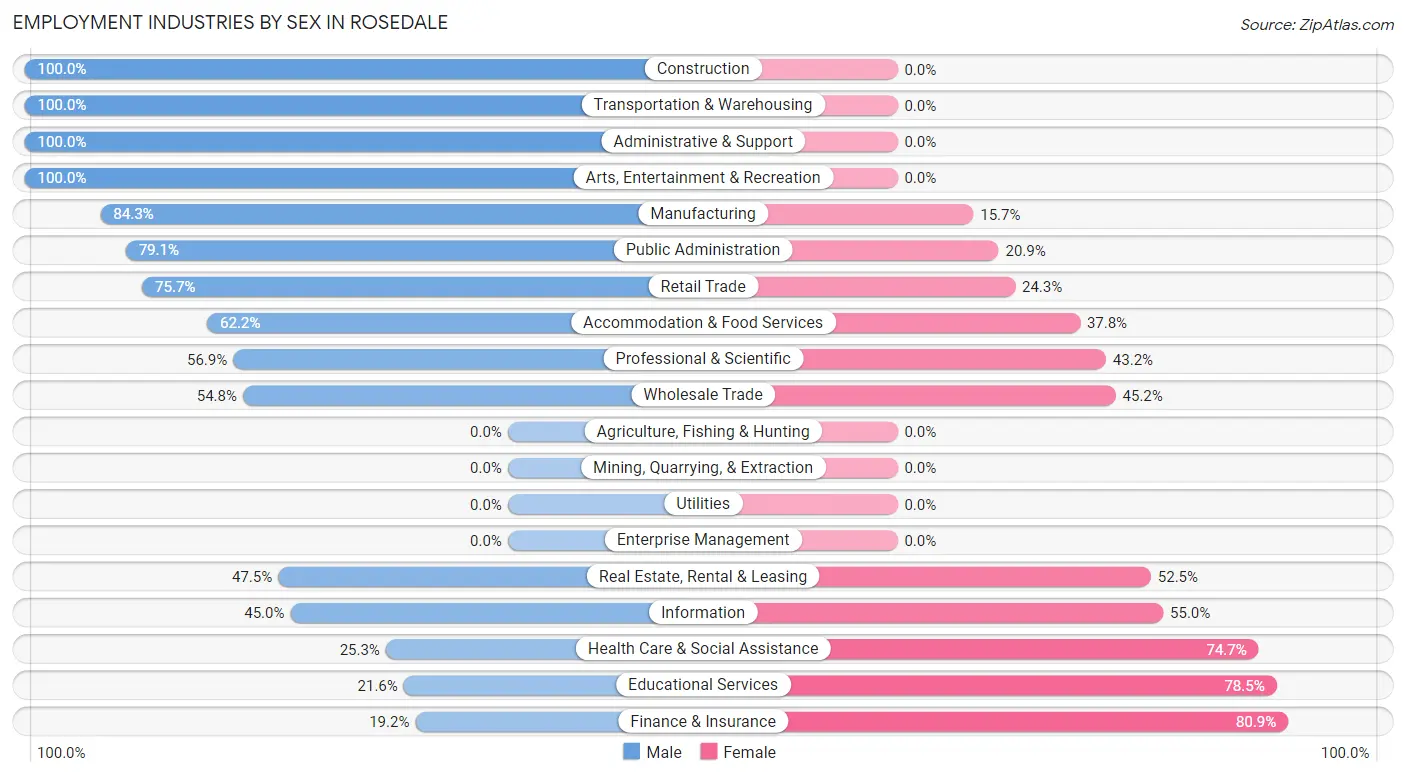
| Industry | Male | Female |
| Agriculture, Fishing & Hunting | 0 (0.0%) | 0 (0.0%) |
| Mining, Quarrying, & Extraction | 0 (0.0%) | 0 (0.0%) |
| Construction | 116 (100.0%) | 0 (0.0%) |
| Manufacturing | 145 (84.3%) | 27 (15.7%) |
| Wholesale Trade | 17 (54.8%) | 14 (45.2%) |
| Retail Trade | 143 (75.7%) | 46 (24.3%) |
| Transportation & Warehousing | 96 (100.0%) | 0 (0.0%) |
| Utilities | 0 (0.0%) | 0 (0.0%) |
| Information | 9 (45.0%) | 11 (55.0%) |
| Finance & Insurance | 9 (19.2%) | 38 (80.8%) |
| Real Estate, Rental & Leasing | 58 (47.5%) | 64 (52.5%) |
| Professional & Scientific | 112 (56.9%) | 85 (43.1%) |
| Enterprise Management | 0 (0.0%) | 0 (0.0%) |
| Administrative & Support | 28 (100.0%) | 0 (0.0%) |
| Educational Services | 25 (21.5%) | 91 (78.4%) |
| Health Care & Social Assistance | 73 (25.3%) | 216 (74.7%) |
| Arts, Entertainment & Recreation | 7 (100.0%) | 0 (0.0%) |
| Accommodation & Food Services | 28 (62.2%) | 17 (37.8%) |
| Public Administration | 68 (79.1%) | 18 (20.9%) |
| Total | 934 (58.6%) | 661 (41.4%) |
Education in Rosedale
School Enrollment in Rosedale
The most common levels of schooling among the 1,116 students in Rosedale are high school (364 | 32.6%), college / undergraduate (226 | 20.3%), and middle school (212 | 19.0%).
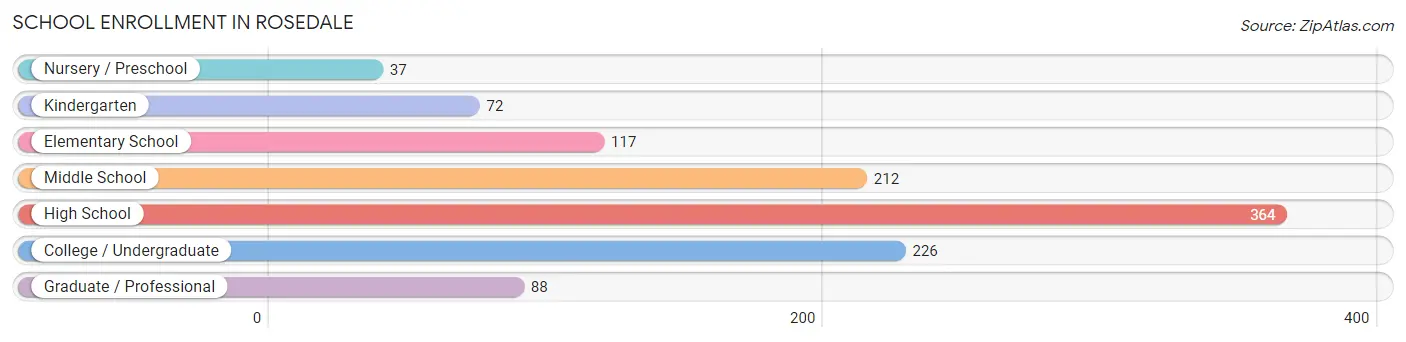
| School Level | # Students | % Students |
| Nursery / Preschool | 37 | 3.3% |
| Kindergarten | 72 | 6.5% |
| Elementary School | 117 | 10.5% |
| Middle School | 212 | 19.0% |
| High School | 364 | 32.6% |
| College / Undergraduate | 226 | 20.3% |
| Graduate / Professional | 88 | 7.9% |
| Total | 1,116 | 100.0% |
School Enrollment by Age by Funding Source in Rosedale
Out of a total of 1,116 students who are enrolled in schools in Rosedale, 213 (19.1%) attend a private institution, while the remaining 903 (80.9%) are enrolled in public schools. The age group of 3 to 4 year olds has the highest likelihood of being enrolled in private schools, with 29 (78.4% in the age bracket) enrolled. Conversely, the age group of 18 to 19 year olds has the lowest likelihood of being enrolled in a private school, with 73 (100.0% in the age bracket) attending a public institution.
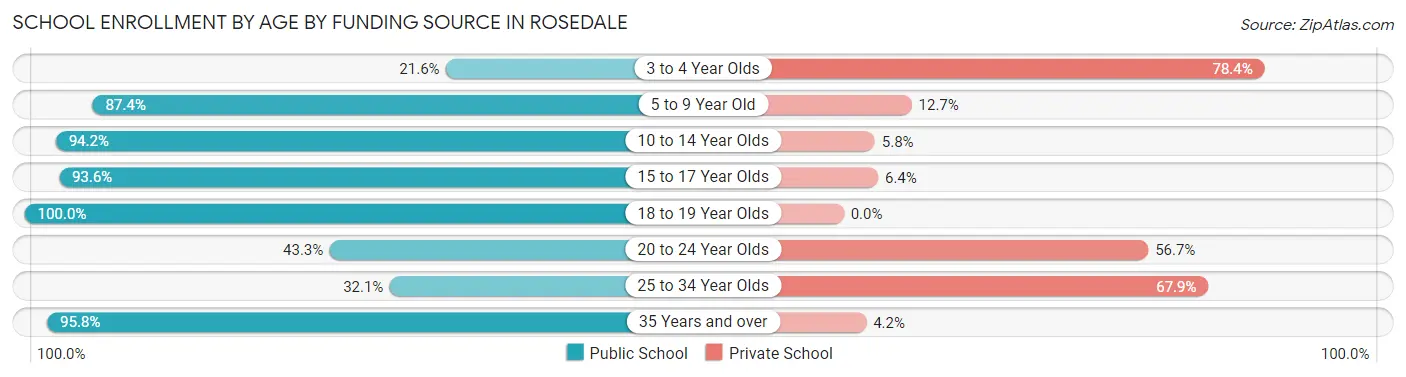
| Age Bracket | Public School | Private School |
| 3 to 4 Year Olds | 8 (21.6%) | 29 (78.4%) |
| 5 to 9 Year Old | 145 (87.4%) | 21 (12.7%) |
| 10 to 14 Year Olds | 260 (94.2%) | 16 (5.8%) |
| 15 to 17 Year Olds | 117 (93.6%) | 8 (6.4%) |
| 18 to 19 Year Olds | 73 (100.0%) | 0 (0.0%) |
| 20 to 24 Year Olds | 29 (43.3%) | 38 (56.7%) |
| 25 to 34 Year Olds | 43 (32.1%) | 91 (67.9%) |
| 35 Years and over | 228 (95.8%) | 10 (4.2%) |
| Total | 903 (80.9%) | 213 (19.1%) |
Educational Attainment by Field of Study in Rosedale
Business (252 | 17.2%), science & technology (175 | 11.9%), social sciences (169 | 11.5%), education (128 | 8.7%), and arts & humanities (121 | 8.3%) are the most common fields of study among 1,464 individuals in Rosedale who have obtained a bachelor's degree or higher.
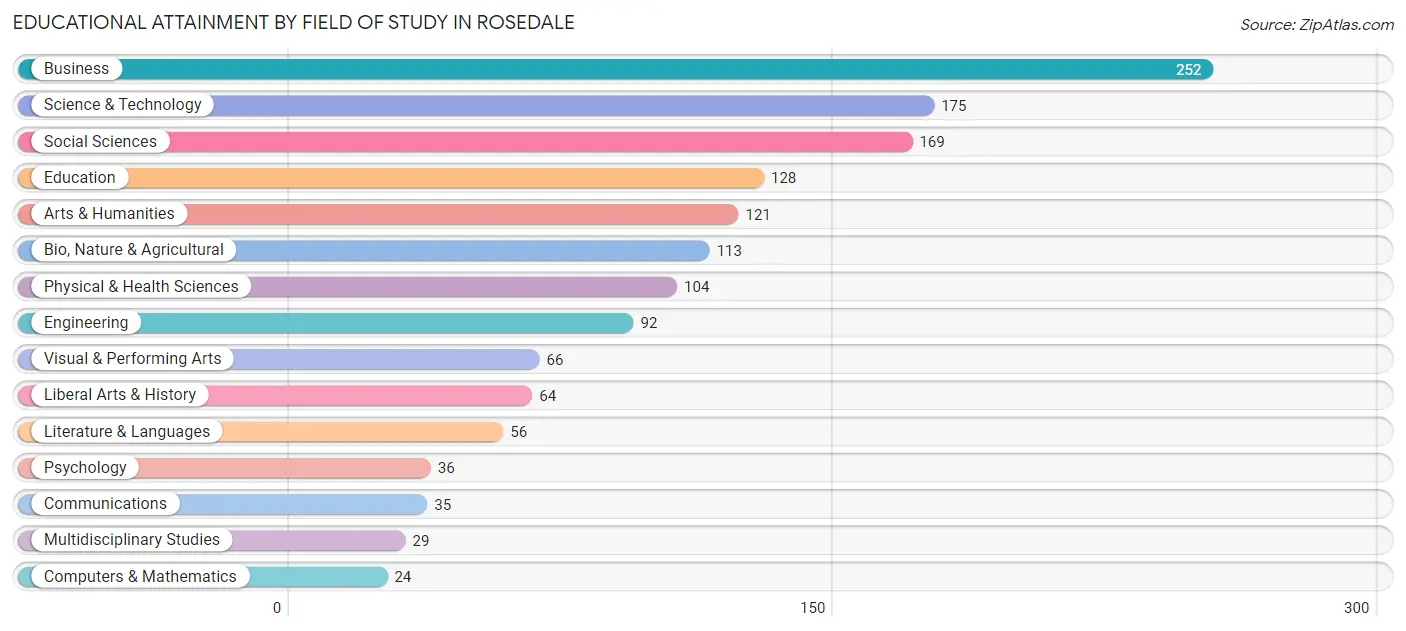
| Field of Study | # Graduates | % Graduates |
| Computers & Mathematics | 24 | 1.6% |
| Bio, Nature & Agricultural | 113 | 7.7% |
| Physical & Health Sciences | 104 | 7.1% |
| Psychology | 36 | 2.5% |
| Social Sciences | 169 | 11.5% |
| Engineering | 92 | 6.3% |
| Multidisciplinary Studies | 29 | 2.0% |
| Science & Technology | 175 | 11.9% |
| Business | 252 | 17.2% |
| Education | 128 | 8.7% |
| Literature & Languages | 56 | 3.8% |
| Liberal Arts & History | 64 | 4.4% |
| Visual & Performing Arts | 66 | 4.5% |
| Communications | 35 | 2.4% |
| Arts & Humanities | 121 | 8.3% |
| Total | 1,464 | 100.0% |
Transportation & Commute in Rosedale
Vehicle Availability by Sex in Rosedale
The most prevalent vehicle ownership categories in Rosedale are males with 2 vehicles (289, accounting for 31.3%) and females with 2 vehicles (237, making up 45.8%).
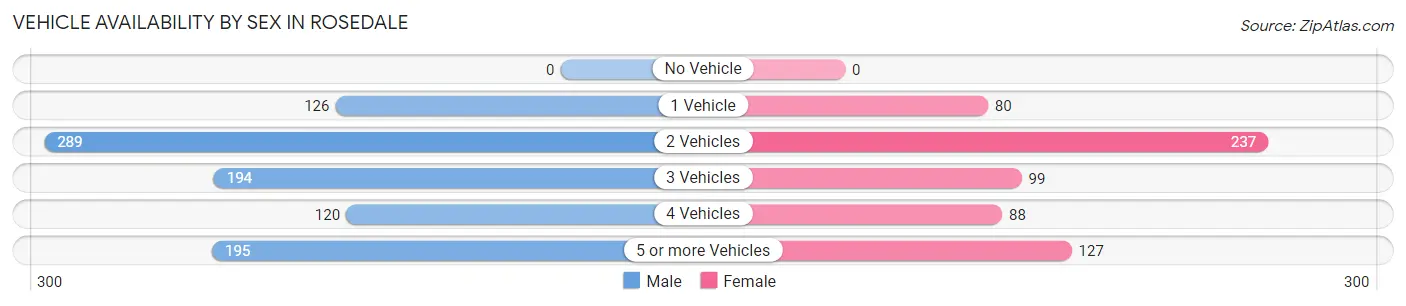
| Vehicles Available | Male | Female |
| No Vehicle | 0 (0.0%) | 0 (0.0%) |
| 1 Vehicle | 126 (13.6%) | 80 (12.7%) |
| 2 Vehicles | 289 (31.3%) | 237 (37.6%) |
| 3 Vehicles | 194 (21.0%) | 99 (15.7%) |
| 4 Vehicles | 120 (13.0%) | 88 (14.0%) |
| 5 or more Vehicles | 195 (21.1%) | 127 (20.1%) |
| Total | 924 (100.0%) | 631 (100.0%) |
Commute Time in Rosedale
The most frequently occuring commute durations in Rosedale are 20 to 24 minutes (220 commuters, 17.2%), 30 to 34 minutes (186 commuters, 14.6%), and 10 to 14 minutes (152 commuters, 11.9%).
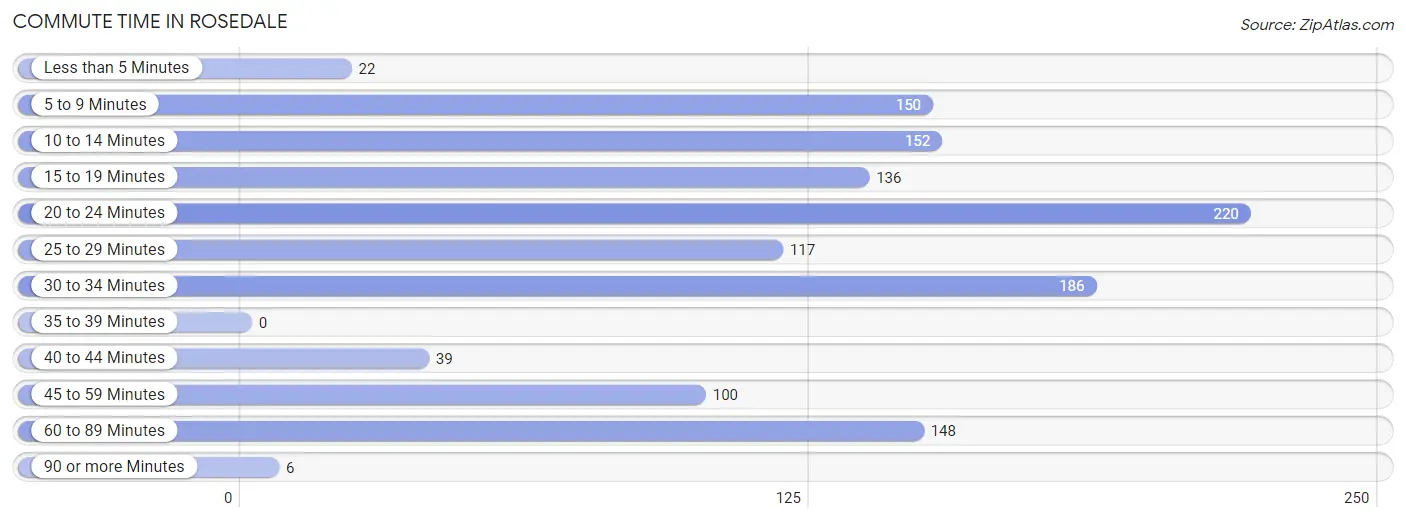
| Commute Time | # Commuters | % Commuters |
| Less than 5 Minutes | 22 | 1.7% |
| 5 to 9 Minutes | 150 | 11.8% |
| 10 to 14 Minutes | 152 | 11.9% |
| 15 to 19 Minutes | 136 | 10.7% |
| 20 to 24 Minutes | 220 | 17.2% |
| 25 to 29 Minutes | 117 | 9.2% |
| 30 to 34 Minutes | 186 | 14.6% |
| 35 to 39 Minutes | 0 | 0.0% |
| 40 to 44 Minutes | 39 | 3.1% |
| 45 to 59 Minutes | 100 | 7.8% |
| 60 to 89 Minutes | 148 | 11.6% |
| 90 or more Minutes | 6 | 0.5% |
Commute Time by Sex in Rosedale
The most common commute times in Rosedale are 30 to 34 minutes (163 commuters, 21.0%) for males and 20 to 24 minutes (130 commuters, 26.1%) for females.
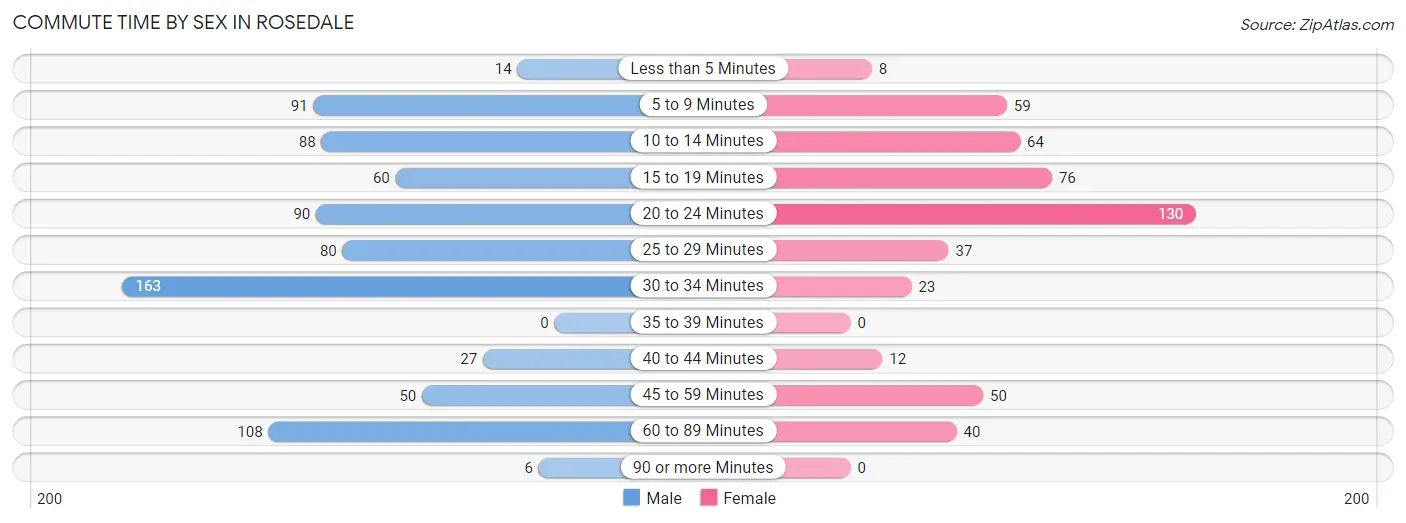
| Commute Time | Male | Female |
| Less than 5 Minutes | 14 (1.8%) | 8 (1.6%) |
| 5 to 9 Minutes | 91 (11.7%) | 59 (11.8%) |
| 10 to 14 Minutes | 88 (11.3%) | 64 (12.8%) |
| 15 to 19 Minutes | 60 (7.7%) | 76 (15.2%) |
| 20 to 24 Minutes | 90 (11.6%) | 130 (26.1%) |
| 25 to 29 Minutes | 80 (10.3%) | 37 (7.4%) |
| 30 to 34 Minutes | 163 (21.0%) | 23 (4.6%) |
| 35 to 39 Minutes | 0 (0.0%) | 0 (0.0%) |
| 40 to 44 Minutes | 27 (3.5%) | 12 (2.4%) |
| 45 to 59 Minutes | 50 (6.4%) | 50 (10.0%) |
| 60 to 89 Minutes | 108 (13.9%) | 40 (8.0%) |
| 90 or more Minutes | 6 (0.8%) | 0 (0.0%) |
Time of Departure to Work by Sex in Rosedale
The most frequent times of departure to work in Rosedale are 8:00 AM to 8:29 AM (148, 19.1%) for males and 7:30 AM to 7:59 AM (112, 22.4%) for females.
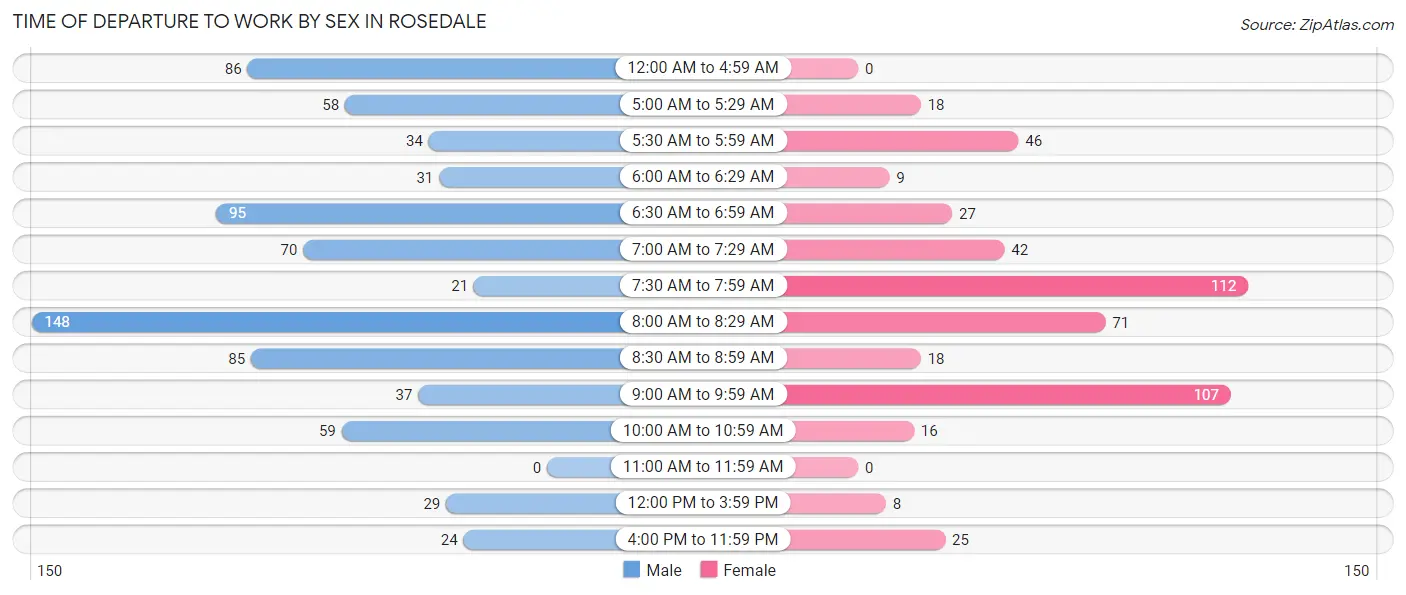
| Time of Departure | Male | Female |
| 12:00 AM to 4:59 AM | 86 (11.1%) | 0 (0.0%) |
| 5:00 AM to 5:29 AM | 58 (7.5%) | 18 (3.6%) |
| 5:30 AM to 5:59 AM | 34 (4.4%) | 46 (9.2%) |
| 6:00 AM to 6:29 AM | 31 (4.0%) | 9 (1.8%) |
| 6:30 AM to 6:59 AM | 95 (12.2%) | 27 (5.4%) |
| 7:00 AM to 7:29 AM | 70 (9.0%) | 42 (8.4%) |
| 7:30 AM to 7:59 AM | 21 (2.7%) | 112 (22.4%) |
| 8:00 AM to 8:29 AM | 148 (19.1%) | 71 (14.2%) |
| 8:30 AM to 8:59 AM | 85 (10.9%) | 18 (3.6%) |
| 9:00 AM to 9:59 AM | 37 (4.8%) | 107 (21.4%) |
| 10:00 AM to 10:59 AM | 59 (7.6%) | 16 (3.2%) |
| 11:00 AM to 11:59 AM | 0 (0.0%) | 0 (0.0%) |
| 12:00 PM to 3:59 PM | 29 (3.7%) | 8 (1.6%) |
| 4:00 PM to 11:59 PM | 24 (3.1%) | 25 (5.0%) |
| Total | 777 (100.0%) | 499 (100.0%) |
Housing Occupancy in Rosedale
Occupancy by Ownership in Rosedale
Of the total 1,260 dwellings in Rosedale, owner-occupied units account for 1,089 (86.4%), while renter-occupied units make up 171 (13.6%).
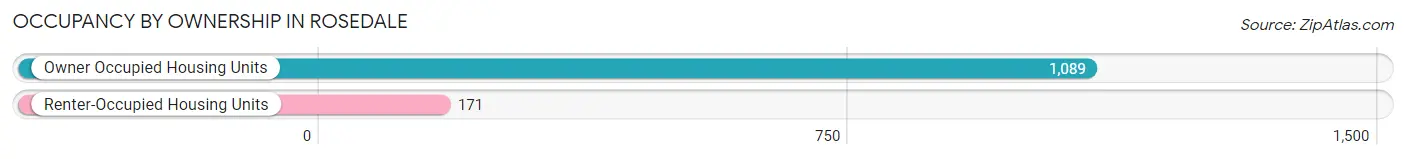
| Occupancy | # Housing Units | % Housing Units |
| Owner Occupied Housing Units | 1,089 | 86.4% |
| Renter-Occupied Housing Units | 171 | 13.6% |
| Total Occupied Housing Units | 1,260 | 100.0% |
Occupancy by Household Size in Rosedale
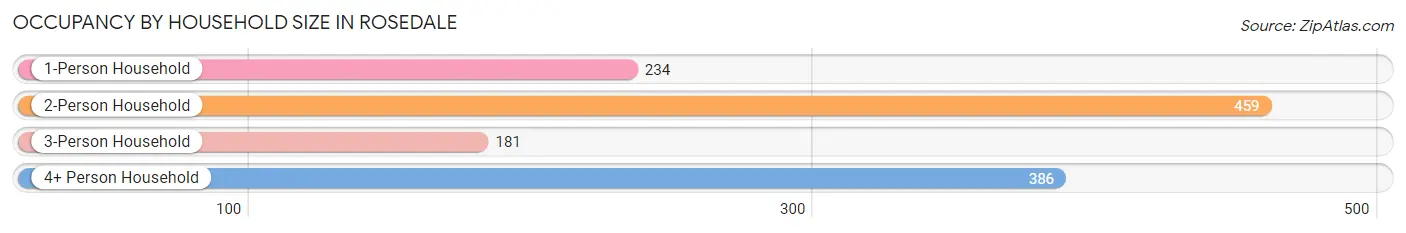
| Household Size | # Housing Units | % Housing Units |
| 1-Person Household | 234 | 18.6% |
| 2-Person Household | 459 | 36.4% |
| 3-Person Household | 181 | 14.4% |
| 4+ Person Household | 386 | 30.6% |
| Total Housing Units | 1,260 | 100.0% |
Occupancy by Ownership by Household Size in Rosedale
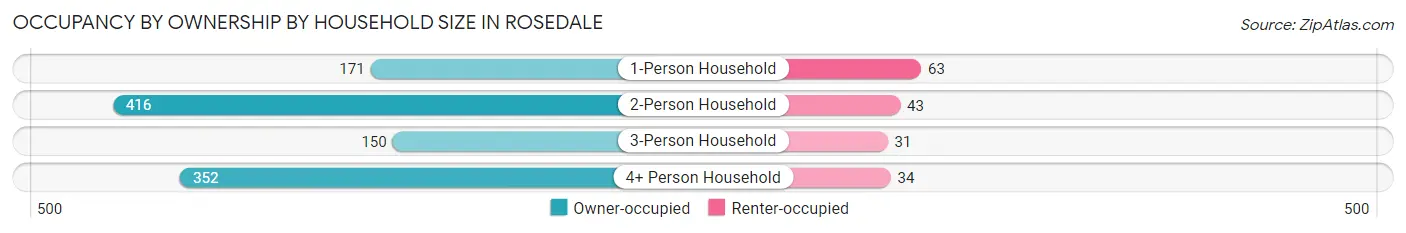
| Household Size | Owner-occupied | Renter-occupied |
| 1-Person Household | 171 (73.1%) | 63 (26.9%) |
| 2-Person Household | 416 (90.6%) | 43 (9.4%) |
| 3-Person Household | 150 (82.9%) | 31 (17.1%) |
| 4+ Person Household | 352 (91.2%) | 34 (8.8%) |
| Total Housing Units | 1,089 (86.4%) | 171 (13.6%) |
Occupancy by Educational Attainment in Rosedale
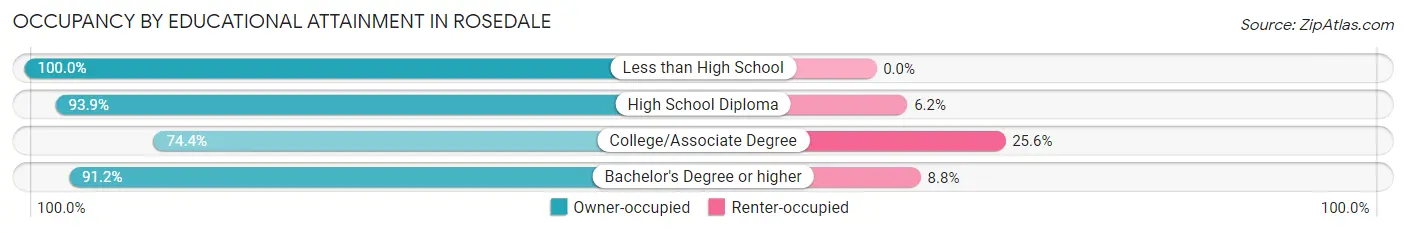
| Household Size | Owner-occupied | Renter-occupied |
| Less than High School | 10 (100.0%) | 0 (0.0%) |
| High School Diploma | 122 (93.9%) | 8 (6.1%) |
| College/Associate Degree | 285 (74.4%) | 98 (25.6%) |
| Bachelor's Degree or higher | 672 (91.2%) | 65 (8.8%) |
Occupancy by Age of Householder in Rosedale
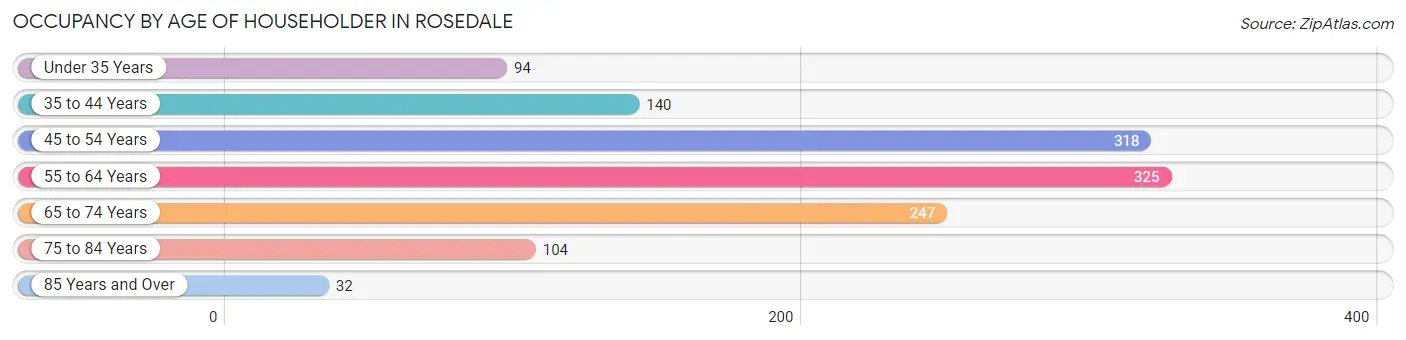
| Age Bracket | # Households | % Households |
| Under 35 Years | 94 | 7.5% |
| 35 to 44 Years | 140 | 11.1% |
| 45 to 54 Years | 318 | 25.2% |
| 55 to 64 Years | 325 | 25.8% |
| 65 to 74 Years | 247 | 19.6% |
| 75 to 84 Years | 104 | 8.3% |
| 85 Years and Over | 32 | 2.5% |
| Total | 1,260 | 100.0% |
Housing Finances in Rosedale
Median Income by Occupancy in Rosedale
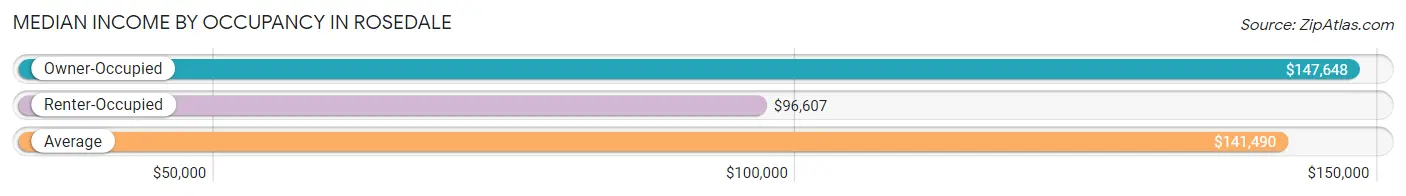
| Occupancy Type | # Households | Median Income |
| Owner-Occupied | 1,089 (86.4%) | $147,648 |
| Renter-Occupied | 171 (13.6%) | $96,607 |
| Average | 1,260 (100.0%) | $141,490 |
Occupancy by Householder Income Bracket in Rosedale
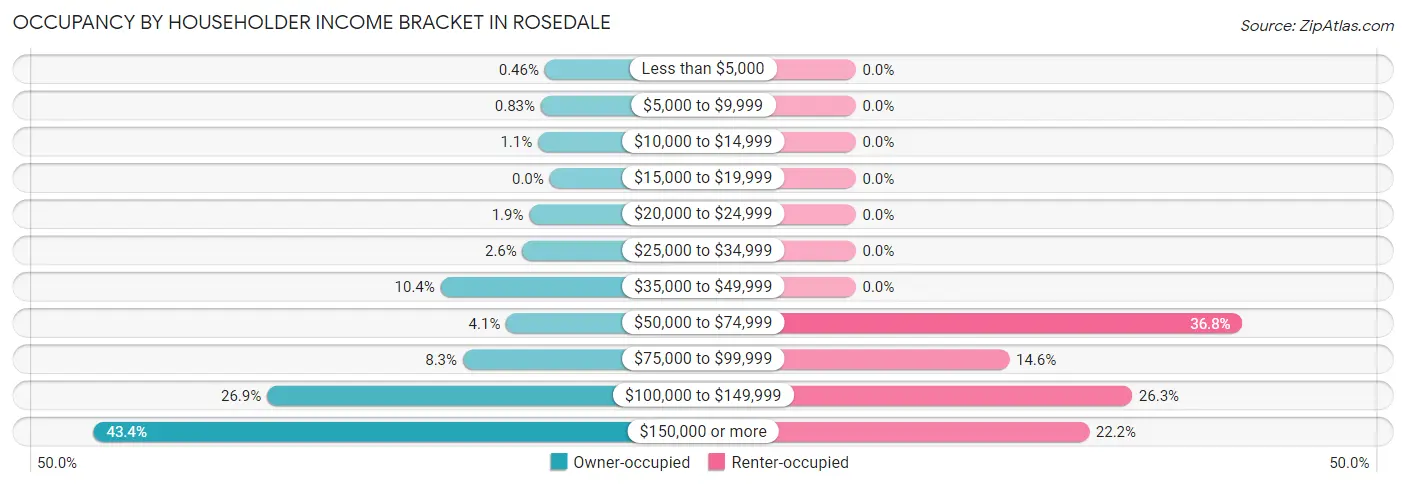
| Income Bracket | Owner-occupied | Renter-occupied |
| Less than $5,000 | 5 (0.5%) | 0 (0.0%) |
| $5,000 to $9,999 | 9 (0.8%) | 0 (0.0%) |
| $10,000 to $14,999 | 12 (1.1%) | 0 (0.0%) |
| $15,000 to $19,999 | 0 (0.0%) | 0 (0.0%) |
| $20,000 to $24,999 | 21 (1.9%) | 0 (0.0%) |
| $25,000 to $34,999 | 28 (2.6%) | 0 (0.0%) |
| $35,000 to $49,999 | 113 (10.4%) | 0 (0.0%) |
| $50,000 to $74,999 | 45 (4.1%) | 63 (36.8%) |
| $75,000 to $99,999 | 90 (8.3%) | 25 (14.6%) |
| $100,000 to $149,999 | 293 (26.9%) | 45 (26.3%) |
| $150,000 or more | 473 (43.4%) | 38 (22.2%) |
| Total | 1,089 (100.0%) | 171 (100.0%) |
Monthly Housing Cost Tiers in Rosedale

| Monthly Cost | Owner-occupied | Renter-occupied |
| Less than $300 | 20 (1.8%) | 0 (0.0%) |
| $300 to $499 | 32 (2.9%) | 0 (0.0%) |
| $500 to $799 | 54 (5.0%) | 38 (22.2%) |
| $800 to $999 | 185 (17.0%) | 24 (14.0%) |
| $1,000 to $1,499 | 197 (18.1%) | 7 (4.1%) |
| $1,500 to $1,999 | 87 (8.0%) | 11 (6.4%) |
| $2,000 to $2,499 | 112 (10.3%) | 0 (0.0%) |
| $2,500 to $2,999 | 58 (5.3%) | 31 (18.1%) |
| $3,000 or more | 344 (31.6%) | 27 (15.8%) |
| Total | 1,089 (100.0%) | 171 (100.0%) |
Physical Housing Characteristics in Rosedale
Housing Structures in Rosedale
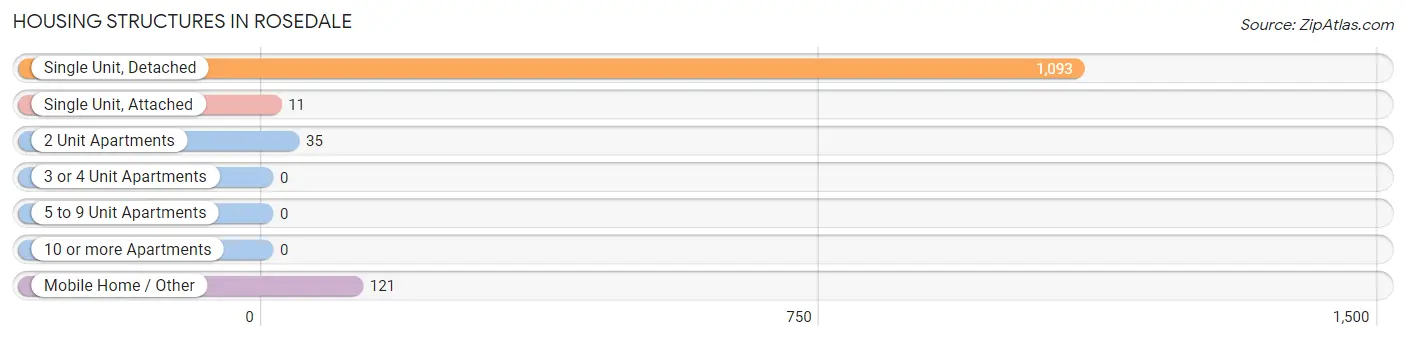
| Structure Type | # Housing Units | % Housing Units |
| Single Unit, Detached | 1,093 | 86.8% |
| Single Unit, Attached | 11 | 0.9% |
| 2 Unit Apartments | 35 | 2.8% |
| 3 or 4 Unit Apartments | 0 | 0.0% |
| 5 to 9 Unit Apartments | 0 | 0.0% |
| 10 or more Apartments | 0 | 0.0% |
| Mobile Home / Other | 121 | 9.6% |
| Total | 1,260 | 100.0% |
Housing Structures by Occupancy in Rosedale
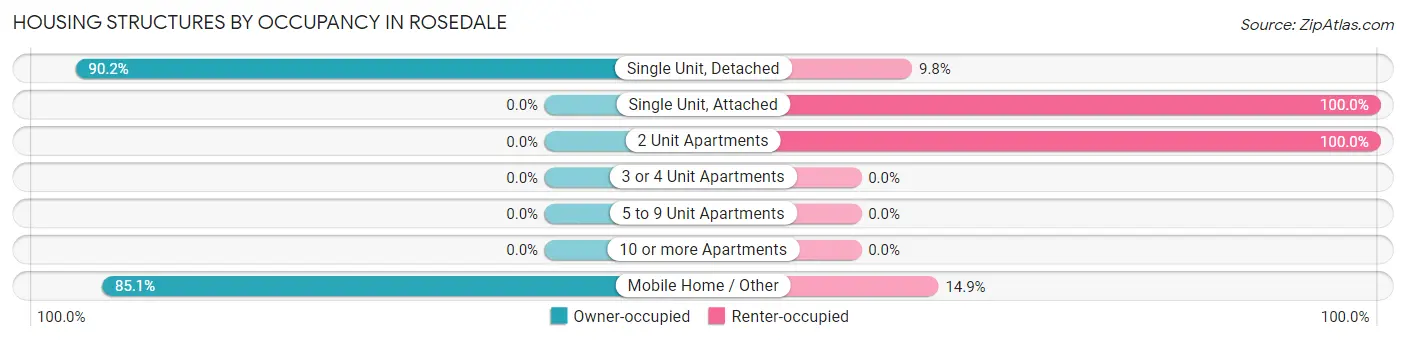
| Structure Type | Owner-occupied | Renter-occupied |
| Single Unit, Detached | 986 (90.2%) | 107 (9.8%) |
| Single Unit, Attached | 0 (0.0%) | 11 (100.0%) |
| 2 Unit Apartments | 0 (0.0%) | 35 (100.0%) |
| 3 or 4 Unit Apartments | 0 (0.0%) | 0 (0.0%) |
| 5 to 9 Unit Apartments | 0 (0.0%) | 0 (0.0%) |
| 10 or more Apartments | 0 (0.0%) | 0 (0.0%) |
| Mobile Home / Other | 103 (85.1%) | 18 (14.9%) |
| Total | 1,089 (86.4%) | 171 (13.6%) |
Housing Structures by Number of Rooms in Rosedale
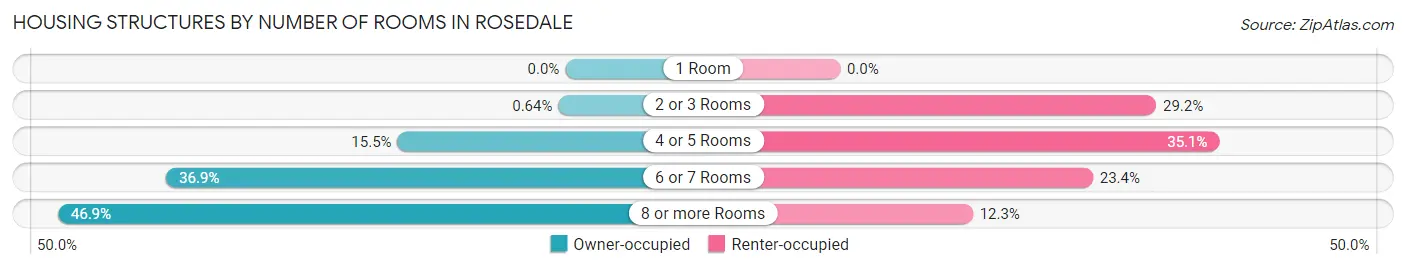
| Number of Rooms | Owner-occupied | Renter-occupied |
| 1 Room | 0 (0.0%) | 0 (0.0%) |
| 2 or 3 Rooms | 7 (0.6%) | 50 (29.2%) |
| 4 or 5 Rooms | 169 (15.5%) | 60 (35.1%) |
| 6 or 7 Rooms | 402 (36.9%) | 40 (23.4%) |
| 8 or more Rooms | 511 (46.9%) | 21 (12.3%) |
| Total | 1,089 (100.0%) | 171 (100.0%) |
Housing Structure by Heating Type in Rosedale
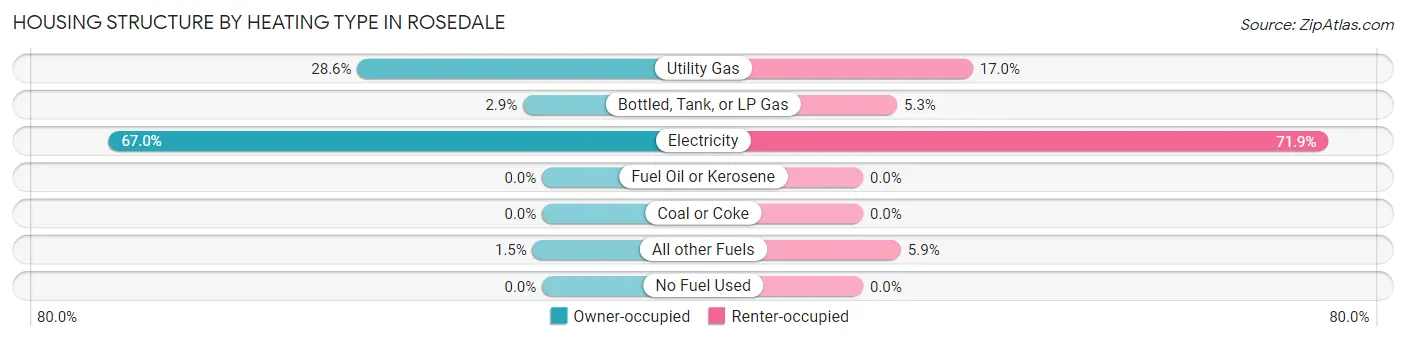
| Heating Type | Owner-occupied | Renter-occupied |
| Utility Gas | 311 (28.6%) | 29 (17.0%) |
| Bottled, Tank, or LP Gas | 32 (2.9%) | 9 (5.3%) |
| Electricity | 730 (67.0%) | 123 (71.9%) |
| Fuel Oil or Kerosene | 0 (0.0%) | 0 (0.0%) |
| Coal or Coke | 0 (0.0%) | 0 (0.0%) |
| All other Fuels | 16 (1.5%) | 10 (5.9%) |
| No Fuel Used | 0 (0.0%) | 0 (0.0%) |
| Total | 1,089 (100.0%) | 171 (100.0%) |
Household Vehicle Usage in Rosedale
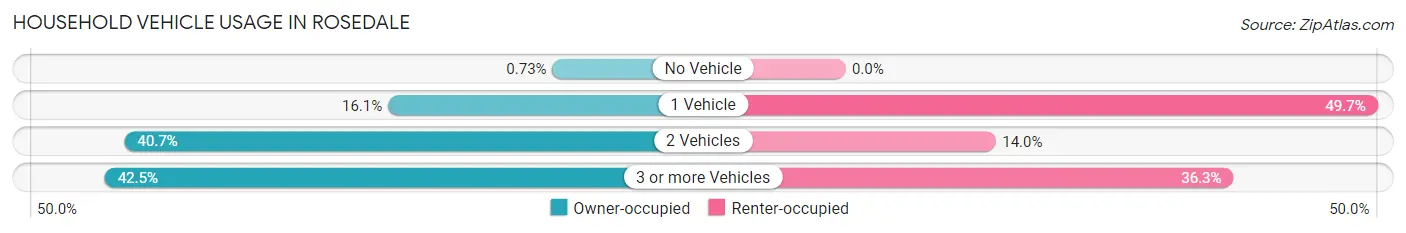
| Vehicles per Household | Owner-occupied | Renter-occupied |
| No Vehicle | 8 (0.7%) | 0 (0.0%) |
| 1 Vehicle | 175 (16.1%) | 85 (49.7%) |
| 2 Vehicles | 443 (40.7%) | 24 (14.0%) |
| 3 or more Vehicles | 463 (42.5%) | 62 (36.3%) |
| Total | 1,089 (100.0%) | 171 (100.0%) |
Real Estate & Mortgages in Rosedale
Real Estate and Mortgage Overview in Rosedale
| Characteristic | Without Mortgage | With Mortgage |
| Housing Units | 445 | 644 |
| Median Property Value | $597,500 | $794,500 |
| Median Household Income | $106,806 | $401 |
| Monthly Housing Costs | $959 | $344 |
| Real Estate Taxes | $6,010 | $23 |
Property Value by Mortgage Status in Rosedale
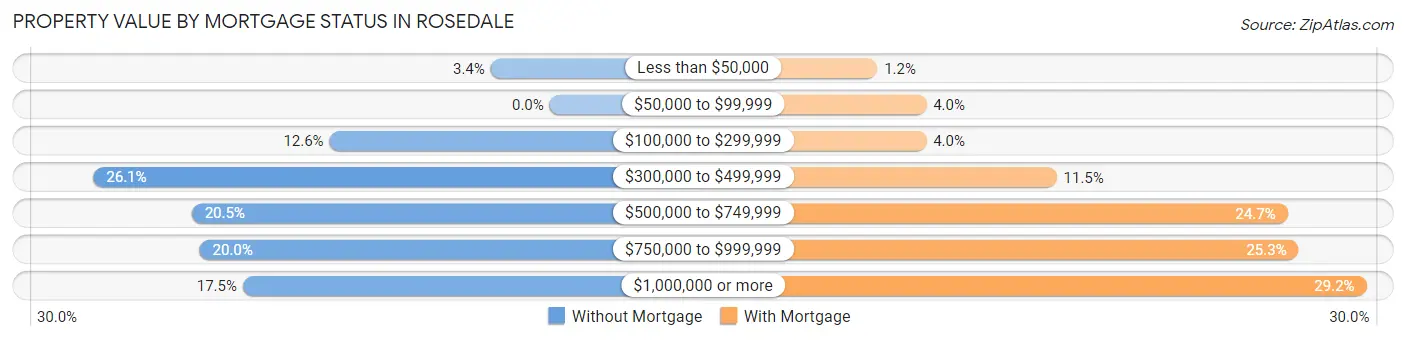
| Property Value | Without Mortgage | With Mortgage |
| Less than $50,000 | 15 (3.4%) | 8 (1.2%) |
| $50,000 to $99,999 | 0 (0.0%) | 26 (4.0%) |
| $100,000 to $299,999 | 56 (12.6%) | 26 (4.0%) |
| $300,000 to $499,999 | 116 (26.1%) | 74 (11.5%) |
| $500,000 to $749,999 | 91 (20.4%) | 159 (24.7%) |
| $750,000 to $999,999 | 89 (20.0%) | 163 (25.3%) |
| $1,000,000 or more | 78 (17.5%) | 188 (29.2%) |
| Total | 445 (100.0%) | 644 (100.0%) |
Household Income by Mortgage Status in Rosedale
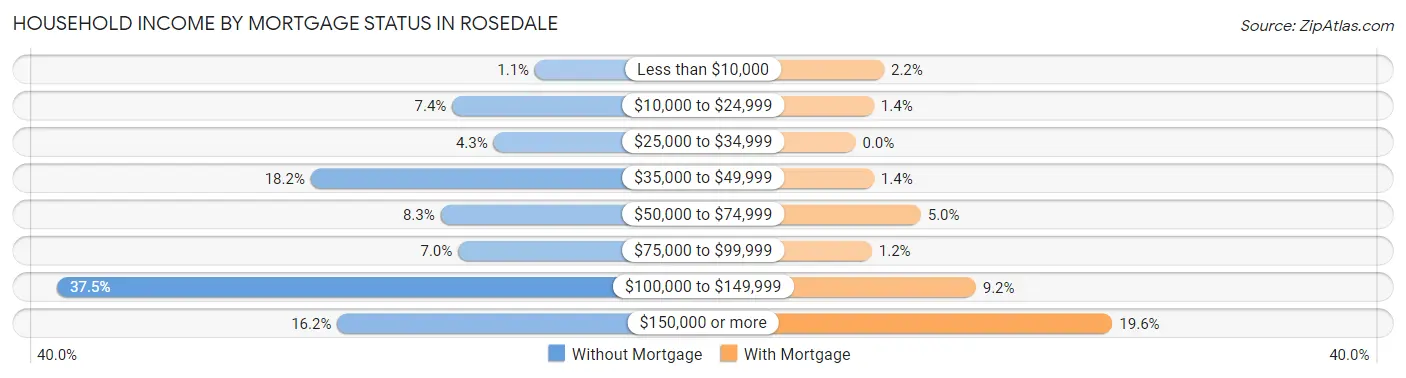
| Household Income | Without Mortgage | With Mortgage |
| Less than $10,000 | 5 (1.1%) | 14 (2.2%) |
| $10,000 to $24,999 | 33 (7.4%) | 9 (1.4%) |
| $25,000 to $34,999 | 19 (4.3%) | 0 (0.0%) |
| $35,000 to $49,999 | 81 (18.2%) | 9 (1.4%) |
| $50,000 to $74,999 | 37 (8.3%) | 32 (5.0%) |
| $75,000 to $99,999 | 31 (7.0%) | 8 (1.2%) |
| $100,000 to $149,999 | 167 (37.5%) | 59 (9.2%) |
| $150,000 or more | 72 (16.2%) | 126 (19.6%) |
| Total | 445 (100.0%) | 644 (100.0%) |
Property Value to Household Income Ratio in Rosedale
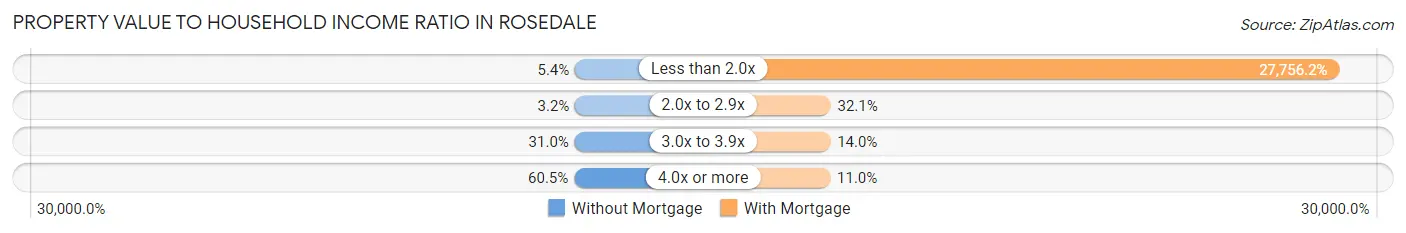
| Value-to-Income Ratio | Without Mortgage | With Mortgage |
| Less than 2.0x | 24 (5.4%) | 178,750 (27,756.2%) |
| 2.0x to 2.9x | 14 (3.2%) | 207 (32.1%) |
| 3.0x to 3.9x | 138 (31.0%) | 90 (14.0%) |
| 4.0x or more | 269 (60.5%) | 71 (11.0%) |
| Total | 445 (100.0%) | 644 (100.0%) |
Real Estate Taxes by Mortgage Status in Rosedale
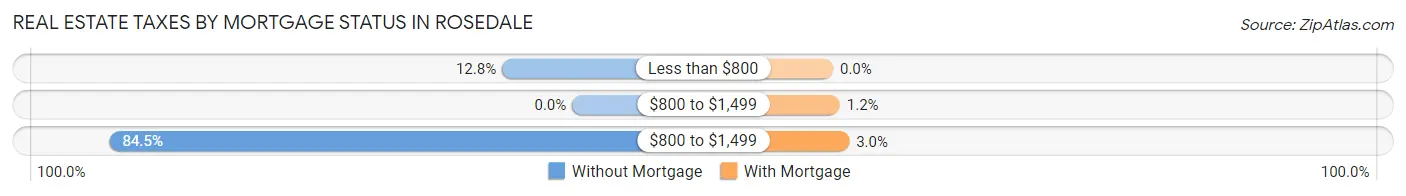
| Property Taxes | Without Mortgage | With Mortgage |
| Less than $800 | 57 (12.8%) | 0 (0.0%) |
| $800 to $1,499 | 0 (0.0%) | 8 (1.2%) |
| $800 to $1,499 | 376 (84.5%) | 19 (2.9%) |
| Total | 445 (100.0%) | 644 (100.0%) |
Health & Disability in Rosedale
Health Insurance Coverage by Age in Rosedale
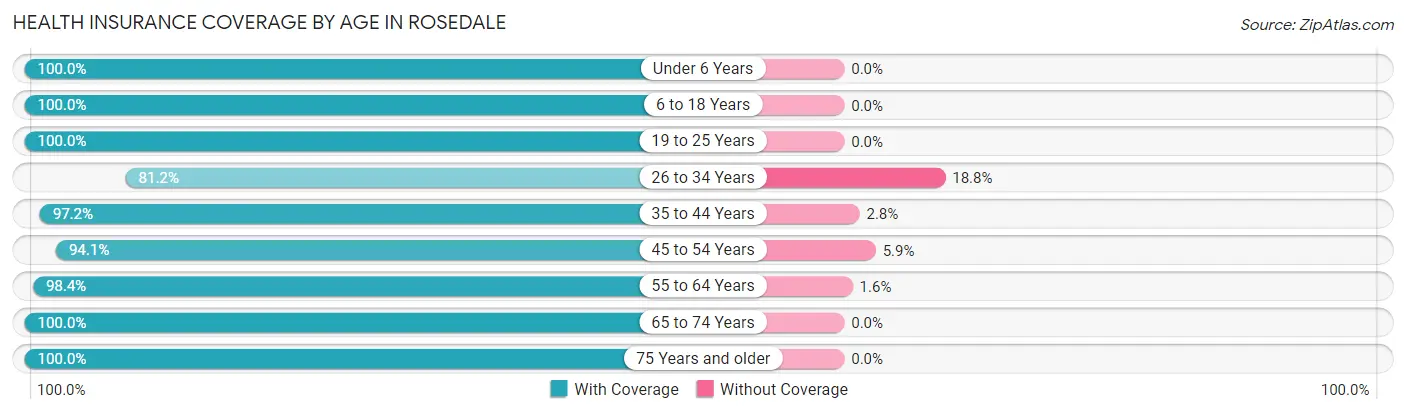
| Age Bracket | With Coverage | Without Coverage |
| Under 6 Years | 169 (100.0%) | 0 (0.0%) |
| 6 to 18 Years | 606 (100.0%) | 0 (0.0%) |
| 19 to 25 Years | 219 (100.0%) | 0 (0.0%) |
| 26 to 34 Years | 224 (81.2%) | 52 (18.8%) |
| 35 to 44 Years | 342 (97.2%) | 10 (2.8%) |
| 45 to 54 Years | 530 (94.1%) | 33 (5.9%) |
| 55 to 64 Years | 633 (98.4%) | 10 (1.6%) |
| 65 to 74 Years | 353 (100.0%) | 0 (0.0%) |
| 75 Years and older | 268 (100.0%) | 0 (0.0%) |
| Total | 3,344 (97.0%) | 105 (3.0%) |
Health Insurance Coverage by Citizenship Status in Rosedale
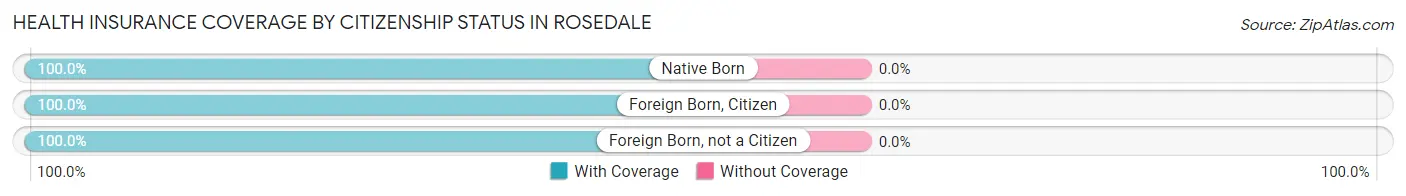
| Citizenship Status | With Coverage | Without Coverage |
| Native Born | 169 (100.0%) | 0 (0.0%) |
| Foreign Born, Citizen | 606 (100.0%) | 0 (0.0%) |
| Foreign Born, not a Citizen | 219 (100.0%) | 0 (0.0%) |
Health Insurance Coverage by Household Income in Rosedale
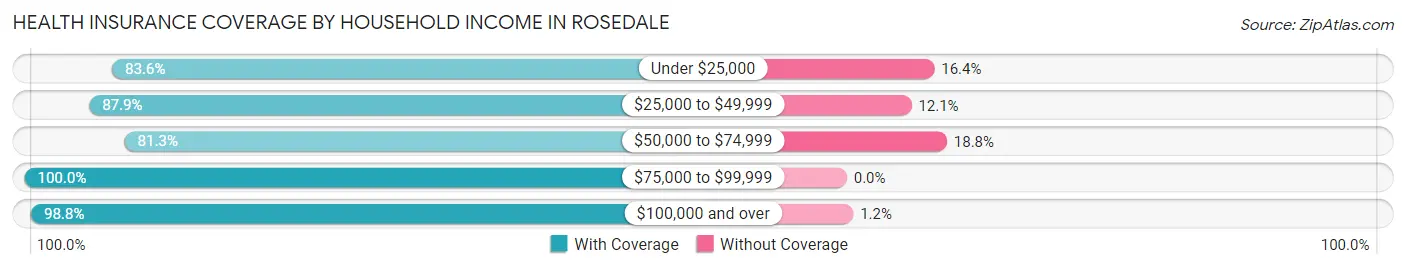
| Household Income | With Coverage | Without Coverage |
| Under $25,000 | 51 (83.6%) | 10 (16.4%) |
| $25,000 to $49,999 | 167 (87.9%) | 23 (12.1%) |
| $50,000 to $74,999 | 169 (81.2%) | 39 (18.8%) |
| $75,000 to $99,999 | 255 (100.0%) | 0 (0.0%) |
| $100,000 and over | 2,700 (98.8%) | 33 (1.2%) |
Public vs Private Health Insurance Coverage by Age in Rosedale
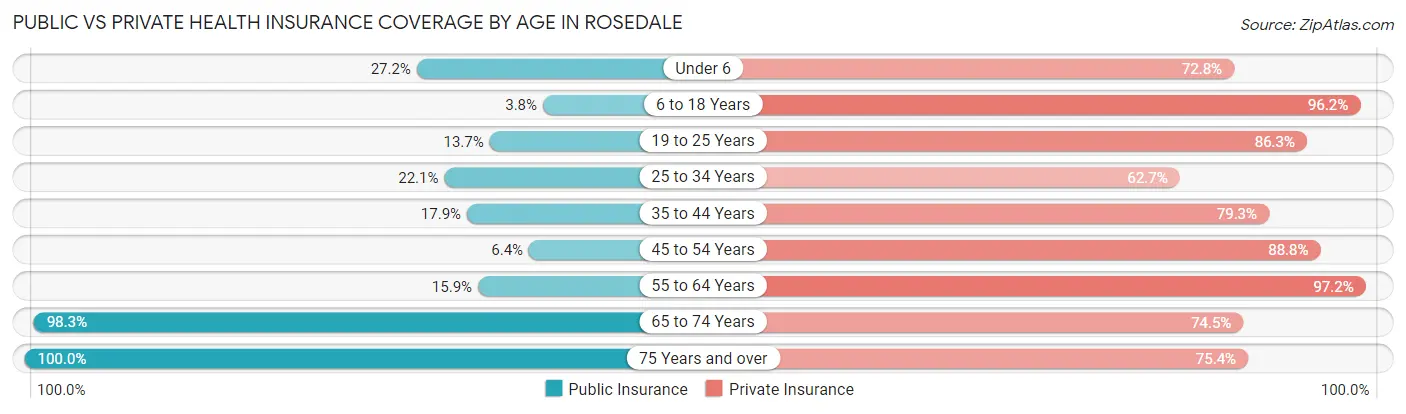
| Age Bracket | Public Insurance | Private Insurance |
| Under 6 | 46 (27.2%) | 123 (72.8%) |
| 6 to 18 Years | 23 (3.8%) | 583 (96.2%) |
| 19 to 25 Years | 30 (13.7%) | 189 (86.3%) |
| 25 to 34 Years | 61 (22.1%) | 173 (62.7%) |
| 35 to 44 Years | 63 (17.9%) | 279 (79.3%) |
| 45 to 54 Years | 36 (6.4%) | 500 (88.8%) |
| 55 to 64 Years | 102 (15.9%) | 625 (97.2%) |
| 65 to 74 Years | 347 (98.3%) | 263 (74.5%) |
| 75 Years and over | 268 (100.0%) | 202 (75.4%) |
| Total | 976 (28.3%) | 2,937 (85.2%) |
Disability Status by Sex by Age in Rosedale
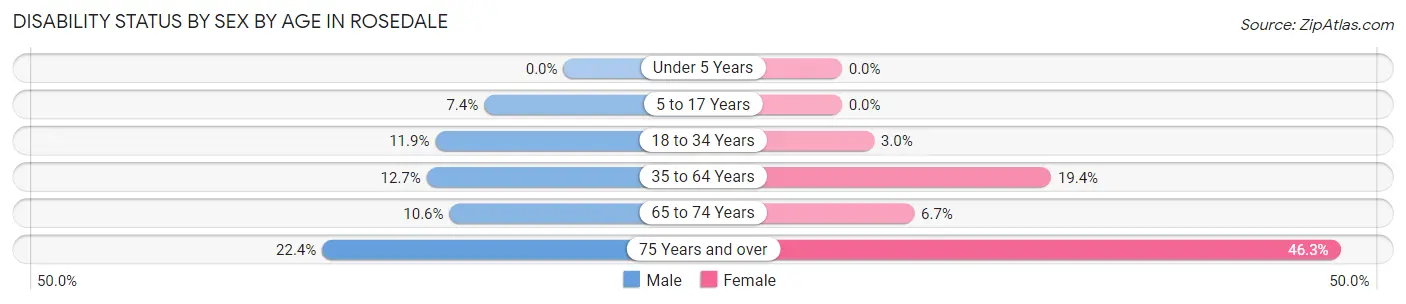
| Age Bracket | Male | Female |
| Under 5 Years | 0 (0.0%) | 0 (0.0%) |
| 5 to 17 Years | 22 (7.4%) | 0 (0.0%) |
| 18 to 34 Years | 39 (11.9%) | 7 (3.0%) |
| 35 to 64 Years | 99 (12.7%) | 151 (19.4%) |
| 65 to 74 Years | 20 (10.6%) | 11 (6.7%) |
| 75 Years and over | 30 (22.4%) | 62 (46.3%) |
Disability Class by Sex by Age in Rosedale
Disability Class: Hearing Difficulty
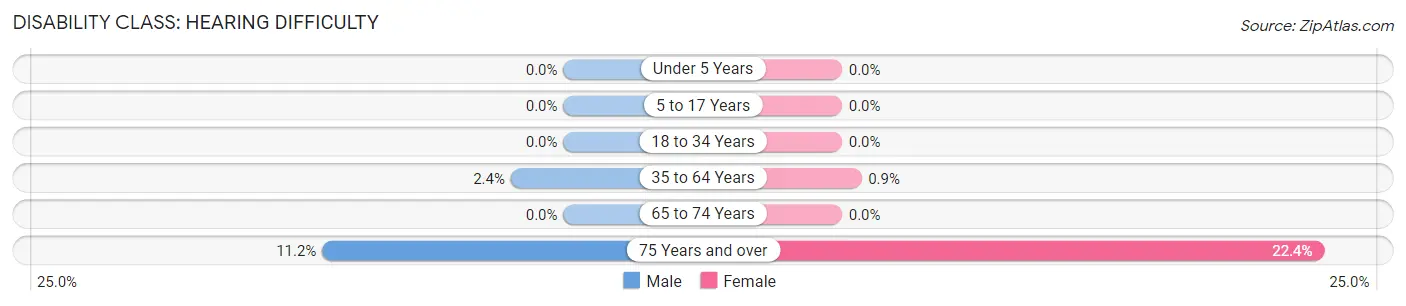
| Age Bracket | Male | Female |
| Under 5 Years | 0 (0.0%) | 0 (0.0%) |
| 5 to 17 Years | 0 (0.0%) | 0 (0.0%) |
| 18 to 34 Years | 0 (0.0%) | 0 (0.0%) |
| 35 to 64 Years | 19 (2.4%) | 7 (0.9%) |
| 65 to 74 Years | 0 (0.0%) | 0 (0.0%) |
| 75 Years and over | 15 (11.2%) | 30 (22.4%) |
Disability Class: Vision Difficulty
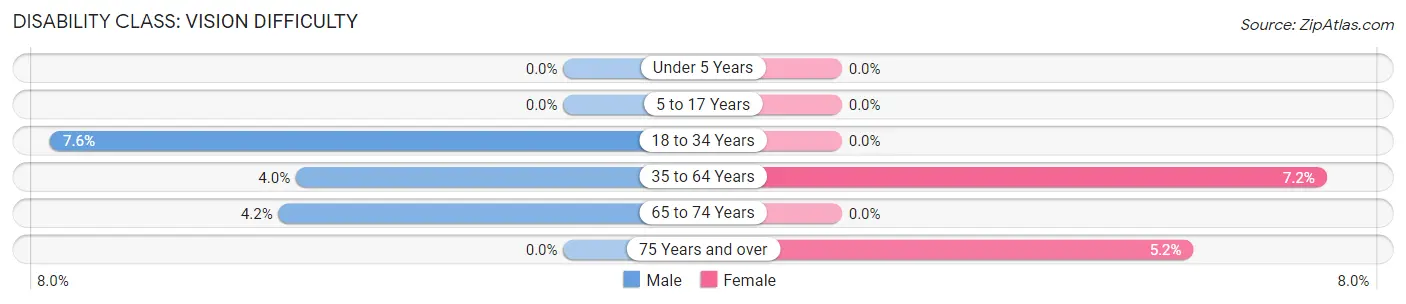
| Age Bracket | Male | Female |
| Under 5 Years | 0 (0.0%) | 0 (0.0%) |
| 5 to 17 Years | 0 (0.0%) | 0 (0.0%) |
| 18 to 34 Years | 25 (7.6%) | 0 (0.0%) |
| 35 to 64 Years | 31 (4.0%) | 56 (7.2%) |
| 65 to 74 Years | 8 (4.2%) | 0 (0.0%) |
| 75 Years and over | 0 (0.0%) | 7 (5.2%) |
Disability Class: Cognitive Difficulty
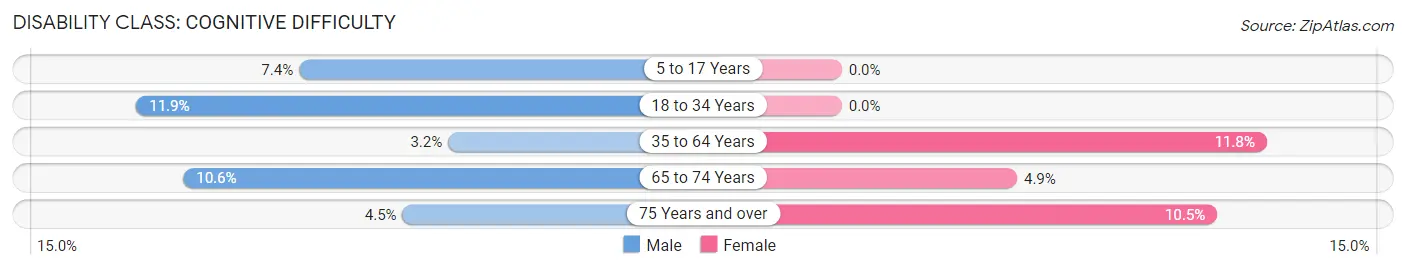
| Age Bracket | Male | Female |
| 5 to 17 Years | 22 (7.4%) | 0 (0.0%) |
| 18 to 34 Years | 39 (11.9%) | 0 (0.0%) |
| 35 to 64 Years | 25 (3.2%) | 92 (11.8%) |
| 65 to 74 Years | 20 (10.6%) | 8 (4.9%) |
| 75 Years and over | 6 (4.5%) | 14 (10.4%) |
Disability Class: Ambulatory Difficulty
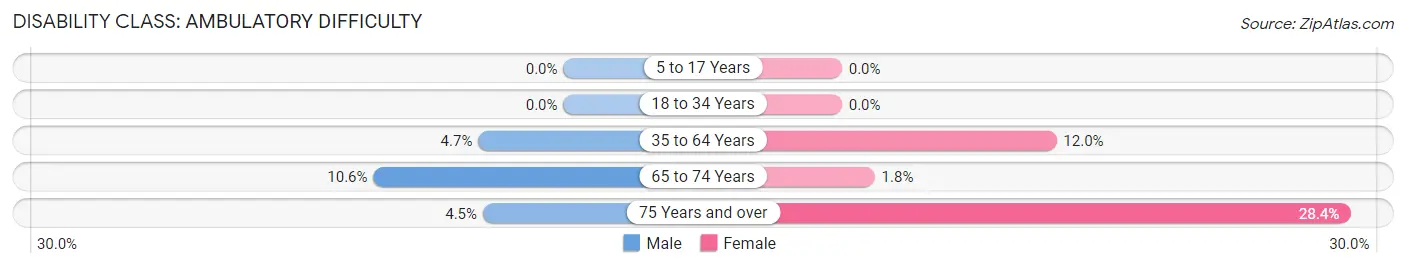
| Age Bracket | Male | Female |
| 5 to 17 Years | 0 (0.0%) | 0 (0.0%) |
| 18 to 34 Years | 0 (0.0%) | 0 (0.0%) |
| 35 to 64 Years | 37 (4.7%) | 93 (11.9%) |
| 65 to 74 Years | 20 (10.6%) | 3 (1.8%) |
| 75 Years and over | 6 (4.5%) | 38 (28.4%) |
Disability Class: Self-Care Difficulty
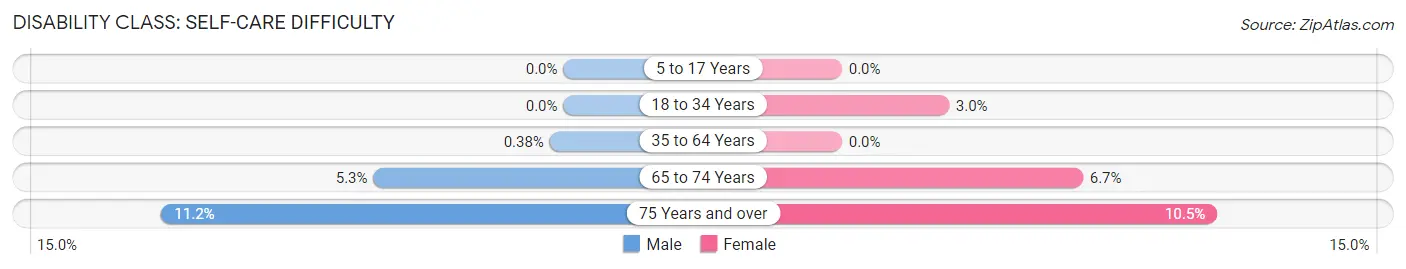
| Age Bracket | Male | Female |
| 5 to 17 Years | 0 (0.0%) | 0 (0.0%) |
| 18 to 34 Years | 0 (0.0%) | 7 (3.0%) |
| 35 to 64 Years | 3 (0.4%) | 0 (0.0%) |
| 65 to 74 Years | 10 (5.3%) | 11 (6.7%) |
| 75 Years and over | 15 (11.2%) | 14 (10.4%) |
Technology Access in Rosedale
Computing Device Access in Rosedale

| Device Type | # Households | % Households |
| Desktop or Laptop | 1,214 | 96.4% |
| Smartphone | 1,160 | 92.1% |
| Tablet | 962 | 76.3% |
| No Computing Device | 36 | 2.9% |
| Total | 1,260 | 100.0% |
Internet Access in Rosedale
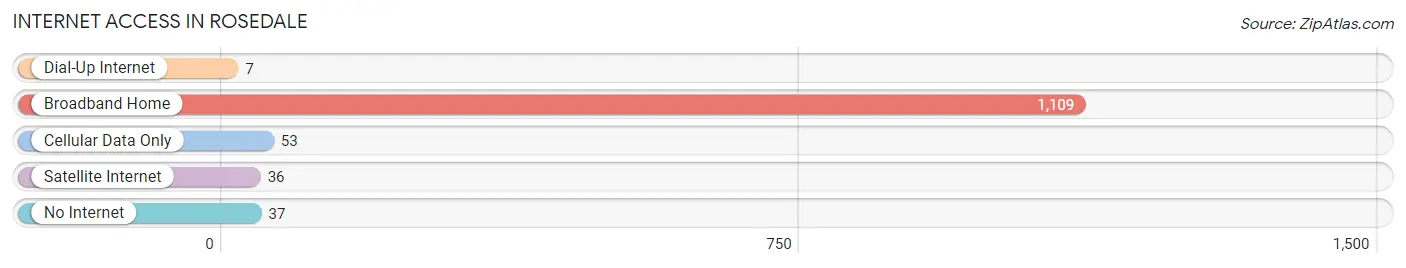
| Internet Type | # Households | % Households |
| Dial-Up Internet | 7 | 0.6% |
| Broadband Home | 1,109 | 88.0% |
| Cellular Data Only | 53 | 4.2% |
| Satellite Internet | 36 | 2.9% |
| No Internet | 37 | 2.9% |
| Total | 1,260 | 100.0% |
Rosedale Summary
Rosedale is a small town located in the state of Washington, United States. It is situated in the south-central part of the state, in the county of Benton. The town is located on the banks of the Columbia River, and is part of the Tri-Cities metropolitan area. The population of Rosedale was estimated to be 1,845 in 2019.
History
Rosedale was founded in 1883 by a group of settlers from the Midwest. The town was named after the wild roses that grew in the area. The settlers built a sawmill and a flour mill, and the town quickly grew. By the early 1900s, Rosedale had become a thriving agricultural community. The town was incorporated in 1909.
In the early 20th century, Rosedale was a major producer of wheat, barley, and oats. The town also had a thriving dairy industry. In the 1950s, the town began to decline as the agricultural industry shifted away from the area.
Geography
Rosedale is located in the south-central part of Washington, in the county of Benton. The town is situated on the banks of the Columbia River, and is part of the Tri-Cities metropolitan area. The town is located at an elevation of 441 feet above sea level.
The climate in Rosedale is semi-arid, with hot summers and cold winters. The average annual temperature is around 50 degrees Fahrenheit. The average annual precipitation is around 12 inches.
Economy
Rosedale’s economy is largely based on agriculture. The town is home to several farms, which produce a variety of crops, including wheat, barley, oats, and hay. The town also has a thriving dairy industry.
In addition to agriculture, Rosedale is home to several businesses, including a grocery store, a hardware store, and a restaurant. The town also has a post office and a library.
Demographics
As of 2019, the population of Rosedale was estimated to be 1,845. The town has a diverse population, with people of various ethnic backgrounds. The majority of the population is white (90.2%), followed by Hispanic or Latino (4.2%), Asian (2.2%), and African American (1.2%).
The median household income in Rosedale is $50,945, and the median home value is $179,400. The town has a low unemployment rate of 3.2%.
Conclusion
Rosedale is a small town located in the state of Washington, United States. It is situated in the south-central part of the state, in the county of Benton. The town is located on the banks of the Columbia River, and is part of the Tri-Cities metropolitan area. The population of Rosedale was estimated to be 1,845 in 2019. The town’s economy is largely based on agriculture, and it also has several businesses. The town has a diverse population, with people of various ethnic backgrounds. The median household income in Rosedale is $50,945, and the median home value is $179,400.
Common Questions
What is the Total Population of Rosedale?
Total Population of Rosedale is 4,273.
What is the Total Male Population of Rosedale?
Total Male Population of Rosedale is 1,784.
What is the Total Female Population of Rosedale?
Total Female Population of Rosedale is 2,489.
What is the Ratio of Males per 100 Females in Rosedale?
There are 71.68 Males per 100 Females in Rosedale.
What is the Ratio of Females per 100 Males in Rosedale?
There are 139.52 Females per 100 Males in Rosedale.
What is the Median Population Age in Rosedale?
Median Population Age in Rosedale is 44.7 Years.
What is the Average Family Size in Rosedale
Average Family Size in Rosedale is 3.1 People.
What is the Average Household Size in Rosedale
Average Household Size in Rosedale is 2.7 People.
What is Per Capita Income in Rosedale?
Per Capita income in Rosedale is $66,604.
What is the Median Family Income in Rosedale?
Median Family Income in Rosedale is $149,342.
What is the Median Household income in Rosedale?
Median Household Income in Rosedale is $141,490.
What is Income or Wage Gap in Rosedale?
Income or Wage Gap in Rosedale is 80.1%.
Women in Rosedale earn 19.9 cents for every dollar earned by a man.
What is Inequality or Gini Index in Rosedale?
Inequality or Gini Index in Rosedale is 0.51.
How Large is the Labor Force in Rosedale?
There are 1,732 People in the Labor Forcein in Rosedale.
What is the Percentage of People in the Labor Force in Rosedale?
47.3% of People are in the Labor Force in Rosedale.
What is the Unemployment Rate in Rosedale?
Unemployment Rate in Rosedale is 7.9%.