Cities with the Highest Inequality / Gini Index in Vermont
RELATED REPORTS & OPTIONS
Highest Inequality / Gini Index
Vermont
Compare Cities
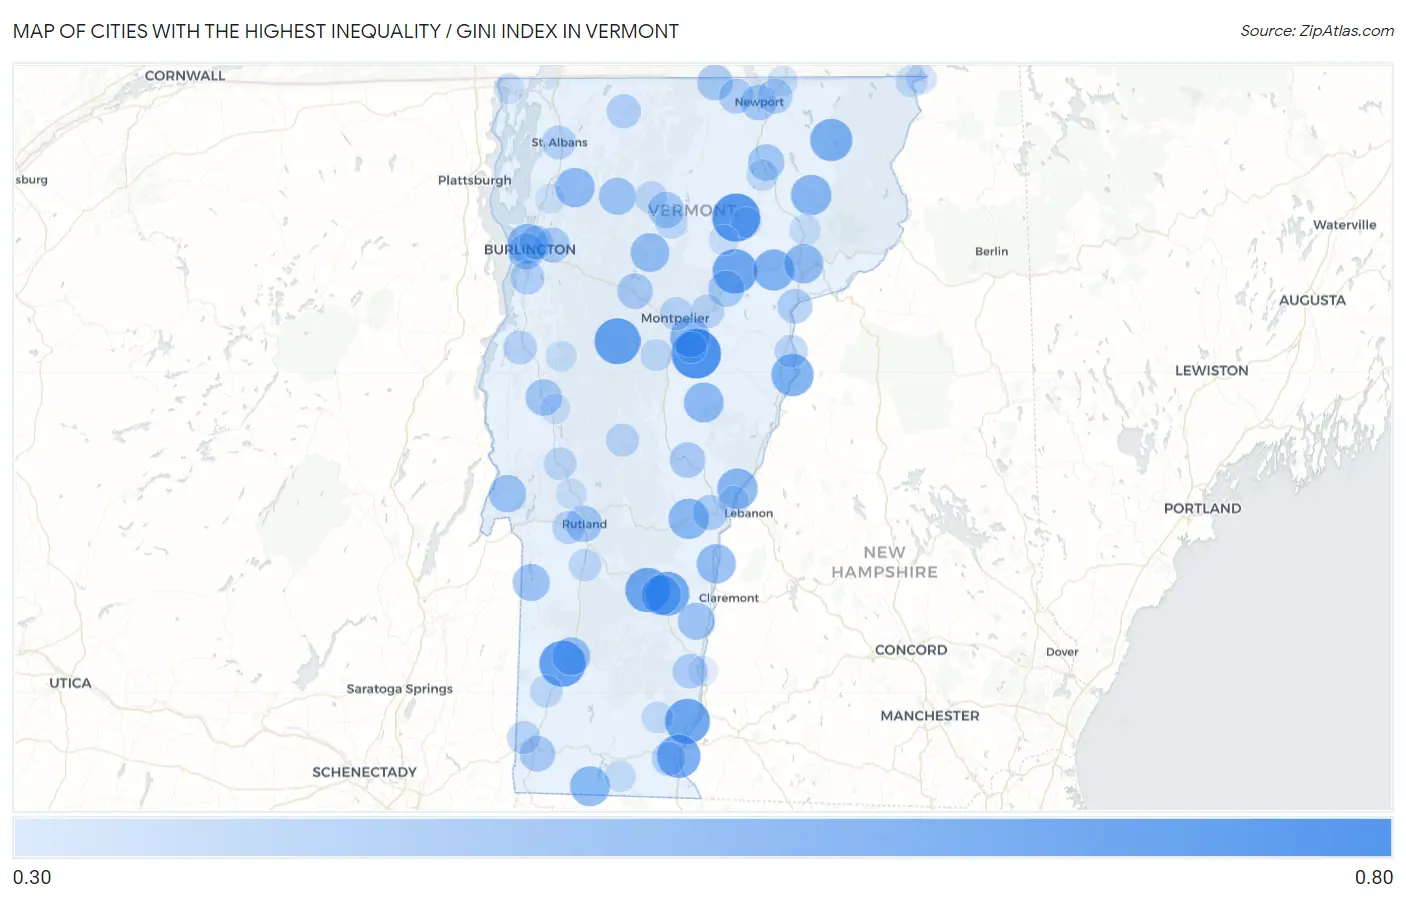
Map of Cities with the Highest Inequality / Gini Index in Vermont
0.00
0.80
Cities with the Highest Inequality / Gini Index in Vermont
| City | Inequality / Gini Index | vs State | vs National | |
| 1. | Graniteville | 0.62 | 0.45(+0.174)#1 | 0.48(+0.140)#263 |
| 2. | Greensboro | 0.60 | 0.45(+0.155)#2 | 0.48(+0.121)#383 |
| 3. | Manchester | 0.58 | 0.45(+0.130)#3 | 0.48(+0.096)#636 |
| 4. | Waitsfield | 0.58 | 0.45(+0.127)#4 | 0.48(+0.092)#682 |
| 5. | Putney | 0.56 | 0.45(+0.113)#5 | 0.48(+0.078)#899 |
| 6. | West Pawlet | 0.56 | 0.45(+0.112)#6 | 0.48(+0.077)#919 |
| 7. | Cabot | 0.56 | 0.45(+0.109)#7 | 0.48(+0.075)#966 |
| 8. | Ludlow | 0.56 | 0.45(+0.109)#8 | 0.48(+0.074)#985 |
| 9. | Peacham | 0.56 | 0.45(+0.106)#9 | 0.48(+0.072)#1,026 |
| 10. | Cavendish | 0.55 | 0.45(+0.100)#10 | 0.48(+0.066)#1,166 |
| 11. | Brattleboro | 0.54 | 0.45(+0.094)#11 | 0.48(+0.060)#1,322 |
| 12. | West Woodstock | 0.54 | 0.45(+0.087)#12 | 0.48(+0.053)#1,516 |
| 13. | East Dorset | 0.53 | 0.45(+0.082)#13 | 0.48(+0.048)#1,671 |
| 14. | Newbury | 0.53 | 0.45(+0.079)#14 | 0.48(+0.045)#1,781 |
| 15. | Island Pond | 0.53 | 0.45(+0.078)#15 | 0.48(+0.044)#1,815 |
| 16. | Townshend | 0.52 | 0.45(+0.071)#16 | 0.48(+0.037)#2,104 |
| 17. | Danville | 0.51 | 0.45(+0.066)#17 | 0.48(+0.032)#2,340 |
| 18. | Norwich | 0.51 | 0.45(+0.058)#18 | 0.48(+0.023)#2,748 |
| 19. | West Burke | 0.51 | 0.45(+0.057)#19 | 0.48(+0.023)#2,775 |
| 20. | Woodstock | 0.51 | 0.45(+0.056)#20 | 0.48(+0.022)#2,824 |
| 21. | Burlington | 0.50 | 0.45(+0.051)#21 | 0.48(+0.017)#3,101 |
| 22. | Proctorsville | 0.50 | 0.45(+0.049)#22 | 0.48(+0.015)#3,234 |
| 23. | Readsboro | 0.50 | 0.45(+0.049)#23 | 0.48(+0.015)#3,235 |
| 24. | Chelsea | 0.50 | 0.45(+0.049)#24 | 0.48(+0.014)#3,255 |
| 25. | Barre | 0.49 | 0.45(+0.046)#25 | 0.48(+0.012)#3,420 |
| 26. | Algiers | 0.49 | 0.45(+0.043)#26 | 0.48(+0.009)#3,607 |
| 27. | Fairfax | 0.49 | 0.45(+0.043)#27 | 0.48(+0.008)#3,647 |
| 28. | St Johnsbury | 0.49 | 0.45(+0.041)#28 | 0.48(+0.007)#3,740 |
| 29. | Windsor | 0.49 | 0.45(+0.040)#29 | 0.48(+0.006)#3,804 |
| 30. | Pawlet | 0.49 | 0.45(+0.039)#30 | 0.48(+0.005)#3,918 |
| 31. | Stowe | 0.48 | 0.45(+0.035)#31 | 0.48(+0.000)#4,284 |
| 32. | Castleton Four Corners | 0.47 | 0.45(+0.025)#32 | 0.48(-0.009)#5,173 |
| 33. | Manchester Center | 0.47 | 0.45(+0.024)#33 | 0.48(-0.010)#5,229 |
| 34. | Hartford | 0.47 | 0.45(+0.022)#34 | 0.48(-0.012)#5,417 |
| 35. | Benson | 0.47 | 0.45(+0.017)#35 | 0.48(-0.017)#5,999 |
| 36. | Jeffersonville | 0.46 | 0.45(+0.013)#36 | 0.48(-0.021)#6,444 |
| 37. | Wells | 0.46 | 0.45(+0.012)#37 | 0.48(-0.022)#6,520 |
| 38. | Springfield | 0.46 | 0.45(+0.012)#38 | 0.48(-0.022)#6,533 |
| 39. | Middlebury | 0.46 | 0.45(+0.006)#39 | 0.48(-0.028)#7,235 |
| 40. | Barton | 0.45 | 0.45(+0.006)#40 | 0.48(-0.029)#7,339 |
| 41. | Rutland | 0.45 | 0.45(+0.006)#41 | 0.48(-0.029)#7,343 |
| 42. | Waterbury Center | 0.45 | 0.45(+0.006)#42 | 0.48(-0.029)#7,349 |
| 43. | Hyde Park | 0.45 | 0.45(+0.003)#43 | 0.48(-0.031)#7,674 |
| 44. | Marshfield | 0.45 | 0.45(+0.002)#44 | 0.48(-0.032)#7,747 |
| 45. | South Burlington | 0.45 | 0.45(+0.001)#45 | 0.48(-0.033)#7,850 |
| 46. | Newport | 0.45 | 0.45(-0.002)#46 | 0.48(-0.036)#8,300 |
| 47. | North Troy | 0.45 | 0.45(-0.003)#47 | 0.48(-0.038)#8,505 |
| 48. | South Londonderry | 0.44 | 0.45(-0.004)#48 | 0.48(-0.038)#8,620 |
| 49. | South Royalton | 0.44 | 0.45(-0.005)#49 | 0.48(-0.039)#8,752 |
| 50. | Waterbury | 0.44 | 0.45(-0.006)#50 | 0.48(-0.040)#8,821 |
| 51. | Bennington | 0.44 | 0.45(-0.006)#51 | 0.48(-0.040)#8,864 |
| 52. | Quechee | 0.44 | 0.45(-0.010)#52 | 0.48(-0.045)#9,480 |
| 53. | Essex Junction | 0.44 | 0.45(-0.012)#53 | 0.48(-0.046)#9,663 |
| 54. | Barnet | 0.43 | 0.45(-0.015)#54 | 0.48(-0.049)#10,139 |
| 55. | Derby Center | 0.43 | 0.45(-0.015)#55 | 0.48(-0.049)#10,201 |
| 56. | Saxtons River | 0.43 | 0.45(-0.016)#56 | 0.48(-0.050)#10,300 |
| 57. | Newport Center | 0.43 | 0.45(-0.016)#57 | 0.48(-0.051)#10,380 |
| 58. | Shelburne | 0.43 | 0.45(-0.021)#58 | 0.48(-0.056)#11,138 |
| 59. | Winooski | 0.43 | 0.45(-0.022)#59 | 0.48(-0.057)#11,286 |
| 60. | Enosburg Falls | 0.43 | 0.45(-0.023)#60 | 0.48(-0.058)#11,453 |
| 61. | West Brattleboro | 0.42 | 0.45(-0.024)#61 | 0.48(-0.059)#11,628 |
| 62. | St Albans | 0.42 | 0.45(-0.027)#62 | 0.48(-0.061)#11,998 |
| 63. | Vergennes | 0.42 | 0.45(-0.027)#63 | 0.48(-0.062)#12,125 |
| 64. | Plainfield | 0.42 | 0.45(-0.030)#64 | 0.48(-0.064)#12,577 |
| 65. | North Clarendon | 0.42 | 0.45(-0.031)#65 | 0.48(-0.065)#12,753 |
| 66. | Huntington | 0.42 | 0.45(-0.031)#66 | 0.48(-0.065)#12,761 |
| 67. | Stamford | 0.42 | 0.45(-0.031)#67 | 0.48(-0.066)#12,834 |
| 68. | Montpelier | 0.41 | 0.45(-0.034)#68 | 0.48(-0.068)#13,193 |
| 69. | North Bennington | 0.41 | 0.45(-0.034)#69 | 0.48(-0.068)#13,233 |
| 70. | West Rutland | 0.41 | 0.45(-0.035)#70 | 0.48(-0.070)#13,462 |
| 71. | Wells River | 0.41 | 0.45(-0.036)#71 | 0.48(-0.071)#13,633 |
| 72. | Rochester | 0.41 | 0.45(-0.037)#72 | 0.48(-0.072)#13,771 |
| 73. | Killington | 0.41 | 0.45(-0.038)#73 | 0.48(-0.073)#14,001 |
| 74. | Brandon | 0.41 | 0.45(-0.041)#74 | 0.48(-0.076)#14,558 |
| 75. | Arlington | 0.41 | 0.45(-0.042)#75 | 0.48(-0.076)#14,614 |
| 76. | Morrisville | 0.40 | 0.45(-0.044)#76 | 0.48(-0.078)#14,924 |
| 77. | Johnson | 0.40 | 0.45(-0.044)#77 | 0.48(-0.078)#14,929 |
| 78. | Wallingford | 0.40 | 0.45(-0.044)#78 | 0.48(-0.079)#15,062 |
| 79. | Northfield | 0.40 | 0.45(-0.046)#79 | 0.48(-0.081)#15,390 |
| 80. | Glover | 0.40 | 0.45(-0.051)#80 | 0.48(-0.086)#16,277 |
| 81. | Weston | 0.40 | 0.45(-0.051)#81 | 0.48(-0.086)#16,338 |
| 82. | Newfane | 0.40 | 0.45(-0.053)#82 | 0.48(-0.087)#16,562 |
| 83. | Canaan | 0.40 | 0.45(-0.053)#83 | 0.48(-0.088)#16,620 |
| 84. | Lyndonville | 0.39 | 0.45(-0.054)#84 | 0.48(-0.089)#16,748 |
| 85. | Jacksonville | 0.39 | 0.45(-0.057)#85 | 0.48(-0.091)#17,199 |
| 86. | South Barre | 0.39 | 0.45(-0.058)#86 | 0.48(-0.092)#17,403 |
| 87. | East Poultney | 0.39 | 0.45(-0.059)#87 | 0.48(-0.093)#17,525 |
| 88. | Gilman | 0.39 | 0.45(-0.060)#88 | 0.48(-0.094)#17,698 |
| 89. | Wilder | 0.39 | 0.45(-0.061)#89 | 0.48(-0.095)#17,948 |
| 90. | Greensboro Bend | 0.38 | 0.45(-0.064)#90 | 0.48(-0.098)#18,363 |
| 91. | Danby | 0.38 | 0.45(-0.064)#91 | 0.48(-0.098)#18,374 |
| 92. | Beecher Falls | 0.38 | 0.45(-0.065)#92 | 0.48(-0.099)#18,532 |
| 93. | Pittsford | 0.38 | 0.45(-0.065)#93 | 0.48(-0.100)#18,608 |
| 94. | Bristol | 0.38 | 0.45(-0.066)#94 | 0.48(-0.100)#18,736 |
| 95. | Derby Line | 0.38 | 0.45(-0.066)#95 | 0.48(-0.100)#18,753 |
| 96. | Hardwick | 0.38 | 0.45(-0.068)#96 | 0.48(-0.102)#19,054 |
| 97. | East Middlebury | 0.38 | 0.45(-0.068)#97 | 0.48(-0.102)#19,079 |
| 98. | Alburgh | 0.38 | 0.45(-0.068)#98 | 0.48(-0.103)#19,131 |
| 99. | Milton | 0.38 | 0.45(-0.072)#99 | 0.48(-0.107)#19,795 |
| 100. | Bellows Falls | 0.38 | 0.45(-0.073)#100 | 0.48(-0.107)#19,838 |
1
2Common Questions
What are the Top 10 Cities with the Highest Inequality / Gini Index in Vermont?
Top 10 Cities with the Highest Inequality / Gini Index in Vermont are:
#1
0.62
#2
0.60
#3
0.58
#4
0.58
#5
0.56
#6
0.56
#7
0.56
#8
0.55
#9
0.54
#10
0.53
What city has the Highest Inequality / Gini Index in Vermont?
Graniteville has the Highest Inequality / Gini Index in Vermont with 0.62.
What is the Inequality / Gini Index in the State of Vermont?
Inequality / Gini Index in Vermont is 0.45.
What is the Inequality / Gini Index in the United States?
Inequality / Gini Index in the United States is 0.48.