Northfield, VT
Northfield Map
Northfield Overview
4,390
TOTAL POPULATION
2,390
MALE POPULATION
2,000
FEMALE POPULATION
119.50
MALES / 100 FEMALES
83.68
FEMALES / 100 MALES
25.3
MEDIAN AGE
3.0
AVG FAMILY SIZE
2.5
AVG HOUSEHOLD SIZE
$25,386
PER CAPITA INCOME
$83,333
AVG FAMILY INCOME
$65,926
AVG HOUSEHOLD INCOME
8.0%
WAGE / INCOME GAP [ % ]
92.0¢/ $1
WAGE / INCOME GAP [ $ ]
0.40
INEQUALITY / GINI INDEX
2,204
LABOR FORCE [ PEOPLE ]
56.6%
PERCENT IN LABOR FORCE
2.0%
UNEMPLOYMENT RATE
Northfield Zip Codes
Northfield Area Codes
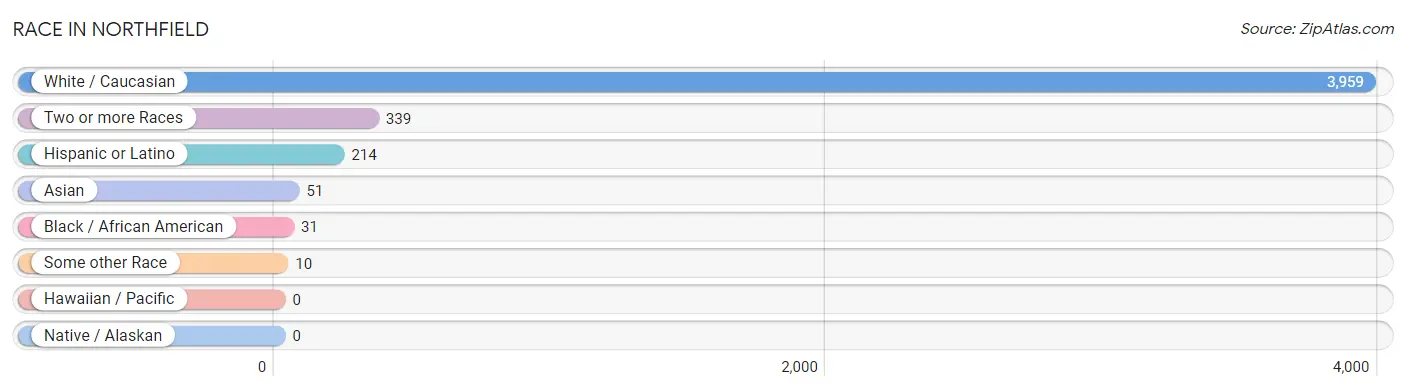
Race in Northfield
The most populous races in Northfield are White / Caucasian (3,959 | 90.2%), Two or more Races (339 | 7.7%), and Hispanic or Latino (214 | 4.9%).
| Race | # Population | % Population |
| Asian | 51 | 1.2% |
| Black / African American | 31 | 0.7% |
| Hawaiian / Pacific | 0 | 0.0% |
| Hispanic or Latino | 214 | 4.9% |
| Native / Alaskan | 0 | 0.0% |
| White / Caucasian | 3,959 | 90.2% |
| Two or more Races | 339 | 7.7% |
| Some other Race | 10 | 0.2% |
| Total | 4,390 | 100.0% |
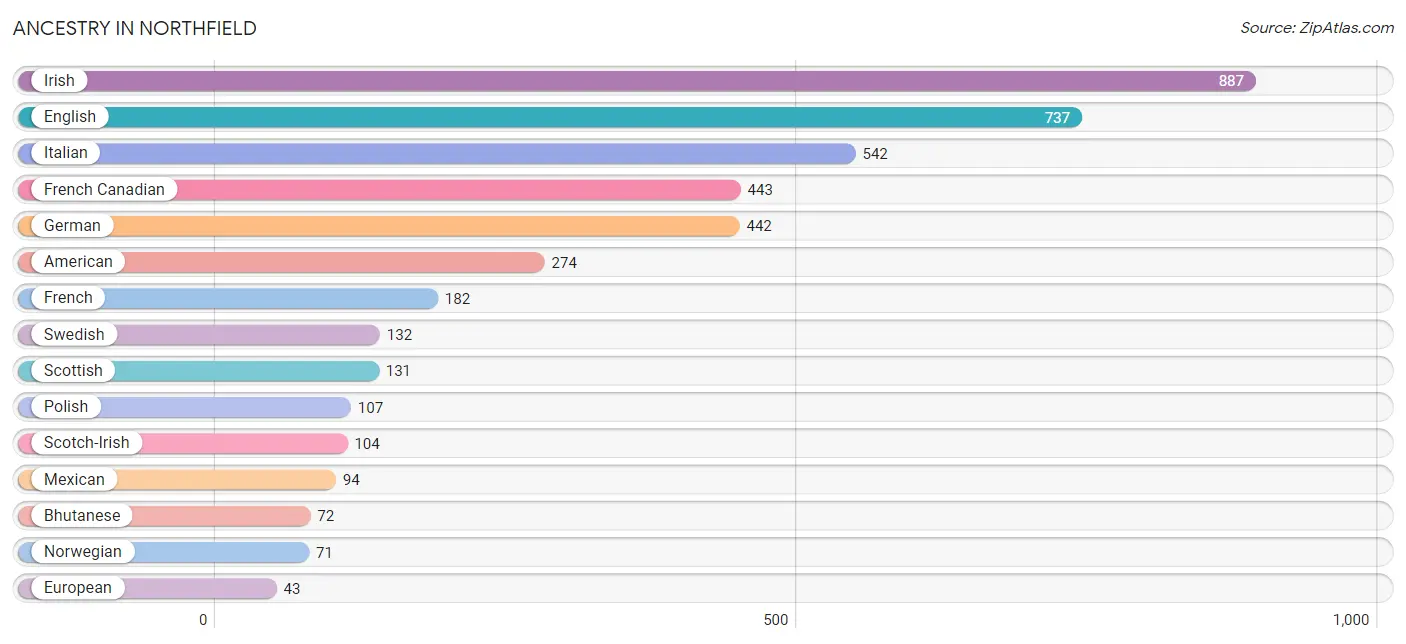
Ancestry in Northfield
The most populous ancestries reported in Northfield are Irish (887 | 20.2%), English (737 | 16.8%), Italian (542 | 12.3%), French Canadian (443 | 10.1%), and German (442 | 10.1%), together accounting for 69.5% of all Northfield residents.
| Ancestry | # Population | % Population |
| American | 274 | 6.2% |
| Arab | 34 | 0.8% |
| Armenian | 28 | 0.6% |
| Assyrian / Chaldean / Syriac | 5 | 0.1% |
| Bhutanese | 72 | 1.6% |
| Bulgarian | 34 | 0.8% |
| Burmese | 12 | 0.3% |
| Cajun | 4 | 0.1% |
| Canadian | 10 | 0.2% |
| Central American | 4 | 0.1% |
| Chilean | 16 | 0.4% |
| Cuban | 28 | 0.6% |
| Ecuadorian | 20 | 0.5% |
| English | 737 | 16.8% |
| European | 43 | 1.0% |
| Finnish | 33 | 0.7% |
| French | 182 | 4.2% |
| French Canadian | 443 | 10.1% |
| German | 442 | 10.1% |
| Greek | 40 | 0.9% |
| Haitian | 17 | 0.4% |
| Honduran | 4 | 0.1% |
| Hungarian | 40 | 0.9% |
| Indian (Asian) | 37 | 0.8% |
| Iranian | 5 | 0.1% |
| Irish | 887 | 20.2% |
| Italian | 542 | 12.3% |
| Korean | 11 | 0.3% |
| Lebanese | 34 | 0.8% |
| Mexican | 94 | 2.1% |
| Norwegian | 71 | 1.6% |
| Pakistani | 21 | 0.5% |
| Peruvian | 4 | 0.1% |
| Polish | 107 | 2.4% |
| Portuguese | 32 | 0.7% |
| Puerto Rican | 22 | 0.5% |
| Russian | 35 | 0.8% |
| Scotch-Irish | 104 | 2.4% |
| Scottish | 131 | 3.0% |
| Slovak | 14 | 0.3% |
| South American | 40 | 0.9% |
| Spaniard | 26 | 0.6% |
| Sri Lankan | 16 | 0.4% |
| Swedish | 132 | 3.0% |
| Thai | 18 | 0.4% |
| Ukrainian | 21 | 0.5% |
| Welsh | 41 | 0.9% | View All 47 Rows |
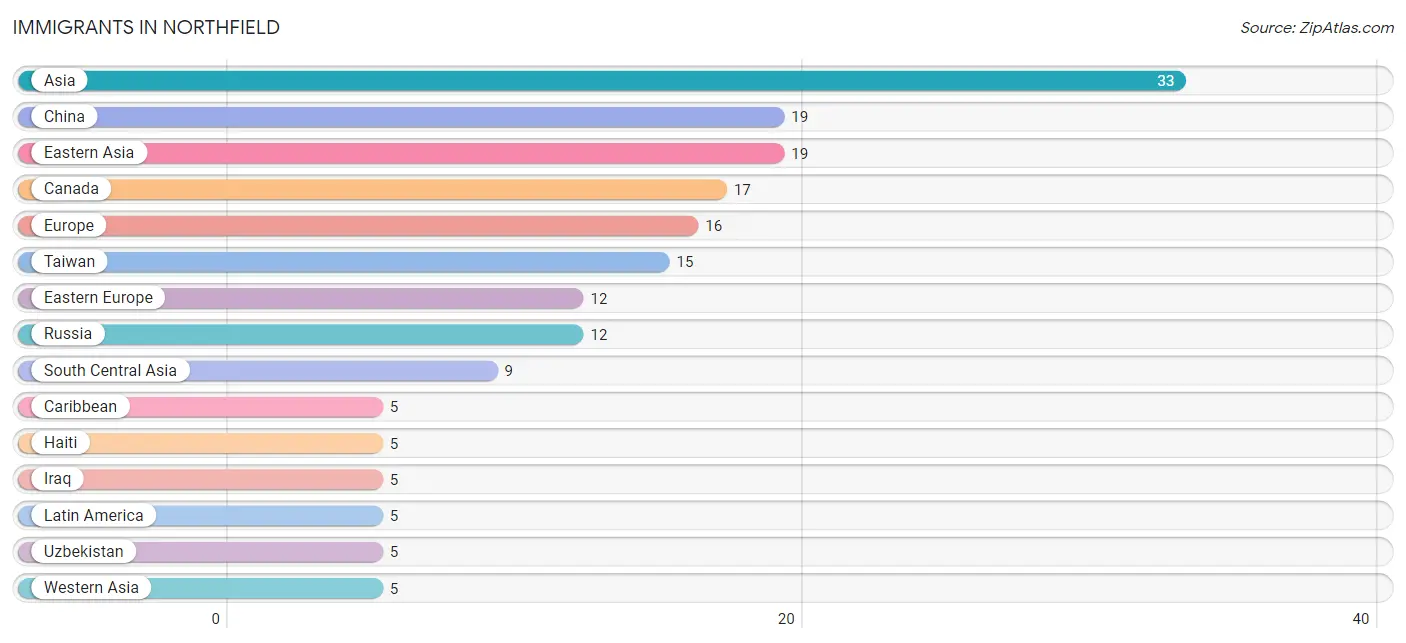
Immigrants in Northfield
The most numerous immigrant groups reported in Northfield came from Asia (33 | 0.7%), China (19 | 0.4%), Eastern Asia (19 | 0.4%), Canada (17 | 0.4%), and Europe (16 | 0.4%), together accounting for 2.4% of all Northfield residents.
| Immigration Origin | # Population | % Population |
| Asia | 33 | 0.7% |
| Canada | 17 | 0.4% |
| Caribbean | 5 | 0.1% |
| China | 19 | 0.4% |
| Eastern Asia | 19 | 0.4% |
| Eastern Europe | 12 | 0.3% |
| Europe | 16 | 0.4% |
| Haiti | 5 | 0.1% |
| India | 4 | 0.1% |
| Iraq | 5 | 0.1% |
| Latin America | 5 | 0.1% |
| Northern Europe | 4 | 0.1% |
| Russia | 12 | 0.3% |
| South Central Asia | 9 | 0.2% |
| Taiwan | 15 | 0.3% |
| Uzbekistan | 5 | 0.1% |
| Western Asia | 5 | 0.1% | View All 17 Rows |
Sex and Age in Northfield
Sex and Age in Northfield
The most populous age groups in Northfield are 20 to 24 Years (635 | 26.6%) for men and 20 to 24 Years (490 | 24.5%) for women.
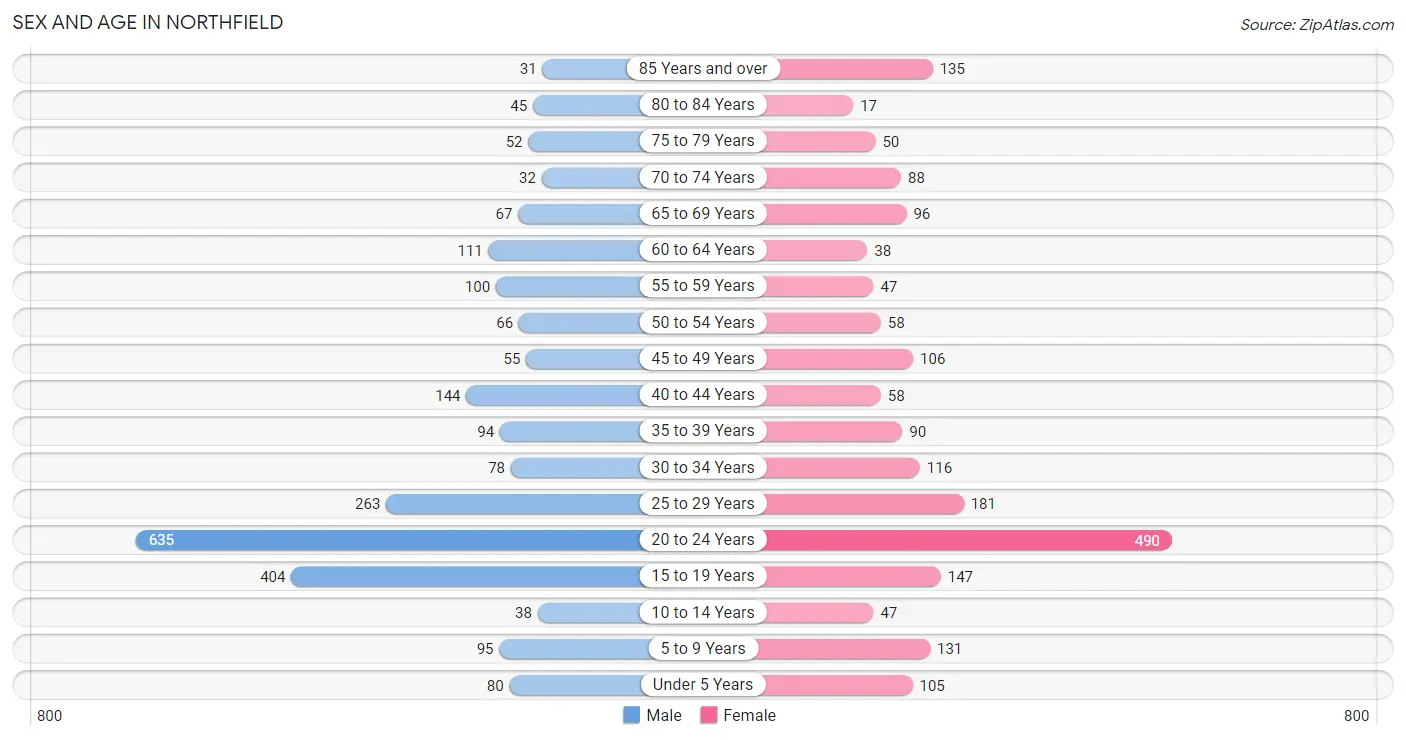
| Age Bracket | Male | Female |
| Under 5 Years | 80 (3.4%) | 105 (5.2%) |
| 5 to 9 Years | 95 (4.0%) | 131 (6.6%) |
| 10 to 14 Years | 38 (1.6%) | 47 (2.4%) |
| 15 to 19 Years | 404 (16.9%) | 147 (7.3%) |
| 20 to 24 Years | 635 (26.6%) | 490 (24.5%) |
| 25 to 29 Years | 263 (11.0%) | 181 (9.0%) |
| 30 to 34 Years | 78 (3.3%) | 116 (5.8%) |
| 35 to 39 Years | 94 (3.9%) | 90 (4.5%) |
| 40 to 44 Years | 144 (6.0%) | 58 (2.9%) |
| 45 to 49 Years | 55 (2.3%) | 106 (5.3%) |
| 50 to 54 Years | 66 (2.8%) | 58 (2.9%) |
| 55 to 59 Years | 100 (4.2%) | 47 (2.4%) |
| 60 to 64 Years | 111 (4.6%) | 38 (1.9%) |
| 65 to 69 Years | 67 (2.8%) | 96 (4.8%) |
| 70 to 74 Years | 32 (1.3%) | 88 (4.4%) |
| 75 to 79 Years | 52 (2.2%) | 50 (2.5%) |
| 80 to 84 Years | 45 (1.9%) | 17 (0.9%) |
| 85 Years and over | 31 (1.3%) | 135 (6.8%) |
| Total | 2,390 (100.0%) | 2,000 (100.0%) |
Families and Households in Northfield
Median Family Size in Northfield
The median family size in Northfield is 3.04 persons per family, with married-couple families (485 | 80.8%) accounting for the largest median family size of 3.11 persons per family. On the other hand, single female/mother families (76 | 12.7%) represent the smallest median family size with 2.63 persons per family.
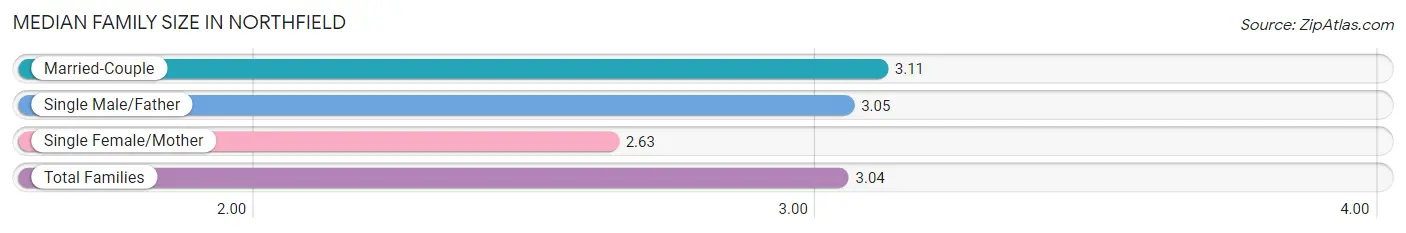
| Family Type | # Families | Family Size |
| Married-Couple | 485 (80.8%) | 3.11 |
| Single Male/Father | 39 (6.5%) | 3.05 |
| Single Female/Mother | 76 (12.7%) | 2.63 |
| Total Families | 600 (100.0%) | 3.04 |
Median Household Size in Northfield
The median household size in Northfield is 2.52 persons per household, with single female/mother households (76 | 6.6%) accounting for the largest median household size of 3.57 persons per household. non-family households (544 | 47.5%) represent the smallest median household size with 1.81 persons per household.
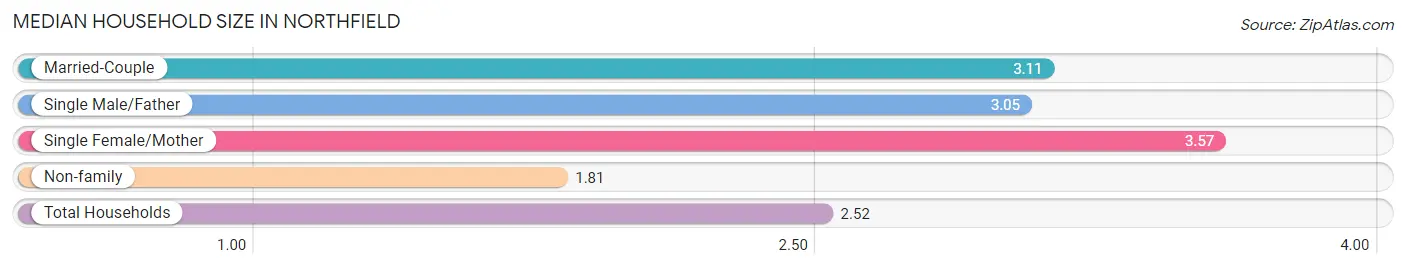
| Household Type | # Households | Household Size |
| Married-Couple | 485 (42.4%) | 3.11 |
| Single Male/Father | 39 (3.4%) | 3.05 |
| Single Female/Mother | 76 (6.6%) | 3.57 |
| Non-family | 544 (47.5%) | 1.81 |
| Total Households | 1,144 (100.0%) | 2.52 |
Household Size by Marriage Status in Northfield
Out of a total of 1,144 households in Northfield, 600 (52.4%) are family households, while 544 (47.5%) are nonfamily households. The most numerous type of family households are 2-person households, comprising 250, and the most common type of nonfamily households are 1-person households, comprising 381.
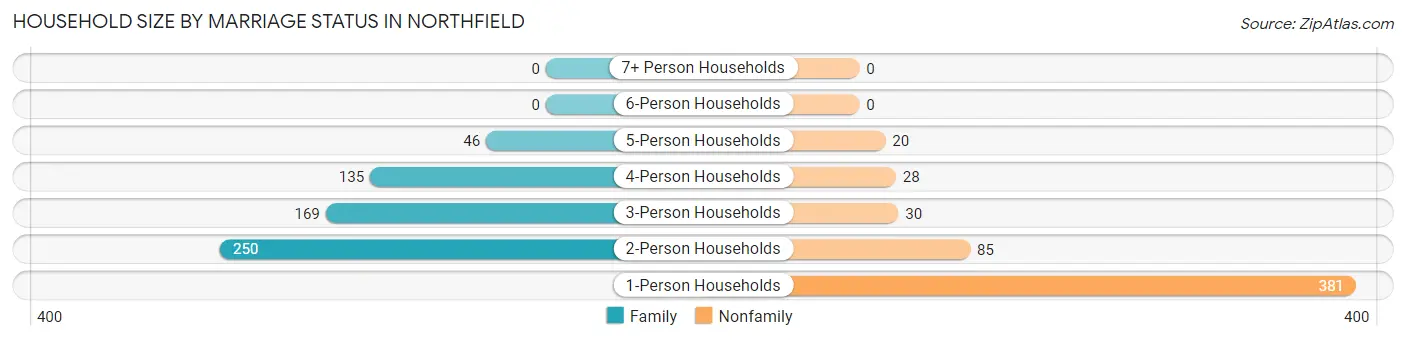
| Household Size | Family Households | Nonfamily Households |
| 1-Person Households | - | 381 (33.3%) |
| 2-Person Households | 250 (21.8%) | 85 (7.4%) |
| 3-Person Households | 169 (14.8%) | 30 (2.6%) |
| 4-Person Households | 135 (11.8%) | 28 (2.5%) |
| 5-Person Households | 46 (4.0%) | 20 (1.8%) |
| 6-Person Households | 0 (0.0%) | 0 (0.0%) |
| 7+ Person Households | 0 (0.0%) | 0 (0.0%) |
| Total | 600 (52.4%) | 544 (47.5%) |
Female Fertility in Northfield
Fertility by Age in Northfield
Average fertility rate in Northfield is 29.0 births per 1,000 women. Women in the age bracket of 20 to 34 years have the highest fertility rate with 43.0 births per 1,000 women. Women in the age bracket of 20 to 34 years acount for 100.0% of all women with births.
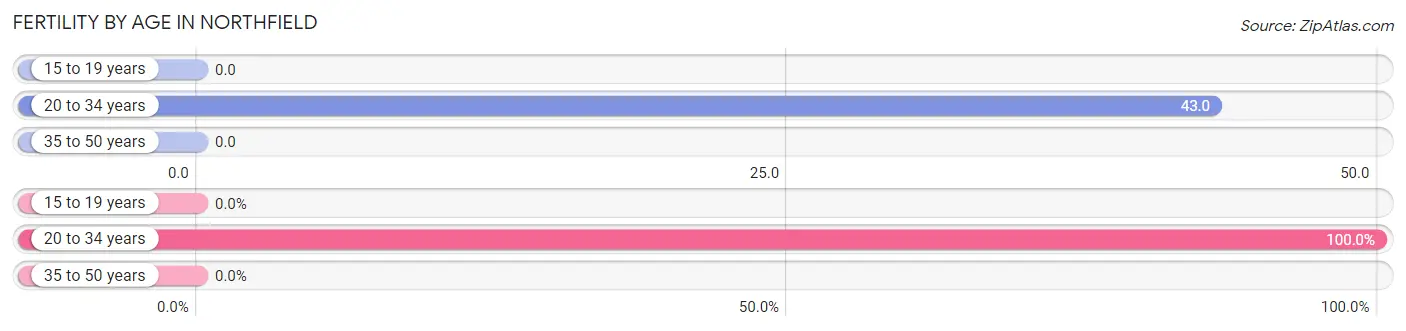
| Age Bracket | Women with Births | Births / 1,000 Women |
| 15 to 19 years | 0 (0.0%) | 0.0 |
| 20 to 34 years | 34 (100.0%) | 43.0 |
| 35 to 50 years | 0 (0.0%) | 0.0 |
| Total | 34 (100.0%) | 29.0 |
Fertility by Age by Marriage Status in Northfield
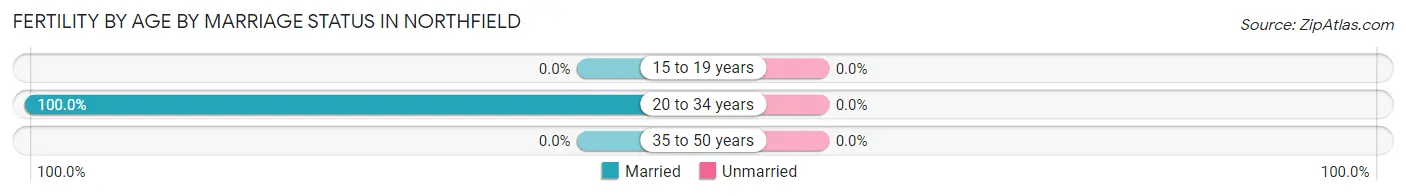
| Age Bracket | Married | Unmarried |
| 15 to 19 years | 0 (0.0%) | 0 (0.0%) |
| 20 to 34 years | 34 (100.0%) | 0 (0.0%) |
| 35 to 50 years | 0 (0.0%) | 0 (0.0%) |
| Total | 34 (100.0%) | 0 (0.0%) |
Fertility by Education in Northfield
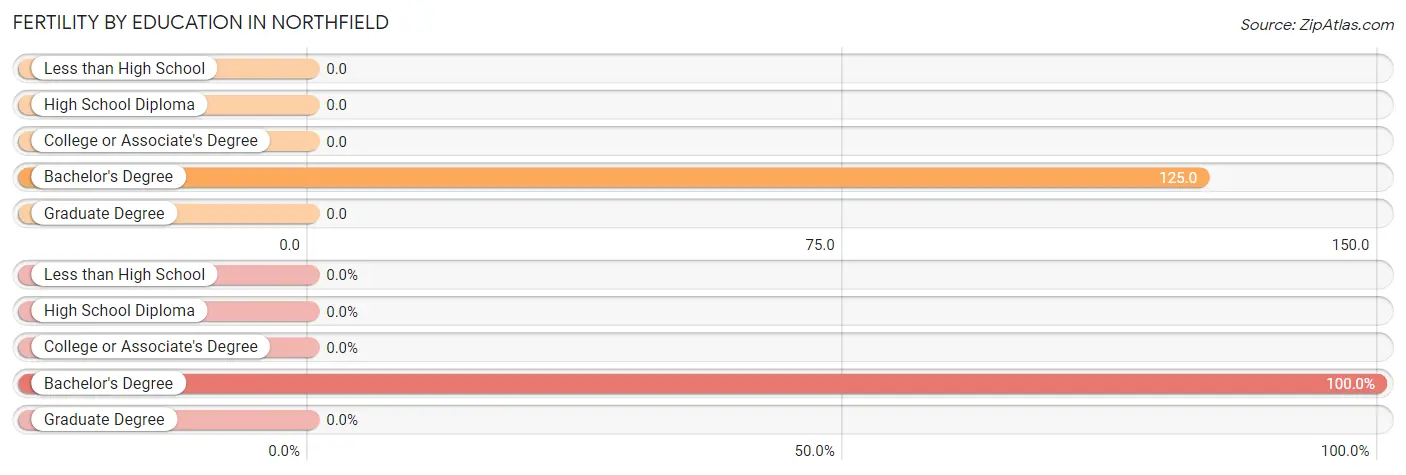
| Educational Attainment | Women with Births | Births / 1,000 Women |
| Less than High School | 0 (0.0%) | 0.0 |
| High School Diploma | 0 (0.0%) | 0.0 |
| College or Associate's Degree | 0 (0.0%) | 0.0 |
| Bachelor's Degree | 34 (100.0%) | 125.0 |
| Graduate Degree | 0 (0.0%) | 0.0 |
| Total | 34 (100.0%) | 29.0 |
Fertility by Education by Marriage Status in Northfield
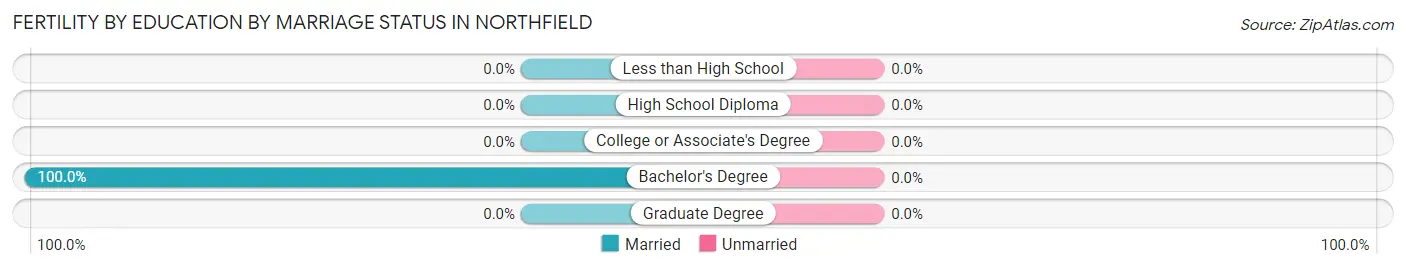
| Educational Attainment | Married | Unmarried |
| Less than High School | 0 (0.0%) | 0 (0.0%) |
| High School Diploma | 0 (0.0%) | 0 (0.0%) |
| College or Associate's Degree | 0 (0.0%) | 0 (0.0%) |
| Bachelor's Degree | 34 (100.0%) | 0 (0.0%) |
| Graduate Degree | 0 (0.0%) | 0 (0.0%) |
| Total | 34 (100.0%) | 0 (0.0%) |
Income in Northfield
Income Overview in Northfield
Per Capita Income in Northfield is $25,386, while median incomes of families and households are $83,333 and $65,926 respectively.
| Characteristic | Number | Measure |
| Per Capita Income | 4,390 | $25,386 |
| Median Family Income | 600 | $83,333 |
| Mean Family Income | 600 | $82,182 |
| Median Household Income | 1,144 | $65,926 |
| Mean Household Income | 1,144 | $80,118 |
| Income Deficit | 600 | $0 |
| Wage / Income Gap (%) | 4,390 | 7.96% |
| Wage / Income Gap ($) | 4,390 | 92.04¢ per $1 |
| Gini / Inequality Index | 4,390 | 0.40 |
Earnings by Sex in Northfield
Average Earnings in Northfield are $27,819, $27,802 for men and $30,208 for women, a difference of 8.0%.
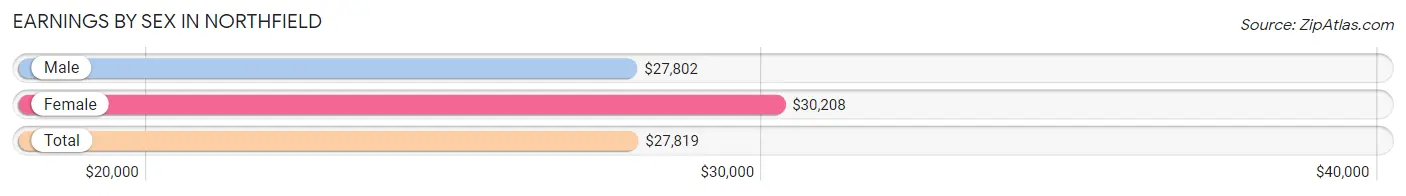
| Sex | Number | Average Earnings |
| Male | 1,613 (58.3%) | $27,802 |
| Female | 1,152 (41.7%) | $30,208 |
| Total | 2,765 (100.0%) | $27,819 |
Earnings by Sex by Income Bracket in Northfield
The most common earnings brackets in Northfield are $5,000 to $7,499 for men (227 | 14.1%) and $2,500 to $4,999 for women (152 | 13.2%).
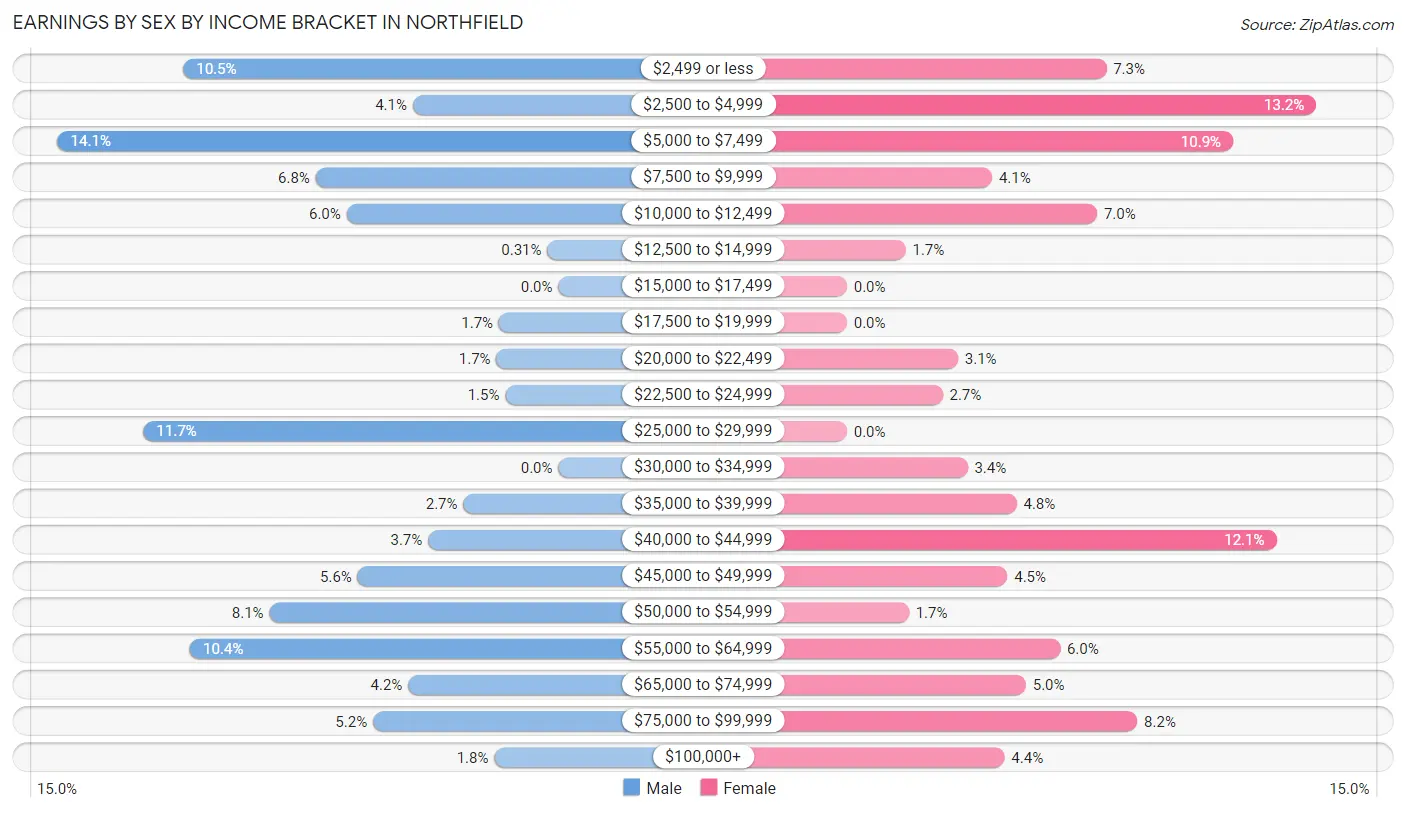
| Income | Male | Female |
| $2,499 or less | 170 (10.5%) | 84 (7.3%) |
| $2,500 to $4,999 | 66 (4.1%) | 152 (13.2%) |
| $5,000 to $7,499 | 227 (14.1%) | 125 (10.8%) |
| $7,500 to $9,999 | 110 (6.8%) | 47 (4.1%) |
| $10,000 to $12,499 | 96 (5.9%) | 81 (7.0%) |
| $12,500 to $14,999 | 5 (0.3%) | 19 (1.7%) |
| $15,000 to $17,499 | 0 (0.0%) | 0 (0.0%) |
| $17,500 to $19,999 | 27 (1.7%) | 0 (0.0%) |
| $20,000 to $22,499 | 28 (1.7%) | 36 (3.1%) |
| $22,500 to $24,999 | 24 (1.5%) | 31 (2.7%) |
| $25,000 to $29,999 | 188 (11.7%) | 0 (0.0%) |
| $30,000 to $34,999 | 0 (0.0%) | 39 (3.4%) |
| $35,000 to $39,999 | 43 (2.7%) | 55 (4.8%) |
| $40,000 to $44,999 | 59 (3.7%) | 139 (12.1%) |
| $45,000 to $49,999 | 91 (5.6%) | 52 (4.5%) |
| $50,000 to $54,999 | 131 (8.1%) | 20 (1.7%) |
| $55,000 to $64,999 | 167 (10.3%) | 69 (6.0%) |
| $65,000 to $74,999 | 68 (4.2%) | 58 (5.0%) |
| $75,000 to $99,999 | 84 (5.2%) | 94 (8.2%) |
| $100,000+ | 29 (1.8%) | 51 (4.4%) |
| Total | 1,613 (100.0%) | 1,152 (100.0%) |
Earnings by Sex by Educational Attainment in Northfield
Average earnings in Northfield are $49,310 for men and $42,474 for women, a difference of 13.9%. Men with an educational attainment of bachelor's degree enjoy the highest average annual earnings of $53,782, while those with high school diploma education earn the least with $43,028. Women with an educational attainment of bachelor's degree earn the most with the average annual earnings of $55,625, while those with graduate degree education have the smallest earnings of $46,250.
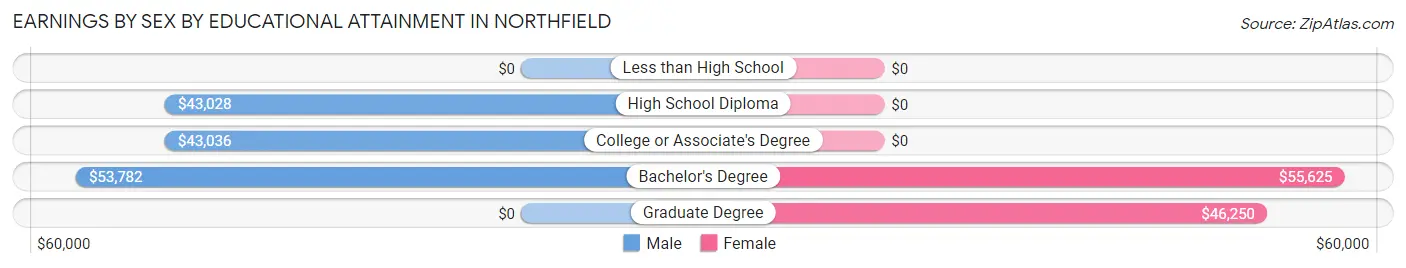
| Educational Attainment | Male Income | Female Income |
| Less than High School | - | - |
| High School Diploma | $43,028 | $0 |
| College or Associate's Degree | $43,036 | $0 |
| Bachelor's Degree | $53,782 | $55,625 |
| Graduate Degree | - | - |
| Total | $49,310 | $42,474 |
Family Income in Northfield
Family Income Brackets in Northfield
According to the Northfield family income data, there are 180 families falling into the $75,000 to $99,999 income range, which is the most common income bracket and makes up 30.0% of all families. Conversely, the $10,000 to $14,999 income bracket is the least frequent group with only 17 families (2.8%) belonging to this category.
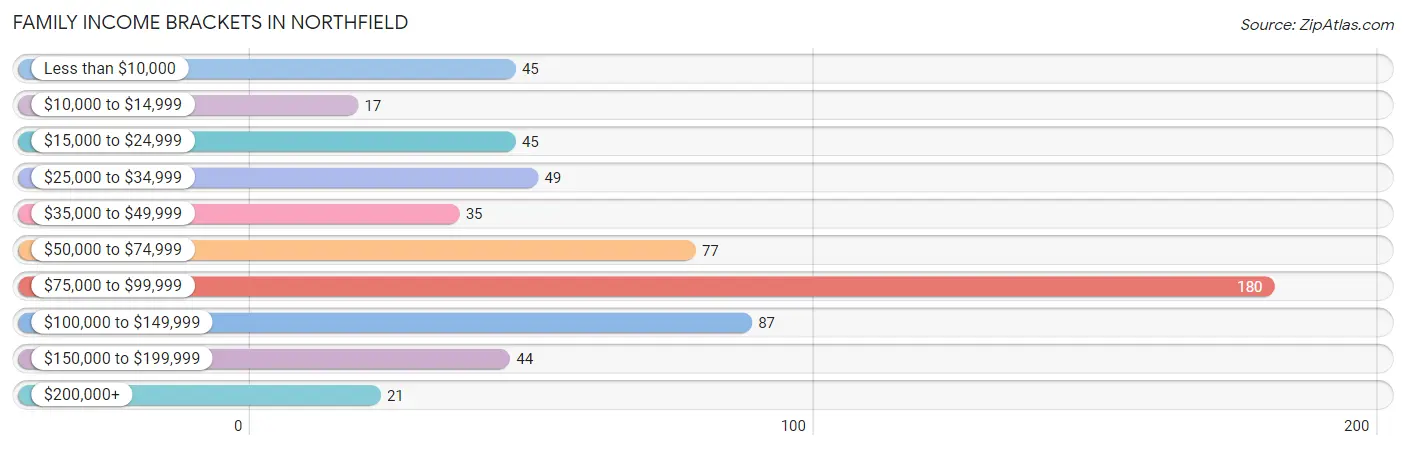
| Income Bracket | # Families | % Families |
| Less than $10,000 | 45 | 7.5% |
| $10,000 to $14,999 | 17 | 2.8% |
| $15,000 to $24,999 | 45 | 7.5% |
| $25,000 to $34,999 | 49 | 8.2% |
| $35,000 to $49,999 | 35 | 5.8% |
| $50,000 to $74,999 | 77 | 12.8% |
| $75,000 to $99,999 | 180 | 30.0% |
| $100,000 to $149,999 | 87 | 14.5% |
| $150,000 to $199,999 | 44 | 7.3% |
| $200,000+ | 21 | 3.5% |
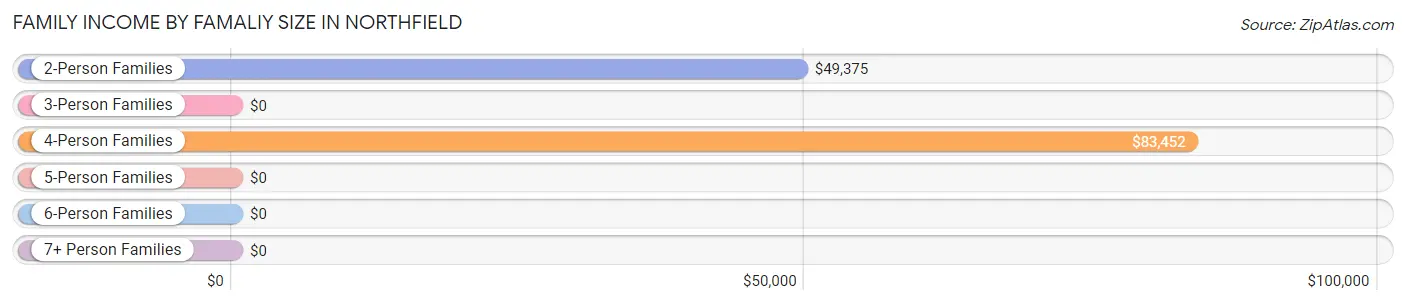
Family Income by Famaliy Size in Northfield
4-person families (74 | 12.3%) account for the highest median family income in Northfield with $83,452 per family, while 2-person families (256 | 42.7%) have the highest median income of $24,688 per family member.
| Income Bracket | # Families | Median Income |
| 2-Person Families | 256 (42.7%) | $49,375 |
| 3-Person Families | 224 (37.3%) | $0 |
| 4-Person Families | 74 (12.3%) | $83,452 |
| 5-Person Families | 46 (7.7%) | $0 |
| 6-Person Families | 0 (0.0%) | $0 |
| 7+ Person Families | 0 (0.0%) | $0 |
| Total | 600 (100.0%) | $83,333 |
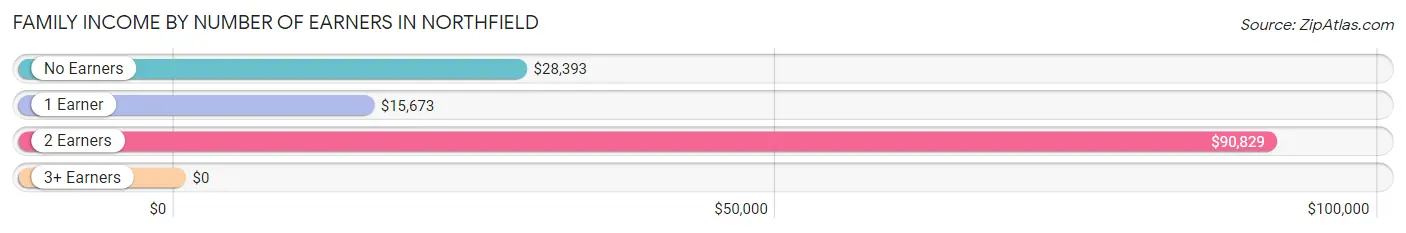
Family Income by Number of Earners in Northfield
| Number of Earners | # Families | Median Income |
| No Earners | 131 (21.8%) | $28,393 |
| 1 Earner | 69 (11.5%) | $15,673 |
| 2 Earners | 379 (63.2%) | $90,829 |
| 3+ Earners | 21 (3.5%) | $0 |
| Total | 600 (100.0%) | $83,333 |
Household Income in Northfield
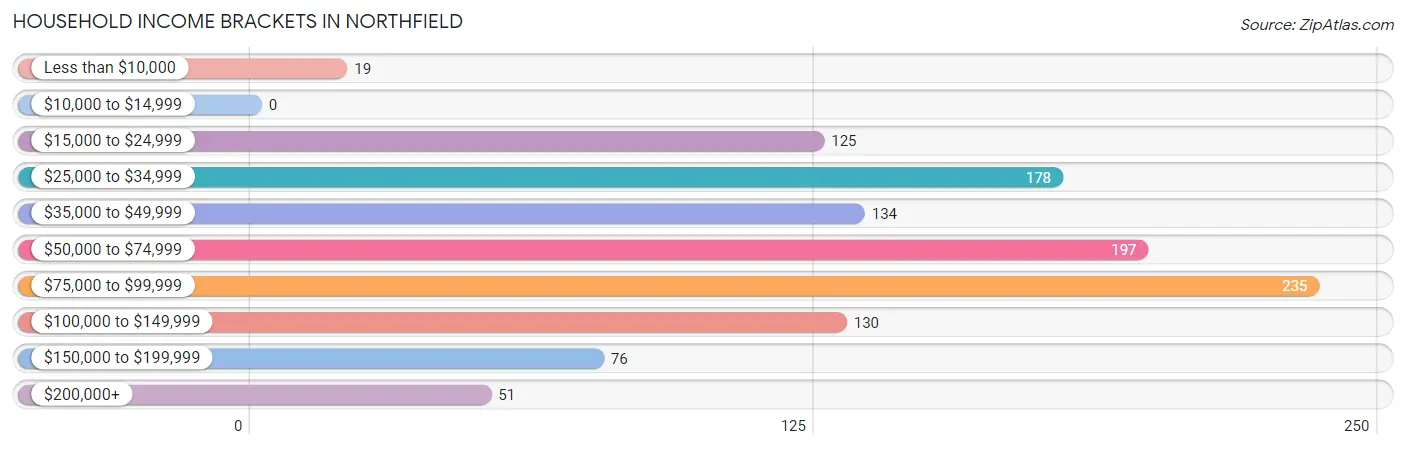
Household Income Brackets in Northfield
With 235 households falling in the category, the $75,000 to $99,999 income range is the most frequent in Northfield, accounting for 20.5% of all households.
| Income Bracket | # Households | % Households |
| Less than $10,000 | 19 | 1.7% |
| $10,000 to $14,999 | 0 | 0.0% |
| $15,000 to $24,999 | 125 | 10.9% |
| $25,000 to $34,999 | 178 | 15.6% |
| $35,000 to $49,999 | 134 | 11.7% |
| $50,000 to $74,999 | 197 | 17.2% |
| $75,000 to $99,999 | 235 | 20.5% |
| $100,000 to $149,999 | 130 | 11.4% |
| $150,000 to $199,999 | 76 | 6.6% |
| $200,000+ | 51 | 4.5% |
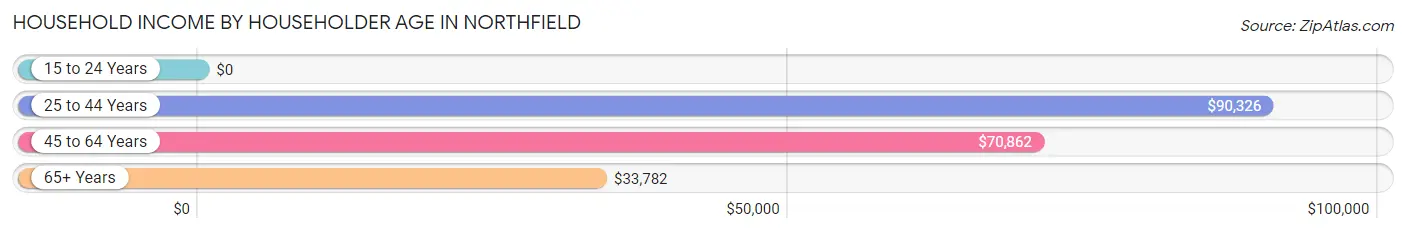
Household Income by Householder Age in Northfield
The median household income in Northfield is $65,926, with the highest median household income of $90,326 found in the 25 to 44 years age bracket for the primary householder. A total of 458 households (40.0%) fall into this category. Meanwhile, the 15 to 24 years age bracket for the primary householder has the lowest median household income of $0, with 54 households (4.7%) in this group.
| Income Bracket | # Households | Median Income |
| 15 to 24 Years | 54 (4.7%) | $0 |
| 25 to 44 Years | 458 (40.0%) | $90,326 |
| 45 to 64 Years | 302 (26.4%) | $70,862 |
| 65+ Years | 330 (28.8%) | $33,782 |
| Total | 1,144 (100.0%) | $65,926 |
Poverty in Northfield
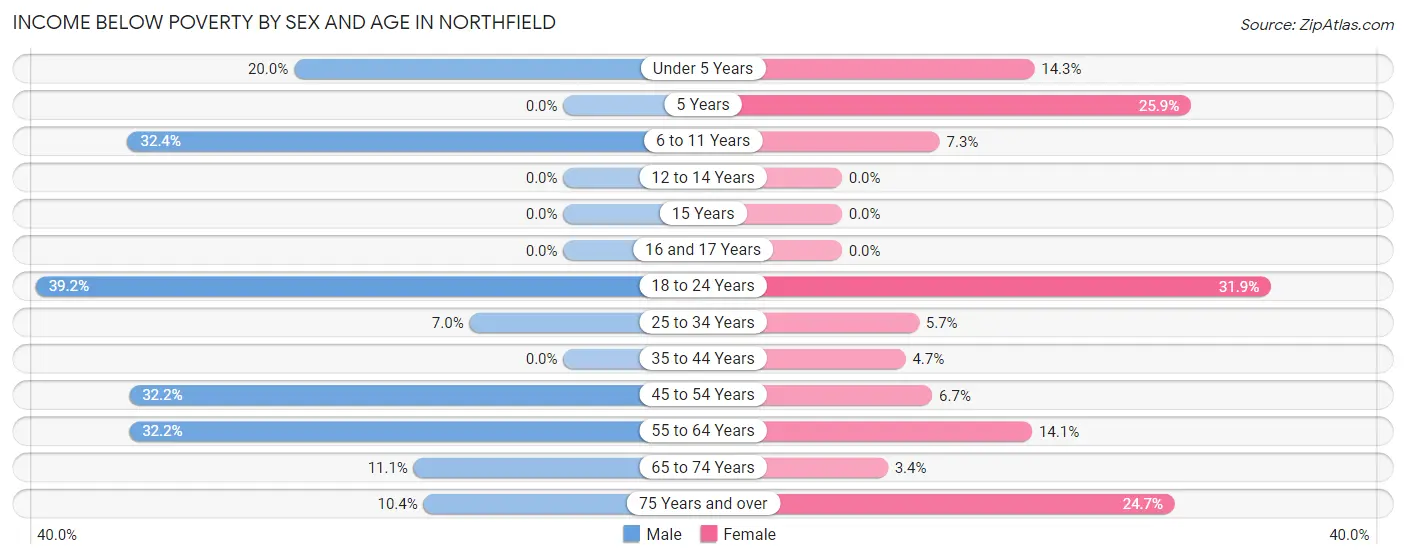
Income Below Poverty by Sex and Age in Northfield
With 18.2% poverty level for males and 12.8% for females among the residents of Northfield, 18 to 24 year old males and 18 to 24 year old females are the most vulnerable to poverty, with 85 males (39.2%) and 58 females (31.9%) in their respective age groups living below the poverty level.
| Age Bracket | Male | Female |
| Under 5 Years | 16 (20.0%) | 15 (14.3%) |
| 5 Years | 0 (0.0%) | 14 (25.9%) |
| 6 to 11 Years | 22 (32.4%) | 9 (7.3%) |
| 12 to 14 Years | 0 (0.0%) | 0 (0.0%) |
| 15 Years | 0 (0.0%) | 0 (0.0%) |
| 16 and 17 Years | 0 (0.0%) | 0 (0.0%) |
| 18 to 24 Years | 85 (39.2%) | 58 (31.9%) |
| 25 to 34 Years | 20 (7.0%) | 17 (5.7%) |
| 35 to 44 Years | 0 (0.0%) | 7 (4.7%) |
| 45 to 54 Years | 39 (32.2%) | 11 (6.7%) |
| 55 to 64 Years | 68 (32.2%) | 12 (14.1%) |
| 65 to 74 Years | 11 (11.1%) | 6 (3.4%) |
| 75 Years and over | 11 (10.4%) | 44 (24.7%) |
| Total | 272 (18.2%) | 193 (12.8%) |
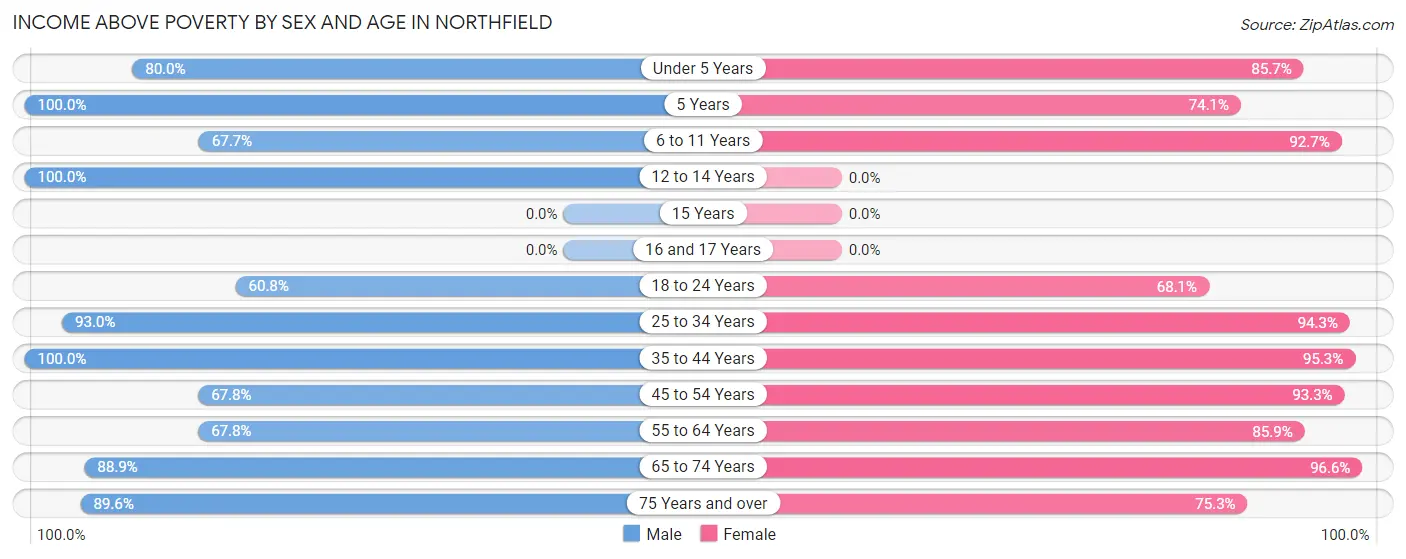
Income Above Poverty by Sex and Age in Northfield
According to the poverty statistics in Northfield, males aged 5 years and females aged 65 to 74 years are the age groups that are most secure financially, with 100.0% of males and 96.6% of females in these age groups living above the poverty line.
| Age Bracket | Male | Female |
| Under 5 Years | 64 (80.0%) | 90 (85.7%) |
| 5 Years | 27 (100.0%) | 40 (74.1%) |
| 6 to 11 Years | 46 (67.6%) | 115 (92.7%) |
| 12 to 14 Years | 38 (100.0%) | 0 (0.0%) |
| 15 Years | 0 (0.0%) | 0 (0.0%) |
| 16 and 17 Years | 0 (0.0%) | 0 (0.0%) |
| 18 to 24 Years | 132 (60.8%) | 124 (68.1%) |
| 25 to 34 Years | 267 (93.0%) | 280 (94.3%) |
| 35 to 44 Years | 238 (100.0%) | 141 (95.3%) |
| 45 to 54 Years | 82 (67.8%) | 153 (93.3%) |
| 55 to 64 Years | 143 (67.8%) | 73 (85.9%) |
| 65 to 74 Years | 88 (88.9%) | 170 (96.6%) |
| 75 Years and over | 95 (89.6%) | 134 (75.3%) |
| Total | 1,220 (81.8%) | 1,320 (87.2%) |
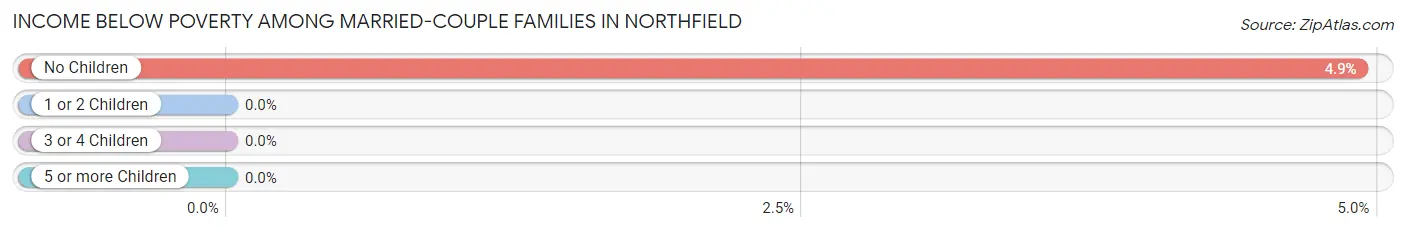
Income Below Poverty Among Married-Couple Families in Northfield
The poverty statistics for married-couple families in Northfield show that 2.5% or 12 of the total 485 families live below the poverty line. Families with no children have the highest poverty rate of 4.9%, comprising of 12 families. On the other hand, families with 1 or 2 children have the lowest poverty rate of 0.0%, which includes 0 families.
| Children | Above Poverty | Below Poverty |
| No Children | 232 (95.1%) | 12 (4.9%) |
| 1 or 2 Children | 195 (100.0%) | 0 (0.0%) |
| 3 or 4 Children | 46 (100.0%) | 0 (0.0%) |
| 5 or more Children | 0 (0.0%) | 0 (0.0%) |
| Total | 473 (97.5%) | 12 (2.5%) |
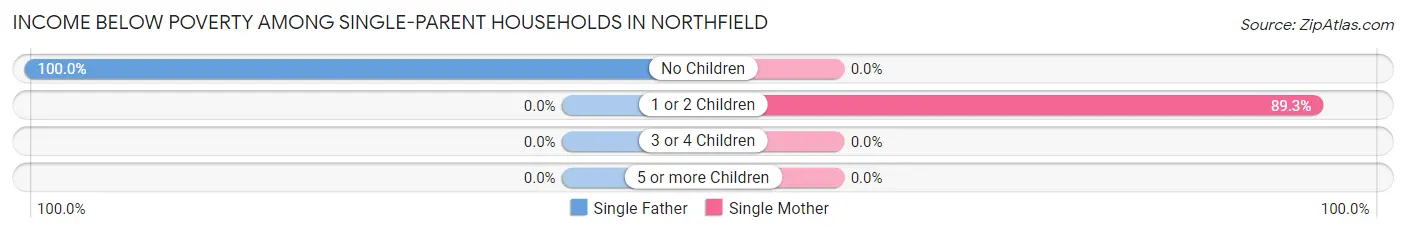
Income Below Poverty Among Single-Parent Households in Northfield
According to the poverty data in Northfield, 100.0% or 39 single-father households and 65.8% or 50 single-mother households are living below the poverty line. Among single-father households, those with no children have the highest poverty rate, with 39 households (100.0%) experiencing poverty. Likewise, among single-mother households, those with 1 or 2 children have the highest poverty rate, with 50 households (89.3%) falling below the poverty line.
| Children | Single Father | Single Mother |
| No Children | 39 (100.0%) | 0 (0.0%) |
| 1 or 2 Children | 0 (0.0%) | 50 (89.3%) |
| 3 or 4 Children | 0 (0.0%) | 0 (0.0%) |
| 5 or more Children | 0 (0.0%) | 0 (0.0%) |
| Total | 39 (100.0%) | 50 (65.8%) |
Income Below Poverty Among Married-Couple vs Single-Parent Households in Northfield
The poverty data for Northfield shows that 12 of the married-couple family households (2.5%) and 89 of the single-parent households (77.4%) are living below the poverty level. Within the married-couple family households, those with no children have the highest poverty rate, with 12 households (4.9%) falling below the poverty line. Among the single-parent households, those with 1 or 2 children have the highest poverty rate, with 50 household (89.3%) living below poverty.
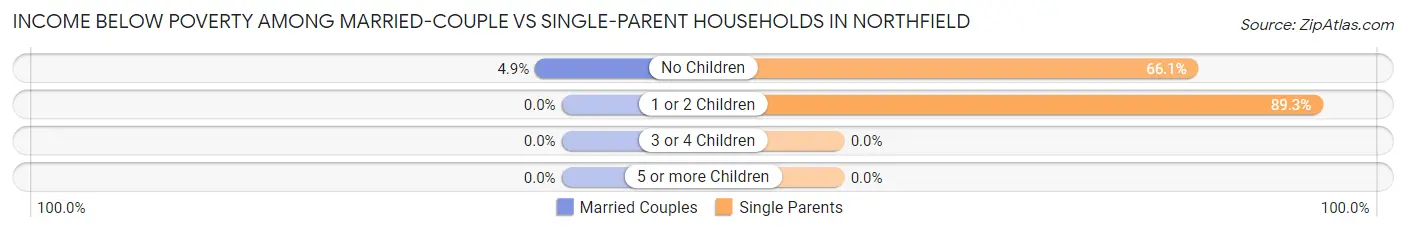
| Children | Married-Couple Families | Single-Parent Households |
| No Children | 12 (4.9%) | 39 (66.1%) |
| 1 or 2 Children | 0 (0.0%) | 50 (89.3%) |
| 3 or 4 Children | 0 (0.0%) | 0 (0.0%) |
| 5 or more Children | 0 (0.0%) | 0 (0.0%) |
| Total | 12 (2.5%) | 89 (77.4%) |
Employment Characteristics in Northfield
Employment by Class of Employer in Northfield
Among the 2,069 employed individuals in Northfield, private company employees (1,300 | 62.8%), not-for-profit organizations (244 | 11.8%), and local government employees (214 | 10.3%) make up the most common classes of employment.
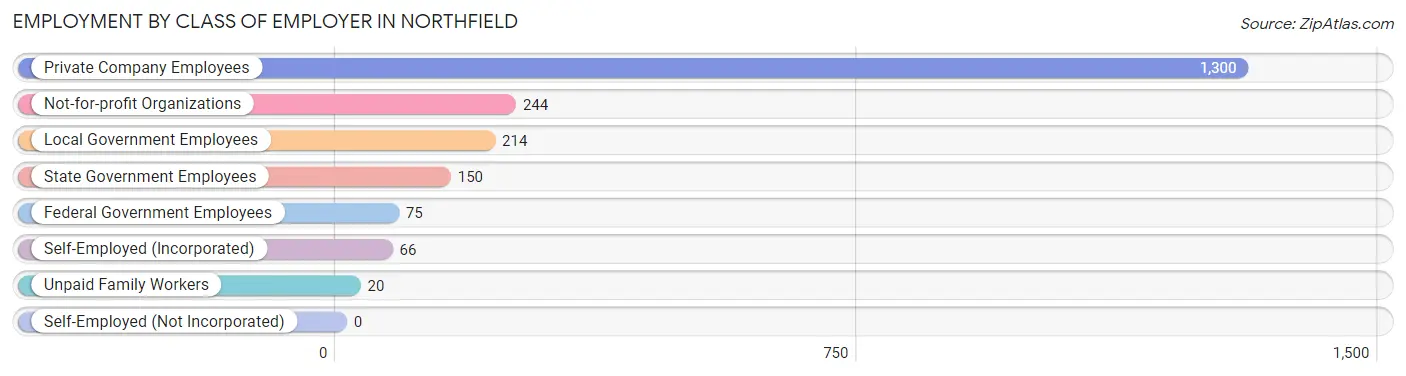
| Employer Class | # Employees | % Employees |
| Private Company Employees | 1,300 | 62.8% |
| Self-Employed (Incorporated) | 66 | 3.2% |
| Self-Employed (Not Incorporated) | 0 | 0.0% |
| Not-for-profit Organizations | 244 | 11.8% |
| Local Government Employees | 214 | 10.3% |
| State Government Employees | 150 | 7.2% |
| Federal Government Employees | 75 | 3.6% |
| Unpaid Family Workers | 20 | 1.0% |
| Total | 2,069 | 100.0% |
Employment Status by Age in Northfield
According to the labor force statistics for Northfield, out of the total population over 16 years of age (3,894), 56.6% or 2,204 individuals are in the labor force, with 2.0% or 44 of them unemployed. The age group with the highest labor force participation rate is 25 to 29 years, with 97.1% or 431 individuals in the labor force. Within the labor force, the 25 to 29 years age range has the highest percentage of unemployed individuals, with 10.2% or 44 of them being unemployed.
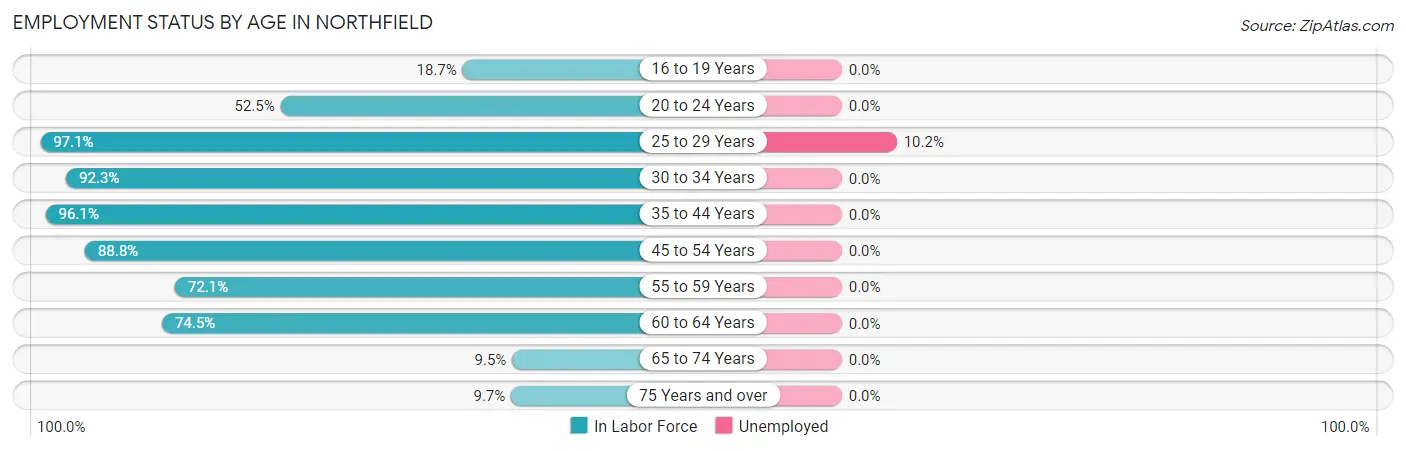
| Age Bracket | In Labor Force | Unemployed |
| 16 to 19 Years | 103 (18.7%) | 0 (0.0%) |
| 20 to 24 Years | 591 (52.5%) | 0 (0.0%) |
| 25 to 29 Years | 431 (97.1%) | 44 (10.2%) |
| 30 to 34 Years | 179 (92.3%) | 0 (0.0%) |
| 35 to 44 Years | 371 (96.1%) | 0 (0.0%) |
| 45 to 54 Years | 253 (88.8%) | 0 (0.0%) |
| 55 to 59 Years | 106 (72.1%) | 0 (0.0%) |
| 60 to 64 Years | 111 (74.5%) | 0 (0.0%) |
| 65 to 74 Years | 27 (9.5%) | 0 (0.0%) |
| 75 Years and over | 32 (9.7%) | 0 (0.0%) |
| Total | 2,204 (56.6%) | 44 (2.0%) |
Employment Status by Educational Attainment in Northfield
According to labor force statistics for Northfield, 90.4% of individuals (1,451) out of the total population between 25 and 64 years of age (1,605) are in the labor force, with 3.0% or 44 of them being unemployed. The group with the highest labor force participation rate are those with the educational attainment of bachelor's degree or higher, with 100.0% or 697 individuals in the labor force. Within the labor force, individuals with bachelor's degree or higher education have the highest percentage of unemployment, with 6.3% or 44 of them being unemployed.
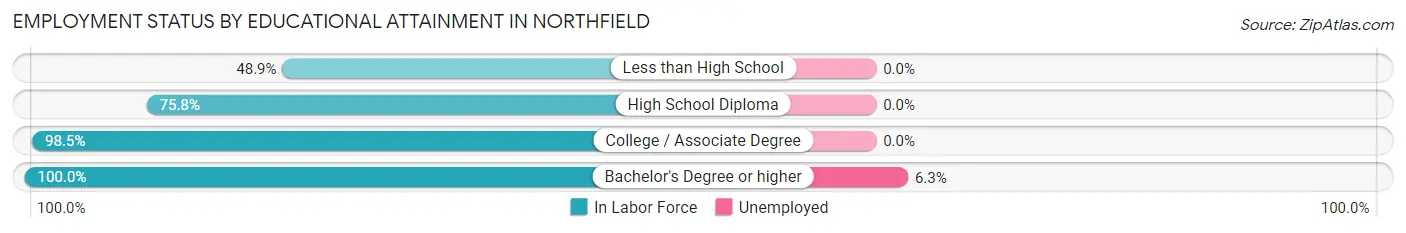
| Educational Attainment | In Labor Force | Unemployed |
| Less than High School | 45 (48.9%) | 0 (0.0%) |
| High School Diploma | 316 (75.8%) | 0 (0.0%) |
| College / Associate Degree | 393 (98.5%) | 0 (0.0%) |
| Bachelor's Degree or higher | 697 (100.0%) | 44 (6.3%) |
| Total | 1,451 (90.4%) | 48 (3.0%) |
Employment Occupations by Sex in Northfield
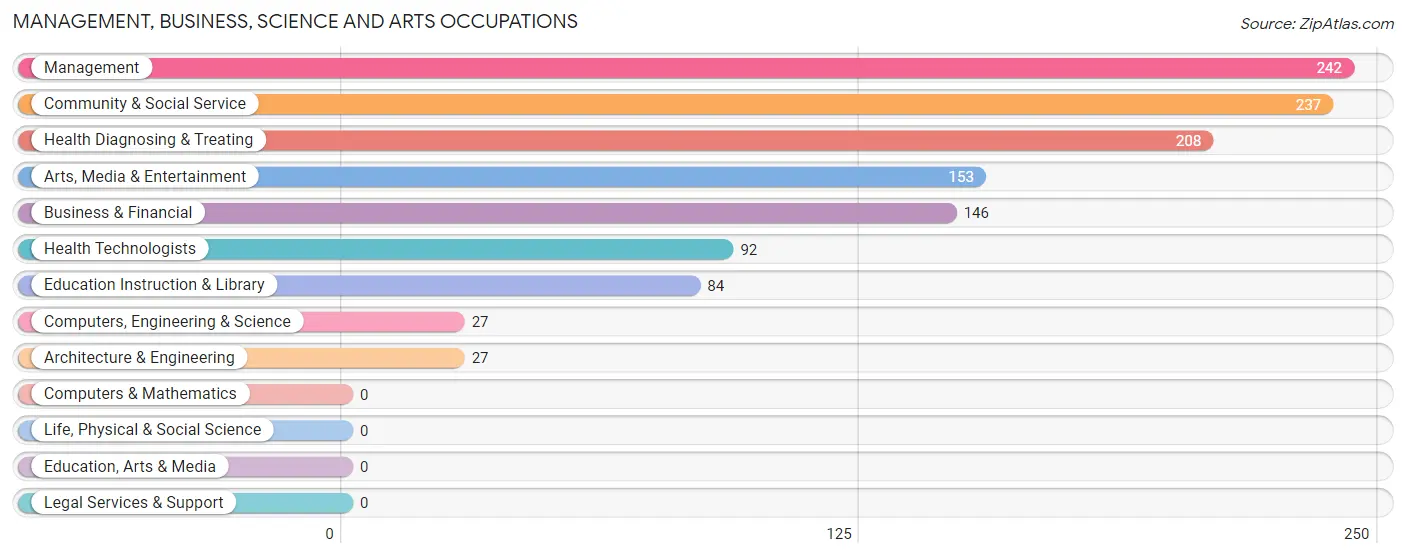
Management, Business, Science and Arts Occupations
The most common Management, Business, Science and Arts occupations in Northfield are Management (242 | 11.3%), Community & Social Service (237 | 11.0%), Health Diagnosing & Treating (208 | 9.7%), Arts, Media & Entertainment (153 | 7.1%), and Business & Financial (146 | 6.8%).
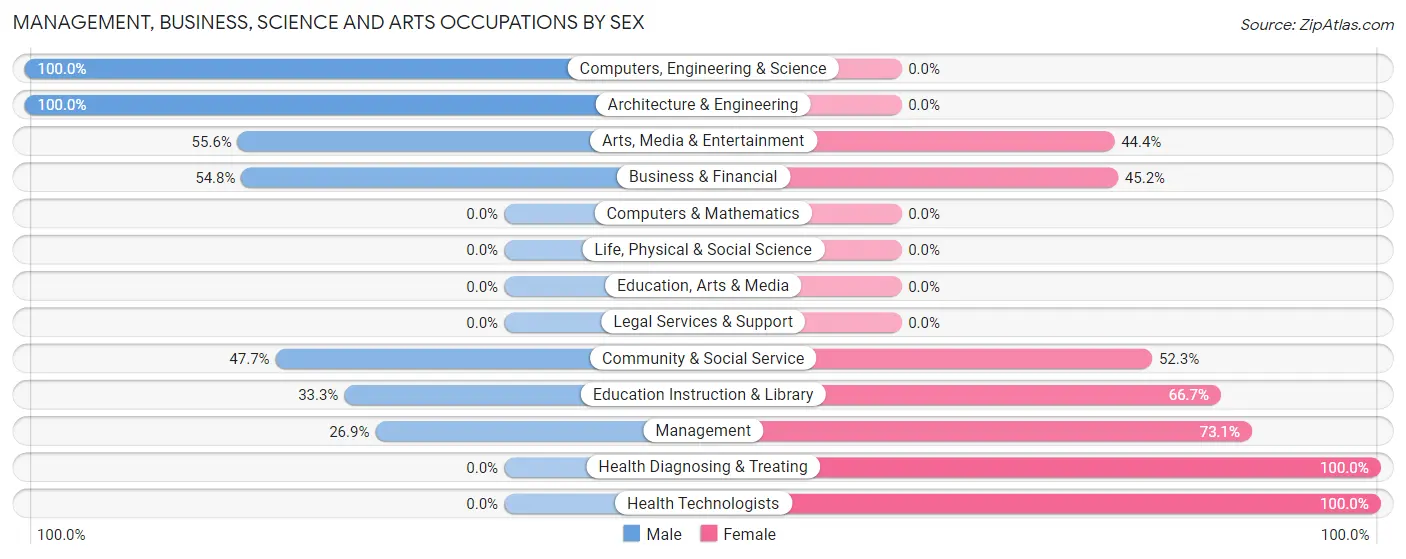
Management, Business, Science and Arts Occupations by Sex
Within the Management, Business, Science and Arts occupations in Northfield, the most male-oriented occupations are Computers, Engineering & Science (100.0%), Architecture & Engineering (100.0%), and Arts, Media & Entertainment (55.6%), while the most female-oriented occupations are Health Diagnosing & Treating (100.0%), Health Technologists (100.0%), and Management (73.1%).
| Occupation | Male | Female |
| Management | 65 (26.9%) | 177 (73.1%) |
| Business & Financial | 80 (54.8%) | 66 (45.2%) |
| Computers, Engineering & Science | 27 (100.0%) | 0 (0.0%) |
| Computers & Mathematics | 0 (0.0%) | 0 (0.0%) |
| Architecture & Engineering | 27 (100.0%) | 0 (0.0%) |
| Life, Physical & Social Science | 0 (0.0%) | 0 (0.0%) |
| Community & Social Service | 113 (47.7%) | 124 (52.3%) |
| Education, Arts & Media | 0 (0.0%) | 0 (0.0%) |
| Legal Services & Support | 0 (0.0%) | 0 (0.0%) |
| Education Instruction & Library | 28 (33.3%) | 56 (66.7%) |
| Arts, Media & Entertainment | 85 (55.6%) | 68 (44.4%) |
| Health Diagnosing & Treating | 0 (0.0%) | 208 (100.0%) |
| Health Technologists | 0 (0.0%) | 92 (100.0%) |
| Total (Category) | 285 (33.1%) | 575 (66.9%) |
| Total (Overall) | 1,197 (55.7%) | 951 (44.3%) |
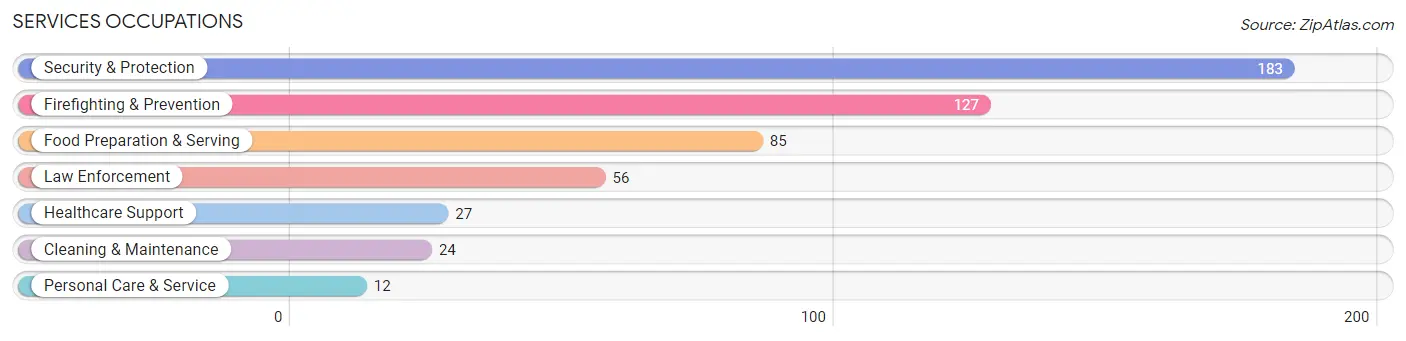
Services Occupations
The most common Services occupations in Northfield are Security & Protection (183 | 8.5%), Firefighting & Prevention (127 | 5.9%), Food Preparation & Serving (85 | 4.0%), Law Enforcement (56 | 2.6%), and Healthcare Support (27 | 1.3%).
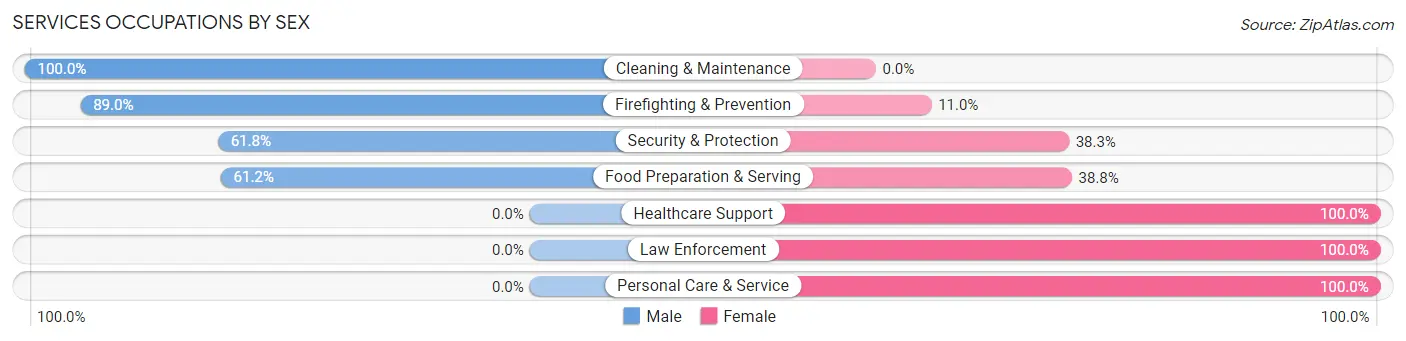
Services Occupations by Sex
Within the Services occupations in Northfield, the most male-oriented occupations are Cleaning & Maintenance (100.0%), Firefighting & Prevention (89.0%), and Security & Protection (61.8%), while the most female-oriented occupations are Healthcare Support (100.0%), Law Enforcement (100.0%), and Personal Care & Service (100.0%).
| Occupation | Male | Female |
| Healthcare Support | 0 (0.0%) | 27 (100.0%) |
| Security & Protection | 113 (61.8%) | 70 (38.3%) |
| Firefighting & Prevention | 113 (89.0%) | 14 (11.0%) |
| Law Enforcement | 0 (0.0%) | 56 (100.0%) |
| Food Preparation & Serving | 52 (61.2%) | 33 (38.8%) |
| Cleaning & Maintenance | 24 (100.0%) | 0 (0.0%) |
| Personal Care & Service | 0 (0.0%) | 12 (100.0%) |
| Total (Category) | 189 (57.1%) | 142 (42.9%) |
| Total (Overall) | 1,197 (55.7%) | 951 (44.3%) |
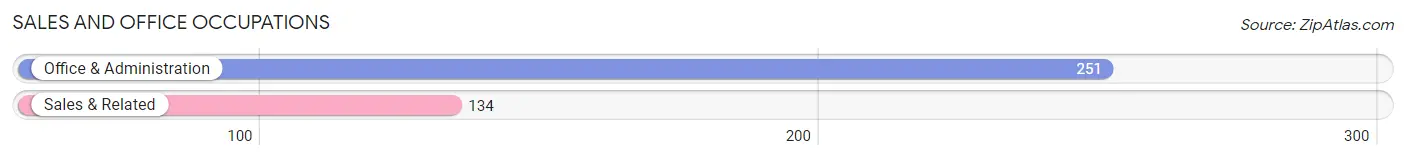
Sales and Office Occupations
The most common Sales and Office occupations in Northfield are Office & Administration (251 | 11.7%), and Sales & Related (134 | 6.2%).
Sales and Office Occupations by Sex
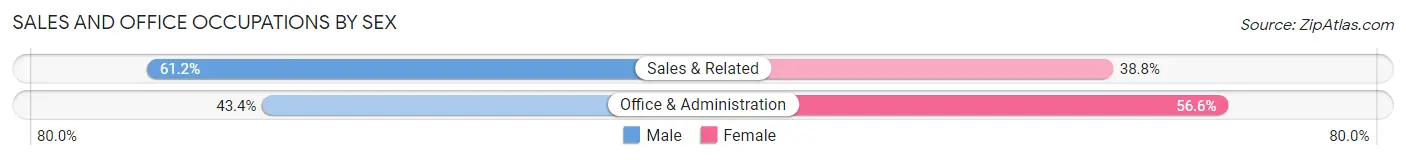
| Occupation | Male | Female |
| Sales & Related | 82 (61.2%) | 52 (38.8%) |
| Office & Administration | 109 (43.4%) | 142 (56.6%) |
| Total (Category) | 191 (49.6%) | 194 (50.4%) |
| Total (Overall) | 1,197 (55.7%) | 951 (44.3%) |
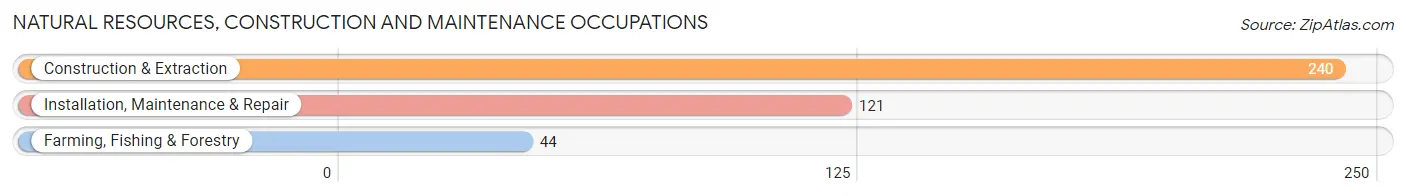
Natural Resources, Construction and Maintenance Occupations
The most common Natural Resources, Construction and Maintenance occupations in Northfield are Construction & Extraction (240 | 11.2%), Installation, Maintenance & Repair (121 | 5.6%), and Farming, Fishing & Forestry (44 | 2.1%).
Natural Resources, Construction and Maintenance Occupations by Sex
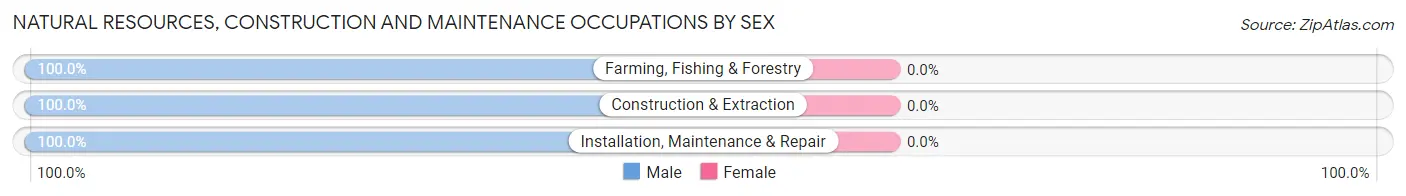
| Occupation | Male | Female |
| Farming, Fishing & Forestry | 44 (100.0%) | 0 (0.0%) |
| Construction & Extraction | 240 (100.0%) | 0 (0.0%) |
| Installation, Maintenance & Repair | 121 (100.0%) | 0 (0.0%) |
| Total (Category) | 405 (100.0%) | 0 (0.0%) |
| Total (Overall) | 1,197 (55.7%) | 951 (44.3%) |
Production, Transportation and Moving Occupations
The most common Production, Transportation and Moving occupations in Northfield are Production (105 | 4.9%), and Transportation (62 | 2.9%).
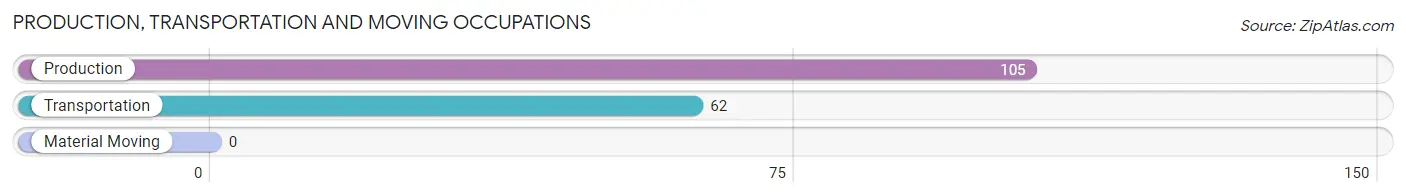
Production, Transportation and Moving Occupations by Sex
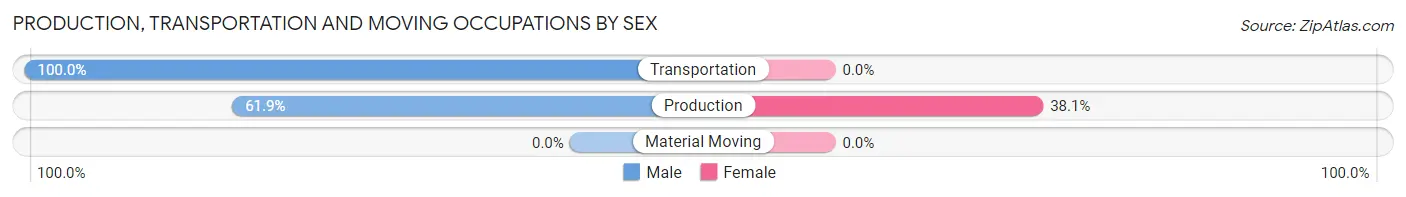
| Occupation | Male | Female |
| Production | 65 (61.9%) | 40 (38.1%) |
| Transportation | 62 (100.0%) | 0 (0.0%) |
| Material Moving | 0 (0.0%) | 0 (0.0%) |
| Total (Category) | 127 (76.0%) | 40 (23.9%) |
| Total (Overall) | 1,197 (55.7%) | 951 (44.3%) |
Employment Industries by Sex in Northfield
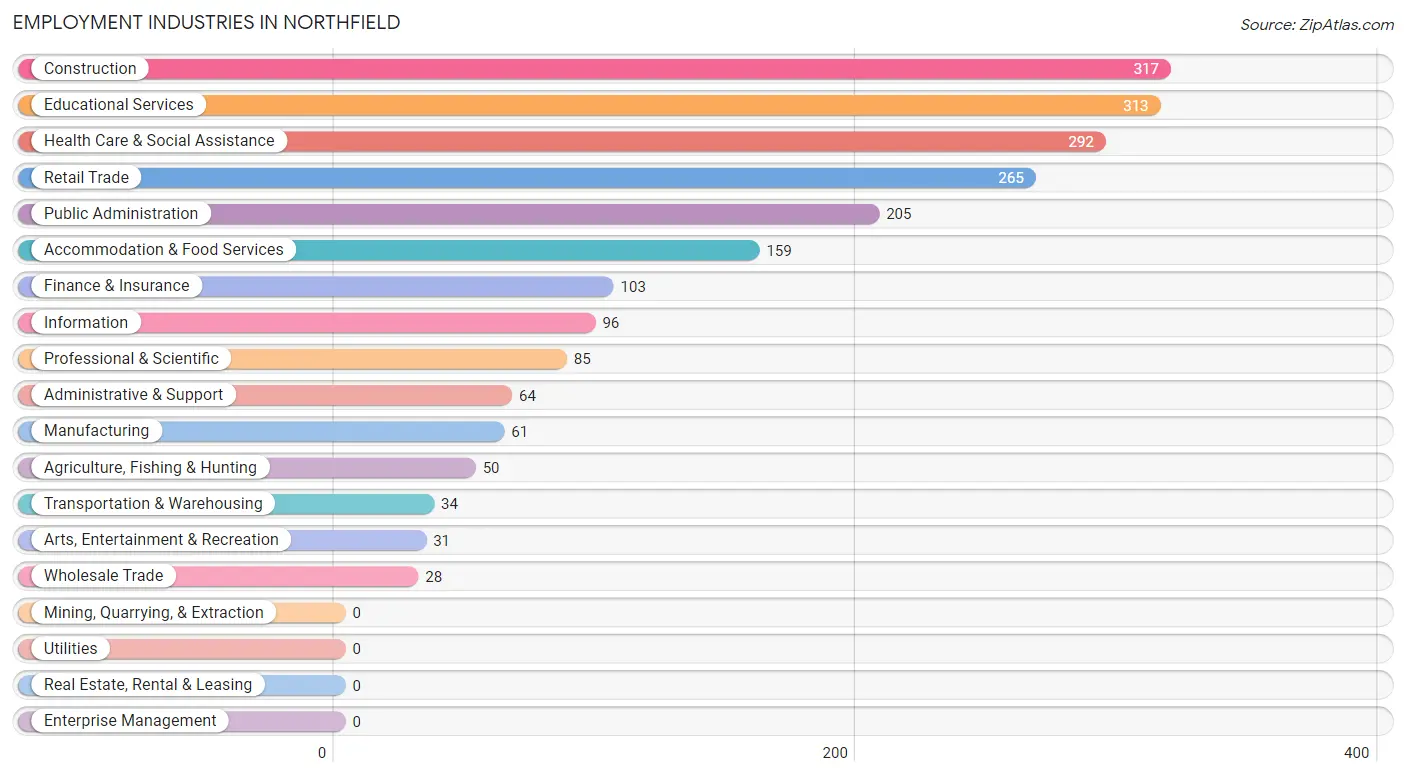
Employment Industries in Northfield
The major employment industries in Northfield include Construction (317 | 14.8%), Educational Services (313 | 14.6%), Health Care & Social Assistance (292 | 13.6%), Retail Trade (265 | 12.3%), and Public Administration (205 | 9.5%).
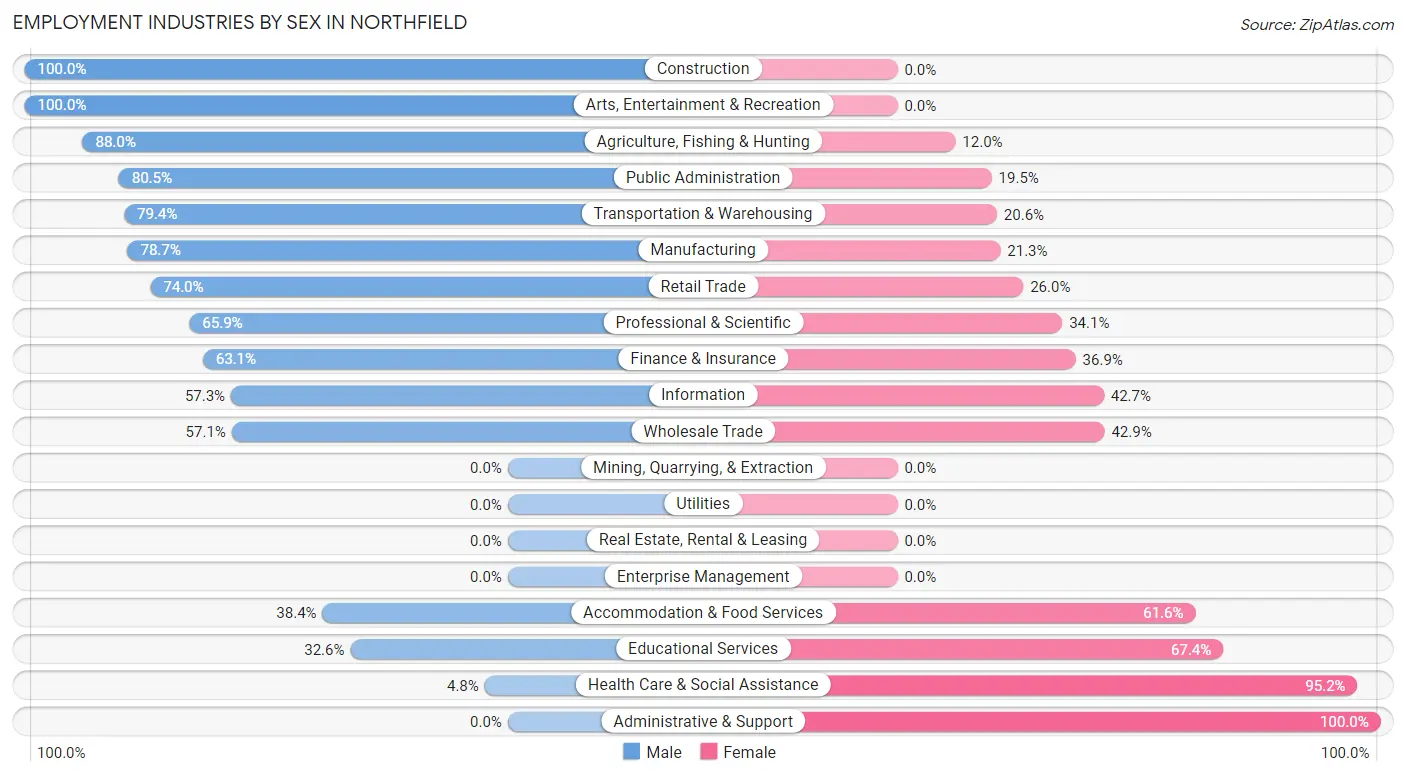
Employment Industries by Sex in Northfield
The Northfield industries that see more men than women are Construction (100.0%), Arts, Entertainment & Recreation (100.0%), and Agriculture, Fishing & Hunting (88.0%), whereas the industries that tend to have a higher number of women are Administrative & Support (100.0%), Health Care & Social Assistance (95.2%), and Educational Services (67.4%).
| Industry | Male | Female |
| Agriculture, Fishing & Hunting | 44 (88.0%) | 6 (12.0%) |
| Mining, Quarrying, & Extraction | 0 (0.0%) | 0 (0.0%) |
| Construction | 317 (100.0%) | 0 (0.0%) |
| Manufacturing | 48 (78.7%) | 13 (21.3%) |
| Wholesale Trade | 16 (57.1%) | 12 (42.9%) |
| Retail Trade | 196 (74.0%) | 69 (26.0%) |
| Transportation & Warehousing | 27 (79.4%) | 7 (20.6%) |
| Utilities | 0 (0.0%) | 0 (0.0%) |
| Information | 55 (57.3%) | 41 (42.7%) |
| Finance & Insurance | 65 (63.1%) | 38 (36.9%) |
| Real Estate, Rental & Leasing | 0 (0.0%) | 0 (0.0%) |
| Professional & Scientific | 56 (65.9%) | 29 (34.1%) |
| Enterprise Management | 0 (0.0%) | 0 (0.0%) |
| Administrative & Support | 0 (0.0%) | 64 (100.0%) |
| Educational Services | 102 (32.6%) | 211 (67.4%) |
| Health Care & Social Assistance | 14 (4.8%) | 278 (95.2%) |
| Arts, Entertainment & Recreation | 31 (100.0%) | 0 (0.0%) |
| Accommodation & Food Services | 61 (38.4%) | 98 (61.6%) |
| Public Administration | 165 (80.5%) | 40 (19.5%) |
| Total | 1,197 (55.7%) | 951 (44.3%) |
Education in Northfield
School Enrollment in Northfield
The most common levels of schooling among the 1,802 students in Northfield are college / undergraduate (1,450 | 80.5%), elementary school (136 | 7.5%), and nursery / preschool (74 | 4.1%).
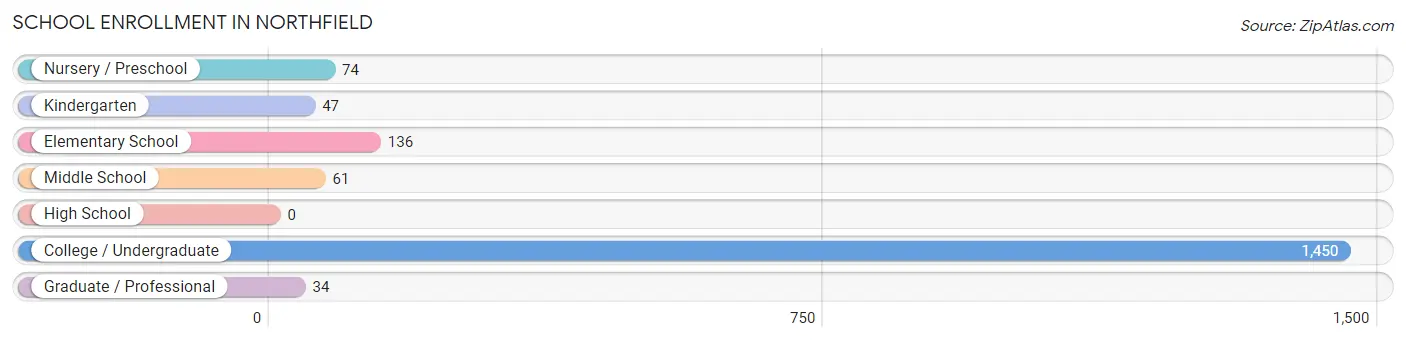
| School Level | # Students | % Students |
| Nursery / Preschool | 74 | 4.1% |
| Kindergarten | 47 | 2.6% |
| Elementary School | 136 | 7.5% |
| Middle School | 61 | 3.4% |
| High School | 0 | 0.0% |
| College / Undergraduate | 1,450 | 80.5% |
| Graduate / Professional | 34 | 1.9% |
| Total | 1,802 | 100.0% |
School Enrollment by Age by Funding Source in Northfield
Out of a total of 1,802 students who are enrolled in schools in Northfield, 1,461 (81.1%) attend a private institution, while the remaining 341 (18.9%) are enrolled in public schools. The age group of 20 to 24 year olds has the highest likelihood of being enrolled in private schools, with 879 (96.9% in the age bracket) enrolled. Conversely, the age group of 3 to 4 year olds has the lowest likelihood of being enrolled in a private school, with 7 (100.0% in the age bracket) attending a public institution.
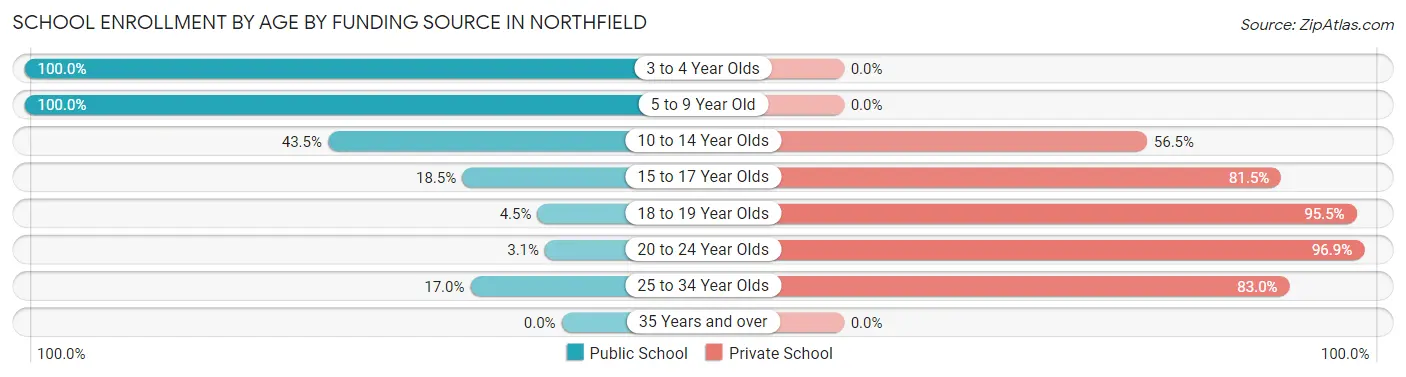
| Age Bracket | Public School | Private School |
| 3 to 4 Year Olds | 7 (100.0%) | 0 (0.0%) |
| 5 to 9 Year Old | 226 (100.0%) | 0 (0.0%) |
| 10 to 14 Year Olds | 37 (43.5%) | 48 (56.5%) |
| 15 to 17 Year Olds | 5 (18.5%) | 22 (81.5%) |
| 18 to 19 Year Olds | 20 (4.5%) | 424 (95.5%) |
| 20 to 24 Year Olds | 28 (3.1%) | 879 (96.9%) |
| 25 to 34 Year Olds | 18 (17.0%) | 88 (83.0%) |
| 35 Years and over | 0 (0.0%) | 0 (0.0%) |
| Total | 341 (18.9%) | 1,461 (81.1%) |
Educational Attainment by Field of Study in Northfield
Business (151 | 16.0%), liberal arts & history (143 | 15.2%), science & technology (107 | 11.4%), engineering (98 | 10.4%), and social sciences (84 | 8.9%) are the most common fields of study among 942 individuals in Northfield who have obtained a bachelor's degree or higher.
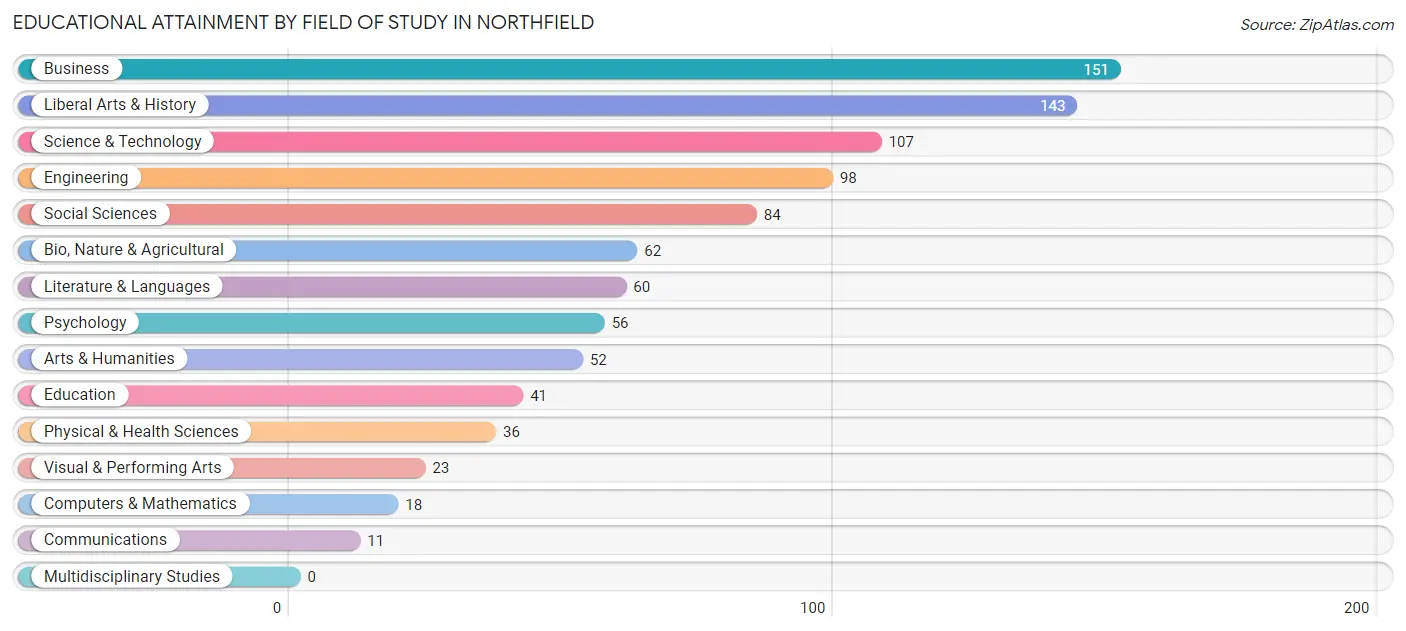
| Field of Study | # Graduates | % Graduates |
| Computers & Mathematics | 18 | 1.9% |
| Bio, Nature & Agricultural | 62 | 6.6% |
| Physical & Health Sciences | 36 | 3.8% |
| Psychology | 56 | 5.9% |
| Social Sciences | 84 | 8.9% |
| Engineering | 98 | 10.4% |
| Multidisciplinary Studies | 0 | 0.0% |
| Science & Technology | 107 | 11.4% |
| Business | 151 | 16.0% |
| Education | 41 | 4.3% |
| Literature & Languages | 60 | 6.4% |
| Liberal Arts & History | 143 | 15.2% |
| Visual & Performing Arts | 23 | 2.4% |
| Communications | 11 | 1.2% |
| Arts & Humanities | 52 | 5.5% |
| Total | 942 | 100.0% |
Transportation & Commute in Northfield
Vehicle Availability by Sex in Northfield
The most prevalent vehicle ownership categories in Northfield are males with 2 vehicles (464, accounting for 47.9%) and females with 2 vehicles (300, making up 67.6%).
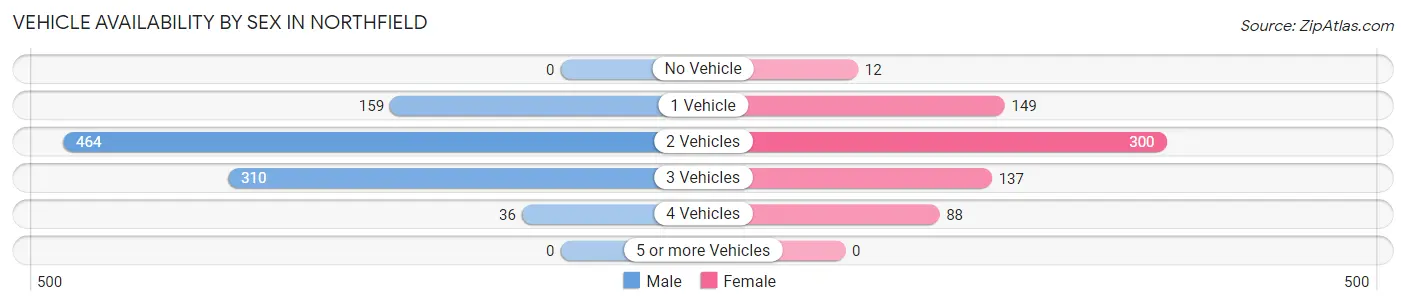
| Vehicles Available | Male | Female |
| No Vehicle | 0 (0.0%) | 12 (1.8%) |
| 1 Vehicle | 159 (16.4%) | 149 (21.7%) |
| 2 Vehicles | 464 (47.9%) | 300 (43.7%) |
| 3 Vehicles | 310 (32.0%) | 137 (20.0%) |
| 4 Vehicles | 36 (3.7%) | 88 (12.8%) |
| 5 or more Vehicles | 0 (0.0%) | 0 (0.0%) |
| Total | 969 (100.0%) | 686 (100.0%) |
Commute Time in Northfield
The most frequently occuring commute durations in Northfield are 20 to 24 minutes (378 commuters, 20.3%), 5 to 9 minutes (305 commuters, 16.4%), and 15 to 19 minutes (194 commuters, 10.4%).
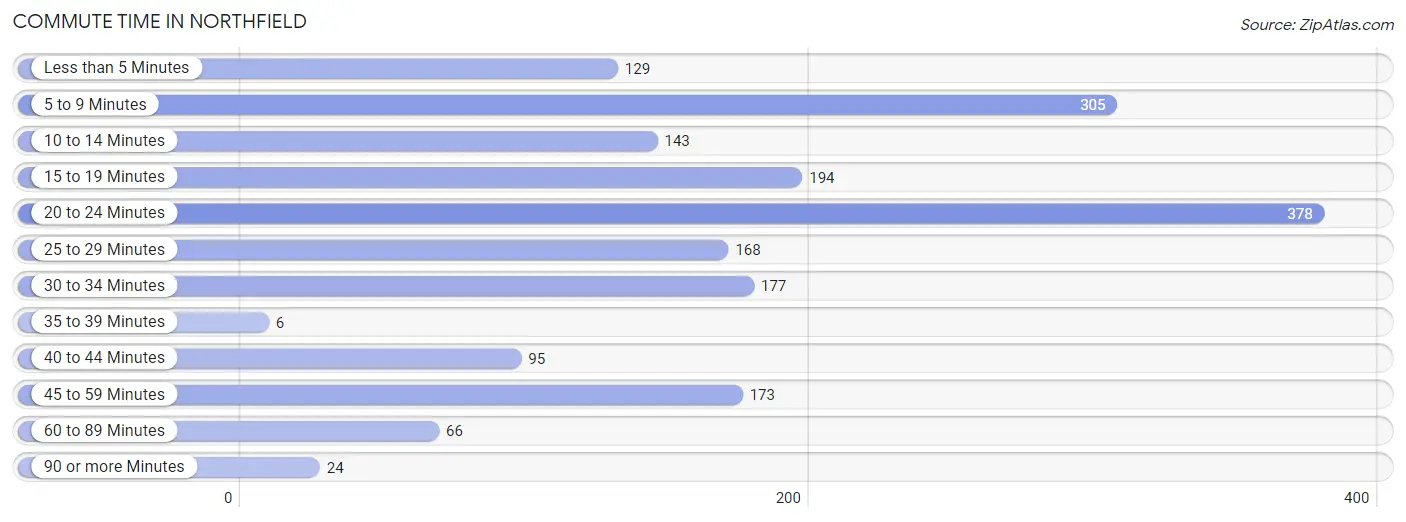
| Commute Time | # Commuters | % Commuters |
| Less than 5 Minutes | 129 | 6.9% |
| 5 to 9 Minutes | 305 | 16.4% |
| 10 to 14 Minutes | 143 | 7.7% |
| 15 to 19 Minutes | 194 | 10.4% |
| 20 to 24 Minutes | 378 | 20.3% |
| 25 to 29 Minutes | 168 | 9.0% |
| 30 to 34 Minutes | 177 | 9.5% |
| 35 to 39 Minutes | 6 | 0.3% |
| 40 to 44 Minutes | 95 | 5.1% |
| 45 to 59 Minutes | 173 | 9.3% |
| 60 to 89 Minutes | 66 | 3.5% |
| 90 or more Minutes | 24 | 1.3% |
Commute Time by Sex in Northfield
The most common commute times in Northfield are 20 to 24 minutes (296 commuters, 28.3%) for males and 5 to 9 minutes (182 commuters, 22.4%) for females.
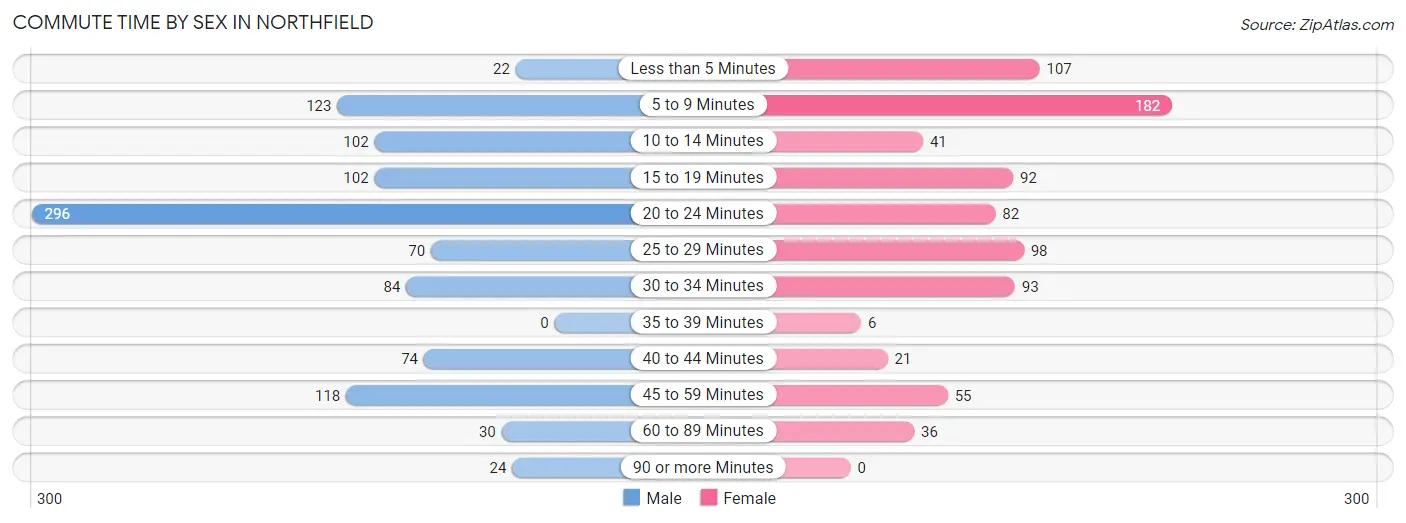
| Commute Time | Male | Female |
| Less than 5 Minutes | 22 (2.1%) | 107 (13.2%) |
| 5 to 9 Minutes | 123 (11.8%) | 182 (22.4%) |
| 10 to 14 Minutes | 102 (9.8%) | 41 (5.0%) |
| 15 to 19 Minutes | 102 (9.8%) | 92 (11.3%) |
| 20 to 24 Minutes | 296 (28.3%) | 82 (10.1%) |
| 25 to 29 Minutes | 70 (6.7%) | 98 (12.0%) |
| 30 to 34 Minutes | 84 (8.0%) | 93 (11.4%) |
| 35 to 39 Minutes | 0 (0.0%) | 6 (0.7%) |
| 40 to 44 Minutes | 74 (7.1%) | 21 (2.6%) |
| 45 to 59 Minutes | 118 (11.3%) | 55 (6.8%) |
| 60 to 89 Minutes | 30 (2.9%) | 36 (4.4%) |
| 90 or more Minutes | 24 (2.3%) | 0 (0.0%) |
Time of Departure to Work by Sex in Northfield
The most frequent times of departure to work in Northfield are 8:00 AM to 8:29 AM (197, 18.9%) for males and 4:00 PM to 11:59 PM (126, 15.5%) for females.
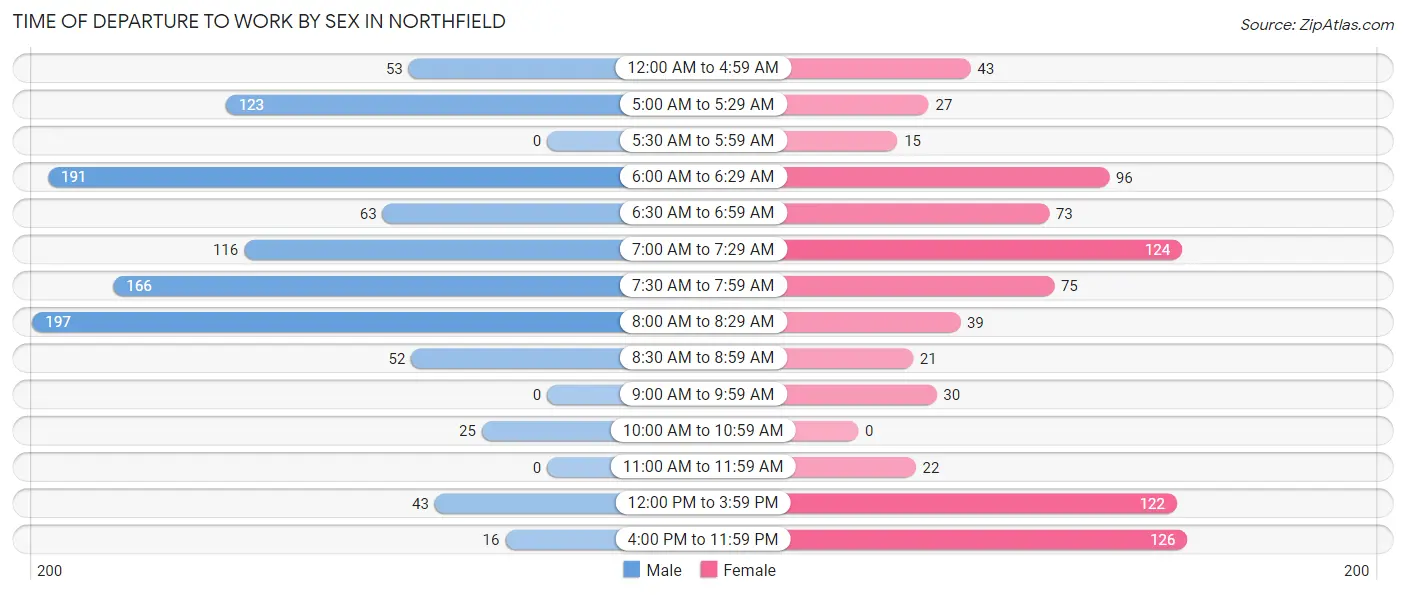
| Time of Departure | Male | Female |
| 12:00 AM to 4:59 AM | 53 (5.1%) | 43 (5.3%) |
| 5:00 AM to 5:29 AM | 123 (11.8%) | 27 (3.3%) |
| 5:30 AM to 5:59 AM | 0 (0.0%) | 15 (1.8%) |
| 6:00 AM to 6:29 AM | 191 (18.3%) | 96 (11.8%) |
| 6:30 AM to 6:59 AM | 63 (6.0%) | 73 (9.0%) |
| 7:00 AM to 7:29 AM | 116 (11.1%) | 124 (15.2%) |
| 7:30 AM to 7:59 AM | 166 (15.9%) | 75 (9.2%) |
| 8:00 AM to 8:29 AM | 197 (18.9%) | 39 (4.8%) |
| 8:30 AM to 8:59 AM | 52 (5.0%) | 21 (2.6%) |
| 9:00 AM to 9:59 AM | 0 (0.0%) | 30 (3.7%) |
| 10:00 AM to 10:59 AM | 25 (2.4%) | 0 (0.0%) |
| 11:00 AM to 11:59 AM | 0 (0.0%) | 22 (2.7%) |
| 12:00 PM to 3:59 PM | 43 (4.1%) | 122 (15.0%) |
| 4:00 PM to 11:59 PM | 16 (1.5%) | 126 (15.5%) |
| Total | 1,045 (100.0%) | 813 (100.0%) |
Housing Occupancy in Northfield
Occupancy by Ownership in Northfield
Of the total 1,144 dwellings in Northfield, owner-occupied units account for 706 (61.7%), while renter-occupied units make up 438 (38.3%).
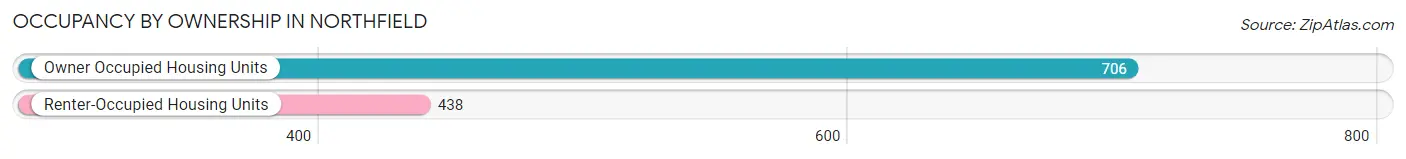
| Occupancy | # Housing Units | % Housing Units |
| Owner Occupied Housing Units | 706 | 61.7% |
| Renter-Occupied Housing Units | 438 | 38.3% |
| Total Occupied Housing Units | 1,144 | 100.0% |
Occupancy by Household Size in Northfield
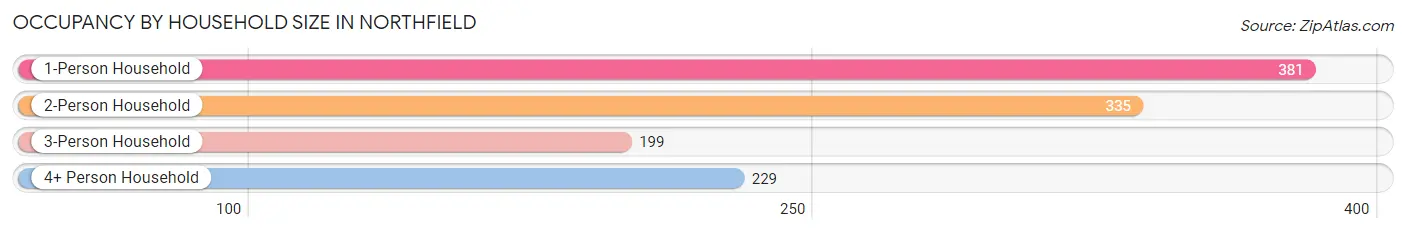
| Household Size | # Housing Units | % Housing Units |
| 1-Person Household | 381 | 33.3% |
| 2-Person Household | 335 | 29.3% |
| 3-Person Household | 199 | 17.4% |
| 4+ Person Household | 229 | 20.0% |
| Total Housing Units | 1,144 | 100.0% |
Occupancy by Ownership by Household Size in Northfield
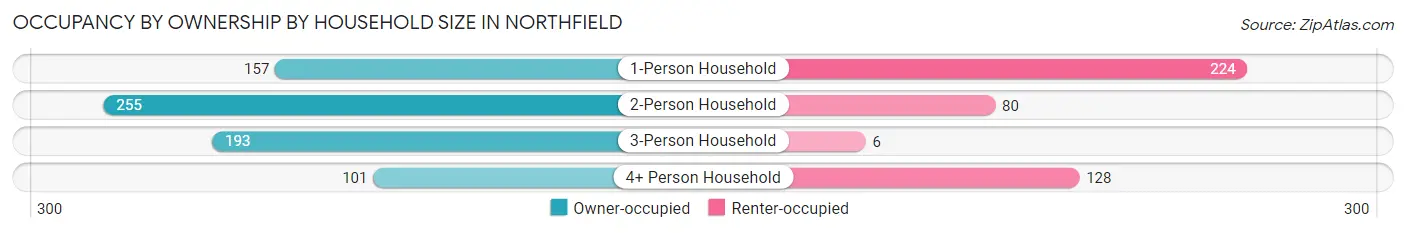
| Household Size | Owner-occupied | Renter-occupied |
| 1-Person Household | 157 (41.2%) | 224 (58.8%) |
| 2-Person Household | 255 (76.1%) | 80 (23.9%) |
| 3-Person Household | 193 (97.0%) | 6 (3.0%) |
| 4+ Person Household | 101 (44.1%) | 128 (55.9%) |
| Total Housing Units | 706 (61.7%) | 438 (38.3%) |
Occupancy by Educational Attainment in Northfield
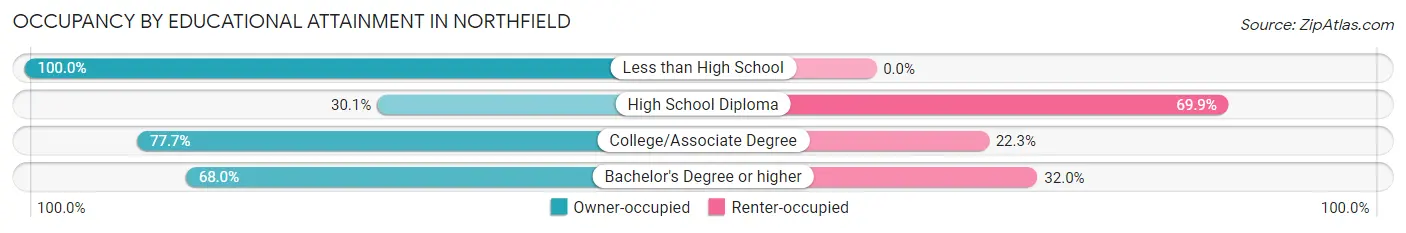
| Household Size | Owner-occupied | Renter-occupied |
| Less than High School | 37 (100.0%) | 0 (0.0%) |
| High School Diploma | 94 (30.1%) | 218 (69.9%) |
| College/Associate Degree | 275 (77.7%) | 79 (22.3%) |
| Bachelor's Degree or higher | 300 (68.0%) | 141 (32.0%) |
Occupancy by Age of Householder in Northfield
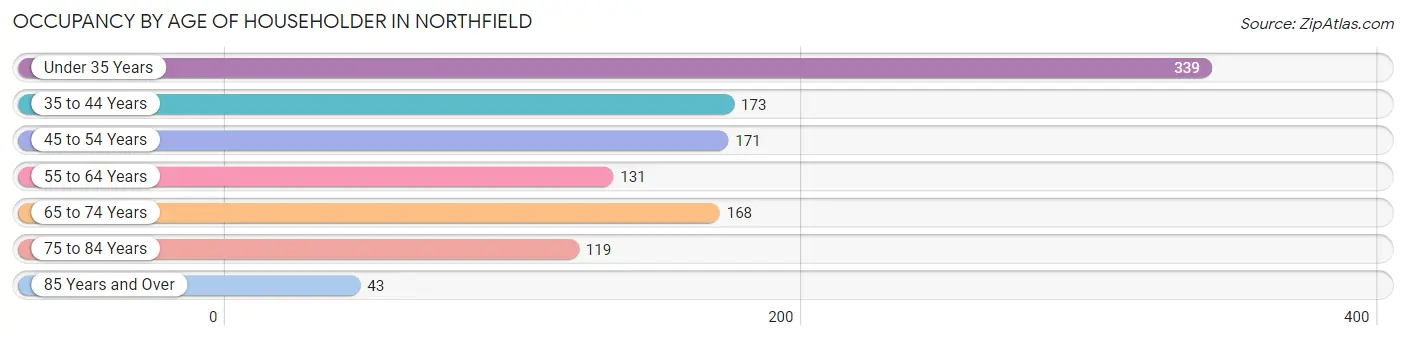
| Age Bracket | # Households | % Households |
| Under 35 Years | 339 | 29.6% |
| 35 to 44 Years | 173 | 15.1% |
| 45 to 54 Years | 171 | 14.9% |
| 55 to 64 Years | 131 | 11.5% |
| 65 to 74 Years | 168 | 14.7% |
| 75 to 84 Years | 119 | 10.4% |
| 85 Years and Over | 43 | 3.8% |
| Total | 1,144 | 100.0% |
Housing Finances in Northfield
Median Income by Occupancy in Northfield
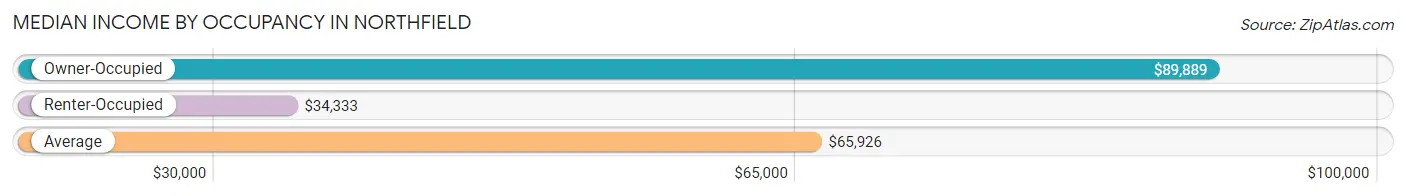
| Occupancy Type | # Households | Median Income |
| Owner-Occupied | 706 (61.7%) | $89,889 |
| Renter-Occupied | 438 (38.3%) | $34,333 |
| Average | 1,144 (100.0%) | $65,926 |
Occupancy by Householder Income Bracket in Northfield
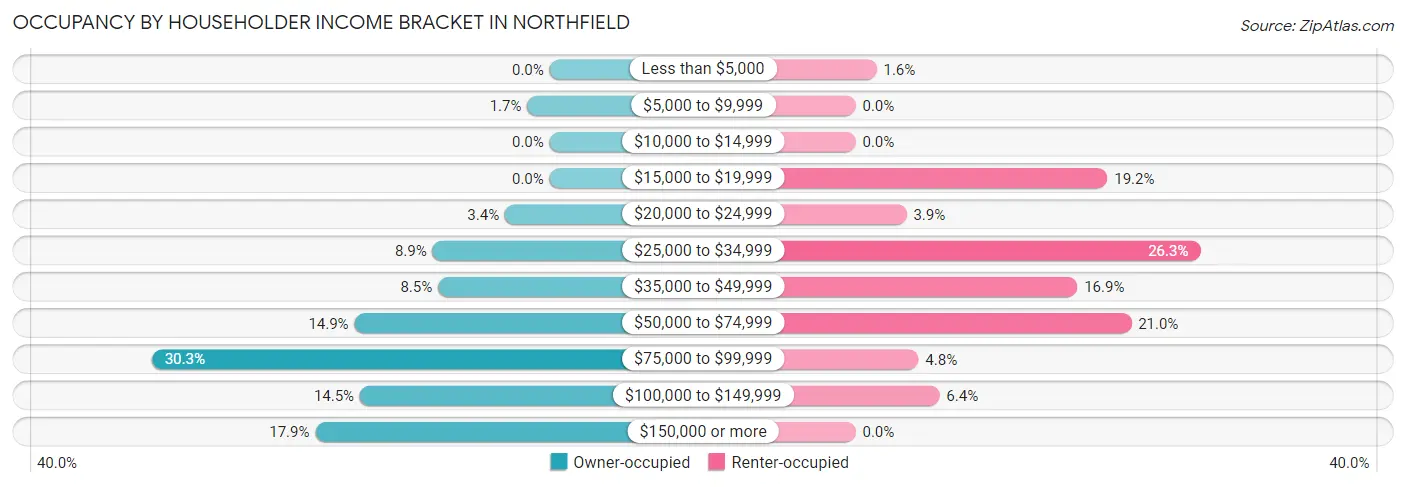
| Income Bracket | Owner-occupied | Renter-occupied |
| Less than $5,000 | 0 (0.0%) | 7 (1.6%) |
| $5,000 to $9,999 | 12 (1.7%) | 0 (0.0%) |
| $10,000 to $14,999 | 0 (0.0%) | 0 (0.0%) |
| $15,000 to $19,999 | 0 (0.0%) | 84 (19.2%) |
| $20,000 to $24,999 | 24 (3.4%) | 17 (3.9%) |
| $25,000 to $34,999 | 63 (8.9%) | 115 (26.3%) |
| $35,000 to $49,999 | 60 (8.5%) | 74 (16.9%) |
| $50,000 to $74,999 | 105 (14.9%) | 92 (21.0%) |
| $75,000 to $99,999 | 214 (30.3%) | 21 (4.8%) |
| $100,000 to $149,999 | 102 (14.4%) | 28 (6.4%) |
| $150,000 or more | 126 (17.8%) | 0 (0.0%) |
| Total | 706 (100.0%) | 438 (100.0%) |
Monthly Housing Cost Tiers in Northfield
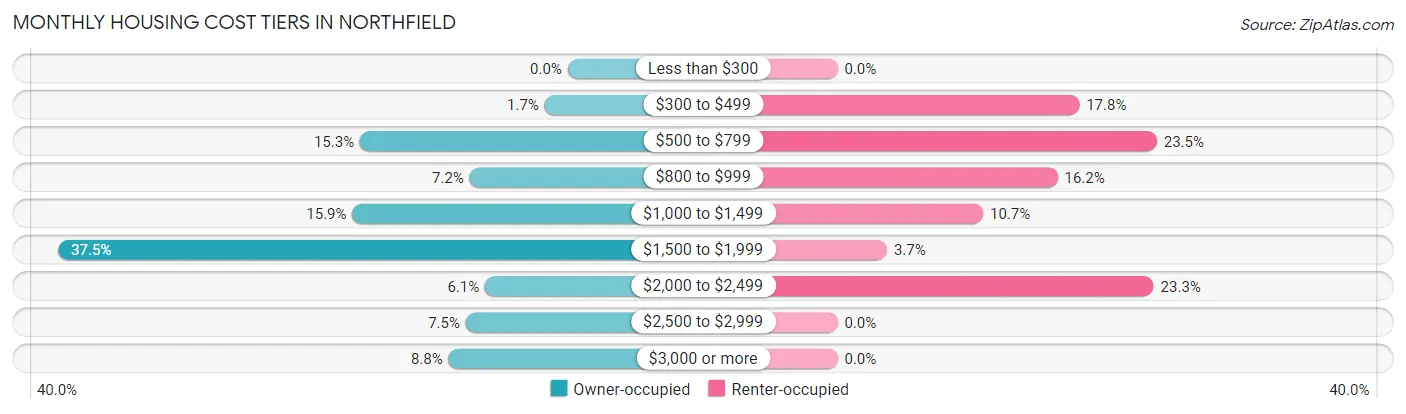
| Monthly Cost | Owner-occupied | Renter-occupied |
| Less than $300 | 0 (0.0%) | 0 (0.0%) |
| $300 to $499 | 12 (1.7%) | 78 (17.8%) |
| $500 to $799 | 108 (15.3%) | 103 (23.5%) |
| $800 to $999 | 51 (7.2%) | 71 (16.2%) |
| $1,000 to $1,499 | 112 (15.9%) | 47 (10.7%) |
| $1,500 to $1,999 | 265 (37.5%) | 16 (3.6%) |
| $2,000 to $2,499 | 43 (6.1%) | 102 (23.3%) |
| $2,500 to $2,999 | 53 (7.5%) | 0 (0.0%) |
| $3,000 or more | 62 (8.8%) | 0 (0.0%) |
| Total | 706 (100.0%) | 438 (100.0%) |
Physical Housing Characteristics in Northfield
Housing Structures in Northfield
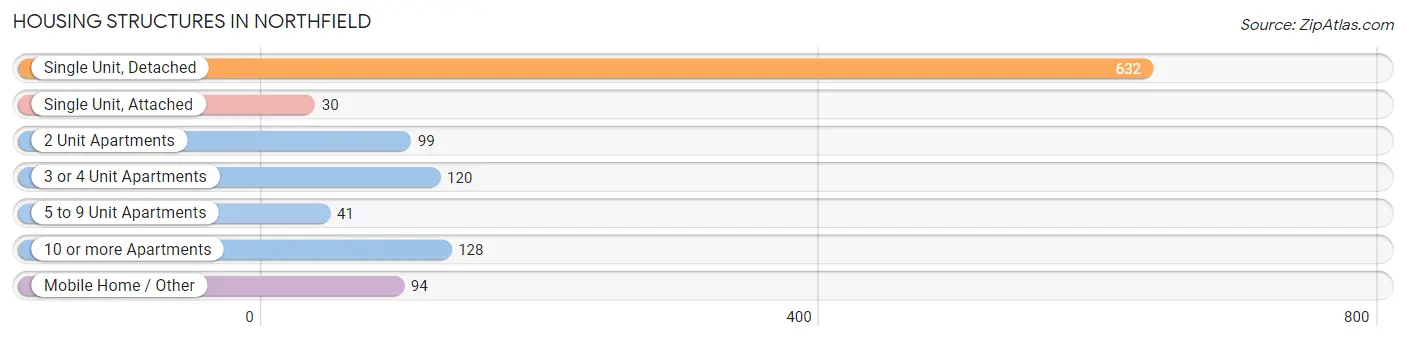
| Structure Type | # Housing Units | % Housing Units |
| Single Unit, Detached | 632 | 55.2% |
| Single Unit, Attached | 30 | 2.6% |
| 2 Unit Apartments | 99 | 8.6% |
| 3 or 4 Unit Apartments | 120 | 10.5% |
| 5 to 9 Unit Apartments | 41 | 3.6% |
| 10 or more Apartments | 128 | 11.2% |
| Mobile Home / Other | 94 | 8.2% |
| Total | 1,144 | 100.0% |
Housing Structures by Occupancy in Northfield
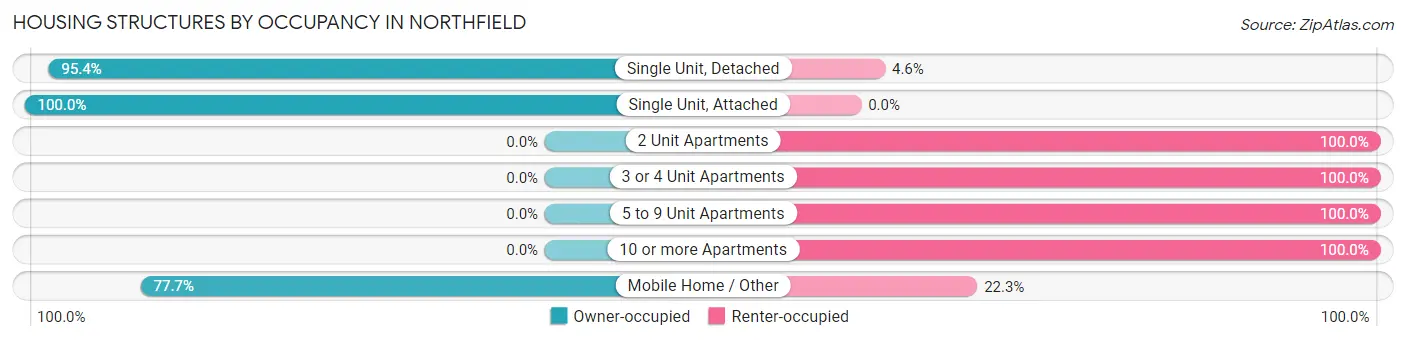
| Structure Type | Owner-occupied | Renter-occupied |
| Single Unit, Detached | 603 (95.4%) | 29 (4.6%) |
| Single Unit, Attached | 30 (100.0%) | 0 (0.0%) |
| 2 Unit Apartments | 0 (0.0%) | 99 (100.0%) |
| 3 or 4 Unit Apartments | 0 (0.0%) | 120 (100.0%) |
| 5 to 9 Unit Apartments | 0 (0.0%) | 41 (100.0%) |
| 10 or more Apartments | 0 (0.0%) | 128 (100.0%) |
| Mobile Home / Other | 73 (77.7%) | 21 (22.3%) |
| Total | 706 (61.7%) | 438 (38.3%) |
Housing Structures by Number of Rooms in Northfield
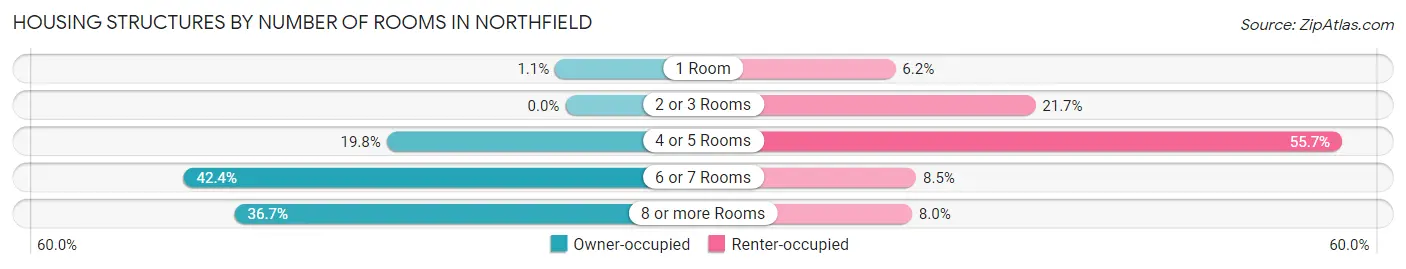
| Number of Rooms | Owner-occupied | Renter-occupied |
| 1 Room | 8 (1.1%) | 27 (6.2%) |
| 2 or 3 Rooms | 0 (0.0%) | 95 (21.7%) |
| 4 or 5 Rooms | 140 (19.8%) | 244 (55.7%) |
| 6 or 7 Rooms | 299 (42.3%) | 37 (8.5%) |
| 8 or more Rooms | 259 (36.7%) | 35 (8.0%) |
| Total | 706 (100.0%) | 438 (100.0%) |
Housing Structure by Heating Type in Northfield
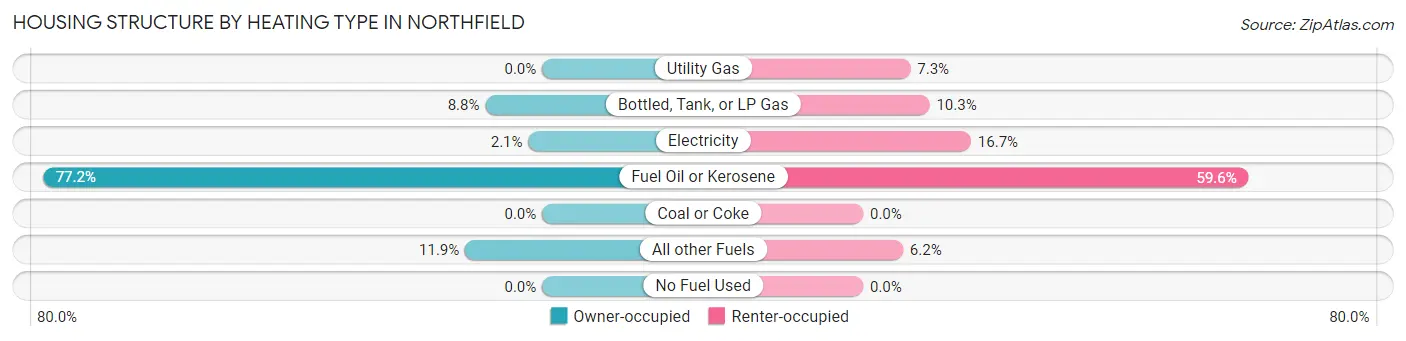
| Heating Type | Owner-occupied | Renter-occupied |
| Utility Gas | 0 (0.0%) | 32 (7.3%) |
| Bottled, Tank, or LP Gas | 62 (8.8%) | 45 (10.3%) |
| Electricity | 15 (2.1%) | 73 (16.7%) |
| Fuel Oil or Kerosene | 545 (77.2%) | 261 (59.6%) |
| Coal or Coke | 0 (0.0%) | 0 (0.0%) |
| All other Fuels | 84 (11.9%) | 27 (6.2%) |
| No Fuel Used | 0 (0.0%) | 0 (0.0%) |
| Total | 706 (100.0%) | 438 (100.0%) |
Household Vehicle Usage in Northfield
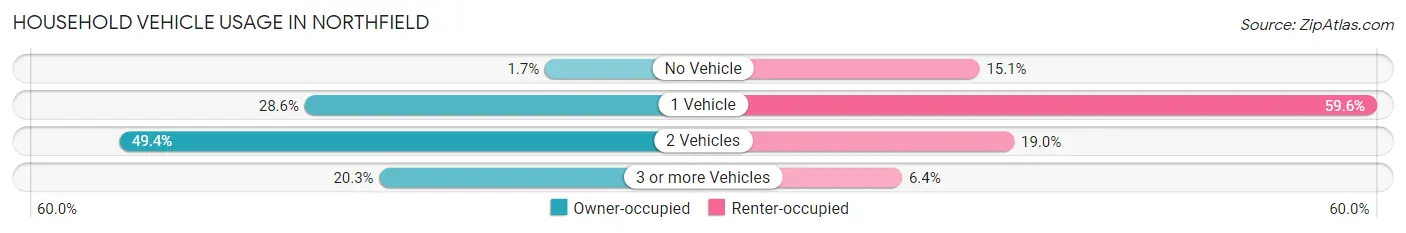
| Vehicles per Household | Owner-occupied | Renter-occupied |
| No Vehicle | 12 (1.7%) | 66 (15.1%) |
| 1 Vehicle | 202 (28.6%) | 261 (59.6%) |
| 2 Vehicles | 349 (49.4%) | 83 (19.0%) |
| 3 or more Vehicles | 143 (20.3%) | 28 (6.4%) |
| Total | 706 (100.0%) | 438 (100.0%) |
Real Estate & Mortgages in Northfield
Real Estate and Mortgage Overview in Northfield
| Characteristic | Without Mortgage | With Mortgage |
| Housing Units | 149 | 557 |
| Median Property Value | $170,400 | $235,500 |
| Median Household Income | $34,250 | $126 |
| Monthly Housing Costs | $703 | $62 |
| Real Estate Taxes | $4,043 | $0 |
Property Value by Mortgage Status in Northfield
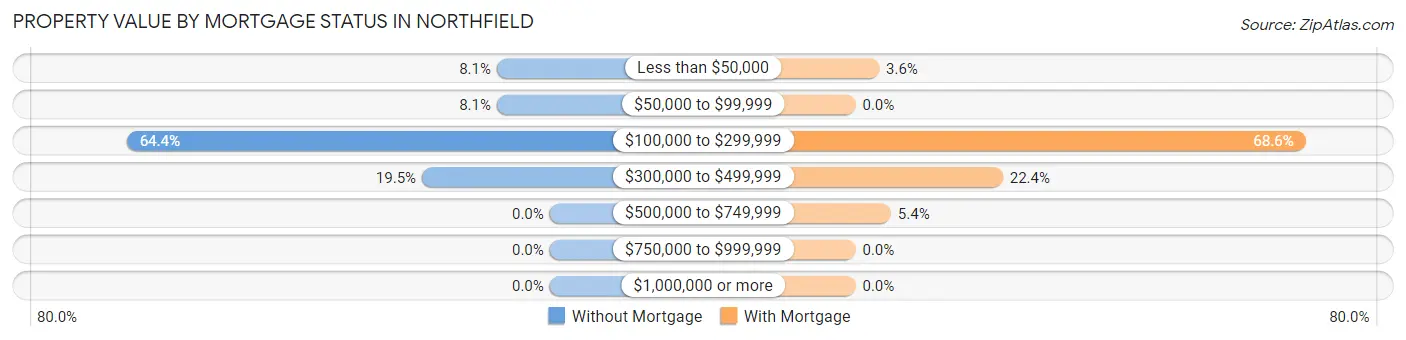
| Property Value | Without Mortgage | With Mortgage |
| Less than $50,000 | 12 (8.1%) | 20 (3.6%) |
| $50,000 to $99,999 | 12 (8.1%) | 0 (0.0%) |
| $100,000 to $299,999 | 96 (64.4%) | 382 (68.6%) |
| $300,000 to $499,999 | 29 (19.5%) | 125 (22.4%) |
| $500,000 to $749,999 | 0 (0.0%) | 30 (5.4%) |
| $750,000 to $999,999 | 0 (0.0%) | 0 (0.0%) |
| $1,000,000 or more | 0 (0.0%) | 0 (0.0%) |
| Total | 149 (100.0%) | 557 (100.0%) |
Household Income by Mortgage Status in Northfield
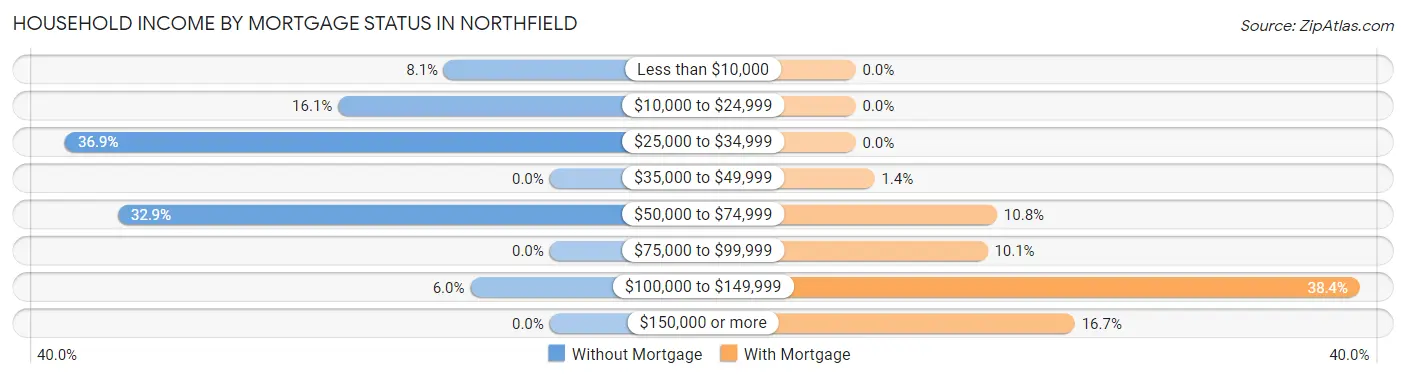
| Household Income | Without Mortgage | With Mortgage |
| Less than $10,000 | 12 (8.1%) | 0 (0.0%) |
| $10,000 to $24,999 | 24 (16.1%) | 0 (0.0%) |
| $25,000 to $34,999 | 55 (36.9%) | 0 (0.0%) |
| $35,000 to $49,999 | 0 (0.0%) | 8 (1.4%) |
| $50,000 to $74,999 | 49 (32.9%) | 60 (10.8%) |
| $75,000 to $99,999 | 0 (0.0%) | 56 (10.1%) |
| $100,000 to $149,999 | 9 (6.0%) | 214 (38.4%) |
| $150,000 or more | 0 (0.0%) | 93 (16.7%) |
| Total | 149 (100.0%) | 557 (100.0%) |
Property Value to Household Income Ratio in Northfield
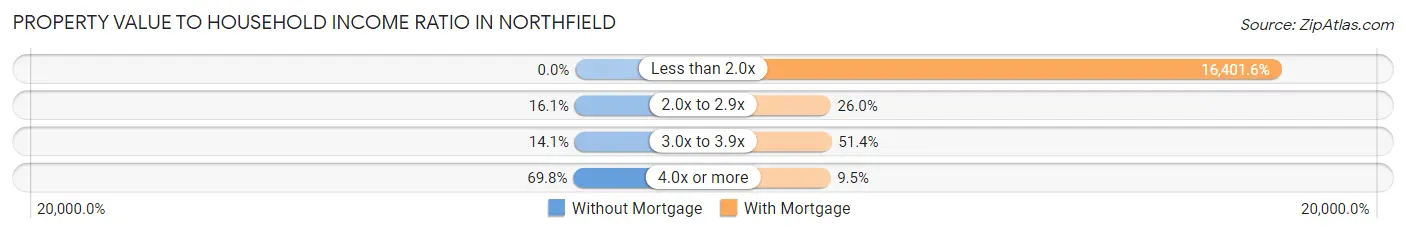
| Value-to-Income Ratio | Without Mortgage | With Mortgage |
| Less than 2.0x | 0 (0.0%) | 91,357 (16,401.6%) |
| 2.0x to 2.9x | 24 (16.1%) | 145 (26.0%) |
| 3.0x to 3.9x | 21 (14.1%) | 286 (51.3%) |
| 4.0x or more | 104 (69.8%) | 53 (9.5%) |
| Total | 149 (100.0%) | 557 (100.0%) |
Real Estate Taxes by Mortgage Status in Northfield
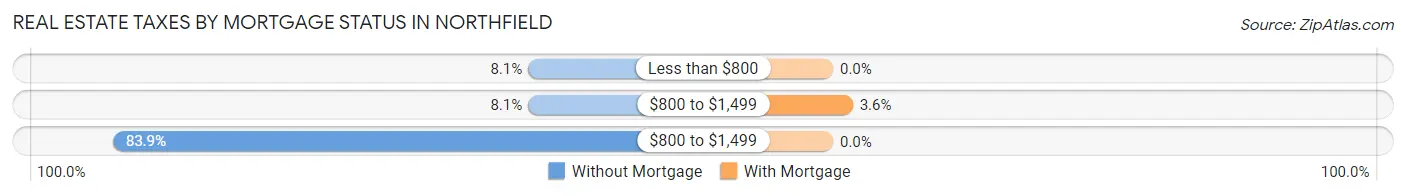
| Property Taxes | Without Mortgage | With Mortgage |
| Less than $800 | 12 (8.1%) | 0 (0.0%) |
| $800 to $1,499 | 12 (8.1%) | 20 (3.6%) |
| $800 to $1,499 | 125 (83.9%) | 0 (0.0%) |
| Total | 149 (100.0%) | 557 (100.0%) |
Health & Disability in Northfield
Health Insurance Coverage by Age in Northfield
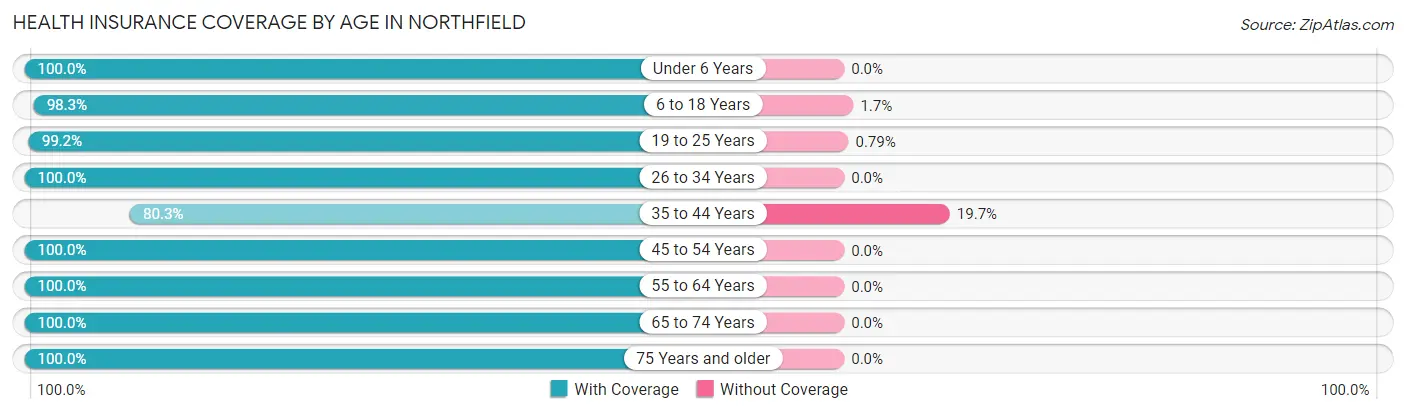
| Age Bracket | With Coverage | Without Coverage |
| Under 6 Years | 266 (100.0%) | 0 (0.0%) |
| 6 to 18 Years | 460 (98.3%) | 8 (1.7%) |
| 19 to 25 Years | 1,503 (99.2%) | 12 (0.8%) |
| 26 to 34 Years | 549 (100.0%) | 0 (0.0%) |
| 35 to 44 Years | 310 (80.3%) | 76 (19.7%) |
| 45 to 54 Years | 285 (100.0%) | 0 (0.0%) |
| 55 to 64 Years | 296 (100.0%) | 0 (0.0%) |
| 65 to 74 Years | 275 (100.0%) | 0 (0.0%) |
| 75 Years and older | 284 (100.0%) | 0 (0.0%) |
| Total | 4,228 (97.8%) | 96 (2.2%) |
Health Insurance Coverage by Citizenship Status in Northfield
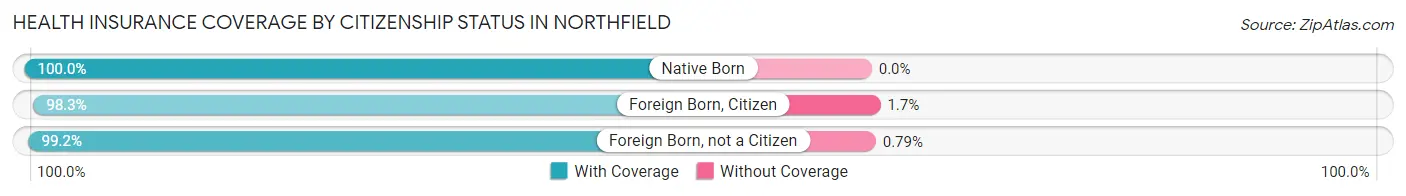
| Citizenship Status | With Coverage | Without Coverage |
| Native Born | 266 (100.0%) | 0 (0.0%) |
| Foreign Born, Citizen | 460 (98.3%) | 8 (1.7%) |
| Foreign Born, not a Citizen | 1,503 (99.2%) | 12 (0.8%) |
Health Insurance Coverage by Household Income in Northfield
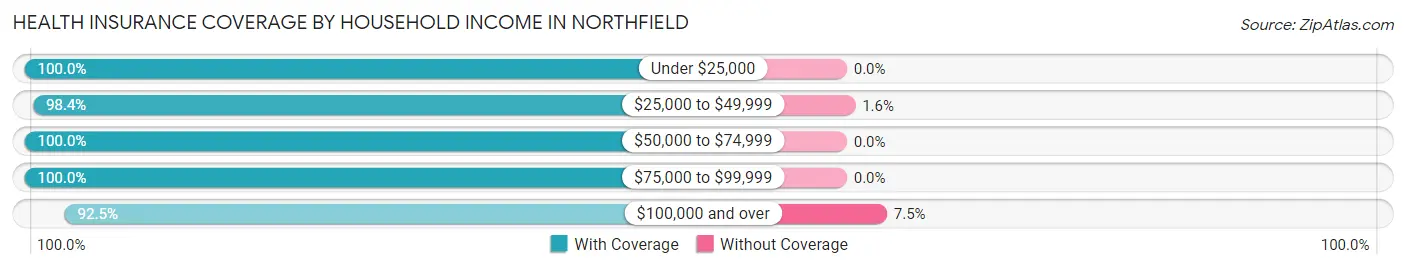
| Household Income | With Coverage | Without Coverage |
| Under $25,000 | 263 (100.0%) | 0 (0.0%) |
| $25,000 to $49,999 | 502 (98.4%) | 8 (1.6%) |
| $50,000 to $74,999 | 417 (100.0%) | 0 (0.0%) |
| $75,000 to $99,999 | 785 (100.0%) | 0 (0.0%) |
| $100,000 and over | 838 (92.5%) | 68 (7.5%) |
Public vs Private Health Insurance Coverage by Age in Northfield
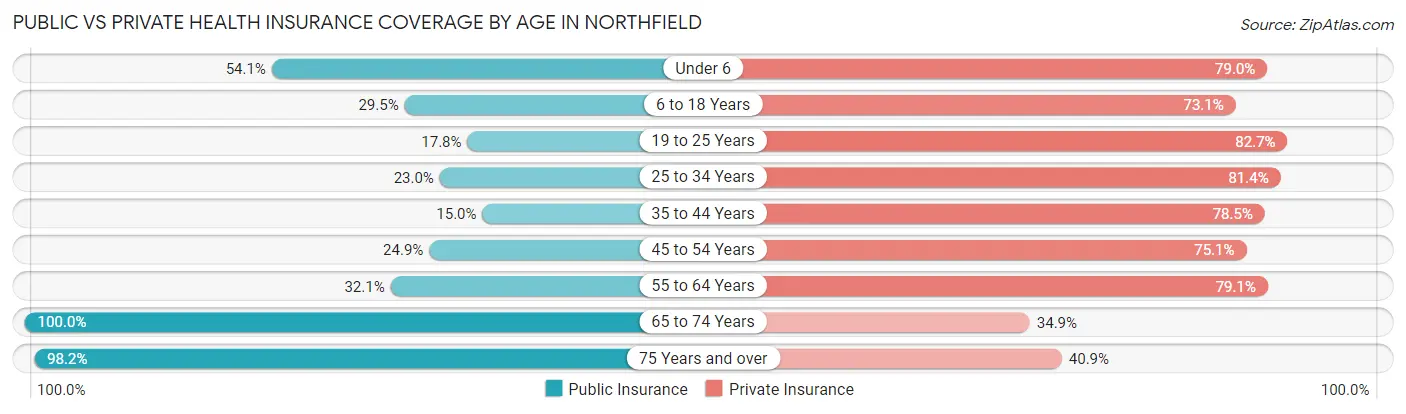
| Age Bracket | Public Insurance | Private Insurance |
| Under 6 | 144 (54.1%) | 210 (78.9%) |
| 6 to 18 Years | 138 (29.5%) | 342 (73.1%) |
| 19 to 25 Years | 270 (17.8%) | 1,253 (82.7%) |
| 25 to 34 Years | 126 (23.0%) | 447 (81.4%) |
| 35 to 44 Years | 58 (15.0%) | 303 (78.5%) |
| 45 to 54 Years | 71 (24.9%) | 214 (75.1%) |
| 55 to 64 Years | 95 (32.1%) | 234 (79.0%) |
| 65 to 74 Years | 275 (100.0%) | 96 (34.9%) |
| 75 Years and over | 279 (98.2%) | 116 (40.8%) |
| Total | 1,456 (33.7%) | 3,215 (74.4%) |
Disability Status by Sex by Age in Northfield
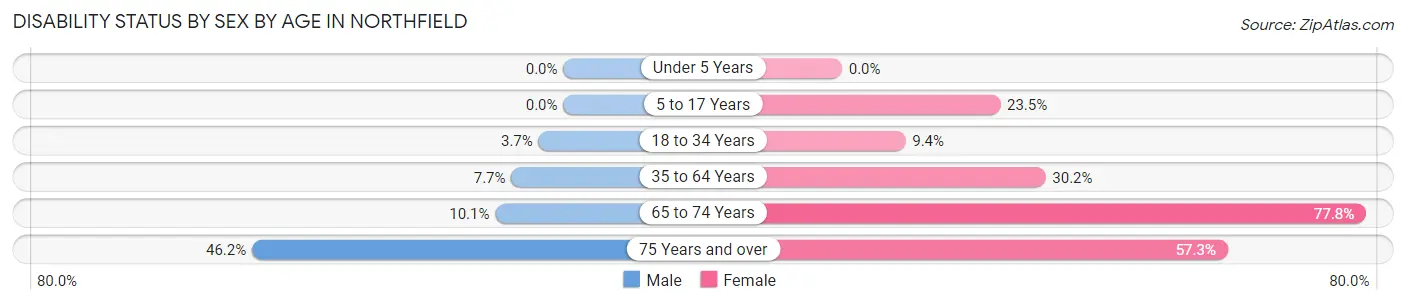
| Age Bracket | Male | Female |
| Under 5 Years | 0 (0.0%) | 0 (0.0%) |
| 5 to 17 Years | 0 (0.0%) | 47 (23.5%) |
| 18 to 34 Years | 50 (3.7%) | 86 (9.4%) |
| 35 to 64 Years | 44 (7.7%) | 120 (30.2%) |
| 65 to 74 Years | 10 (10.1%) | 137 (77.8%) |
| 75 Years and over | 49 (46.2%) | 102 (57.3%) |
Disability Class by Sex by Age in Northfield
Disability Class: Hearing Difficulty
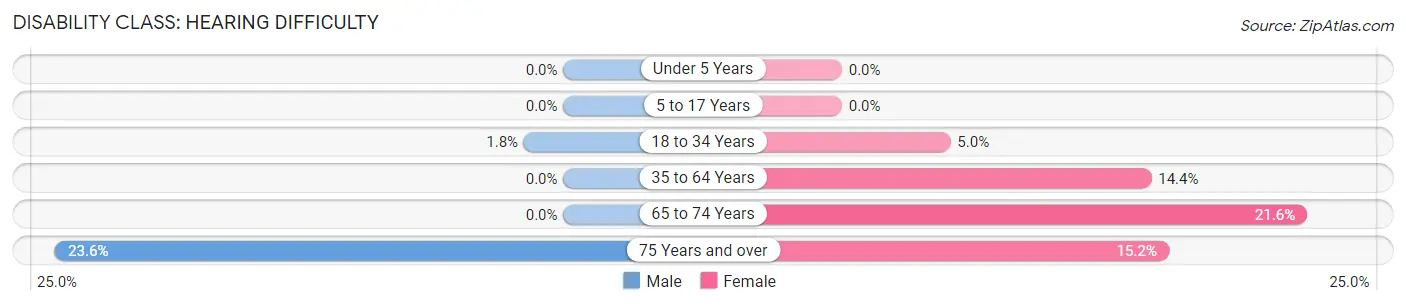
| Age Bracket | Male | Female |
| Under 5 Years | 0 (0.0%) | 0 (0.0%) |
| 5 to 17 Years | 0 (0.0%) | 0 (0.0%) |
| 18 to 34 Years | 25 (1.8%) | 46 (5.0%) |
| 35 to 64 Years | 0 (0.0%) | 57 (14.4%) |
| 65 to 74 Years | 0 (0.0%) | 38 (21.6%) |
| 75 Years and over | 25 (23.6%) | 27 (15.2%) |
Disability Class: Vision Difficulty
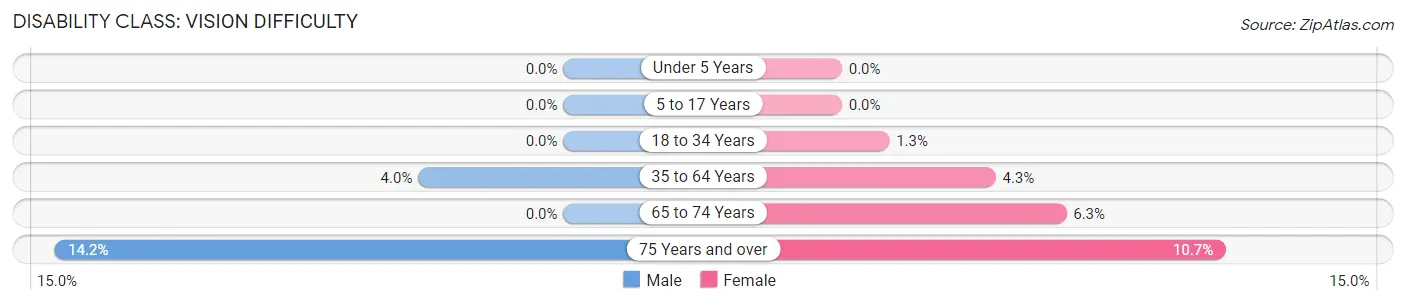
| Age Bracket | Male | Female |
| Under 5 Years | 0 (0.0%) | 0 (0.0%) |
| 5 to 17 Years | 0 (0.0%) | 0 (0.0%) |
| 18 to 34 Years | 0 (0.0%) | 12 (1.3%) |
| 35 to 64 Years | 23 (4.0%) | 17 (4.3%) |
| 65 to 74 Years | 0 (0.0%) | 11 (6.2%) |
| 75 Years and over | 15 (14.1%) | 19 (10.7%) |
Disability Class: Cognitive Difficulty
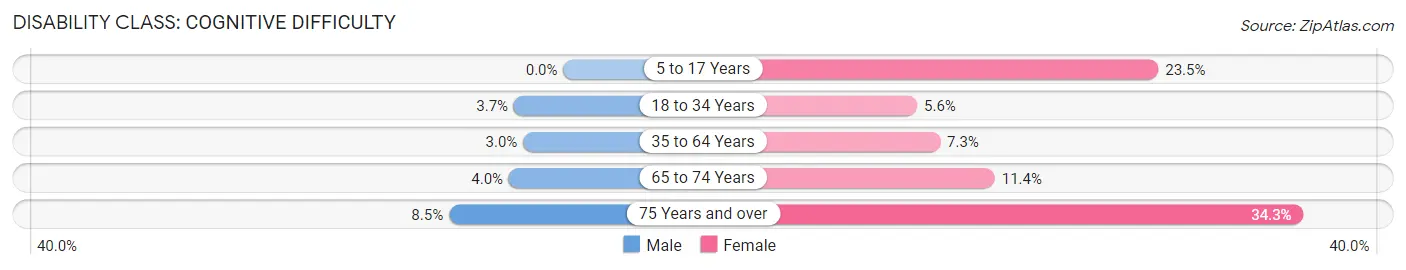
| Age Bracket | Male | Female |
| 5 to 17 Years | 0 (0.0%) | 47 (23.5%) |
| 18 to 34 Years | 50 (3.7%) | 51 (5.6%) |
| 35 to 64 Years | 17 (3.0%) | 29 (7.3%) |
| 65 to 74 Years | 4 (4.0%) | 20 (11.4%) |
| 75 Years and over | 9 (8.5%) | 61 (34.3%) |
Disability Class: Ambulatory Difficulty
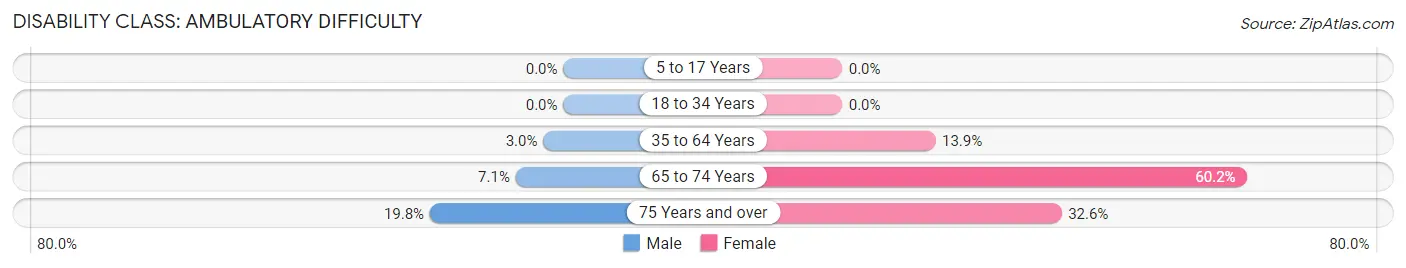
| Age Bracket | Male | Female |
| 5 to 17 Years | 0 (0.0%) | 0 (0.0%) |
| 18 to 34 Years | 0 (0.0%) | 0 (0.0%) |
| 35 to 64 Years | 17 (3.0%) | 55 (13.9%) |
| 65 to 74 Years | 7 (7.1%) | 106 (60.2%) |
| 75 Years and over | 21 (19.8%) | 58 (32.6%) |
Disability Class: Self-Care Difficulty
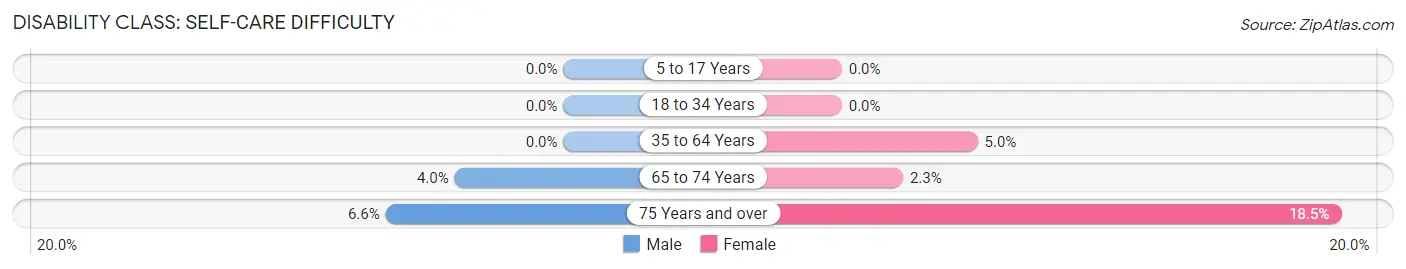
| Age Bracket | Male | Female |
| 5 to 17 Years | 0 (0.0%) | 0 (0.0%) |
| 18 to 34 Years | 0 (0.0%) | 0 (0.0%) |
| 35 to 64 Years | 0 (0.0%) | 20 (5.0%) |
| 65 to 74 Years | 4 (4.0%) | 4 (2.3%) |
| 75 Years and over | 7 (6.6%) | 33 (18.5%) |
Technology Access in Northfield
Computing Device Access in Northfield
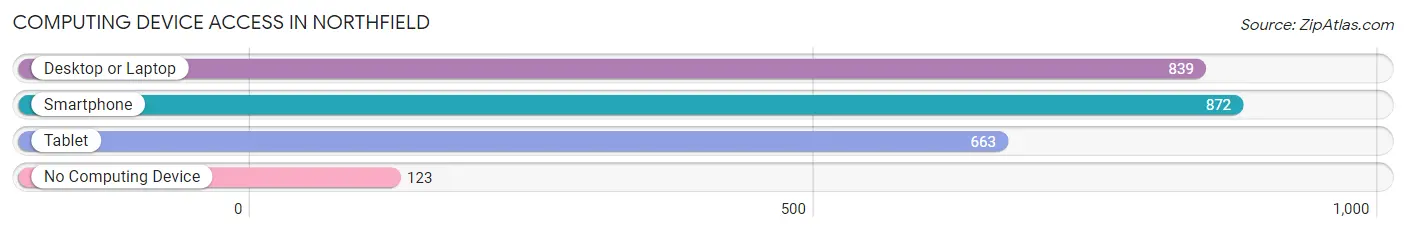
| Device Type | # Households | % Households |
| Desktop or Laptop | 839 | 73.3% |
| Smartphone | 872 | 76.2% |
| Tablet | 663 | 58.0% |
| No Computing Device | 123 | 10.7% |
| Total | 1,144 | 100.0% |
Internet Access in Northfield
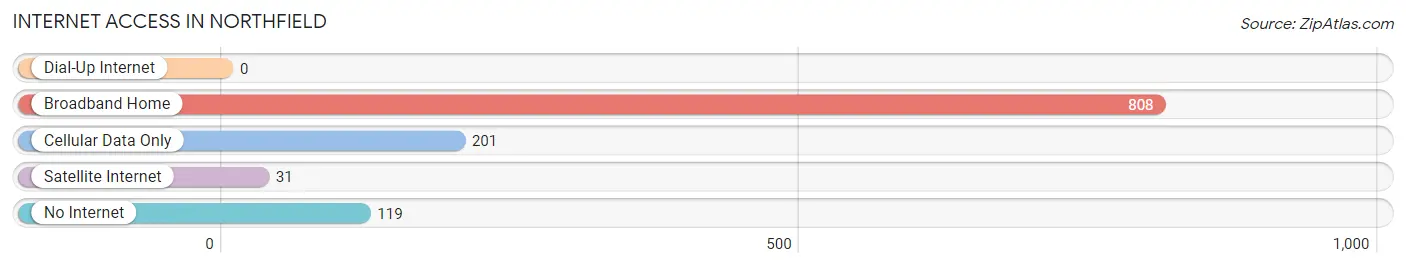
| Internet Type | # Households | % Households |
| Dial-Up Internet | 0 | 0.0% |
| Broadband Home | 808 | 70.6% |
| Cellular Data Only | 201 | 17.6% |
| Satellite Internet | 31 | 2.7% |
| No Internet | 119 | 10.4% |
| Total | 1,144 | 100.0% |
Northfield Summary
Northfield is a town located in Washington County, Vermont, United States. The population was 6,207 at the 2010 census. It is the home of Norwich University, the oldest private military college in the United States.
History
Northfield was first settled in 1781 by a group of settlers from Massachusetts. The town was named after Northfield, Massachusetts, the original home of many of the settlers. The town was incorporated in 1781.
In 1819, the Vermont legislature granted a charter to Norwich University, the first private military college in the United States. The university was founded by Captain Alden Partridge, a former West Point instructor. The university has been in continuous operation since its founding and is now the oldest private military college in the United States.
Geography
Northfield is located in central Washington County, in the center of the state. It is bordered to the north by Berlin, to the east by Williamstown, to the south by Roxbury, and to the west by Moretown.
According to the United States Census Bureau, the town has a total area of 33.2 square miles (86.1 km2), of which 33.1 square miles (85.9 km2) is land and 0.1 square miles (0.2 km2) is water. The Winooski River flows through the town, and the town is located in the Green Mountains.
Economy
Northfield's economy is largely based on education and tourism. Norwich University is the largest employer in the town, and the university's presence has helped to attract other businesses to the area. The town is also home to several small businesses, including a number of restaurants, retail stores, and service providers.
Tourism is also an important part of the local economy. The town is home to several historic sites, including the Northfield Historical Society Museum, the Northfield Historical Society Library, and the Northfield Historical Society Archives. The town is also home to several outdoor recreation areas, including the Northfield Falls State Park and the Northfield Mountain Recreation Area.
Demographics
As of the census of 2010, there were 6,207 people, 2,093 households, and 1,521 families residing in the town. The population density was 187.3 people per square mile (72.4/km2). There were 2,093 housing units at an average density of 63.2 per square mile (24.4/km2). The racial makeup of the town was 96.2% White, 0.7% African American, 0.3% Native American, 0.9% Asian, 0.1% Pacific Islander, 0.4% from other races, and 1.4% from two or more races. Hispanic or Latino of any race were 1.7% of the population.
There were 2,093 households, out of which 33.2% had children under the age of 18 living with them, 56.2% were married couples living together, 9.7% had a female householder with no husband present, and 30.2% were non-families. 24.2% of all households were made up of individuals, and 9.7% had someone living alone who was 65 years of age or older. The average household size was 2.50 and the average family size was 2.97.
In the town, the population was spread out, with 22.7% under the age of 18, 15.2% from 18 to 24, 24.2% from 25 to 44, 24.2% from 45 to 64, and 13.7% who were 65 years of age or older. The median age was 36 years. For every 100 females, there were 91.2 males. For every 100 females age 18 and over, there were 88.3 males.
The median income for a household in the town was $45,938, and the median income for a family was $54,917. Males had a median income of $36,944 versus $27,917 for females. The per capita income for the town was $20,945. About 5.2% of families and 8.3% of the population were below the poverty line, including 8.3% of those under age 18 and 8.2% of those age 65 or over.
Common Questions
What is the Total Population of Northfield?
Total Population of Northfield is 4,390.
What is the Total Male Population of Northfield?
Total Male Population of Northfield is 2,390.
What is the Total Female Population of Northfield?
Total Female Population of Northfield is 2,000.
What is the Ratio of Males per 100 Females in Northfield?
There are 119.50 Males per 100 Females in Northfield.
What is the Ratio of Females per 100 Males in Northfield?
There are 83.68 Females per 100 Males in Northfield.
What is the Median Population Age in Northfield?
Median Population Age in Northfield is 25.3 Years.
What is the Average Family Size in Northfield
Average Family Size in Northfield is 3.0 People.
What is the Average Household Size in Northfield
Average Household Size in Northfield is 2.5 People.
What is Per Capita Income in Northfield?
Per Capita income in Northfield is $25,386.
What is the Median Family Income in Northfield?
Median Family Income in Northfield is $83,333.
What is the Median Household income in Northfield?
Median Household Income in Northfield is $65,926.
What is Income or Wage Gap in Northfield?
Income or Wage Gap in Northfield is 8.0%.
Women in Northfield earn 92.0 cents for every dollar earned by a man.
What is Inequality or Gini Index in Northfield?
Inequality or Gini Index in Northfield is 0.40.
How Large is the Labor Force in Northfield?
There are 2,204 People in the Labor Forcein in Northfield.
What is the Percentage of People in the Labor Force in Northfield?
56.6% of People are in the Labor Force in Northfield.
What is the Unemployment Rate in Northfield?
Unemployment Rate in Northfield is 2.0%.