North Bennington, VT
North Bennington Map
North Bennington Overview
1,420
TOTAL POPULATION
685
MALE POPULATION
735
FEMALE POPULATION
93.20
MALES / 100 FEMALES
107.30
FEMALES / 100 MALES
35.9
MEDIAN AGE
2.8
AVG FAMILY SIZE
2.8
AVG HOUSEHOLD SIZE
$26,321
PER CAPITA INCOME
$68,229
AVG FAMILY INCOME
$62,125
AVG HOUSEHOLD INCOME
41.7%
WAGE / INCOME GAP [ % ]
58.3¢/ $1
WAGE / INCOME GAP [ $ ]
0.41
INEQUALITY / GINI INDEX
620
LABOR FORCE [ PEOPLE ]
46.8%
PERCENT IN LABOR FORCE
6.0%
UNEMPLOYMENT RATE
North Bennington Zip Codes
North Bennington Area Codes
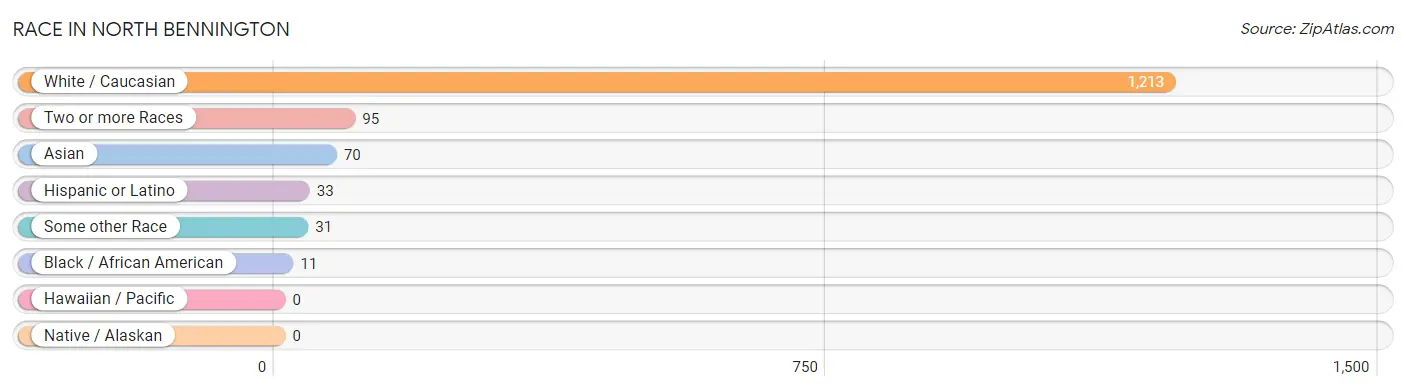
Race in North Bennington
The most populous races in North Bennington are White / Caucasian (1,213 | 85.4%), Two or more Races (95 | 6.7%), and Asian (70 | 4.9%).
| Race | # Population | % Population |
| Asian | 70 | 4.9% |
| Black / African American | 11 | 0.8% |
| Hawaiian / Pacific | 0 | 0.0% |
| Hispanic or Latino | 33 | 2.3% |
| Native / Alaskan | 0 | 0.0% |
| White / Caucasian | 1,213 | 85.4% |
| Two or more Races | 95 | 6.7% |
| Some other Race | 31 | 2.2% |
| Total | 1,420 | 100.0% |
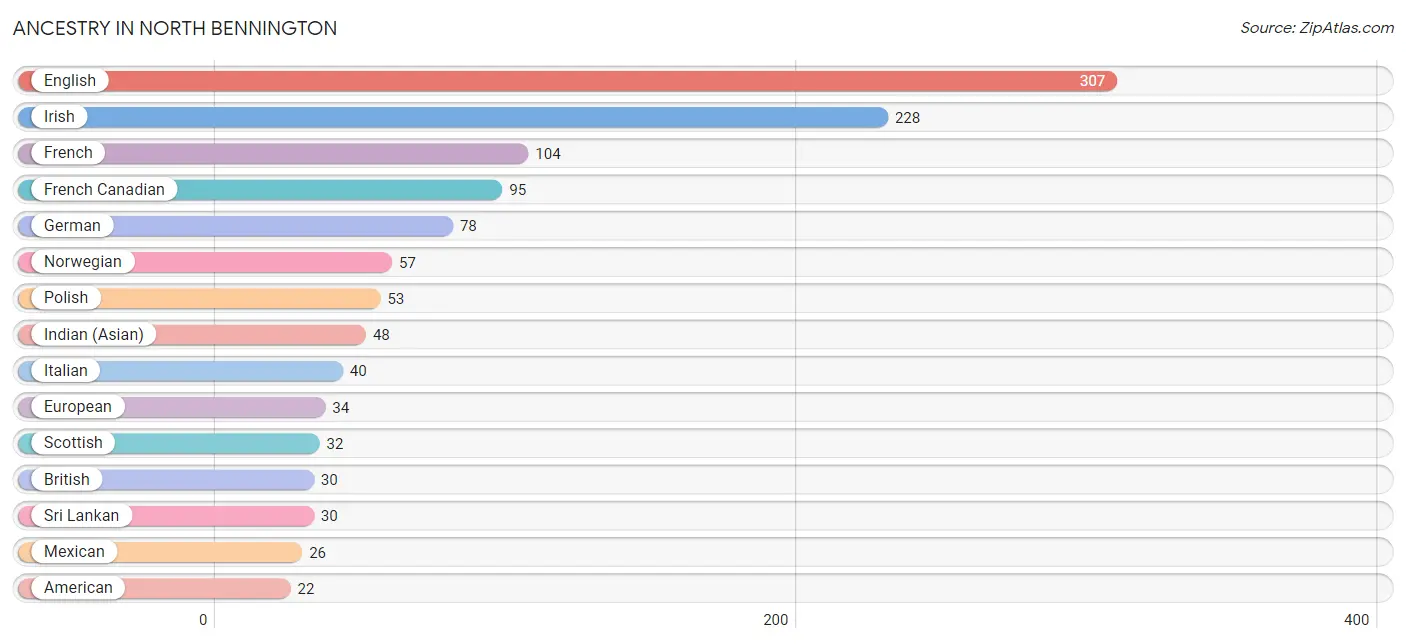
Ancestry in North Bennington
The most populous ancestries reported in North Bennington are English (307 | 21.6%), Irish (228 | 16.1%), French (104 | 7.3%), French Canadian (95 | 6.7%), and German (78 | 5.5%), together accounting for 57.2% of all North Bennington residents.
| Ancestry | # Population | % Population |
| American | 22 | 1.5% |
| Arab | 7 | 0.5% |
| Bhutanese | 1 | 0.1% |
| British | 30 | 2.1% |
| Canadian | 18 | 1.3% |
| Danish | 10 | 0.7% |
| Dutch | 5 | 0.4% |
| Eastern European | 3 | 0.2% |
| English | 307 | 21.6% |
| European | 34 | 2.4% |
| French | 104 | 7.3% |
| French Canadian | 95 | 6.7% |
| German | 78 | 5.5% |
| Greek | 13 | 0.9% |
| Hungarian | 3 | 0.2% |
| Indian (Asian) | 48 | 3.4% |
| Irish | 228 | 16.1% |
| Iroquois | 14 | 1.0% |
| Italian | 40 | 2.8% |
| Korean | 5 | 0.4% |
| Lebanese | 7 | 0.5% |
| Lithuanian | 5 | 0.4% |
| Mexican | 26 | 1.8% |
| Mexican American Indian | 3 | 0.2% |
| Native Hawaiian | 2 | 0.1% |
| Northern European | 7 | 0.5% |
| Norwegian | 57 | 4.0% |
| Polish | 53 | 3.7% |
| Puerto Rican | 7 | 0.5% |
| Russian | 10 | 0.7% |
| Scandinavian | 2 | 0.1% |
| Scotch-Irish | 5 | 0.4% |
| Scottish | 32 | 2.2% |
| Sri Lankan | 30 | 2.1% |
| Subsaharan African | 12 | 0.9% |
| Swedish | 12 | 0.9% |
| Thai | 2 | 0.1% |
| Turkish | 13 | 0.9% |
| Ukrainian | 7 | 0.5% |
| Welsh | 2 | 0.1% |
| Yugoslavian | 9 | 0.6% | View All 41 Rows |
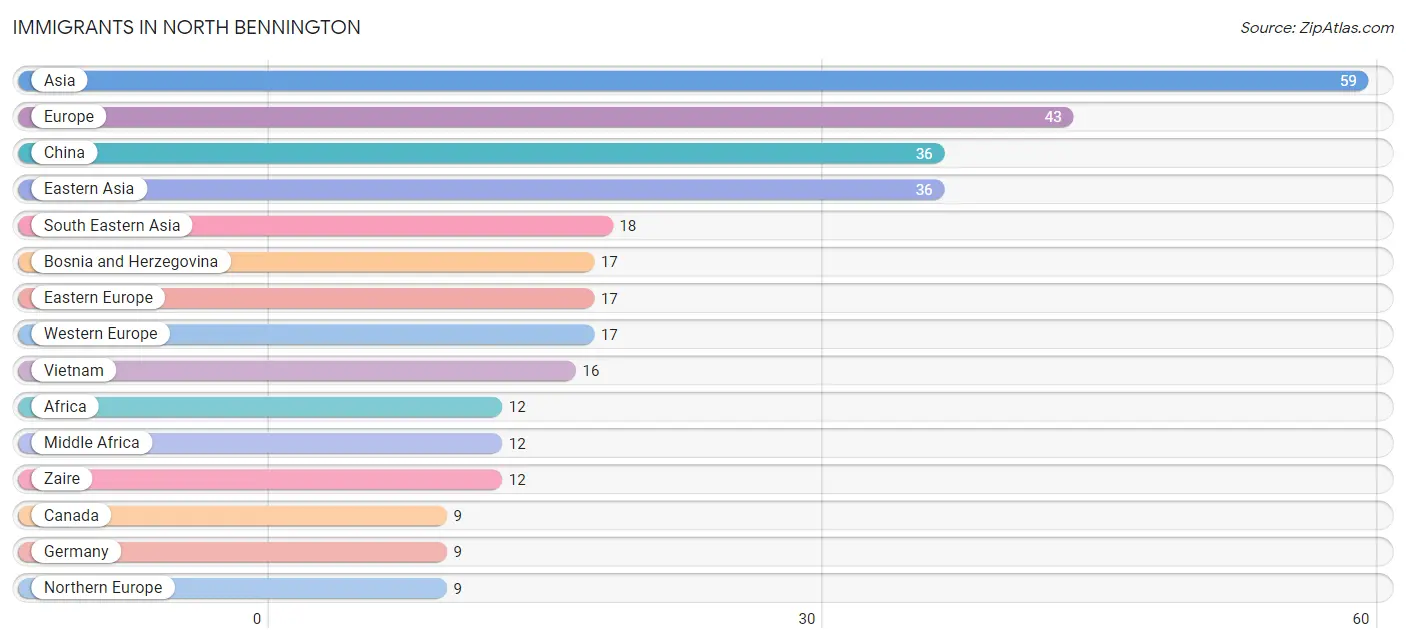
Immigrants in North Bennington
The most numerous immigrant groups reported in North Bennington came from Asia (59 | 4.2%), Europe (43 | 3.0%), China (36 | 2.5%), Eastern Asia (36 | 2.5%), and South Eastern Asia (18 | 1.3%), together accounting for 13.5% of all North Bennington residents.
| Immigration Origin | # Population | % Population |
| Africa | 12 | 0.9% |
| Asia | 59 | 4.2% |
| Bosnia and Herzegovina | 17 | 1.2% |
| Canada | 9 | 0.6% |
| China | 36 | 2.5% |
| Eastern Asia | 36 | 2.5% |
| Eastern Europe | 17 | 1.2% |
| England | 7 | 0.5% |
| Europe | 43 | 3.0% |
| France | 3 | 0.2% |
| Germany | 9 | 0.6% |
| Lebanon | 3 | 0.2% |
| Malaysia | 2 | 0.1% |
| Middle Africa | 12 | 0.9% |
| Netherlands | 5 | 0.4% |
| Northern Europe | 9 | 0.6% |
| South Eastern Asia | 18 | 1.3% |
| Turkey | 2 | 0.1% |
| Vietnam | 16 | 1.1% |
| Western Asia | 5 | 0.4% |
| Western Europe | 17 | 1.2% |
| Zaire | 12 | 0.9% | View All 22 Rows |
Sex and Age in North Bennington
Sex and Age in North Bennington
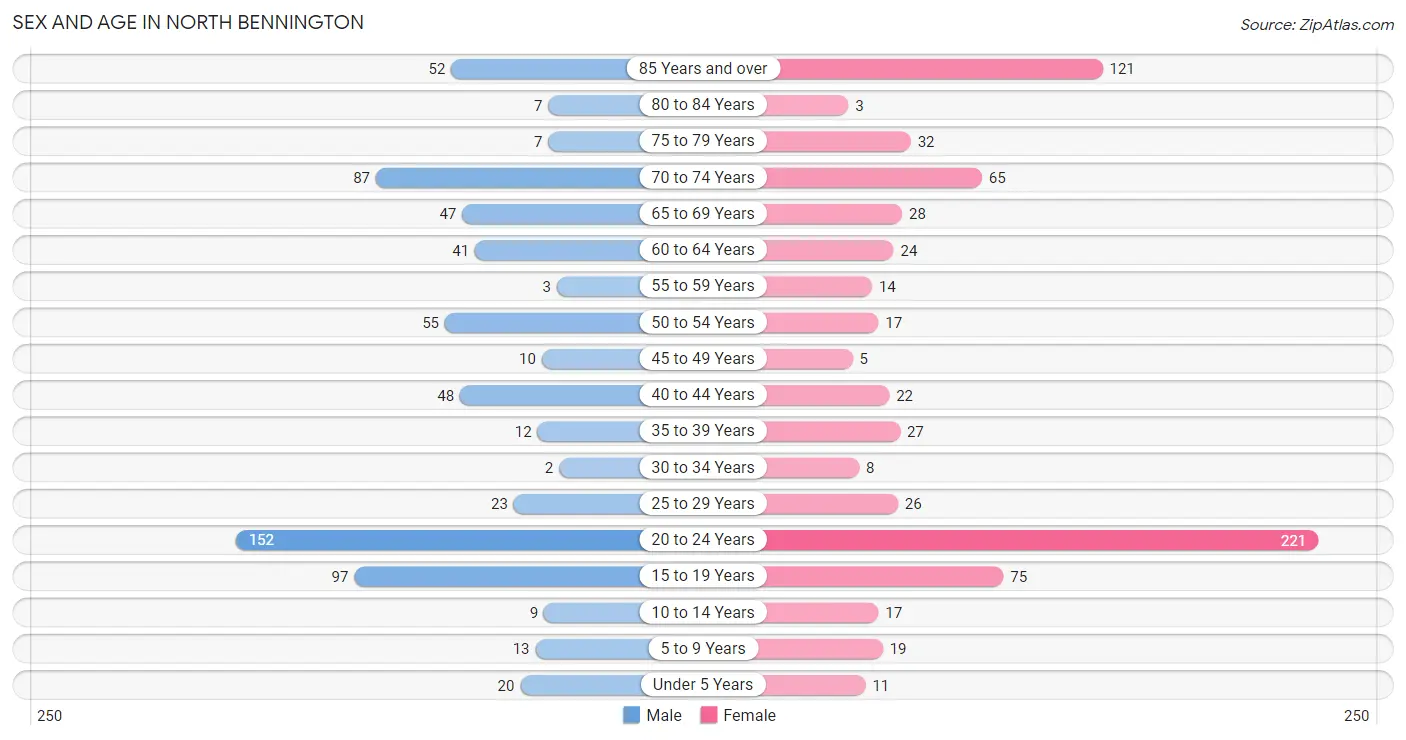
The most populous age groups in North Bennington are 20 to 24 Years (152 | 22.2%) for men and 20 to 24 Years (221 | 30.1%) for women.
| Age Bracket | Male | Female |
| Under 5 Years | 20 (2.9%) | 11 (1.5%) |
| 5 to 9 Years | 13 (1.9%) | 19 (2.6%) |
| 10 to 14 Years | 9 (1.3%) | 17 (2.3%) |
| 15 to 19 Years | 97 (14.2%) | 75 (10.2%) |
| 20 to 24 Years | 152 (22.2%) | 221 (30.1%) |
| 25 to 29 Years | 23 (3.4%) | 26 (3.5%) |
| 30 to 34 Years | 2 (0.3%) | 8 (1.1%) |
| 35 to 39 Years | 12 (1.8%) | 27 (3.7%) |
| 40 to 44 Years | 48 (7.0%) | 22 (3.0%) |
| 45 to 49 Years | 10 (1.5%) | 5 (0.7%) |
| 50 to 54 Years | 55 (8.0%) | 17 (2.3%) |
| 55 to 59 Years | 3 (0.4%) | 14 (1.9%) |
| 60 to 64 Years | 41 (6.0%) | 24 (3.3%) |
| 65 to 69 Years | 47 (6.9%) | 28 (3.8%) |
| 70 to 74 Years | 87 (12.7%) | 65 (8.8%) |
| 75 to 79 Years | 7 (1.0%) | 32 (4.3%) |
| 80 to 84 Years | 7 (1.0%) | 3 (0.4%) |
| 85 Years and over | 52 (7.6%) | 121 (16.5%) |
| Total | 685 (100.0%) | 735 (100.0%) |
Families and Households in North Bennington
Median Family Size in North Bennington
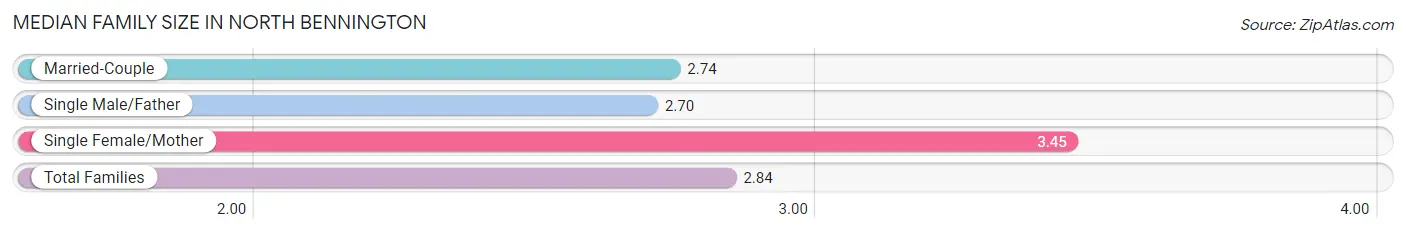
The median family size in North Bennington is 2.84 persons per family, with single female/mother families (31 | 15.3%) accounting for the largest median family size of 3.45 persons per family. On the other hand, single male/father families (20 | 9.9%) represent the smallest median family size with 2.70 persons per family.
| Family Type | # Families | Family Size |
| Married-Couple | 152 (74.9%) | 2.74 |
| Single Male/Father | 20 (9.9%) | 2.70 |
| Single Female/Mother | 31 (15.3%) | 3.45 |
| Total Families | 203 (100.0%) | 2.84 |
Median Household Size in North Bennington
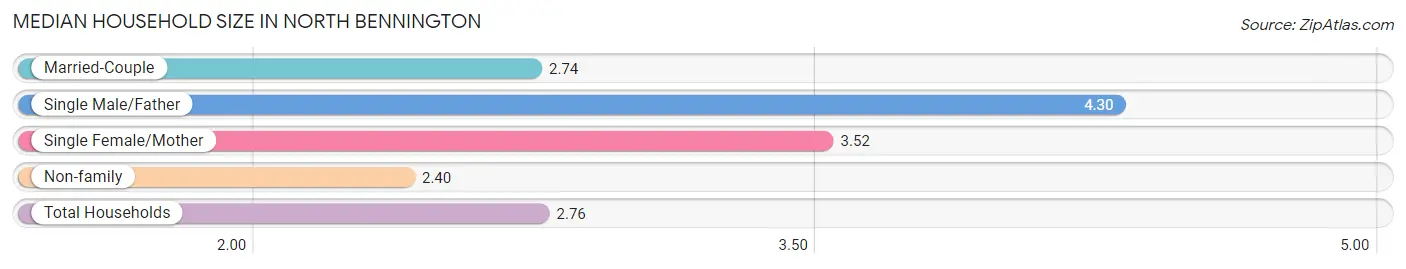
The median household size in North Bennington is 2.76 persons per household, with single male/father households (20 | 5.8%) accounting for the largest median household size of 4.3 persons per household. non-family households (144 | 41.5%) represent the smallest median household size with 2.40 persons per household.
| Household Type | # Households | Household Size |
| Married-Couple | 152 (43.8%) | 2.74 |
| Single Male/Father | 20 (5.8%) | 4.30 |
| Single Female/Mother | 31 (8.9%) | 3.52 |
| Non-family | 144 (41.5%) | 2.40 |
| Total Households | 347 (100.0%) | 2.76 |
Household Size by Marriage Status in North Bennington
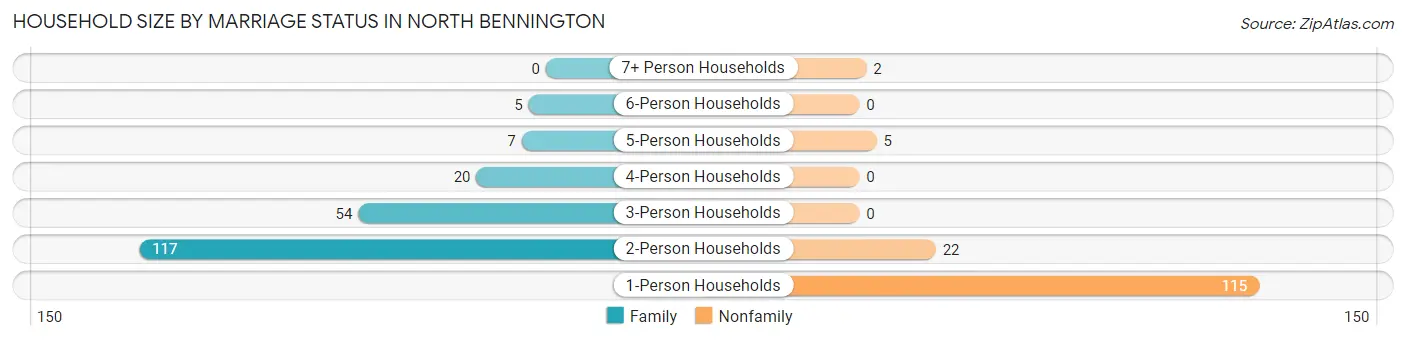
Out of a total of 347 households in North Bennington, 203 (58.5%) are family households, while 144 (41.5%) are nonfamily households. The most numerous type of family households are 2-person households, comprising 117, and the most common type of nonfamily households are 1-person households, comprising 115.
| Household Size | Family Households | Nonfamily Households |
| 1-Person Households | - | 115 (33.1%) |
| 2-Person Households | 117 (33.7%) | 22 (6.3%) |
| 3-Person Households | 54 (15.6%) | 0 (0.0%) |
| 4-Person Households | 20 (5.8%) | 0 (0.0%) |
| 5-Person Households | 7 (2.0%) | 5 (1.4%) |
| 6-Person Households | 5 (1.4%) | 0 (0.0%) |
| 7+ Person Households | 0 (0.0%) | 2 (0.6%) |
| Total | 203 (58.5%) | 144 (41.5%) |
Female Fertility in North Bennington
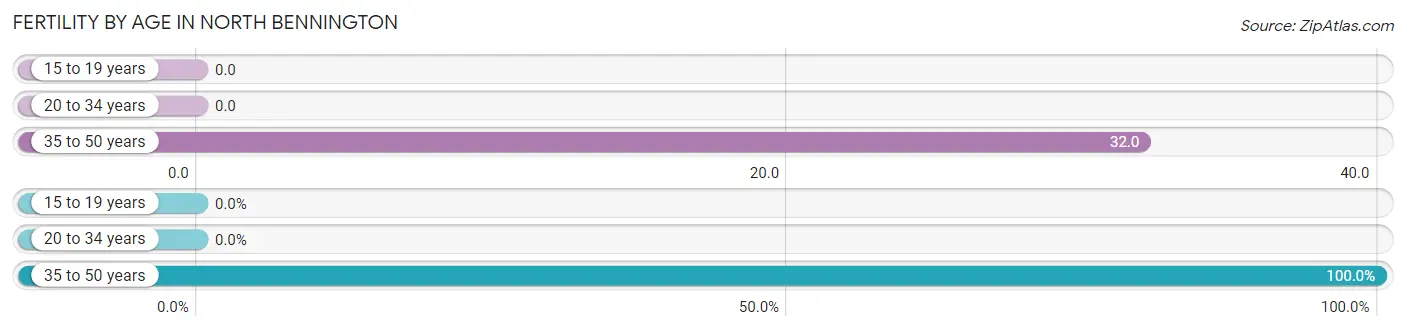
Fertility by Age in North Bennington
Average fertility rate in North Bennington is 5.0 births per 1,000 women. Women in the age bracket of 35 to 50 years have the highest fertility rate with 32.0 births per 1,000 women. Women in the age bracket of 35 to 50 years acount for 100.0% of all women with births.
| Age Bracket | Women with Births | Births / 1,000 Women |
| 15 to 19 years | 0 (0.0%) | 0.0 |
| 20 to 34 years | 0 (0.0%) | 0.0 |
| 35 to 50 years | 2 (100.0%) | 32.0 |
| Total | 2 (100.0%) | 5.0 |
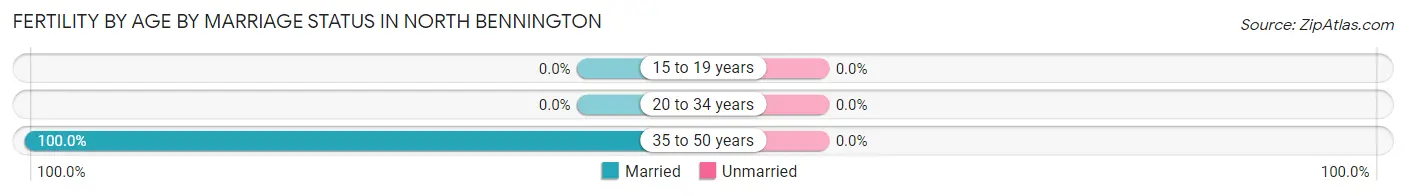
Fertility by Age by Marriage Status in North Bennington
| Age Bracket | Married | Unmarried |
| 15 to 19 years | 0 (0.0%) | 0 (0.0%) |
| 20 to 34 years | 0 (0.0%) | 0 (0.0%) |
| 35 to 50 years | 2 (100.0%) | 0 (0.0%) |
| Total | 2 (100.0%) | 0 (0.0%) |
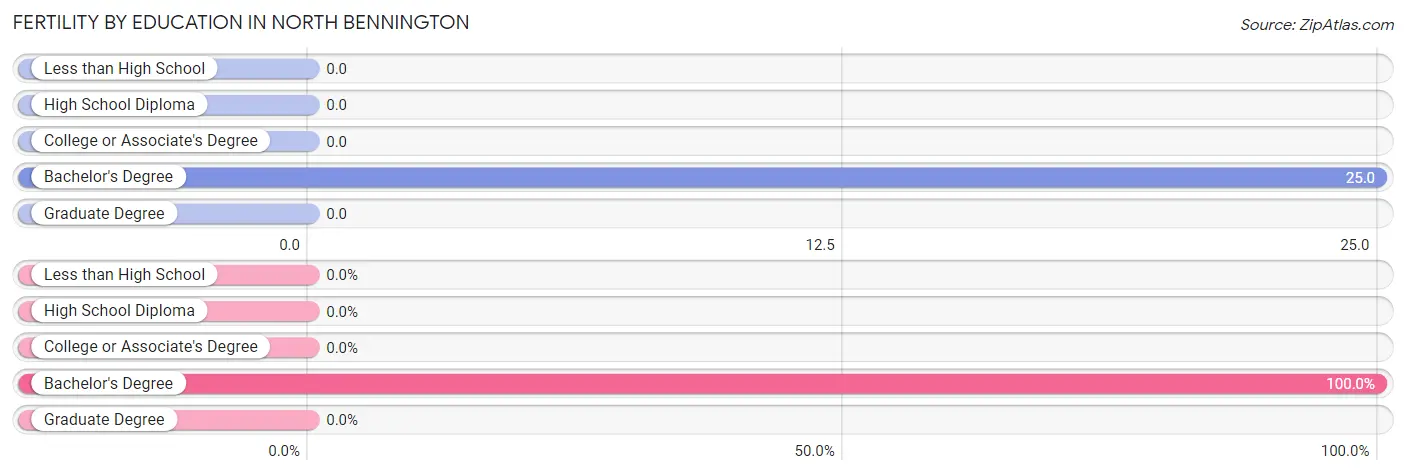
Fertility by Education in North Bennington
| Educational Attainment | Women with Births | Births / 1,000 Women |
| Less than High School | 0 (0.0%) | 0.0 |
| High School Diploma | 0 (0.0%) | 0.0 |
| College or Associate's Degree | 0 (0.0%) | 0.0 |
| Bachelor's Degree | 2 (100.0%) | 25.0 |
| Graduate Degree | 0 (0.0%) | 0.0 |
| Total | 2 (100.0%) | 5.0 |
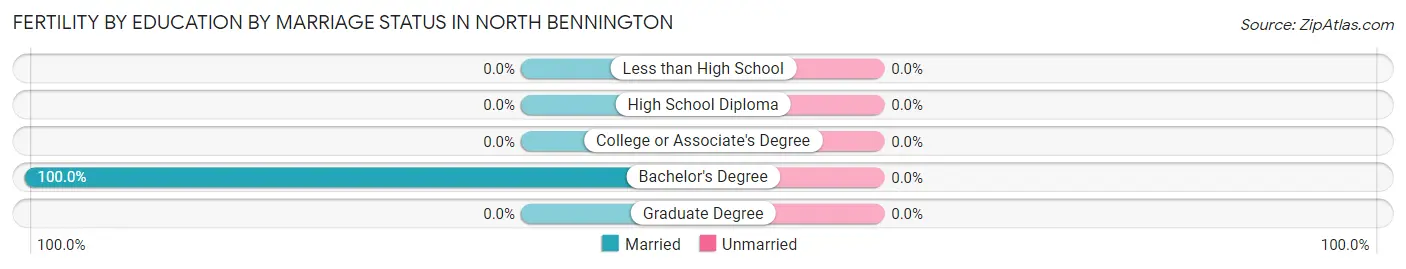
Fertility by Education by Marriage Status in North Bennington
| Educational Attainment | Married | Unmarried |
| Less than High School | 0 (0.0%) | 0 (0.0%) |
| High School Diploma | 0 (0.0%) | 0 (0.0%) |
| College or Associate's Degree | 0 (0.0%) | 0 (0.0%) |
| Bachelor's Degree | 2 (100.0%) | 0 (0.0%) |
| Graduate Degree | 0 (0.0%) | 0 (0.0%) |
| Total | 2 (100.0%) | 0 (0.0%) |
Income in North Bennington
Income Overview in North Bennington
Per Capita Income in North Bennington is $26,321, while median incomes of families and households are $68,229 and $62,125 respectively.
| Characteristic | Number | Measure |
| Per Capita Income | 1,420 | $26,321 |
| Median Family Income | 203 | $68,229 |
| Mean Family Income | 203 | $92,067 |
| Median Household Income | 347 | $62,125 |
| Mean Household Income | 347 | $78,074 |
| Income Deficit | 203 | $0 |
| Wage / Income Gap (%) | 1,420 | 41.65% |
| Wage / Income Gap ($) | 1,420 | 58.35¢ per $1 |
| Gini / Inequality Index | 1,420 | 0.41 |
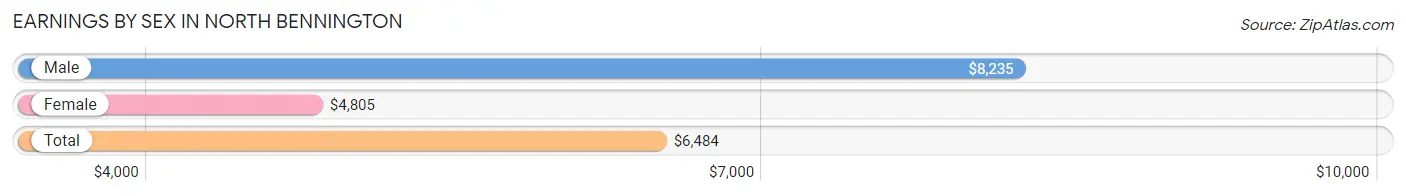
Earnings by Sex in North Bennington
Average Earnings in North Bennington are $6,484, $8,235 for men and $4,805 for women, a difference of 41.6%.
| Sex | Number | Average Earnings |
| Male | 380 (48.4%) | $8,235 |
| Female | 405 (51.6%) | $4,805 |
| Total | 785 (100.0%) | $6,484 |
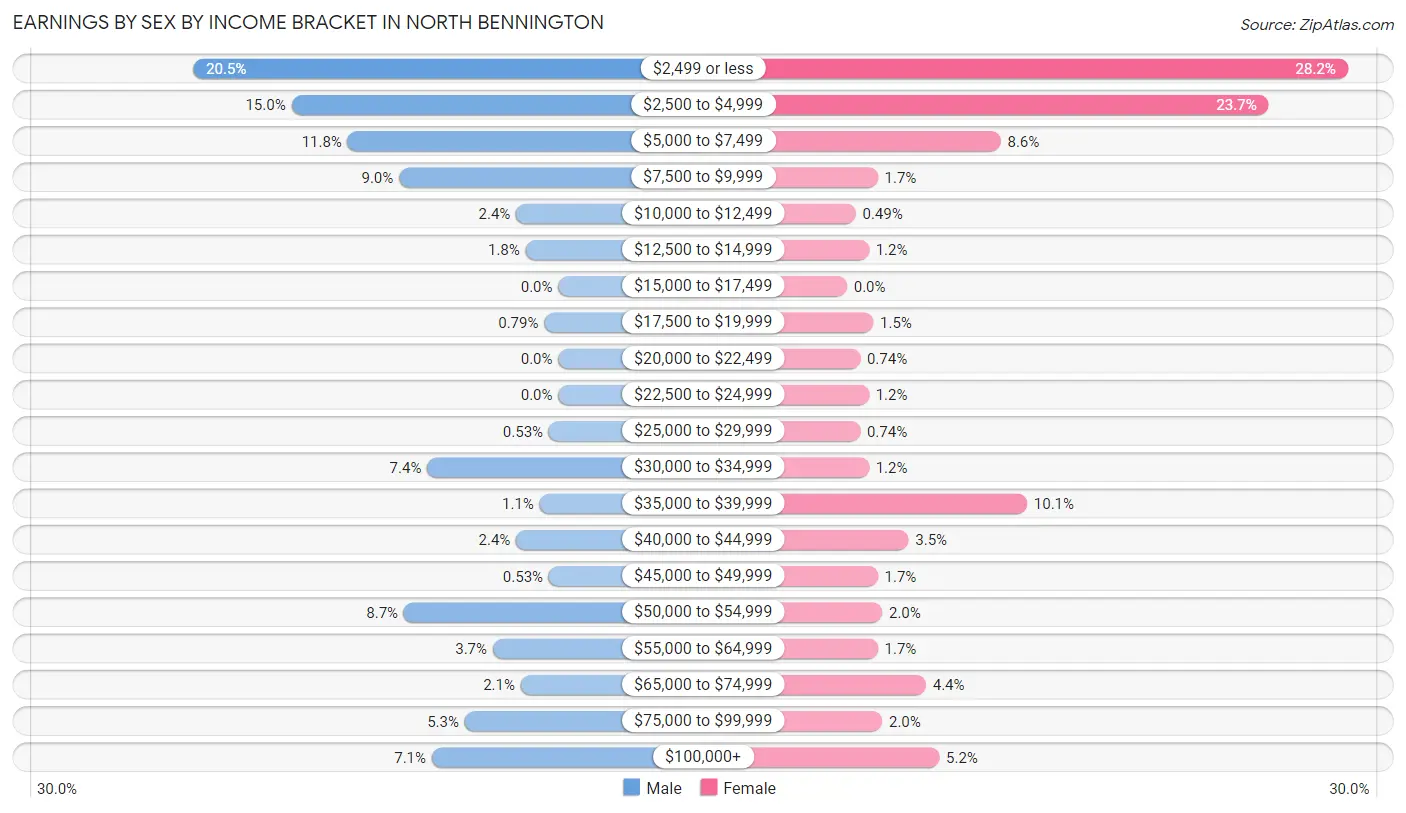
Earnings by Sex by Income Bracket in North Bennington
The most common earnings brackets in North Bennington are $2,499 or less for men (78 | 20.5%) and $2,499 or less for women (114 | 28.1%).
| Income | Male | Female |
| $2,499 or less | 78 (20.5%) | 114 (28.1%) |
| $2,500 to $4,999 | 57 (15.0%) | 96 (23.7%) |
| $5,000 to $7,499 | 45 (11.8%) | 35 (8.6%) |
| $7,500 to $9,999 | 34 (8.9%) | 7 (1.7%) |
| $10,000 to $12,499 | 9 (2.4%) | 2 (0.5%) |
| $12,500 to $14,999 | 7 (1.8%) | 5 (1.2%) |
| $15,000 to $17,499 | 0 (0.0%) | 0 (0.0%) |
| $17,500 to $19,999 | 3 (0.8%) | 6 (1.5%) |
| $20,000 to $22,499 | 0 (0.0%) | 3 (0.7%) |
| $22,500 to $24,999 | 0 (0.0%) | 5 (1.2%) |
| $25,000 to $29,999 | 2 (0.5%) | 3 (0.7%) |
| $30,000 to $34,999 | 28 (7.4%) | 5 (1.2%) |
| $35,000 to $39,999 | 4 (1.1%) | 41 (10.1%) |
| $40,000 to $44,999 | 9 (2.4%) | 14 (3.5%) |
| $45,000 to $49,999 | 2 (0.5%) | 7 (1.7%) |
| $50,000 to $54,999 | 33 (8.7%) | 8 (2.0%) |
| $55,000 to $64,999 | 14 (3.7%) | 7 (1.7%) |
| $65,000 to $74,999 | 8 (2.1%) | 18 (4.4%) |
| $75,000 to $99,999 | 20 (5.3%) | 8 (2.0%) |
| $100,000+ | 27 (7.1%) | 21 (5.2%) |
| Total | 380 (100.0%) | 405 (100.0%) |
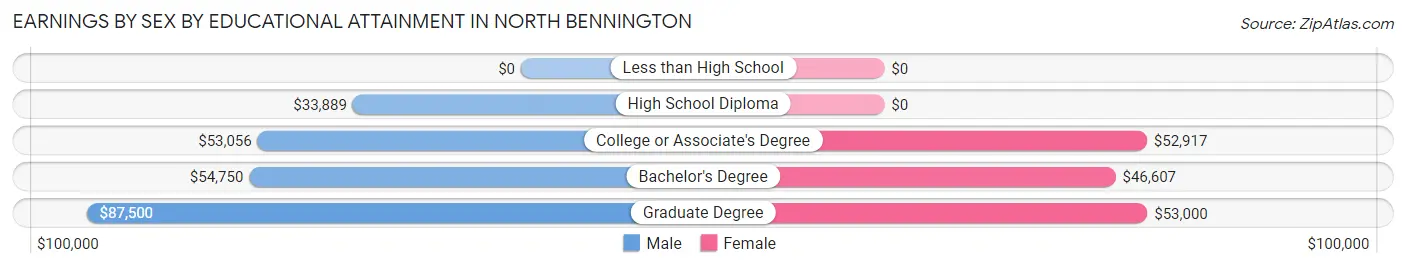
Earnings by Sex by Educational Attainment in North Bennington
Average earnings in North Bennington are $53,523 for men and $43,438 for women, a difference of 18.8%. Men with an educational attainment of graduate degree enjoy the highest average annual earnings of $87,500, while those with high school diploma education earn the least with $33,889. Women with an educational attainment of graduate degree earn the most with the average annual earnings of $53,000, while those with bachelor's degree education have the smallest earnings of $46,607.
| Educational Attainment | Male Income | Female Income |
| Less than High School | - | - |
| High School Diploma | $33,889 | $0 |
| College or Associate's Degree | $53,056 | $52,917 |
| Bachelor's Degree | $54,750 | $46,607 |
| Graduate Degree | $87,500 | $53,000 |
| Total | $53,523 | $43,438 |
Family Income in North Bennington
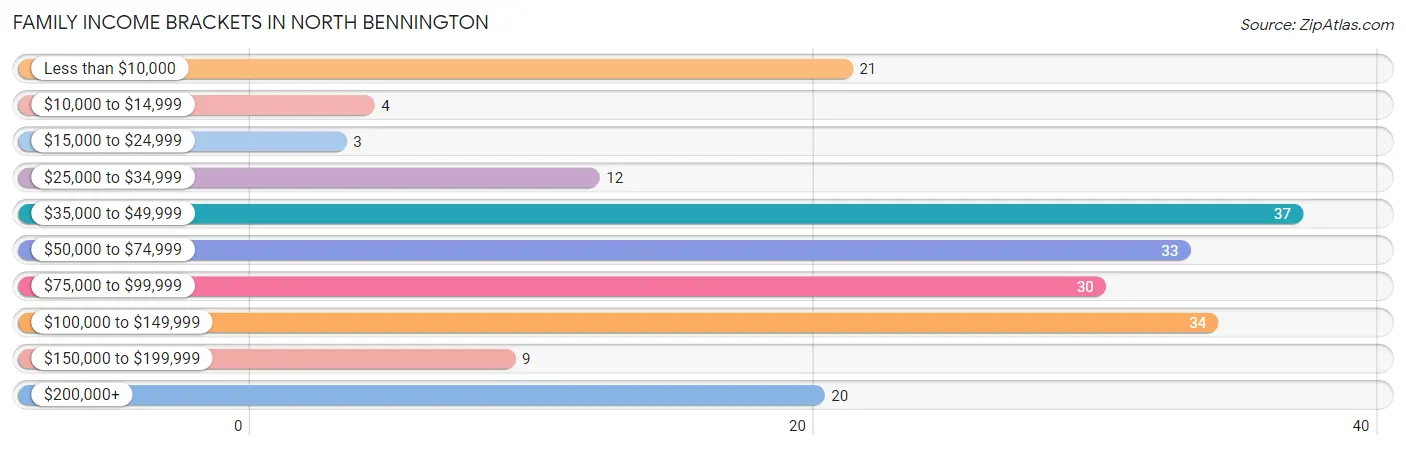
Family Income Brackets in North Bennington
According to the North Bennington family income data, there are 37 families falling into the $35,000 to $49,999 income range, which is the most common income bracket and makes up 18.2% of all families. Conversely, the $15,000 to $24,999 income bracket is the least frequent group with only 3 families (1.5%) belonging to this category.
| Income Bracket | # Families | % Families |
| Less than $10,000 | 21 | 10.3% |
| $10,000 to $14,999 | 4 | 2.0% |
| $15,000 to $24,999 | 3 | 1.5% |
| $25,000 to $34,999 | 12 | 5.9% |
| $35,000 to $49,999 | 37 | 18.2% |
| $50,000 to $74,999 | 33 | 16.3% |
| $75,000 to $99,999 | 30 | 14.8% |
| $100,000 to $149,999 | 34 | 16.7% |
| $150,000 to $199,999 | 9 | 4.4% |
| $200,000+ | 20 | 9.9% |
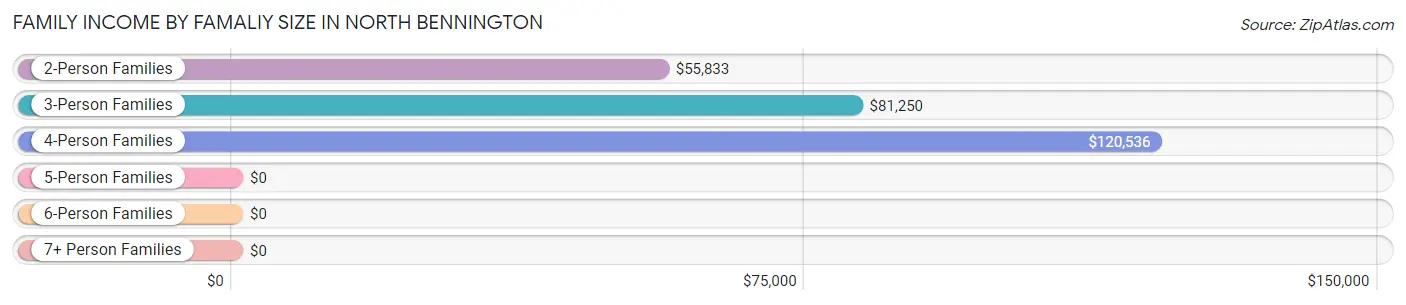
Family Income by Famaliy Size in North Bennington
4-person families (23 | 11.3%) account for the highest median family income in North Bennington with $120,536 per family, while 4-person families (23 | 11.3%) have the highest median income of $30,134 per family member.
| Income Bracket | # Families | Median Income |
| 2-Person Families | 132 (65.0%) | $55,833 |
| 3-Person Families | 41 (20.2%) | $81,250 |
| 4-Person Families | 23 (11.3%) | $120,536 |
| 5-Person Families | 2 (1.0%) | $0 |
| 6-Person Families | 5 (2.5%) | $0 |
| 7+ Person Families | 0 (0.0%) | $0 |
| Total | 203 (100.0%) | $68,229 |
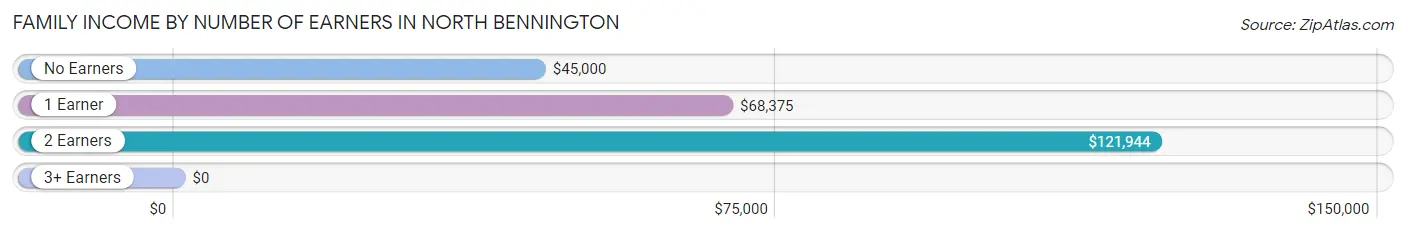
Family Income by Number of Earners in North Bennington
| Number of Earners | # Families | Median Income |
| No Earners | 56 (27.6%) | $45,000 |
| 1 Earner | 81 (39.9%) | $68,375 |
| 2 Earners | 54 (26.6%) | $121,944 |
| 3+ Earners | 12 (5.9%) | $0 |
| Total | 203 (100.0%) | $68,229 |
Household Income in North Bennington
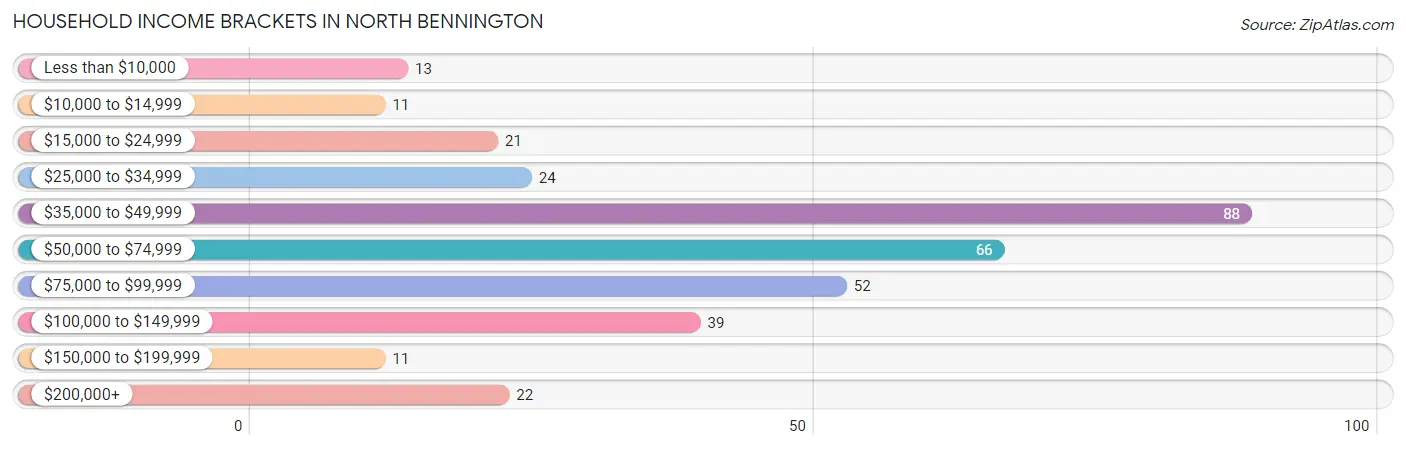
Household Income Brackets in North Bennington
With 88 households falling in the category, the $35,000 to $49,999 income range is the most frequent in North Bennington, accounting for 25.4% of all households. In contrast, only 11 households (3.2%) fall into the $10,000 to $14,999 income bracket, making it the least populous group.
| Income Bracket | # Households | % Households |
| Less than $10,000 | 13 | 3.7% |
| $10,000 to $14,999 | 11 | 3.2% |
| $15,000 to $24,999 | 21 | 6.1% |
| $25,000 to $34,999 | 24 | 6.9% |
| $35,000 to $49,999 | 88 | 25.4% |
| $50,000 to $74,999 | 66 | 19.0% |
| $75,000 to $99,999 | 52 | 15.0% |
| $100,000 to $149,999 | 39 | 11.2% |
| $150,000 to $199,999 | 11 | 3.2% |
| $200,000+ | 22 | 6.3% |
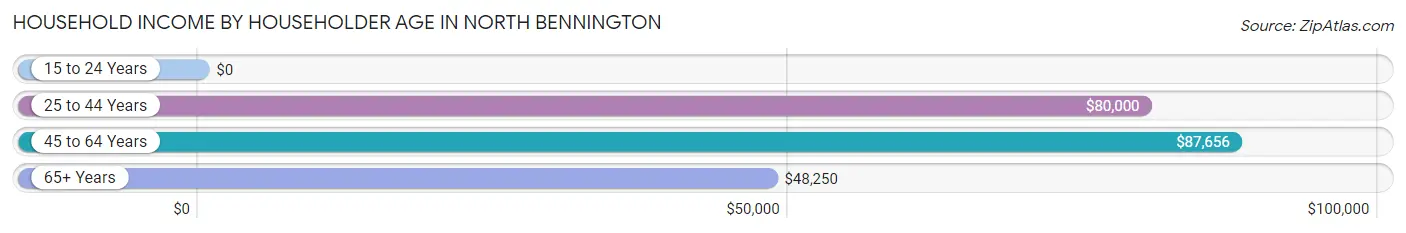
Household Income by Householder Age in North Bennington
The median household income in North Bennington is $62,125, with the highest median household income of $87,656 found in the 45 to 64 years age bracket for the primary householder. A total of 93 households (26.8%) fall into this category. Meanwhile, the 15 to 24 years age bracket for the primary householder has the lowest median household income of $0, with 27 households (7.8%) in this group.
| Income Bracket | # Households | Median Income |
| 15 to 24 Years | 27 (7.8%) | $0 |
| 25 to 44 Years | 54 (15.6%) | $80,000 |
| 45 to 64 Years | 93 (26.8%) | $87,656 |
| 65+ Years | 173 (49.9%) | $48,250 |
| Total | 347 (100.0%) | $62,125 |
Poverty in North Bennington
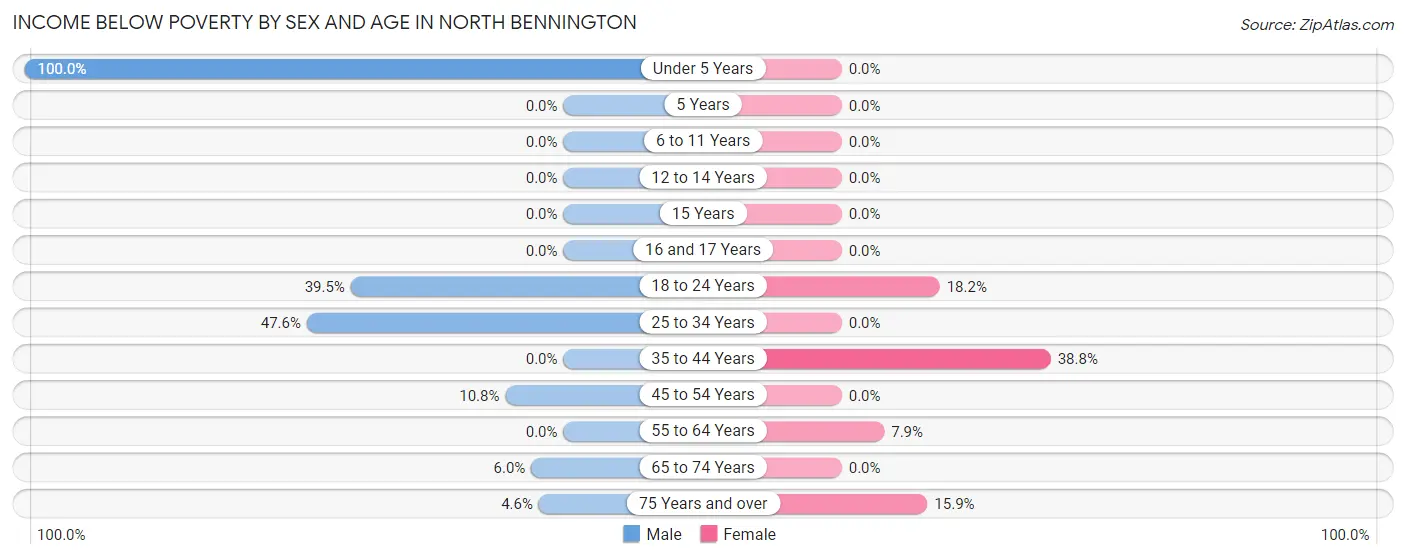
Income Below Poverty by Sex and Age in North Bennington
With 12.9% poverty level for males and 11.2% for females among the residents of North Bennington, under 5 year old males and 35 to 44 year old females are the most vulnerable to poverty, with 20 males (100.0%) and 19 females (38.8%) in their respective age groups living below the poverty level.
| Age Bracket | Male | Female |
| Under 5 Years | 20 (100.0%) | 0 (0.0%) |
| 5 Years | 0 (0.0%) | 0 (0.0%) |
| 6 to 11 Years | 0 (0.0%) | 0 (0.0%) |
| 12 to 14 Years | 0 (0.0%) | 0 (0.0%) |
| 15 Years | 0 (0.0%) | 0 (0.0%) |
| 16 and 17 Years | 0 (0.0%) | 0 (0.0%) |
| 18 to 24 Years | 15 (39.5%) | 8 (18.2%) |
| 25 to 34 Years | 10 (47.6%) | 0 (0.0%) |
| 35 to 44 Years | 0 (0.0%) | 19 (38.8%) |
| 45 to 54 Years | 7 (10.8%) | 0 (0.0%) |
| 55 to 64 Years | 0 (0.0%) | 3 (7.9%) |
| 65 to 74 Years | 8 (6.0%) | 0 (0.0%) |
| 75 Years and over | 3 (4.5%) | 24 (15.9%) |
| Total | 63 (12.9%) | 54 (11.2%) |
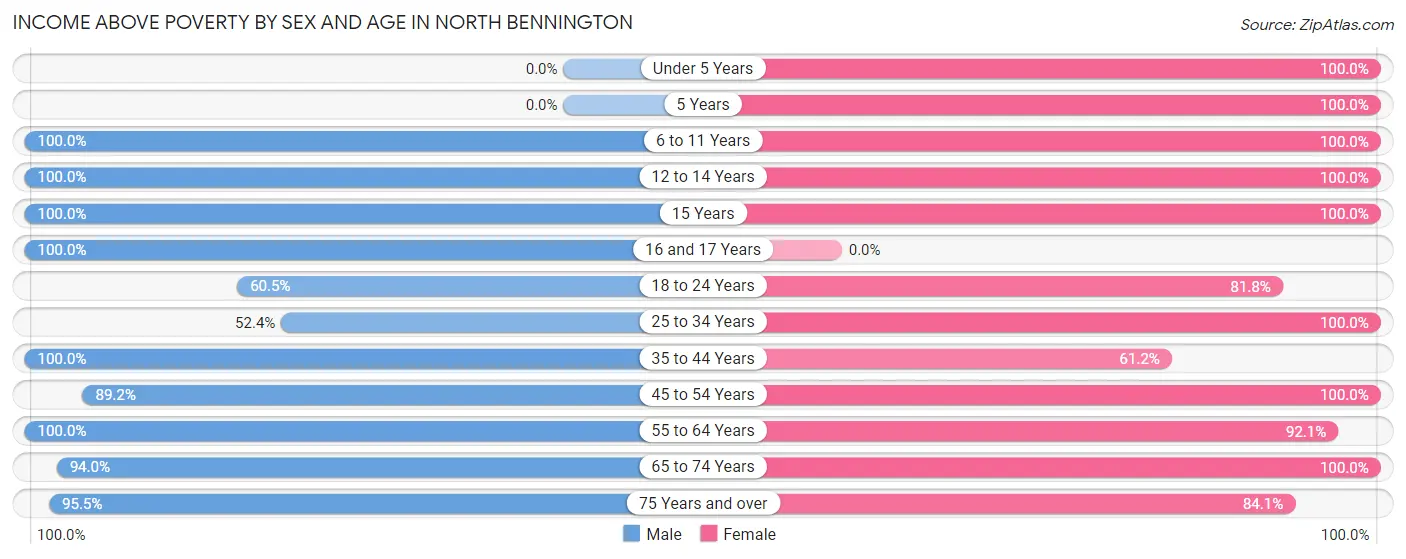
Income Above Poverty by Sex and Age in North Bennington
According to the poverty statistics in North Bennington, males aged 6 to 11 years and females aged under 5 years are the age groups that are most secure financially, with 100.0% of males and 100.0% of females in these age groups living above the poverty line.
| Age Bracket | Male | Female |
| Under 5 Years | 0 (0.0%) | 11 (100.0%) |
| 5 Years | 0 (0.0%) | 7 (100.0%) |
| 6 to 11 Years | 15 (100.0%) | 21 (100.0%) |
| 12 to 14 Years | 7 (100.0%) | 8 (100.0%) |
| 15 Years | 3 (100.0%) | 3 (100.0%) |
| 16 and 17 Years | 22 (100.0%) | 0 (0.0%) |
| 18 to 24 Years | 23 (60.5%) | 36 (81.8%) |
| 25 to 34 Years | 11 (52.4%) | 34 (100.0%) |
| 35 to 44 Years | 60 (100.0%) | 30 (61.2%) |
| 45 to 54 Years | 58 (89.2%) | 22 (100.0%) |
| 55 to 64 Years | 38 (100.0%) | 35 (92.1%) |
| 65 to 74 Years | 126 (94.0%) | 93 (100.0%) |
| 75 Years and over | 63 (95.5%) | 127 (84.1%) |
| Total | 426 (87.1%) | 427 (88.8%) |
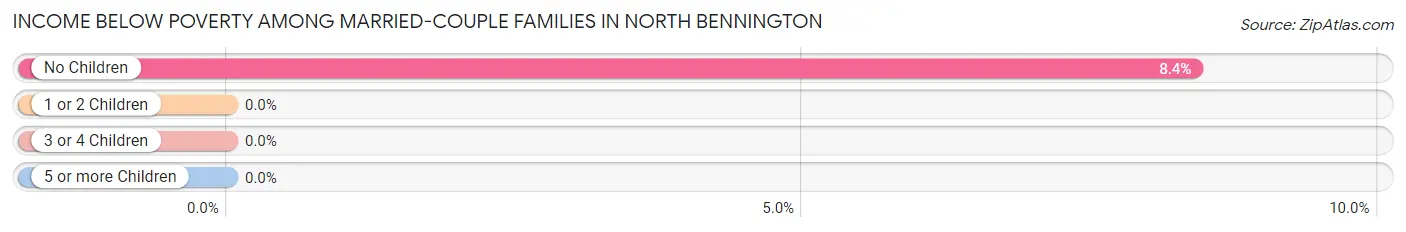
Income Below Poverty Among Married-Couple Families in North Bennington
The poverty statistics for married-couple families in North Bennington show that 6.6% or 10 of the total 152 families live below the poverty line. Families with no children have the highest poverty rate of 8.4%, comprising of 10 families. On the other hand, families with 1 or 2 children have the lowest poverty rate of 0.0%, which includes 0 families.
| Children | Above Poverty | Below Poverty |
| No Children | 109 (91.6%) | 10 (8.4%) |
| 1 or 2 Children | 29 (100.0%) | 0 (0.0%) |
| 3 or 4 Children | 4 (100.0%) | 0 (0.0%) |
| 5 or more Children | 0 (0.0%) | 0 (0.0%) |
| Total | 142 (93.4%) | 10 (6.6%) |
Income Below Poverty Among Single-Parent Households in North Bennington
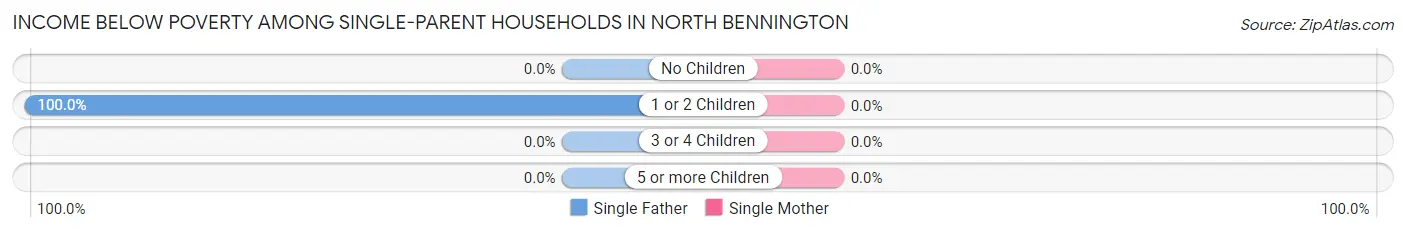
| Children | Single Father | Single Mother |
| No Children | 0 (0.0%) | 0 (0.0%) |
| 1 or 2 Children | 15 (100.0%) | 0 (0.0%) |
| 3 or 4 Children | 0 (0.0%) | 0 (0.0%) |
| 5 or more Children | 0 (0.0%) | 0 (0.0%) |
| Total | 15 (75.0%) | 0 (0.0%) |
Income Below Poverty Among Married-Couple vs Single-Parent Households in North Bennington
The poverty data for North Bennington shows that 10 of the married-couple family households (6.6%) and 15 of the single-parent households (29.4%) are living below the poverty level. Within the married-couple family households, those with no children have the highest poverty rate, with 10 households (8.4%) falling below the poverty line. Among the single-parent households, those with 1 or 2 children have the highest poverty rate, with 15 household (48.4%) living below poverty.
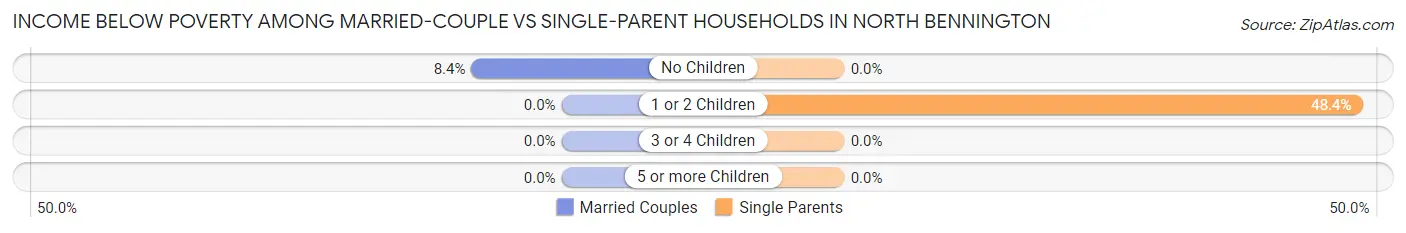
| Children | Married-Couple Families | Single-Parent Households |
| No Children | 10 (8.4%) | 0 (0.0%) |
| 1 or 2 Children | 0 (0.0%) | 15 (48.4%) |
| 3 or 4 Children | 0 (0.0%) | 0 (0.0%) |
| 5 or more Children | 0 (0.0%) | 0 (0.0%) |
| Total | 10 (6.6%) | 15 (29.4%) |
Employment Characteristics in North Bennington
Employment by Class of Employer in North Bennington
Among the 583 employed individuals in North Bennington, private company employees (295 | 50.6%), not-for-profit organizations (196 | 33.6%), and local government employees (30 | 5.1%) make up the most common classes of employment.
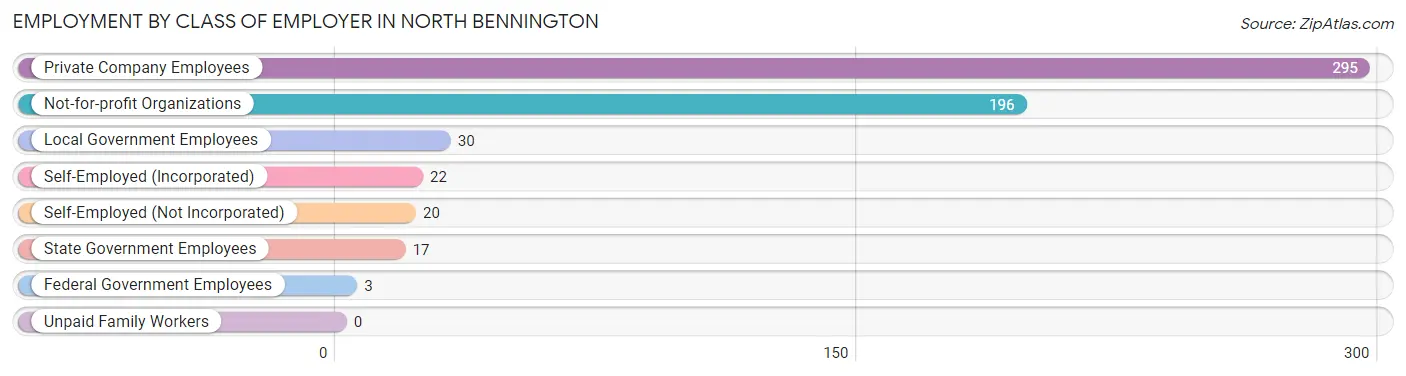
| Employer Class | # Employees | % Employees |
| Private Company Employees | 295 | 50.6% |
| Self-Employed (Incorporated) | 22 | 3.8% |
| Self-Employed (Not Incorporated) | 20 | 3.4% |
| Not-for-profit Organizations | 196 | 33.6% |
| Local Government Employees | 30 | 5.1% |
| State Government Employees | 17 | 2.9% |
| Federal Government Employees | 3 | 0.5% |
| Unpaid Family Workers | 0 | 0.0% |
| Total | 583 | 100.0% |
Employment Status by Age in North Bennington
According to the labor force statistics for North Bennington, out of the total population over 16 years of age (1,325), 46.8% or 620 individuals are in the labor force, with 6.0% or 37 of them unemployed. The age group with the highest labor force participation rate is 30 to 34 years, with 100.0% or 10 individuals in the labor force. Within the labor force, the 65 to 74 years age range has the highest percentage of unemployed individuals, with 14.8% or 4 of them being unemployed.
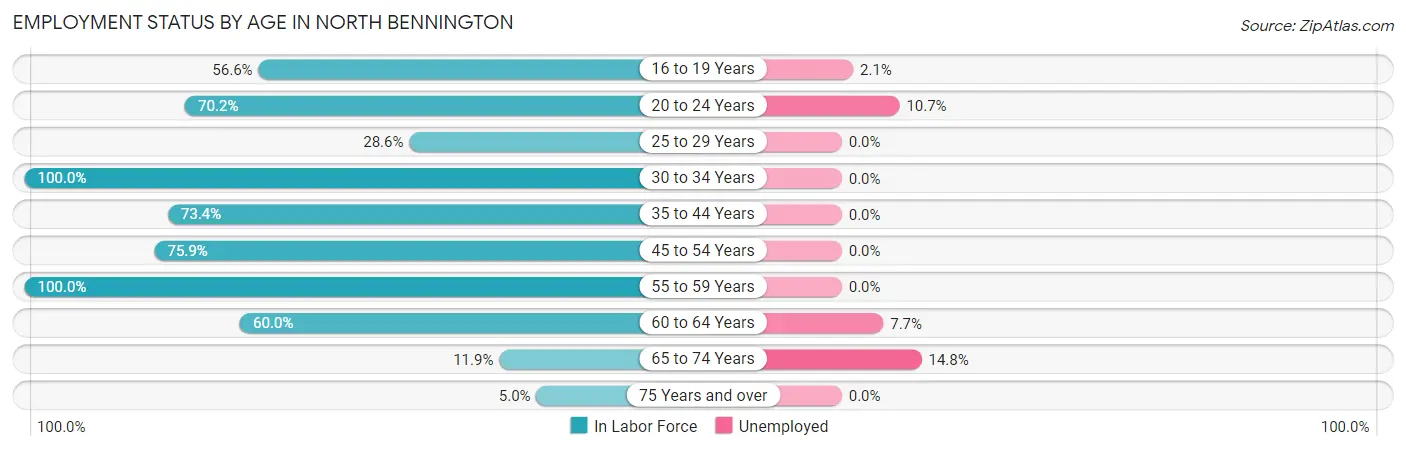
| Age Bracket | In Labor Force | Unemployed |
| 16 to 19 Years | 94 (56.6%) | 2 (2.1%) |
| 20 to 24 Years | 262 (70.2%) | 28 (10.7%) |
| 25 to 29 Years | 14 (28.6%) | 0 (0.0%) |
| 30 to 34 Years | 10 (100.0%) | 0 (0.0%) |
| 35 to 44 Years | 80 (73.4%) | 0 (0.0%) |
| 45 to 54 Years | 66 (75.9%) | 0 (0.0%) |
| 55 to 59 Years | 17 (100.0%) | 0 (0.0%) |
| 60 to 64 Years | 39 (60.0%) | 3 (7.7%) |
| 65 to 74 Years | 27 (11.9%) | 4 (14.8%) |
| 75 Years and over | 11 (5.0%) | 0 (0.0%) |
| Total | 620 (46.8%) | 37 (6.0%) |
Employment Status by Educational Attainment in North Bennington
According to labor force statistics for North Bennington, 67.1% of individuals (226) out of the total population between 25 and 64 years of age (337) are in the labor force, with 1.3% or 3 of them being unemployed. The group with the highest labor force participation rate are those with the educational attainment of bachelor's degree or higher, with 72.9% or 140 individuals in the labor force. Within the labor force, individuals with bachelor's degree or higher education have the highest percentage of unemployment, with 2.1% or 3 of them being unemployed.
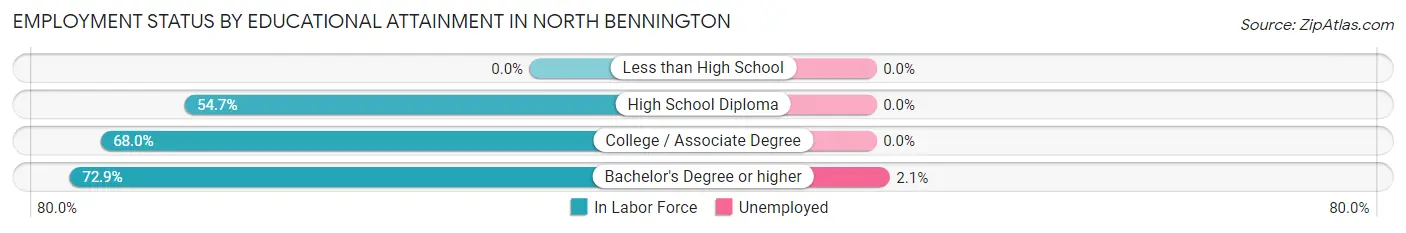
| Educational Attainment | In Labor Force | Unemployed |
| Less than High School | 0 (0.0%) | 0 (0.0%) |
| High School Diploma | 52 (54.7%) | 0 (0.0%) |
| College / Associate Degree | 34 (68.0%) | 0 (0.0%) |
| Bachelor's Degree or higher | 140 (72.9%) | 4 (2.1%) |
| Total | 226 (67.1%) | 4 (1.3%) |
Employment Occupations by Sex in North Bennington
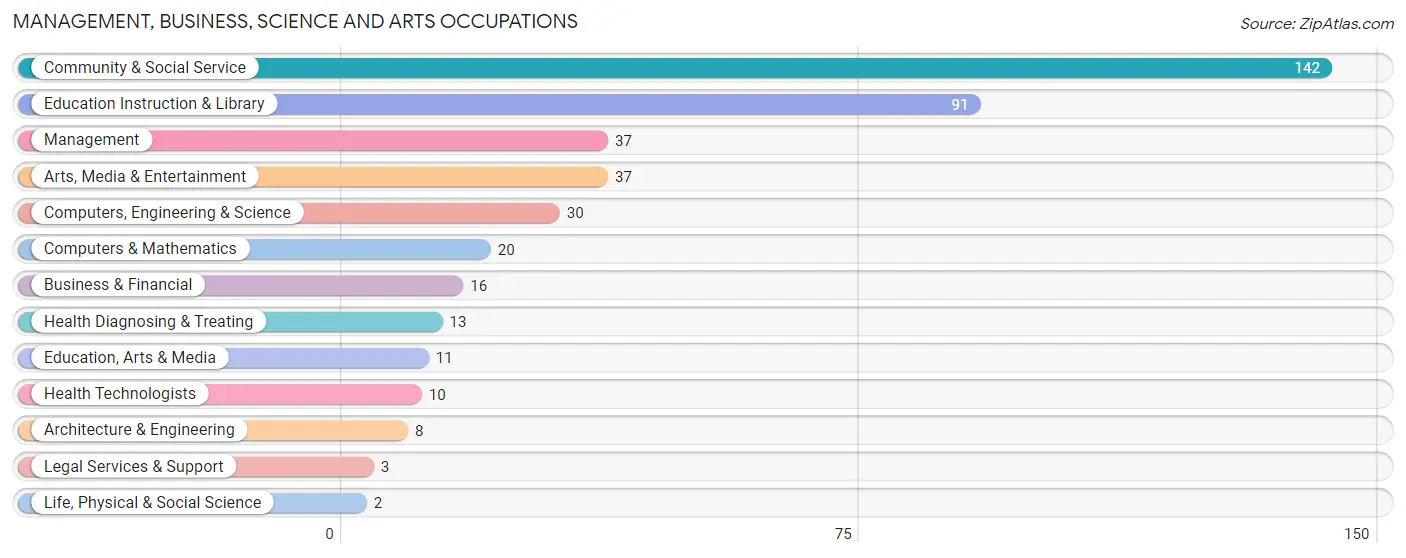
Management, Business, Science and Arts Occupations
The most common Management, Business, Science and Arts occupations in North Bennington are Community & Social Service (142 | 24.4%), Education Instruction & Library (91 | 15.6%), Management (37 | 6.4%), Arts, Media & Entertainment (37 | 6.4%), and Computers, Engineering & Science (30 | 5.1%).
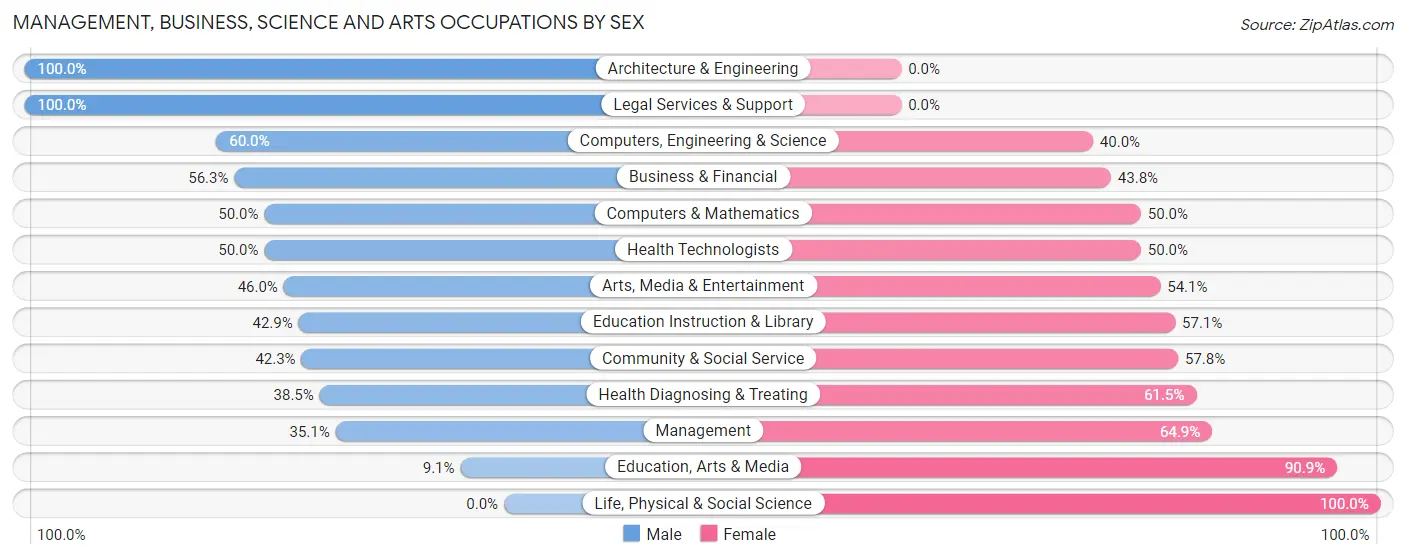
Management, Business, Science and Arts Occupations by Sex
Within the Management, Business, Science and Arts occupations in North Bennington, the most male-oriented occupations are Architecture & Engineering (100.0%), Legal Services & Support (100.0%), and Computers, Engineering & Science (60.0%), while the most female-oriented occupations are Life, Physical & Social Science (100.0%), Education, Arts & Media (90.9%), and Management (64.9%).
| Occupation | Male | Female |
| Management | 13 (35.1%) | 24 (64.9%) |
| Business & Financial | 9 (56.2%) | 7 (43.8%) |
| Computers, Engineering & Science | 18 (60.0%) | 12 (40.0%) |
| Computers & Mathematics | 10 (50.0%) | 10 (50.0%) |
| Architecture & Engineering | 8 (100.0%) | 0 (0.0%) |
| Life, Physical & Social Science | 0 (0.0%) | 2 (100.0%) |
| Community & Social Service | 60 (42.2%) | 82 (57.8%) |
| Education, Arts & Media | 1 (9.1%) | 10 (90.9%) |
| Legal Services & Support | 3 (100.0%) | 0 (0.0%) |
| Education Instruction & Library | 39 (42.9%) | 52 (57.1%) |
| Arts, Media & Entertainment | 17 (46.0%) | 20 (54.0%) |
| Health Diagnosing & Treating | 5 (38.5%) | 8 (61.5%) |
| Health Technologists | 5 (50.0%) | 5 (50.0%) |
| Total (Category) | 105 (44.1%) | 133 (55.9%) |
| Total (Overall) | 294 (50.4%) | 289 (49.6%) |
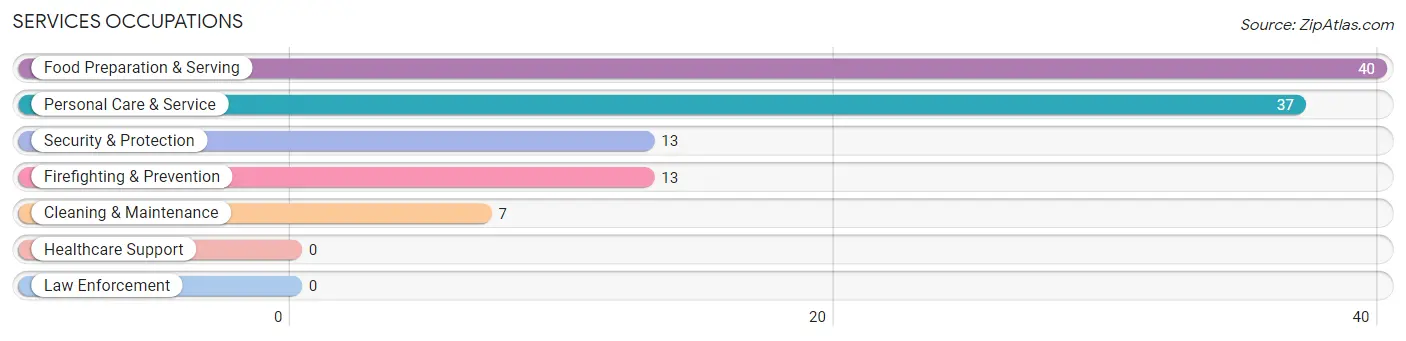
Services Occupations
The most common Services occupations in North Bennington are Food Preparation & Serving (40 | 6.9%), Personal Care & Service (37 | 6.4%), Security & Protection (13 | 2.2%), Firefighting & Prevention (13 | 2.2%), and Cleaning & Maintenance (7 | 1.2%).
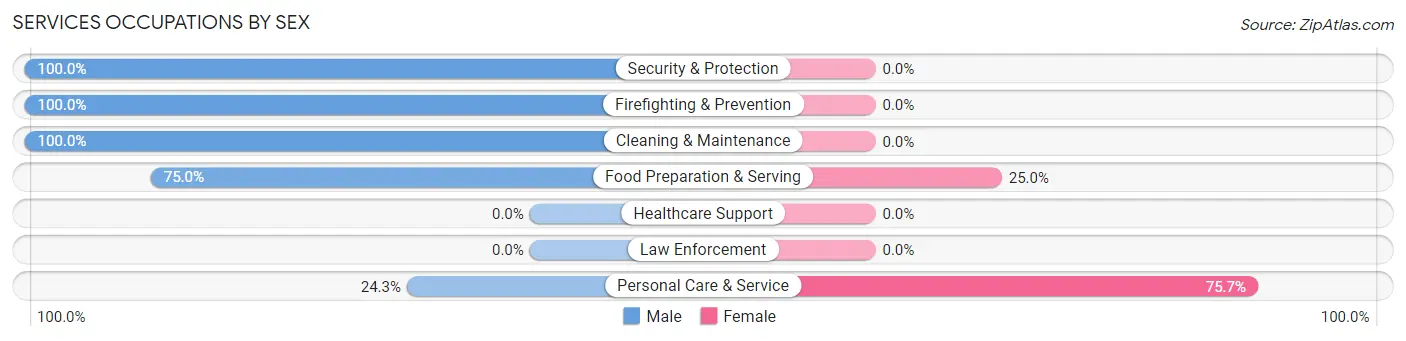
Services Occupations by Sex
Within the Services occupations in North Bennington, the most male-oriented occupations are Security & Protection (100.0%), Firefighting & Prevention (100.0%), and Cleaning & Maintenance (100.0%), while the most female-oriented occupations are Personal Care & Service (75.7%), and Food Preparation & Serving (25.0%).
| Occupation | Male | Female |
| Healthcare Support | 0 (0.0%) | 0 (0.0%) |
| Security & Protection | 13 (100.0%) | 0 (0.0%) |
| Firefighting & Prevention | 13 (100.0%) | 0 (0.0%) |
| Law Enforcement | 0 (0.0%) | 0 (0.0%) |
| Food Preparation & Serving | 30 (75.0%) | 10 (25.0%) |
| Cleaning & Maintenance | 7 (100.0%) | 0 (0.0%) |
| Personal Care & Service | 9 (24.3%) | 28 (75.7%) |
| Total (Category) | 59 (60.8%) | 38 (39.2%) |
| Total (Overall) | 294 (50.4%) | 289 (49.6%) |
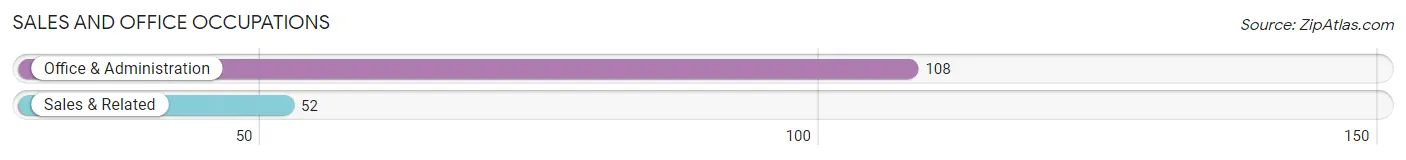
Sales and Office Occupations
The most common Sales and Office occupations in North Bennington are Office & Administration (108 | 18.5%), and Sales & Related (52 | 8.9%).
Sales and Office Occupations by Sex
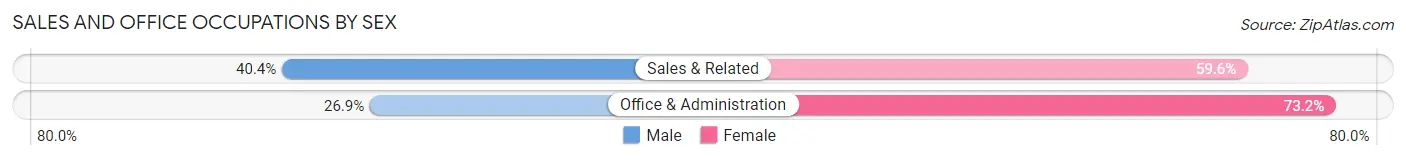
| Occupation | Male | Female |
| Sales & Related | 21 (40.4%) | 31 (59.6%) |
| Office & Administration | 29 (26.9%) | 79 (73.2%) |
| Total (Category) | 50 (31.2%) | 110 (68.8%) |
| Total (Overall) | 294 (50.4%) | 289 (49.6%) |
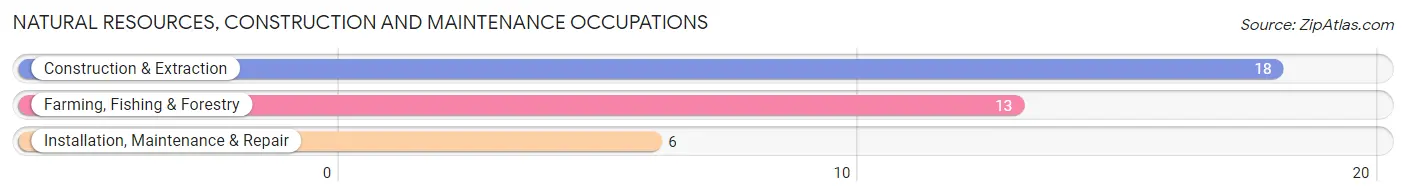
Natural Resources, Construction and Maintenance Occupations
The most common Natural Resources, Construction and Maintenance occupations in North Bennington are Construction & Extraction (18 | 3.1%), Farming, Fishing & Forestry (13 | 2.2%), and Installation, Maintenance & Repair (6 | 1.0%).
Natural Resources, Construction and Maintenance Occupations by Sex
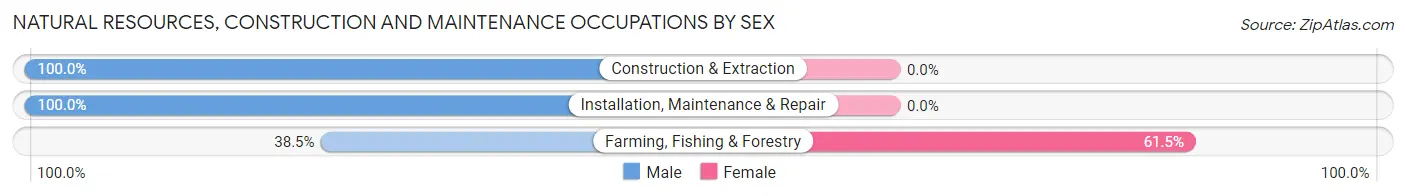
| Occupation | Male | Female |
| Farming, Fishing & Forestry | 5 (38.5%) | 8 (61.5%) |
| Construction & Extraction | 18 (100.0%) | 0 (0.0%) |
| Installation, Maintenance & Repair | 6 (100.0%) | 0 (0.0%) |
| Total (Category) | 29 (78.4%) | 8 (21.6%) |
| Total (Overall) | 294 (50.4%) | 289 (49.6%) |
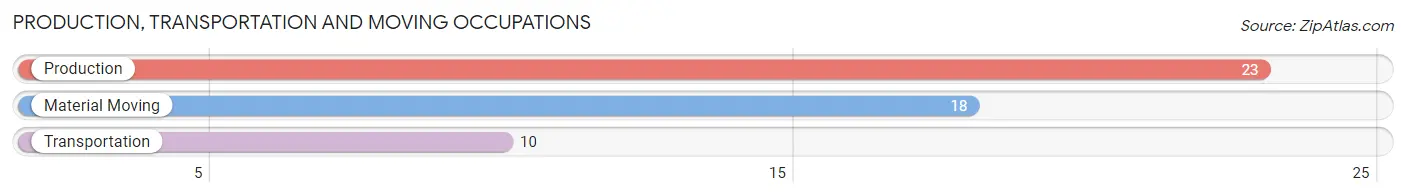
Production, Transportation and Moving Occupations
The most common Production, Transportation and Moving occupations in North Bennington are Production (23 | 4.0%), Material Moving (18 | 3.1%), and Transportation (10 | 1.7%).
Production, Transportation and Moving Occupations by Sex
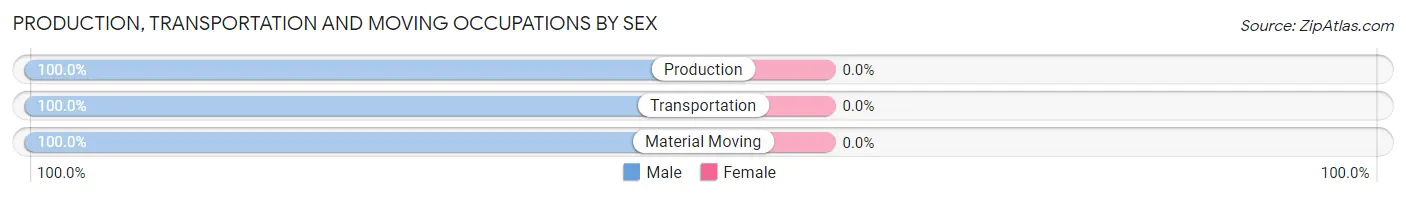
| Occupation | Male | Female |
| Production | 23 (100.0%) | 0 (0.0%) |
| Transportation | 10 (100.0%) | 0 (0.0%) |
| Material Moving | 18 (100.0%) | 0 (0.0%) |
| Total (Category) | 51 (100.0%) | 0 (0.0%) |
| Total (Overall) | 294 (50.4%) | 289 (49.6%) |
Employment Industries by Sex in North Bennington
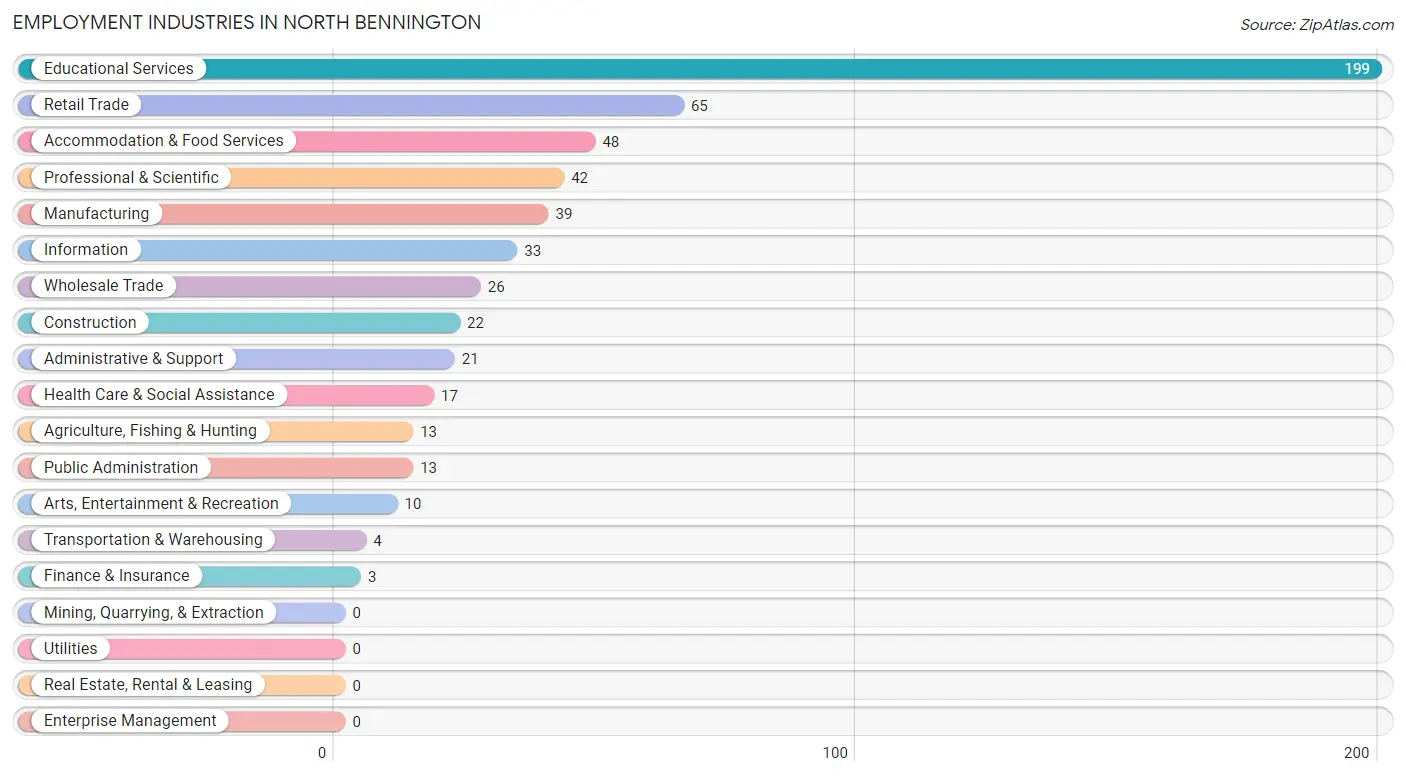
Employment Industries in North Bennington
The major employment industries in North Bennington include Educational Services (199 | 34.1%), Retail Trade (65 | 11.2%), Accommodation & Food Services (48 | 8.2%), Professional & Scientific (42 | 7.2%), and Manufacturing (39 | 6.7%).
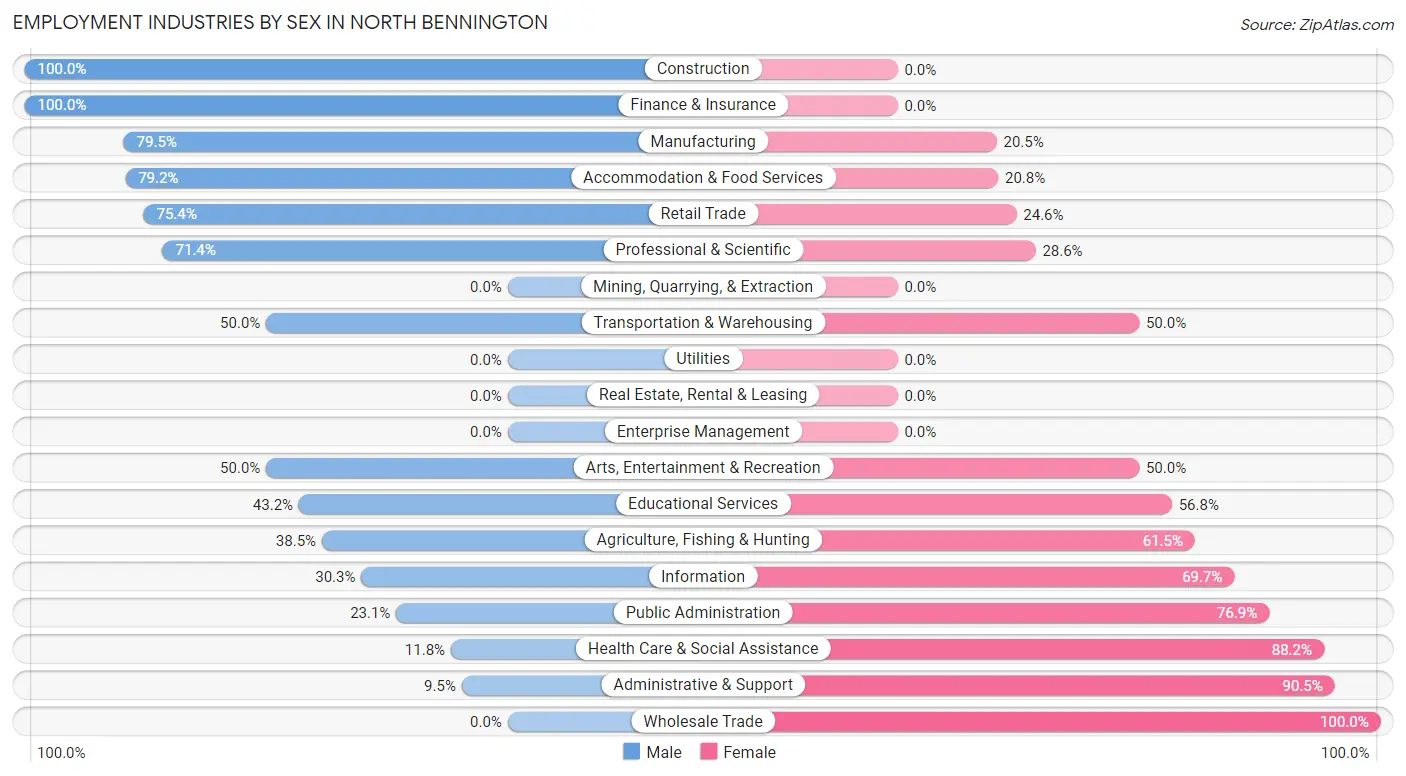
Employment Industries by Sex in North Bennington
The North Bennington industries that see more men than women are Construction (100.0%), Finance & Insurance (100.0%), and Manufacturing (79.5%), whereas the industries that tend to have a higher number of women are Wholesale Trade (100.0%), Administrative & Support (90.5%), and Health Care & Social Assistance (88.2%).
| Industry | Male | Female |
| Agriculture, Fishing & Hunting | 5 (38.5%) | 8 (61.5%) |
| Mining, Quarrying, & Extraction | 0 (0.0%) | 0 (0.0%) |
| Construction | 22 (100.0%) | 0 (0.0%) |
| Manufacturing | 31 (79.5%) | 8 (20.5%) |
| Wholesale Trade | 0 (0.0%) | 26 (100.0%) |
| Retail Trade | 49 (75.4%) | 16 (24.6%) |
| Transportation & Warehousing | 2 (50.0%) | 2 (50.0%) |
| Utilities | 0 (0.0%) | 0 (0.0%) |
| Information | 10 (30.3%) | 23 (69.7%) |
| Finance & Insurance | 3 (100.0%) | 0 (0.0%) |
| Real Estate, Rental & Leasing | 0 (0.0%) | 0 (0.0%) |
| Professional & Scientific | 30 (71.4%) | 12 (28.6%) |
| Enterprise Management | 0 (0.0%) | 0 (0.0%) |
| Administrative & Support | 2 (9.5%) | 19 (90.5%) |
| Educational Services | 86 (43.2%) | 113 (56.8%) |
| Health Care & Social Assistance | 2 (11.8%) | 15 (88.2%) |
| Arts, Entertainment & Recreation | 5 (50.0%) | 5 (50.0%) |
| Accommodation & Food Services | 38 (79.2%) | 10 (20.8%) |
| Public Administration | 3 (23.1%) | 10 (76.9%) |
| Total | 294 (50.4%) | 289 (49.6%) |
Education in North Bennington
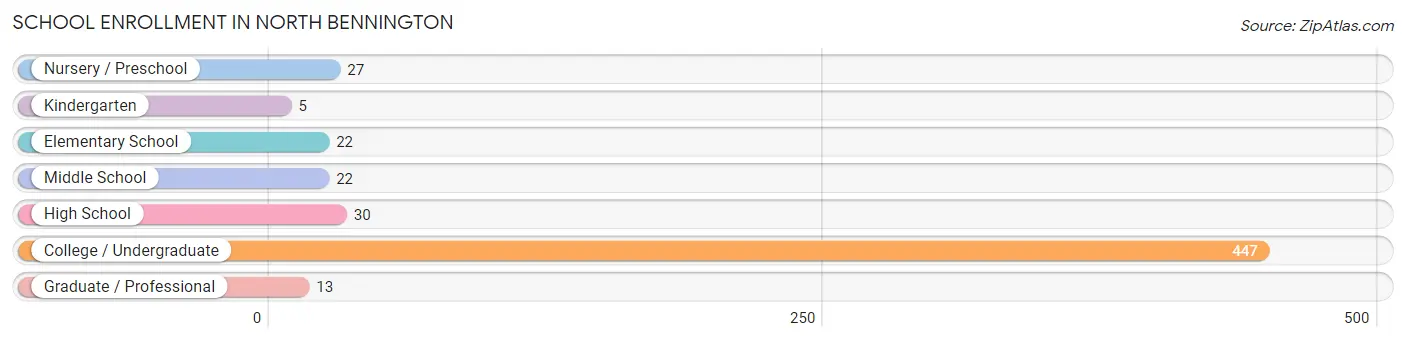
School Enrollment in North Bennington
The most common levels of schooling among the 566 students in North Bennington are college / undergraduate (447 | 79.0%), high school (30 | 5.3%), and nursery / preschool (27 | 4.8%).
| School Level | # Students | % Students |
| Nursery / Preschool | 27 | 4.8% |
| Kindergarten | 5 | 0.9% |
| Elementary School | 22 | 3.9% |
| Middle School | 22 | 3.9% |
| High School | 30 | 5.3% |
| College / Undergraduate | 447 | 79.0% |
| Graduate / Professional | 13 | 2.3% |
| Total | 566 | 100.0% |
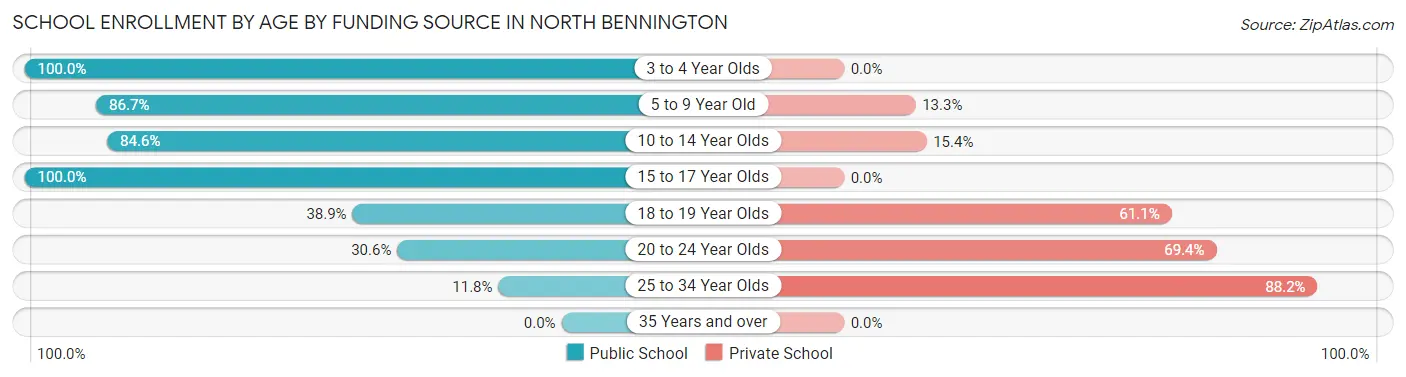
School Enrollment by Age by Funding Source in North Bennington
Out of a total of 566 students who are enrolled in schools in North Bennington, 314 (55.5%) attend a private institution, while the remaining 252 (44.5%) are enrolled in public schools. The age group of 25 to 34 year olds has the highest likelihood of being enrolled in private schools, with 15 (88.2% in the age bracket) enrolled. Conversely, the age group of 3 to 4 year olds has the lowest likelihood of being enrolled in a private school, with 20 (100.0% in the age bracket) attending a public institution.
| Age Bracket | Public School | Private School |
| 3 to 4 Year Olds | 20 (100.0%) | 0 (0.0%) |
| 5 to 9 Year Old | 26 (86.7%) | 4 (13.3%) |
| 10 to 14 Year Olds | 22 (84.6%) | 4 (15.4%) |
| 15 to 17 Year Olds | 38 (100.0%) | 0 (0.0%) |
| 18 to 19 Year Olds | 51 (38.9%) | 80 (61.1%) |
| 20 to 24 Year Olds | 93 (30.6%) | 211 (69.4%) |
| 25 to 34 Year Olds | 2 (11.8%) | 15 (88.2%) |
| 35 Years and over | 0 (0.0%) | 0 (0.0%) |
| Total | 252 (44.5%) | 314 (55.5%) |
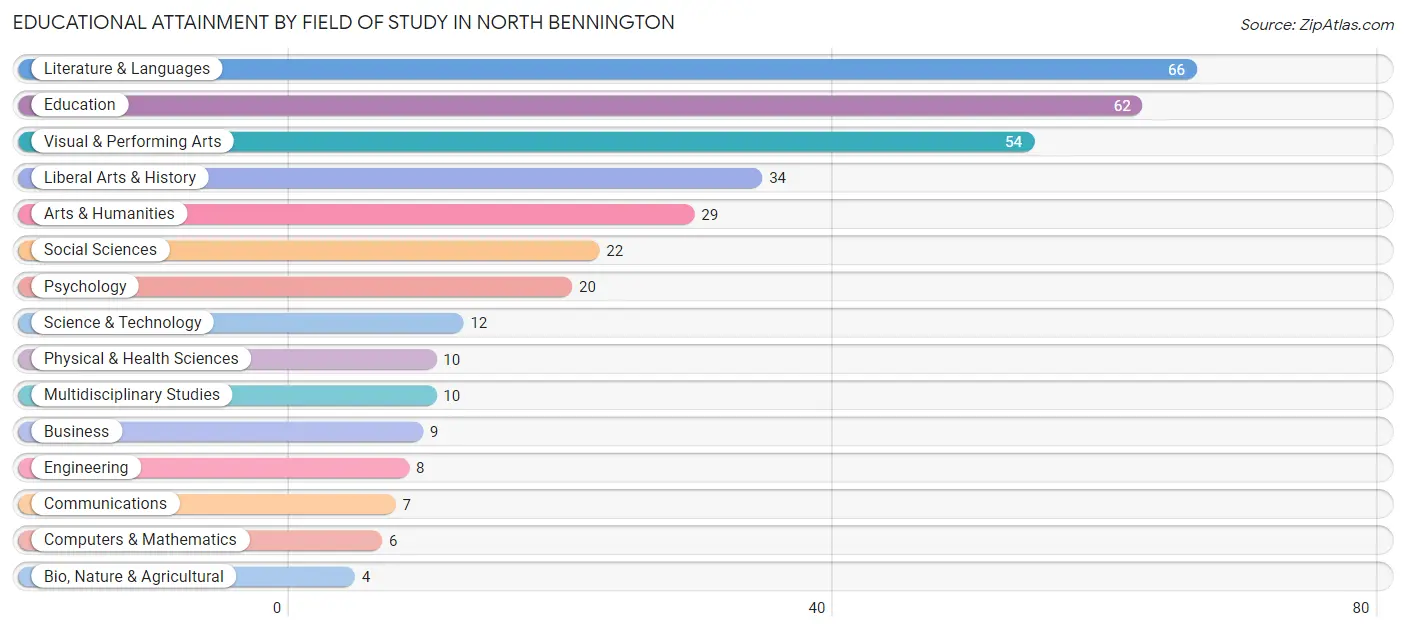
Educational Attainment by Field of Study in North Bennington
Literature & languages (66 | 18.7%), education (62 | 17.6%), visual & performing arts (54 | 15.3%), liberal arts & history (34 | 9.6%), and arts & humanities (29 | 8.2%) are the most common fields of study among 353 individuals in North Bennington who have obtained a bachelor's degree or higher.
| Field of Study | # Graduates | % Graduates |
| Computers & Mathematics | 6 | 1.7% |
| Bio, Nature & Agricultural | 4 | 1.1% |
| Physical & Health Sciences | 10 | 2.8% |
| Psychology | 20 | 5.7% |
| Social Sciences | 22 | 6.2% |
| Engineering | 8 | 2.3% |
| Multidisciplinary Studies | 10 | 2.8% |
| Science & Technology | 12 | 3.4% |
| Business | 9 | 2.5% |
| Education | 62 | 17.6% |
| Literature & Languages | 66 | 18.7% |
| Liberal Arts & History | 34 | 9.6% |
| Visual & Performing Arts | 54 | 15.3% |
| Communications | 7 | 2.0% |
| Arts & Humanities | 29 | 8.2% |
| Total | 353 | 100.0% |
Transportation & Commute in North Bennington
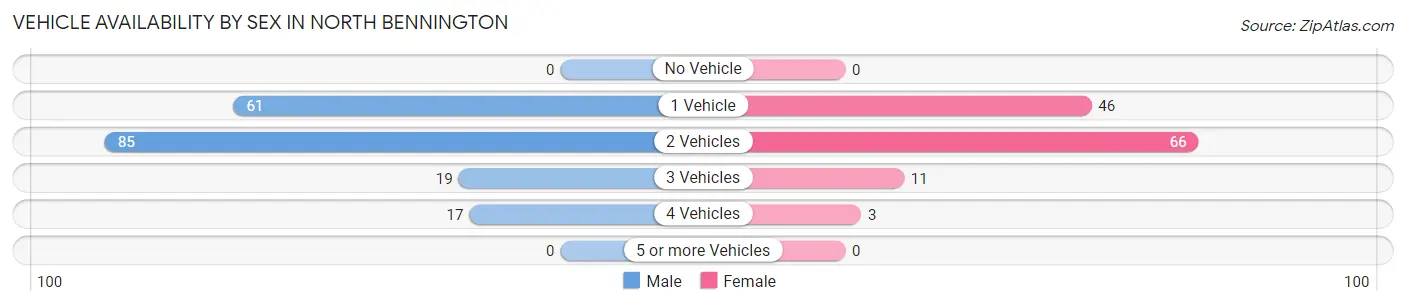
Vehicle Availability by Sex in North Bennington
The most prevalent vehicle ownership categories in North Bennington are males with 2 vehicles (85, accounting for 46.7%) and females with 2 vehicles (66, making up 67.5%).
| Vehicles Available | Male | Female |
| No Vehicle | 0 (0.0%) | 0 (0.0%) |
| 1 Vehicle | 61 (33.5%) | 46 (36.5%) |
| 2 Vehicles | 85 (46.7%) | 66 (52.4%) |
| 3 Vehicles | 19 (10.4%) | 11 (8.7%) |
| 4 Vehicles | 17 (9.3%) | 3 (2.4%) |
| 5 or more Vehicles | 0 (0.0%) | 0 (0.0%) |
| Total | 182 (100.0%) | 126 (100.0%) |
Commute Time in North Bennington
The most frequently occuring commute durations in North Bennington are 5 to 9 minutes (151 commuters, 34.3%), 10 to 14 minutes (89 commuters, 20.2%), and 15 to 19 minutes (54 commuters, 12.3%).
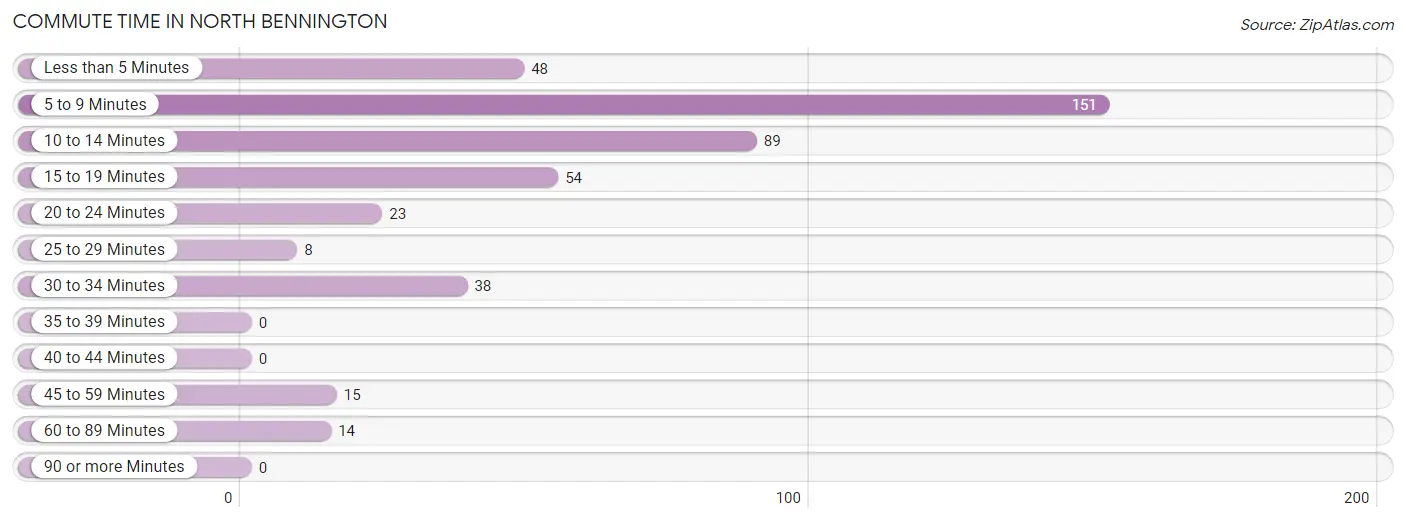
| Commute Time | # Commuters | % Commuters |
| Less than 5 Minutes | 48 | 10.9% |
| 5 to 9 Minutes | 151 | 34.3% |
| 10 to 14 Minutes | 89 | 20.2% |
| 15 to 19 Minutes | 54 | 12.3% |
| 20 to 24 Minutes | 23 | 5.2% |
| 25 to 29 Minutes | 8 | 1.8% |
| 30 to 34 Minutes | 38 | 8.6% |
| 35 to 39 Minutes | 0 | 0.0% |
| 40 to 44 Minutes | 0 | 0.0% |
| 45 to 59 Minutes | 15 | 3.4% |
| 60 to 89 Minutes | 14 | 3.2% |
| 90 or more Minutes | 0 | 0.0% |
Commute Time by Sex in North Bennington
The most common commute times in North Bennington are 5 to 9 minutes (69 commuters, 30.4%) for males and 5 to 9 minutes (82 commuters, 38.5%) for females.
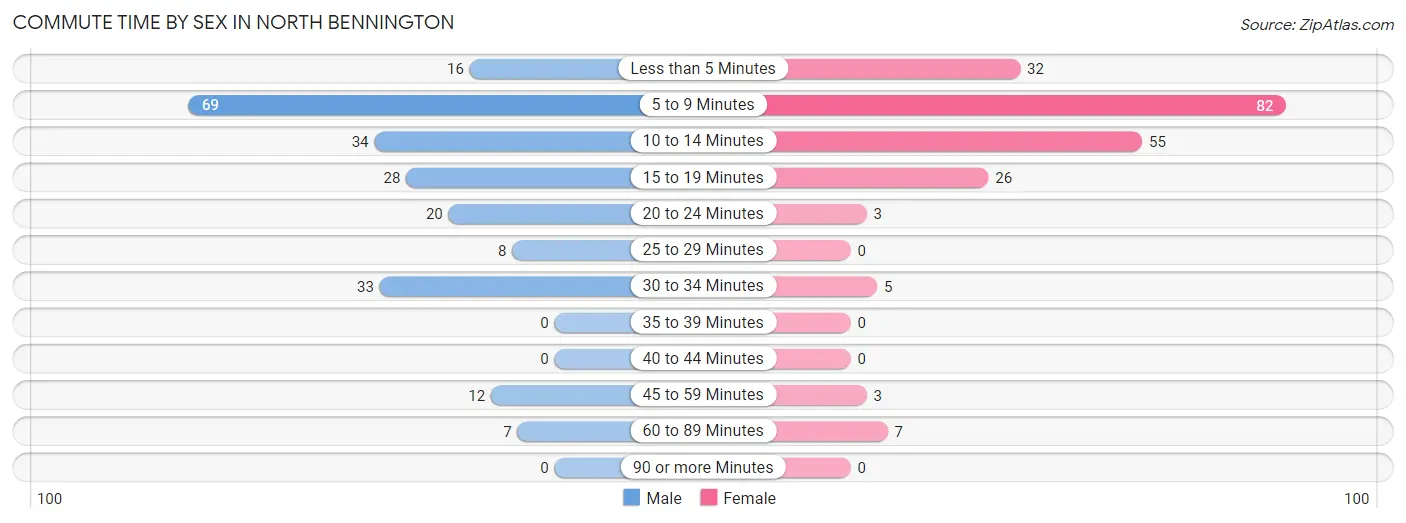
| Commute Time | Male | Female |
| Less than 5 Minutes | 16 (7.0%) | 32 (15.0%) |
| 5 to 9 Minutes | 69 (30.4%) | 82 (38.5%) |
| 10 to 14 Minutes | 34 (15.0%) | 55 (25.8%) |
| 15 to 19 Minutes | 28 (12.3%) | 26 (12.2%) |
| 20 to 24 Minutes | 20 (8.8%) | 3 (1.4%) |
| 25 to 29 Minutes | 8 (3.5%) | 0 (0.0%) |
| 30 to 34 Minutes | 33 (14.5%) | 5 (2.4%) |
| 35 to 39 Minutes | 0 (0.0%) | 0 (0.0%) |
| 40 to 44 Minutes | 0 (0.0%) | 0 (0.0%) |
| 45 to 59 Minutes | 12 (5.3%) | 3 (1.4%) |
| 60 to 89 Minutes | 7 (3.1%) | 7 (3.3%) |
| 90 or more Minutes | 0 (0.0%) | 0 (0.0%) |
Time of Departure to Work by Sex in North Bennington
The most frequent times of departure to work in North Bennington are 12:00 PM to 3:59 PM (37, 16.3%) for males and 8:00 AM to 8:29 AM (38, 17.8%) for females.
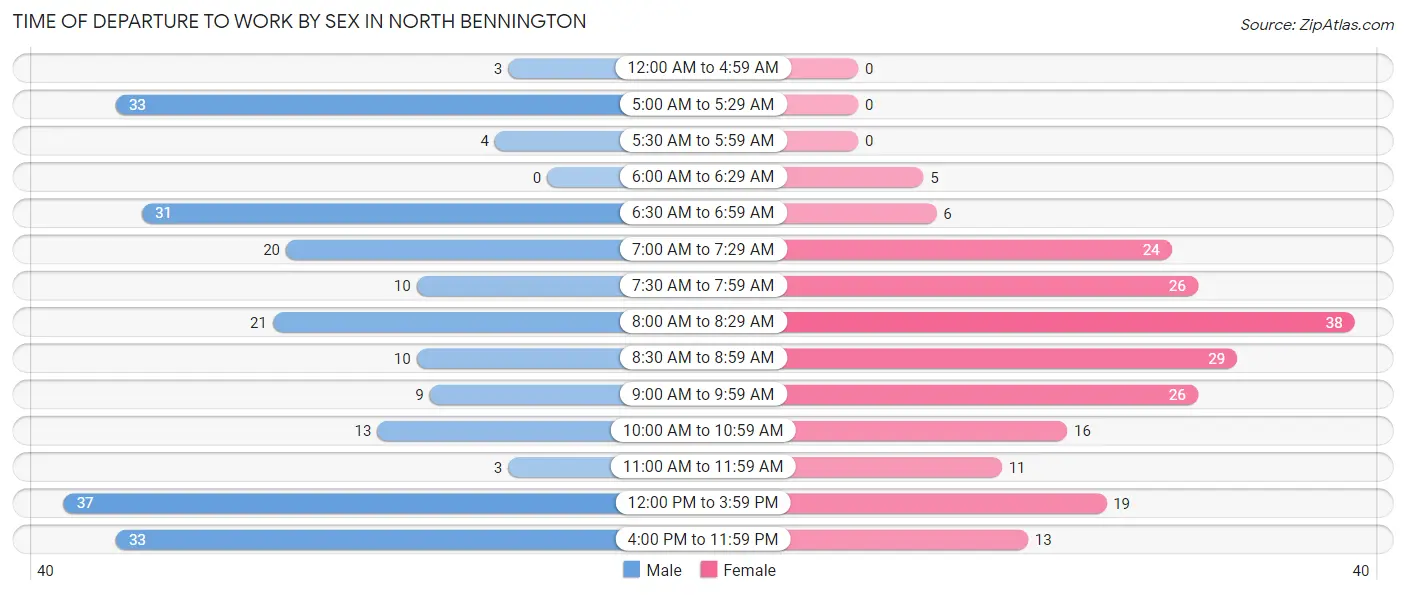
| Time of Departure | Male | Female |
| 12:00 AM to 4:59 AM | 3 (1.3%) | 0 (0.0%) |
| 5:00 AM to 5:29 AM | 33 (14.5%) | 0 (0.0%) |
| 5:30 AM to 5:59 AM | 4 (1.8%) | 0 (0.0%) |
| 6:00 AM to 6:29 AM | 0 (0.0%) | 5 (2.4%) |
| 6:30 AM to 6:59 AM | 31 (13.7%) | 6 (2.8%) |
| 7:00 AM to 7:29 AM | 20 (8.8%) | 24 (11.3%) |
| 7:30 AM to 7:59 AM | 10 (4.4%) | 26 (12.2%) |
| 8:00 AM to 8:29 AM | 21 (9.2%) | 38 (17.8%) |
| 8:30 AM to 8:59 AM | 10 (4.4%) | 29 (13.6%) |
| 9:00 AM to 9:59 AM | 9 (4.0%) | 26 (12.2%) |
| 10:00 AM to 10:59 AM | 13 (5.7%) | 16 (7.5%) |
| 11:00 AM to 11:59 AM | 3 (1.3%) | 11 (5.2%) |
| 12:00 PM to 3:59 PM | 37 (16.3%) | 19 (8.9%) |
| 4:00 PM to 11:59 PM | 33 (14.5%) | 13 (6.1%) |
| Total | 227 (100.0%) | 213 (100.0%) |
Housing Occupancy in North Bennington
Occupancy by Ownership in North Bennington
Of the total 347 dwellings in North Bennington, owner-occupied units account for 226 (65.1%), while renter-occupied units make up 121 (34.9%).
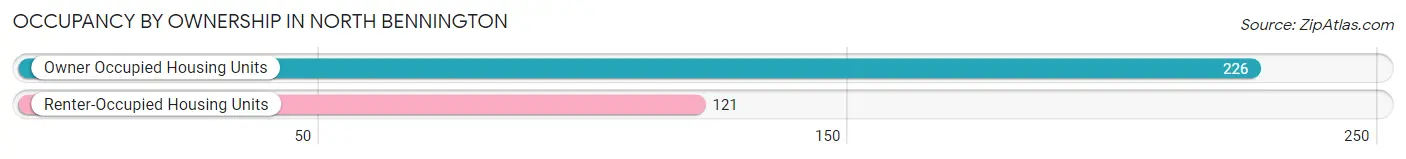
| Occupancy | # Housing Units | % Housing Units |
| Owner Occupied Housing Units | 226 | 65.1% |
| Renter-Occupied Housing Units | 121 | 34.9% |
| Total Occupied Housing Units | 347 | 100.0% |
Occupancy by Household Size in North Bennington
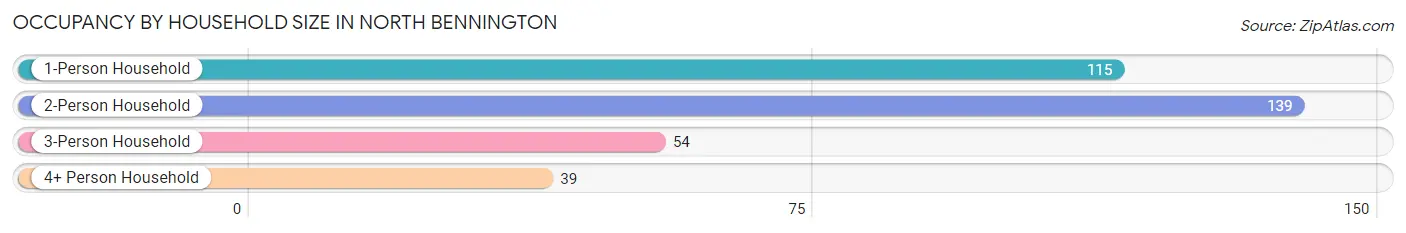
| Household Size | # Housing Units | % Housing Units |
| 1-Person Household | 115 | 33.1% |
| 2-Person Household | 139 | 40.1% |
| 3-Person Household | 54 | 15.6% |
| 4+ Person Household | 39 | 11.2% |
| Total Housing Units | 347 | 100.0% |
Occupancy by Ownership by Household Size in North Bennington
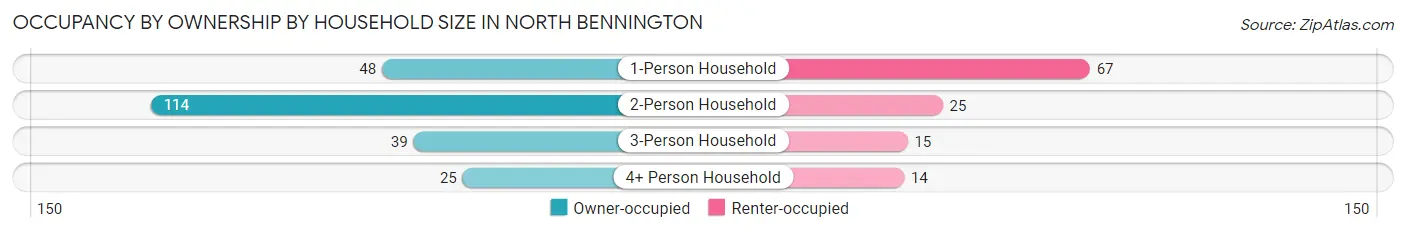
| Household Size | Owner-occupied | Renter-occupied |
| 1-Person Household | 48 (41.7%) | 67 (58.3%) |
| 2-Person Household | 114 (82.0%) | 25 (18.0%) |
| 3-Person Household | 39 (72.2%) | 15 (27.8%) |
| 4+ Person Household | 25 (64.1%) | 14 (35.9%) |
| Total Housing Units | 226 (65.1%) | 121 (34.9%) |
Occupancy by Educational Attainment in North Bennington
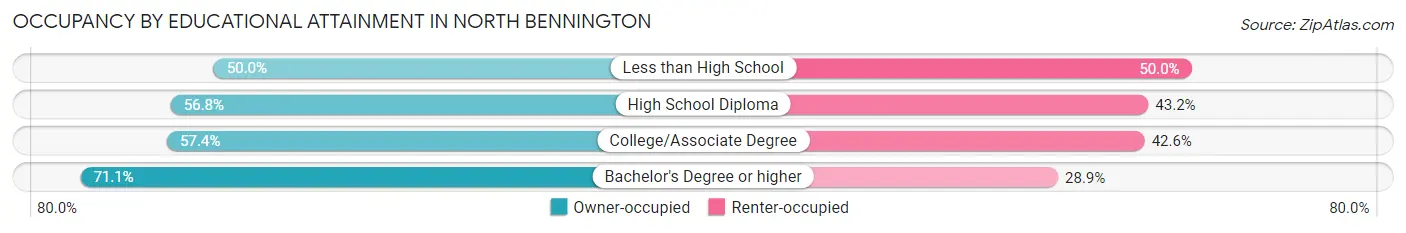
| Household Size | Owner-occupied | Renter-occupied |
| Less than High School | 2 (50.0%) | 2 (50.0%) |
| High School Diploma | 50 (56.8%) | 38 (43.2%) |
| College/Associate Degree | 31 (57.4%) | 23 (42.6%) |
| Bachelor's Degree or higher | 143 (71.1%) | 58 (28.9%) |
Occupancy by Age of Householder in North Bennington
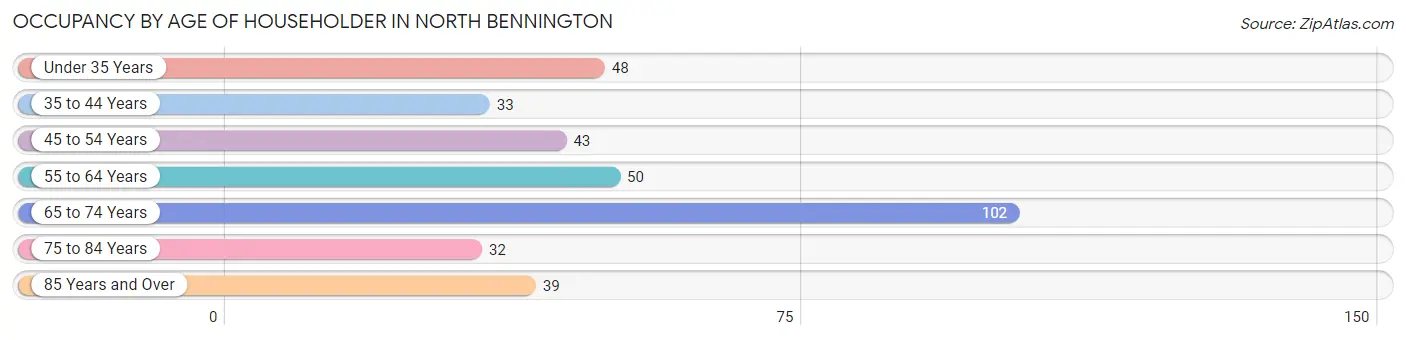
| Age Bracket | # Households | % Households |
| Under 35 Years | 48 | 13.8% |
| 35 to 44 Years | 33 | 9.5% |
| 45 to 54 Years | 43 | 12.4% |
| 55 to 64 Years | 50 | 14.4% |
| 65 to 74 Years | 102 | 29.4% |
| 75 to 84 Years | 32 | 9.2% |
| 85 Years and Over | 39 | 11.2% |
| Total | 347 | 100.0% |
Housing Finances in North Bennington
Median Income by Occupancy in North Bennington
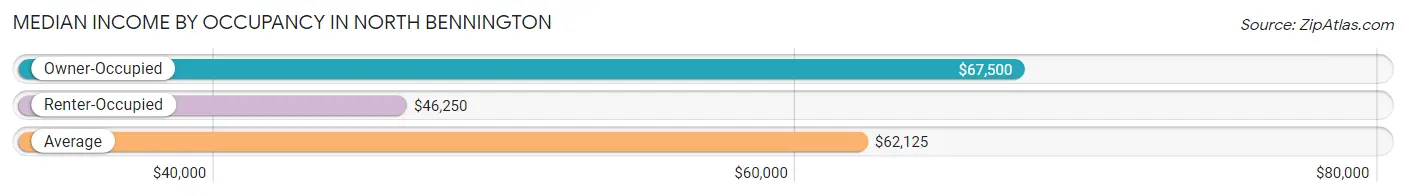
| Occupancy Type | # Households | Median Income |
| Owner-Occupied | 226 (65.1%) | $67,500 |
| Renter-Occupied | 121 (34.9%) | $46,250 |
| Average | 347 (100.0%) | $62,125 |
Occupancy by Householder Income Bracket in North Bennington
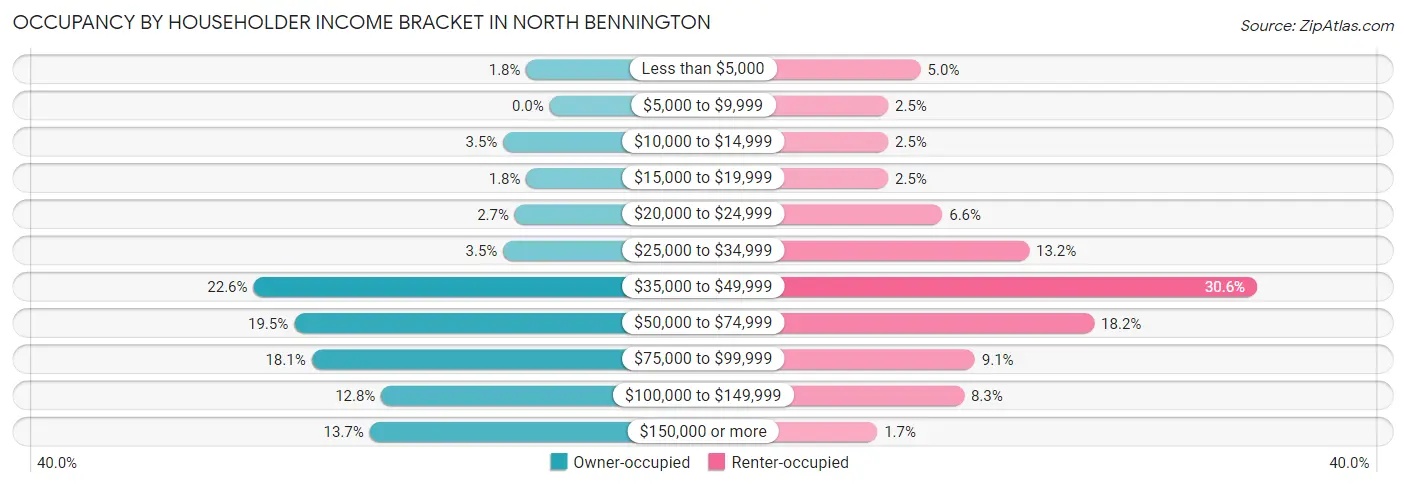
| Income Bracket | Owner-occupied | Renter-occupied |
| Less than $5,000 | 4 (1.8%) | 6 (5.0%) |
| $5,000 to $9,999 | 0 (0.0%) | 3 (2.5%) |
| $10,000 to $14,999 | 8 (3.5%) | 3 (2.5%) |
| $15,000 to $19,999 | 4 (1.8%) | 3 (2.5%) |
| $20,000 to $24,999 | 6 (2.6%) | 8 (6.6%) |
| $25,000 to $34,999 | 8 (3.5%) | 16 (13.2%) |
| $35,000 to $49,999 | 51 (22.6%) | 37 (30.6%) |
| $50,000 to $74,999 | 44 (19.5%) | 22 (18.2%) |
| $75,000 to $99,999 | 41 (18.1%) | 11 (9.1%) |
| $100,000 to $149,999 | 29 (12.8%) | 10 (8.3%) |
| $150,000 or more | 31 (13.7%) | 2 (1.7%) |
| Total | 226 (100.0%) | 121 (100.0%) |
Monthly Housing Cost Tiers in North Bennington
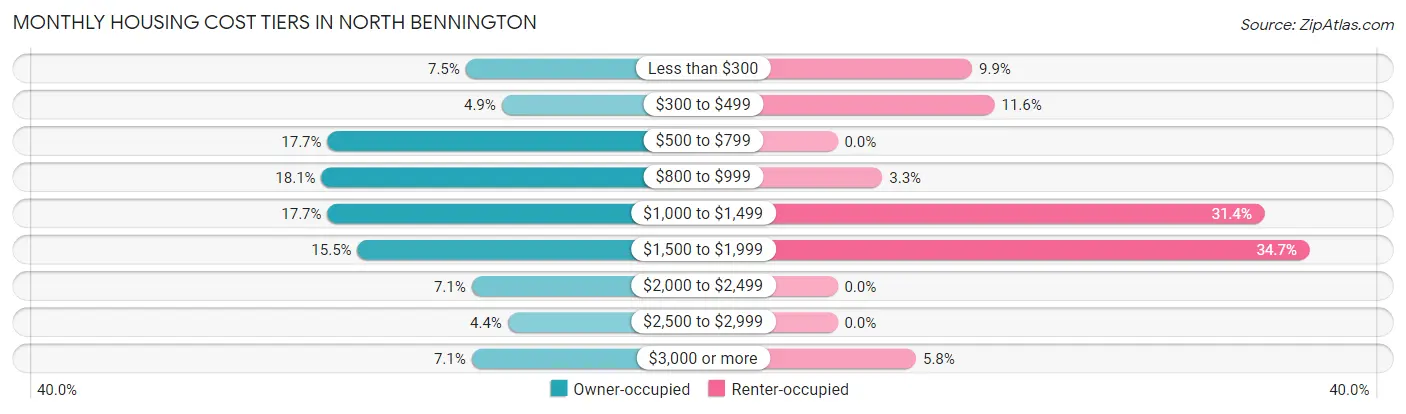
| Monthly Cost | Owner-occupied | Renter-occupied |
| Less than $300 | 17 (7.5%) | 12 (9.9%) |
| $300 to $499 | 11 (4.9%) | 14 (11.6%) |
| $500 to $799 | 40 (17.7%) | 0 (0.0%) |
| $800 to $999 | 41 (18.1%) | 4 (3.3%) |
| $1,000 to $1,499 | 40 (17.7%) | 38 (31.4%) |
| $1,500 to $1,999 | 35 (15.5%) | 42 (34.7%) |
| $2,000 to $2,499 | 16 (7.1%) | 0 (0.0%) |
| $2,500 to $2,999 | 10 (4.4%) | 0 (0.0%) |
| $3,000 or more | 16 (7.1%) | 7 (5.8%) |
| Total | 226 (100.0%) | 121 (100.0%) |
Physical Housing Characteristics in North Bennington
Housing Structures in North Bennington
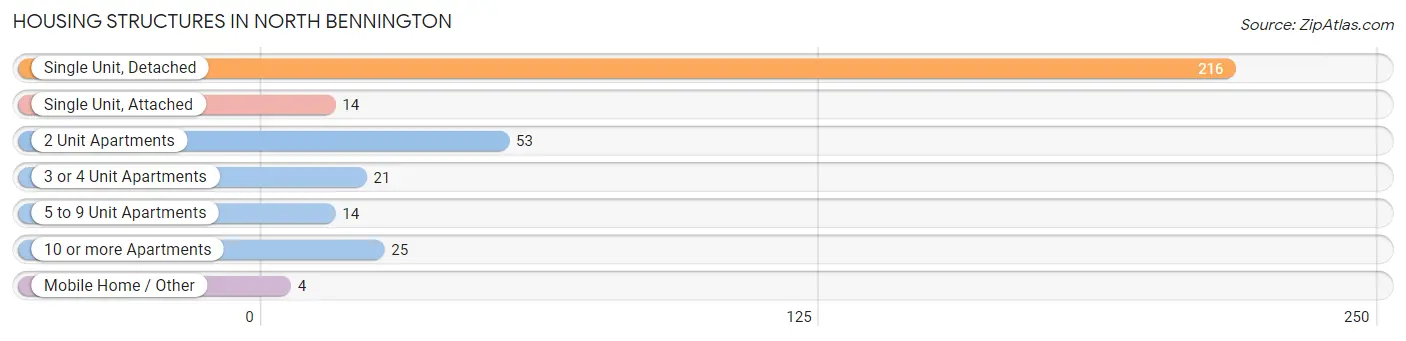
| Structure Type | # Housing Units | % Housing Units |
| Single Unit, Detached | 216 | 62.3% |
| Single Unit, Attached | 14 | 4.0% |
| 2 Unit Apartments | 53 | 15.3% |
| 3 or 4 Unit Apartments | 21 | 6.0% |
| 5 to 9 Unit Apartments | 14 | 4.0% |
| 10 or more Apartments | 25 | 7.2% |
| Mobile Home / Other | 4 | 1.1% |
| Total | 347 | 100.0% |
Housing Structures by Occupancy in North Bennington
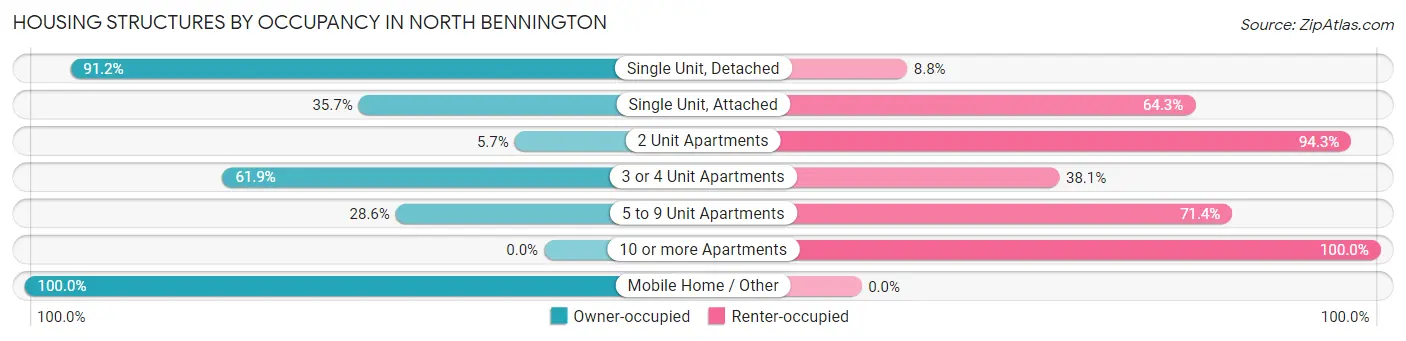
| Structure Type | Owner-occupied | Renter-occupied |
| Single Unit, Detached | 197 (91.2%) | 19 (8.8%) |
| Single Unit, Attached | 5 (35.7%) | 9 (64.3%) |
| 2 Unit Apartments | 3 (5.7%) | 50 (94.3%) |
| 3 or 4 Unit Apartments | 13 (61.9%) | 8 (38.1%) |
| 5 to 9 Unit Apartments | 4 (28.6%) | 10 (71.4%) |
| 10 or more Apartments | 0 (0.0%) | 25 (100.0%) |
| Mobile Home / Other | 4 (100.0%) | 0 (0.0%) |
| Total | 226 (65.1%) | 121 (34.9%) |
Housing Structures by Number of Rooms in North Bennington
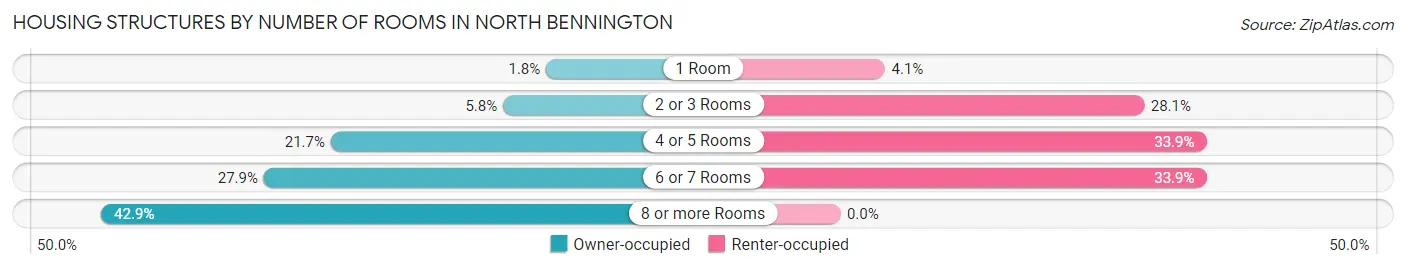
| Number of Rooms | Owner-occupied | Renter-occupied |
| 1 Room | 4 (1.8%) | 5 (4.1%) |
| 2 or 3 Rooms | 13 (5.8%) | 34 (28.1%) |
| 4 or 5 Rooms | 49 (21.7%) | 41 (33.9%) |
| 6 or 7 Rooms | 63 (27.9%) | 41 (33.9%) |
| 8 or more Rooms | 97 (42.9%) | 0 (0.0%) |
| Total | 226 (100.0%) | 121 (100.0%) |
Housing Structure by Heating Type in North Bennington
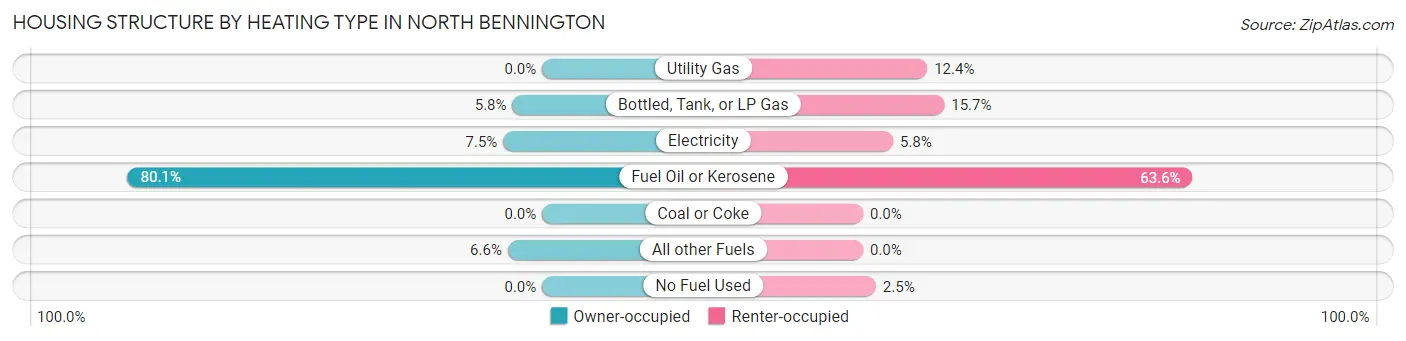
| Heating Type | Owner-occupied | Renter-occupied |
| Utility Gas | 0 (0.0%) | 15 (12.4%) |
| Bottled, Tank, or LP Gas | 13 (5.8%) | 19 (15.7%) |
| Electricity | 17 (7.5%) | 7 (5.8%) |
| Fuel Oil or Kerosene | 181 (80.1%) | 77 (63.6%) |
| Coal or Coke | 0 (0.0%) | 0 (0.0%) |
| All other Fuels | 15 (6.6%) | 0 (0.0%) |
| No Fuel Used | 0 (0.0%) | 3 (2.5%) |
| Total | 226 (100.0%) | 121 (100.0%) |
Household Vehicle Usage in North Bennington
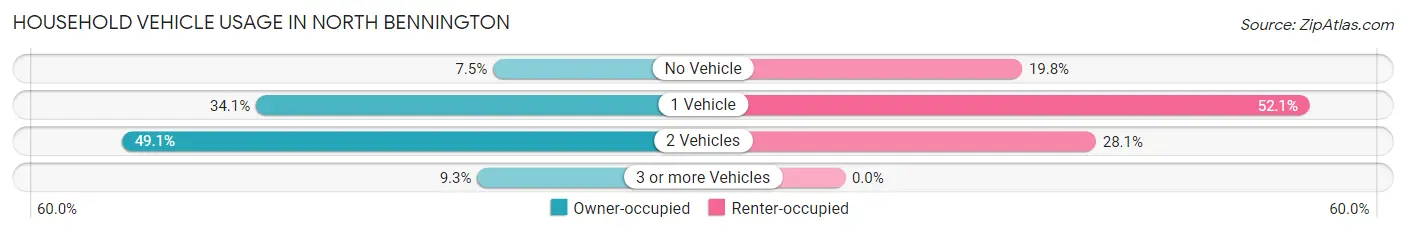
| Vehicles per Household | Owner-occupied | Renter-occupied |
| No Vehicle | 17 (7.5%) | 24 (19.8%) |
| 1 Vehicle | 77 (34.1%) | 63 (52.1%) |
| 2 Vehicles | 111 (49.1%) | 34 (28.1%) |
| 3 or more Vehicles | 21 (9.3%) | 0 (0.0%) |
| Total | 226 (100.0%) | 121 (100.0%) |
Real Estate & Mortgages in North Bennington
Real Estate and Mortgage Overview in North Bennington
| Characteristic | Without Mortgage | With Mortgage |
| Housing Units | 108 | 118 |
| Median Property Value | $223,500 | $277,800 |
| Median Household Income | $56,667 | $19 |
| Monthly Housing Costs | $700 | $16 |
| Real Estate Taxes | $4,615 | $3 |
Property Value by Mortgage Status in North Bennington
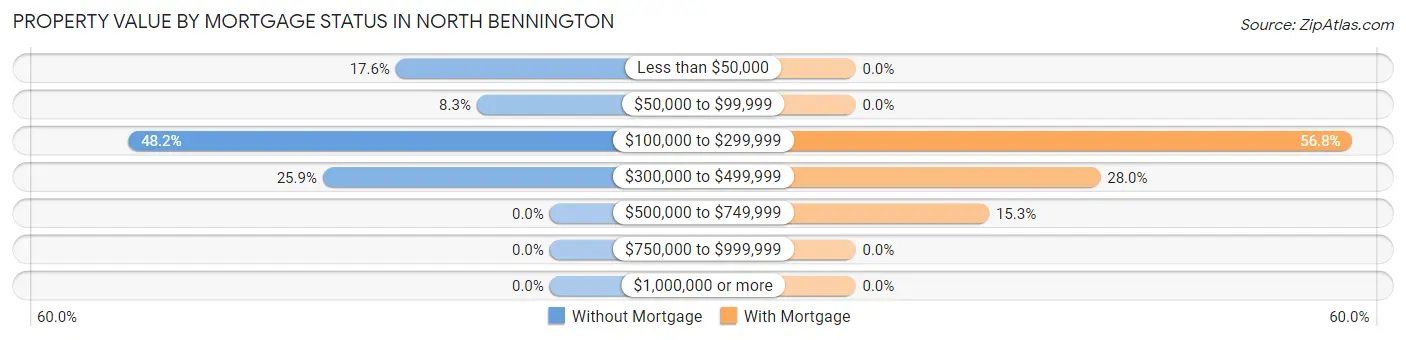
| Property Value | Without Mortgage | With Mortgage |
| Less than $50,000 | 19 (17.6%) | 0 (0.0%) |
| $50,000 to $99,999 | 9 (8.3%) | 0 (0.0%) |
| $100,000 to $299,999 | 52 (48.1%) | 67 (56.8%) |
| $300,000 to $499,999 | 28 (25.9%) | 33 (28.0%) |
| $500,000 to $749,999 | 0 (0.0%) | 18 (15.2%) |
| $750,000 to $999,999 | 0 (0.0%) | 0 (0.0%) |
| $1,000,000 or more | 0 (0.0%) | 0 (0.0%) |
| Total | 108 (100.0%) | 118 (100.0%) |
Household Income by Mortgage Status in North Bennington
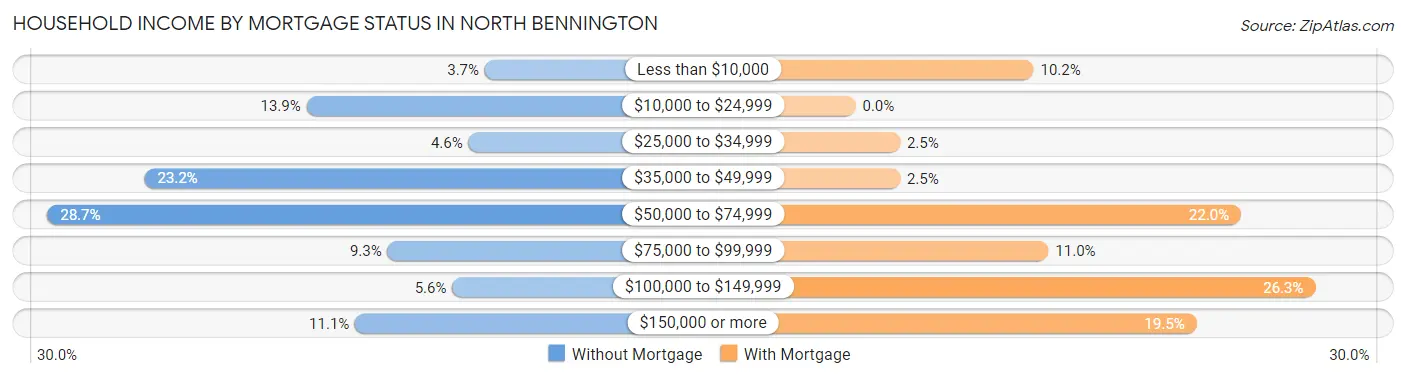
| Household Income | Without Mortgage | With Mortgage |
| Less than $10,000 | 4 (3.7%) | 12 (10.2%) |
| $10,000 to $24,999 | 15 (13.9%) | 0 (0.0%) |
| $25,000 to $34,999 | 5 (4.6%) | 3 (2.5%) |
| $35,000 to $49,999 | 25 (23.2%) | 3 (2.5%) |
| $50,000 to $74,999 | 31 (28.7%) | 26 (22.0%) |
| $75,000 to $99,999 | 10 (9.3%) | 13 (11.0%) |
| $100,000 to $149,999 | 6 (5.6%) | 31 (26.3%) |
| $150,000 or more | 12 (11.1%) | 23 (19.5%) |
| Total | 108 (100.0%) | 118 (100.0%) |
Property Value to Household Income Ratio in North Bennington
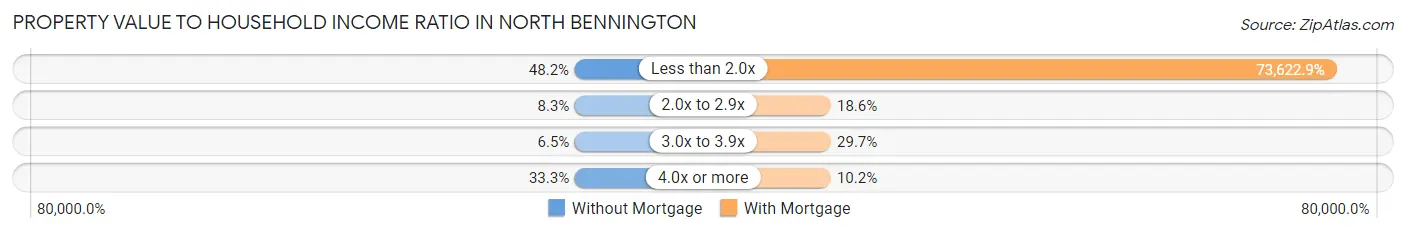
| Value-to-Income Ratio | Without Mortgage | With Mortgage |
| Less than 2.0x | 52 (48.1%) | 86,875 (73,622.9%) |
| 2.0x to 2.9x | 9 (8.3%) | 22 (18.6%) |
| 3.0x to 3.9x | 7 (6.5%) | 35 (29.7%) |
| 4.0x or more | 36 (33.3%) | 12 (10.2%) |
| Total | 108 (100.0%) | 118 (100.0%) |
Real Estate Taxes by Mortgage Status in North Bennington
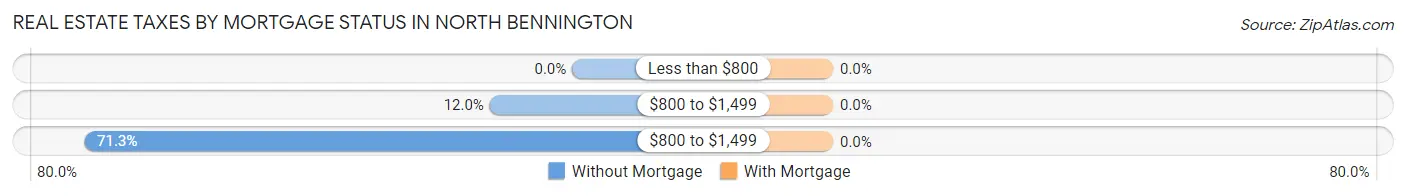
| Property Taxes | Without Mortgage | With Mortgage |
| Less than $800 | 0 (0.0%) | 0 (0.0%) |
| $800 to $1,499 | 13 (12.0%) | 0 (0.0%) |
| $800 to $1,499 | 77 (71.3%) | 0 (0.0%) |
| Total | 108 (100.0%) | 118 (100.0%) |
Health & Disability in North Bennington
Health Insurance Coverage by Age in North Bennington
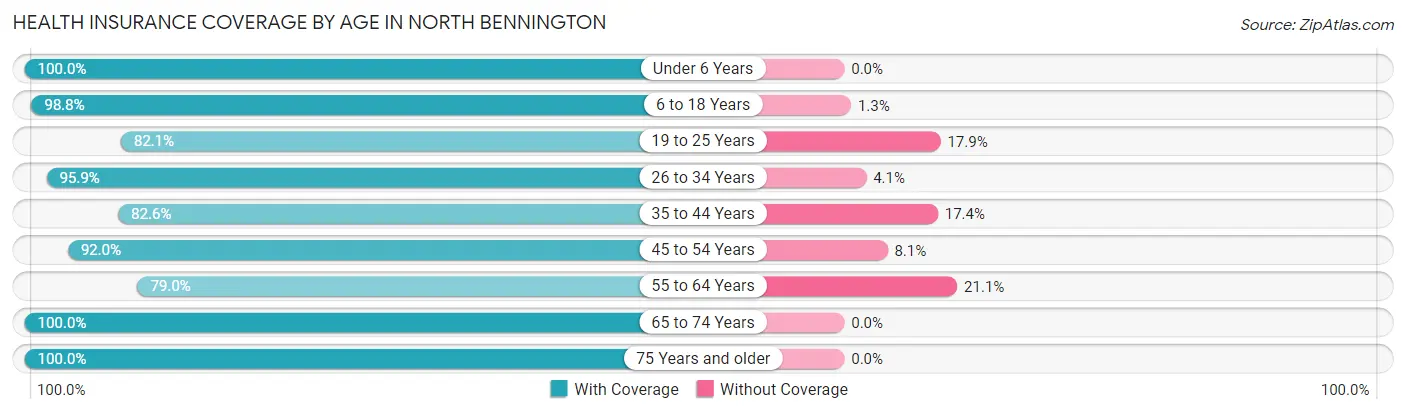
| Age Bracket | With Coverage | Without Coverage |
| Under 6 Years | 38 (100.0%) | 0 (0.0%) |
| 6 to 18 Years | 158 (98.8%) | 2 (1.3%) |
| 19 to 25 Years | 366 (82.1%) | 80 (17.9%) |
| 26 to 34 Years | 47 (95.9%) | 2 (4.1%) |
| 35 to 44 Years | 90 (82.6%) | 19 (17.4%) |
| 45 to 54 Years | 80 (91.9%) | 7 (8.1%) |
| 55 to 64 Years | 60 (78.9%) | 16 (21.0%) |
| 65 to 74 Years | 227 (100.0%) | 0 (0.0%) |
| 75 Years and older | 217 (100.0%) | 0 (0.0%) |
| Total | 1,283 (91.1%) | 126 (8.9%) |
Health Insurance Coverage by Citizenship Status in North Bennington
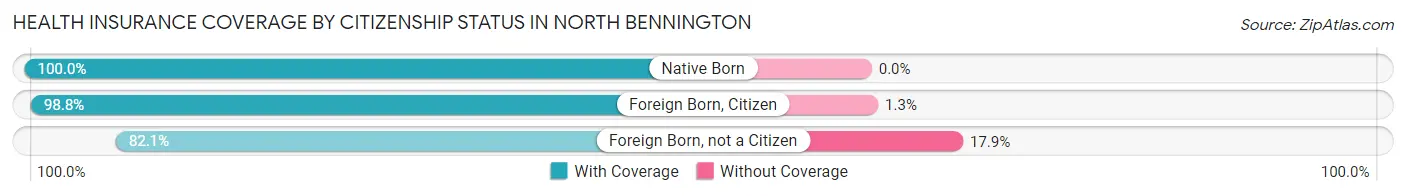
| Citizenship Status | With Coverage | Without Coverage |
| Native Born | 38 (100.0%) | 0 (0.0%) |
| Foreign Born, Citizen | 158 (98.8%) | 2 (1.3%) |
| Foreign Born, not a Citizen | 366 (82.1%) | 80 (17.9%) |
Health Insurance Coverage by Household Income in North Bennington
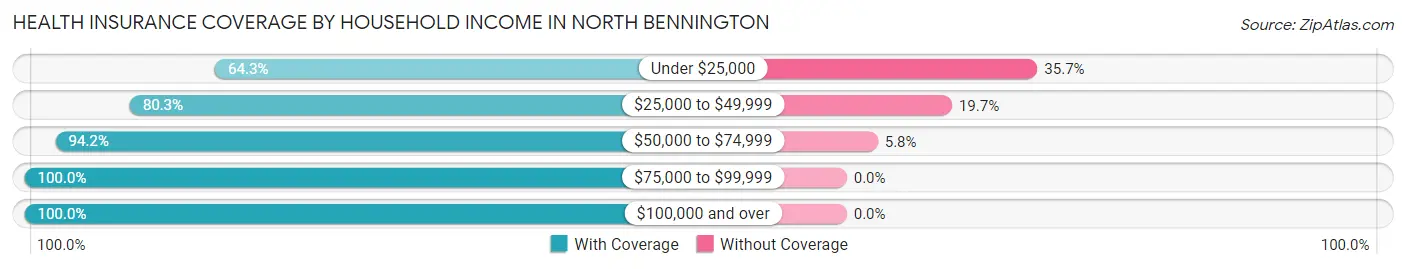
| Household Income | With Coverage | Without Coverage |
| Under $25,000 | 45 (64.3%) | 25 (35.7%) |
| $25,000 to $49,999 | 167 (80.3%) | 41 (19.7%) |
| $50,000 to $74,999 | 162 (94.2%) | 10 (5.8%) |
| $75,000 to $99,999 | 142 (100.0%) | 0 (0.0%) |
| $100,000 and over | 365 (100.0%) | 0 (0.0%) |
Public vs Private Health Insurance Coverage by Age in North Bennington
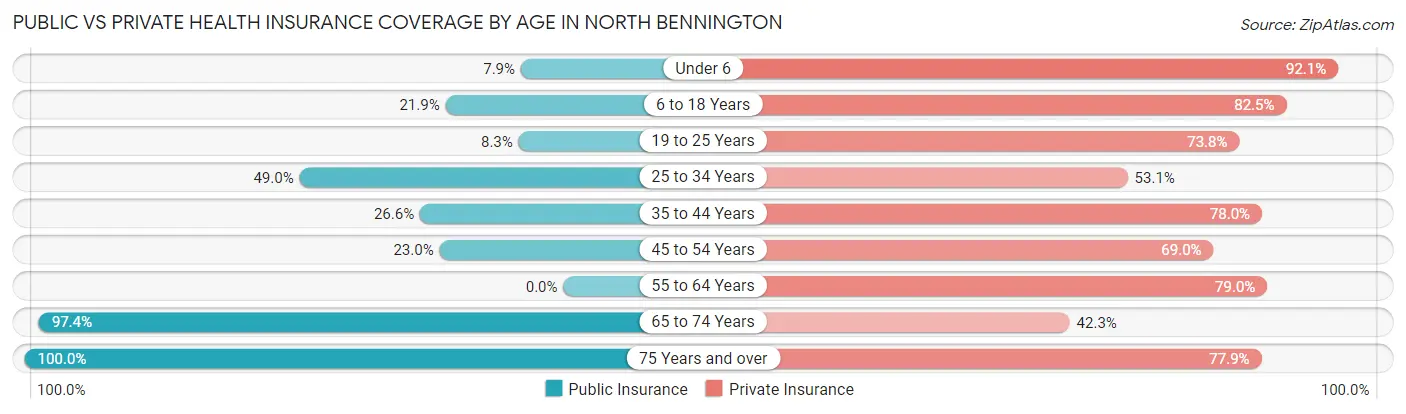
| Age Bracket | Public Insurance | Private Insurance |
| Under 6 | 3 (7.9%) | 35 (92.1%) |
| 6 to 18 Years | 35 (21.9%) | 132 (82.5%) |
| 19 to 25 Years | 37 (8.3%) | 329 (73.8%) |
| 25 to 34 Years | 24 (49.0%) | 26 (53.1%) |
| 35 to 44 Years | 29 (26.6%) | 85 (78.0%) |
| 45 to 54 Years | 20 (23.0%) | 60 (69.0%) |
| 55 to 64 Years | 0 (0.0%) | 60 (78.9%) |
| 65 to 74 Years | 221 (97.4%) | 96 (42.3%) |
| 75 Years and over | 217 (100.0%) | 169 (77.9%) |
| Total | 586 (41.6%) | 992 (70.4%) |
Disability Status by Sex by Age in North Bennington
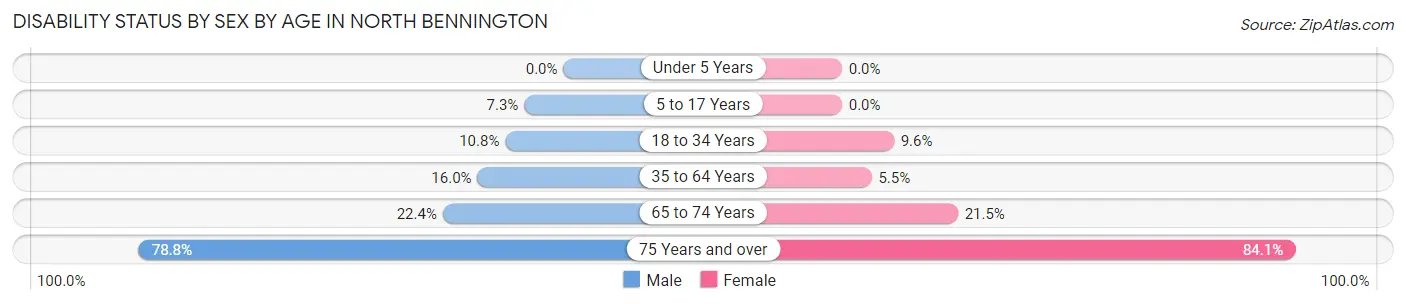
| Age Bracket | Male | Female |
| Under 5 Years | 0 (0.0%) | 0 (0.0%) |
| 5 to 17 Years | 4 (7.3%) | 0 (0.0%) |
| 18 to 34 Years | 26 (10.8%) | 31 (9.6%) |
| 35 to 64 Years | 26 (16.0%) | 6 (5.5%) |
| 65 to 74 Years | 30 (22.4%) | 20 (21.5%) |
| 75 Years and over | 52 (78.8%) | 127 (84.1%) |
Disability Class by Sex by Age in North Bennington
Disability Class: Hearing Difficulty
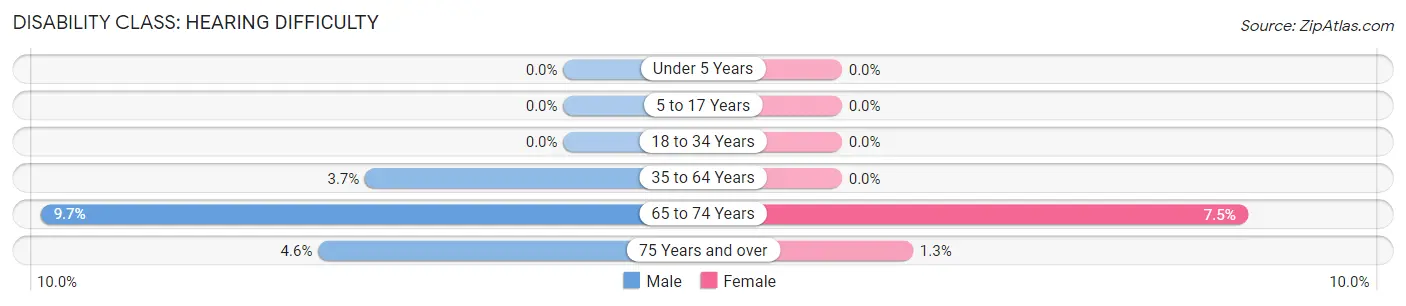
| Age Bracket | Male | Female |
| Under 5 Years | 0 (0.0%) | 0 (0.0%) |
| 5 to 17 Years | 0 (0.0%) | 0 (0.0%) |
| 18 to 34 Years | 0 (0.0%) | 0 (0.0%) |
| 35 to 64 Years | 6 (3.7%) | 0 (0.0%) |
| 65 to 74 Years | 13 (9.7%) | 7 (7.5%) |
| 75 Years and over | 3 (4.5%) | 2 (1.3%) |
Disability Class: Vision Difficulty
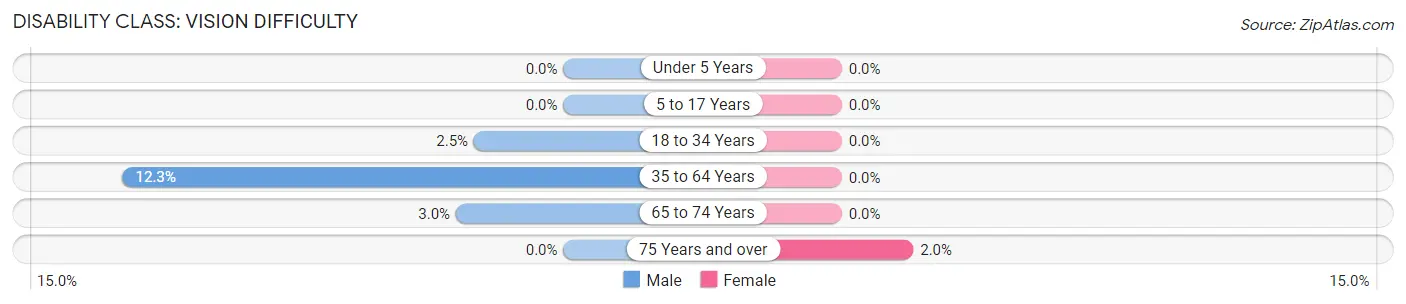
| Age Bracket | Male | Female |
| Under 5 Years | 0 (0.0%) | 0 (0.0%) |
| 5 to 17 Years | 0 (0.0%) | 0 (0.0%) |
| 18 to 34 Years | 6 (2.5%) | 0 (0.0%) |
| 35 to 64 Years | 20 (12.3%) | 0 (0.0%) |
| 65 to 74 Years | 4 (3.0%) | 0 (0.0%) |
| 75 Years and over | 0 (0.0%) | 3 (2.0%) |
Disability Class: Cognitive Difficulty
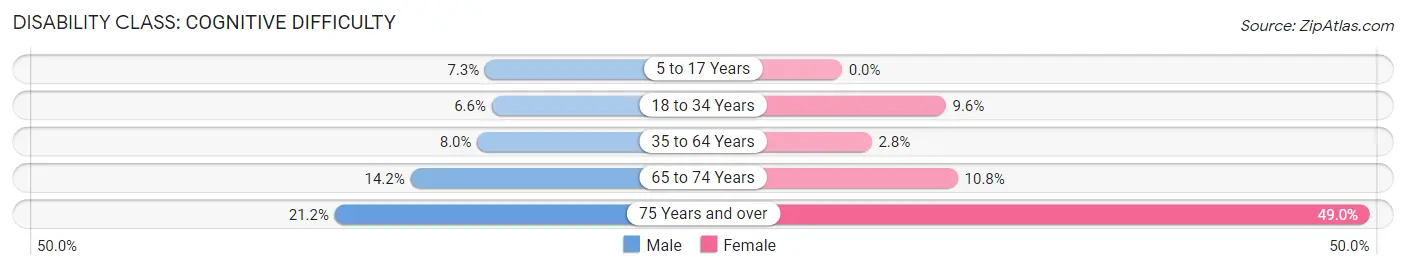
| Age Bracket | Male | Female |
| 5 to 17 Years | 4 (7.3%) | 0 (0.0%) |
| 18 to 34 Years | 16 (6.6%) | 31 (9.6%) |
| 35 to 64 Years | 13 (8.0%) | 3 (2.8%) |
| 65 to 74 Years | 19 (14.2%) | 10 (10.7%) |
| 75 Years and over | 14 (21.2%) | 74 (49.0%) |
Disability Class: Ambulatory Difficulty
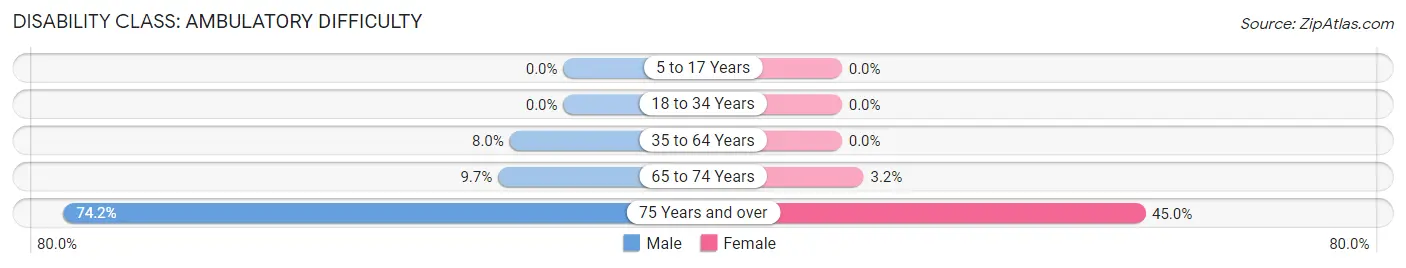
| Age Bracket | Male | Female |
| 5 to 17 Years | 0 (0.0%) | 0 (0.0%) |
| 18 to 34 Years | 0 (0.0%) | 0 (0.0%) |
| 35 to 64 Years | 13 (8.0%) | 0 (0.0%) |
| 65 to 74 Years | 13 (9.7%) | 3 (3.2%) |
| 75 Years and over | 49 (74.2%) | 68 (45.0%) |
Disability Class: Self-Care Difficulty
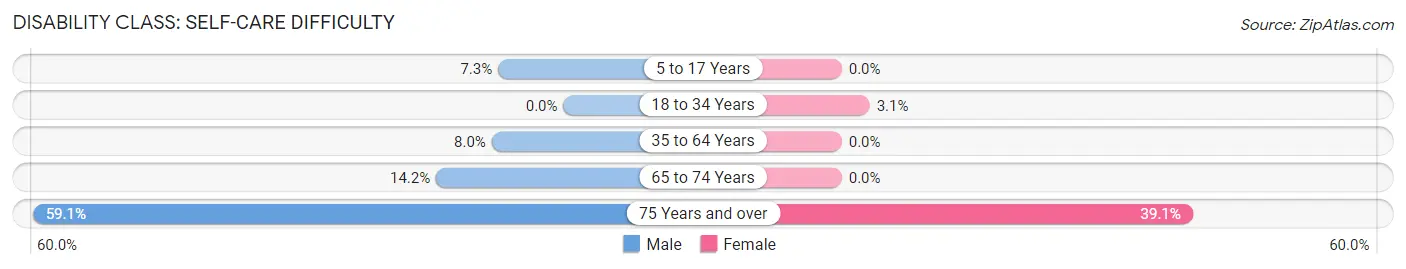
| Age Bracket | Male | Female |
| 5 to 17 Years | 4 (7.3%) | 0 (0.0%) |
| 18 to 34 Years | 0 (0.0%) | 10 (3.1%) |
| 35 to 64 Years | 13 (8.0%) | 0 (0.0%) |
| 65 to 74 Years | 19 (14.2%) | 0 (0.0%) |
| 75 Years and over | 39 (59.1%) | 59 (39.1%) |
Technology Access in North Bennington
Computing Device Access in North Bennington
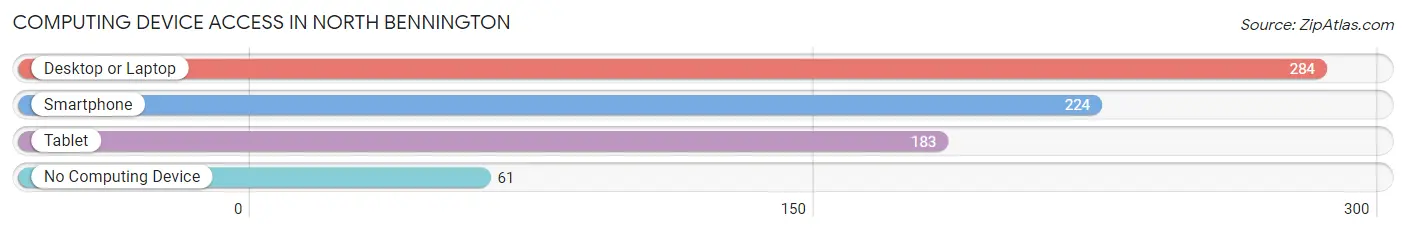
| Device Type | # Households | % Households |
| Desktop or Laptop | 284 | 81.8% |
| Smartphone | 224 | 64.5% |
| Tablet | 183 | 52.7% |
| No Computing Device | 61 | 17.6% |
| Total | 347 | 100.0% |
Internet Access in North Bennington
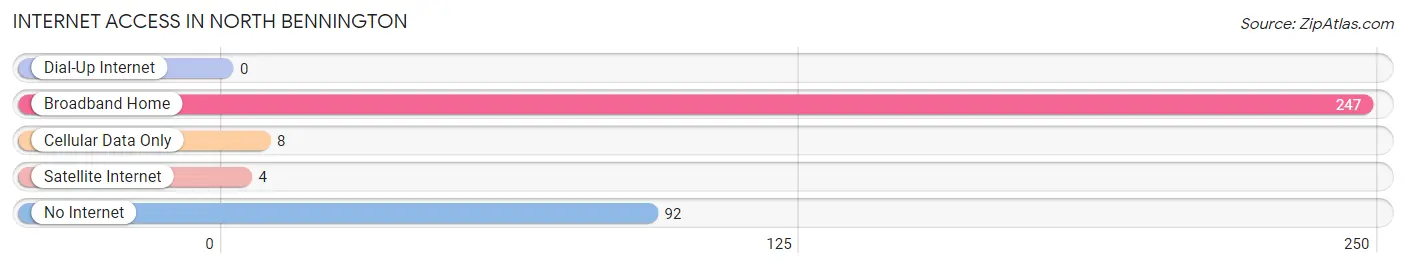
| Internet Type | # Households | % Households |
| Dial-Up Internet | 0 | 0.0% |
| Broadband Home | 247 | 71.2% |
| Cellular Data Only | 8 | 2.3% |
| Satellite Internet | 4 | 1.1% |
| No Internet | 92 | 26.5% |
| Total | 347 | 100.0% |
North Bennington Summary
Bennington, Vermont is a small town located in the southwestern corner of the state. It is the county seat of Bennington County and is home to a population of approximately 15,000 people. The town is situated in the Green Mountains and is surrounded by the Taconic and Green Mountains. Bennington is known for its rich history, beautiful scenery, and vibrant economy.
History
Bennington was first settled in 1761 by a group of settlers from Connecticut. The town was named after Benning Wentworth, the first Royal Governor of New Hampshire. The settlers were attracted to the area due to its fertile soil and abundant natural resources. The town quickly grew and by 1777, it was the largest town in Vermont. During the Revolutionary War, Bennington was the site of a major battle between the American and British forces. The Battle of Bennington was a decisive victory for the Americans and helped to turn the tide of the war.
In the 19th century, Bennington became an important industrial center. The town was home to several factories, including a woolen mill, a paper mill, and a tannery. The town also became a center for education, with several colleges and universities being established in the area.
Geography
Bennington is located in the southwestern corner of Vermont, near the borders of Massachusetts and New York. The town is situated in the Green Mountains and is surrounded by the Taconic and Green Mountains. The town is located at the confluence of the Walloomsac River and the Batten Kill River. The town is located at an elevation of 1,000 feet and has a total area of 8.3 square miles.
Economy
Bennington’s economy is largely based on tourism and manufacturing. The town is home to several factories, including a paper mill, a tannery, and a woolen mill. The town is also home to several colleges and universities, which provide a significant economic boost to the area. In addition, Bennington is home to several small businesses, including restaurants, shops, and galleries.
Demographics
As of the 2010 census, Bennington had a population of 15,764 people. The racial makeup of the town was 94.3% White, 1.3% African American, 0.4% Native American, 1.2% Asian, 0.1% Pacific Islander, 1.2% from other races, and 1.5% from two or more races. The median household income in Bennington was $45,837 and the median family income was $54,837. The per capita income in Bennington was $25,837.
Bennington is a small town with a rich history and vibrant economy. The town is home to several factories, colleges, and universities, as well as a variety of small businesses. The town is also known for its beautiful scenery and is a popular tourist destination. Bennington is a great place to live, work, and visit.
Common Questions
What is the Total Population of North Bennington?
Total Population of North Bennington is 1,420.
What is the Total Male Population of North Bennington?
Total Male Population of North Bennington is 685.
What is the Total Female Population of North Bennington?
Total Female Population of North Bennington is 735.
What is the Ratio of Males per 100 Females in North Bennington?
There are 93.20 Males per 100 Females in North Bennington.
What is the Ratio of Females per 100 Males in North Bennington?
There are 107.30 Females per 100 Males in North Bennington.
What is the Median Population Age in North Bennington?
Median Population Age in North Bennington is 35.9 Years.
What is the Average Family Size in North Bennington
Average Family Size in North Bennington is 2.8 People.
What is the Average Household Size in North Bennington
Average Household Size in North Bennington is 2.8 People.
What is Per Capita Income in North Bennington?
Per Capita income in North Bennington is $26,321.
What is the Median Family Income in North Bennington?
Median Family Income in North Bennington is $68,229.
What is the Median Household income in North Bennington?
Median Household Income in North Bennington is $62,125.
What is Income or Wage Gap in North Bennington?
Income or Wage Gap in North Bennington is 41.7%.
Women in North Bennington earn 58.3 cents for every dollar earned by a man.
What is Inequality or Gini Index in North Bennington?
Inequality or Gini Index in North Bennington is 0.41.
How Large is the Labor Force in North Bennington?
There are 620 People in the Labor Forcein in North Bennington.
What is the Percentage of People in the Labor Force in North Bennington?
46.8% of People are in the Labor Force in North Bennington.
What is the Unemployment Rate in North Bennington?
Unemployment Rate in North Bennington is 6.0%.