Hinesburg, VT
Hinesburg Map
Hinesburg Overview
790
TOTAL POPULATION
344
MALE POPULATION
446
FEMALE POPULATION
77.13
MALES / 100 FEMALES
129.65
FEMALES / 100 MALES
35.1
MEDIAN AGE
2.8
AVG FAMILY SIZE
2.1
AVG HOUSEHOLD SIZE
$34,430
PER CAPITA INCOME
$83,177
AVG FAMILY INCOME
$62,888
AVG HOUSEHOLD INCOME
0.35
INEQUALITY / GINI INDEX
516
LABOR FORCE [ PEOPLE ]
86.9%
PERCENT IN LABOR FORCE
4.1%
UNEMPLOYMENT RATE
Hinesburg Zip Codes
Hinesburg Area Codes
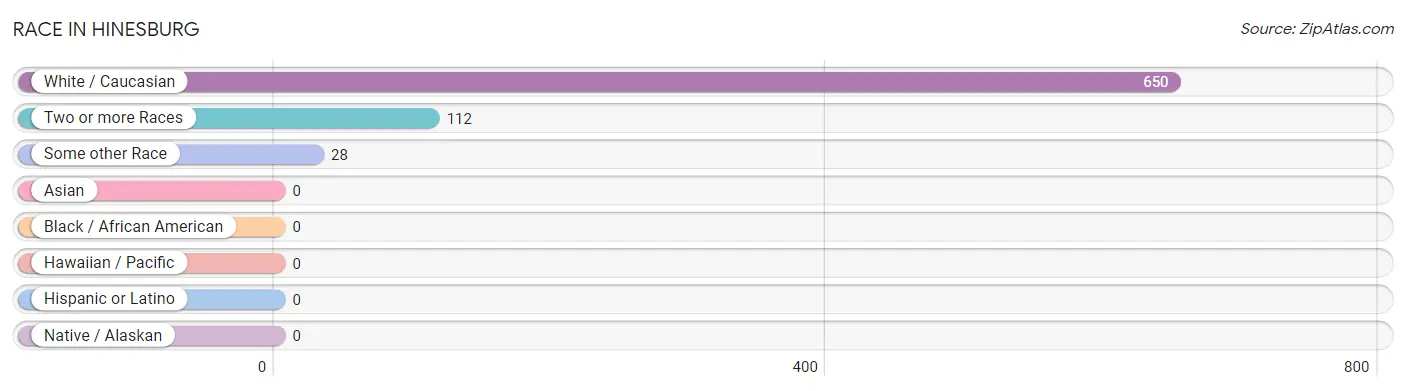
Race in Hinesburg
The most populous races in Hinesburg are White / Caucasian (650 | 82.3%), Two or more Races (112 | 14.2%), and Some other Race (28 | 3.5%).
| Race | # Population | % Population |
| Asian | 0 | 0.0% |
| Black / African American | 0 | 0.0% |
| Hawaiian / Pacific | 0 | 0.0% |
| Hispanic or Latino | 0 | 0.0% |
| Native / Alaskan | 0 | 0.0% |
| White / Caucasian | 650 | 82.3% |
| Two or more Races | 112 | 14.2% |
| Some other Race | 28 | 3.5% |
| Total | 790 | 100.0% |
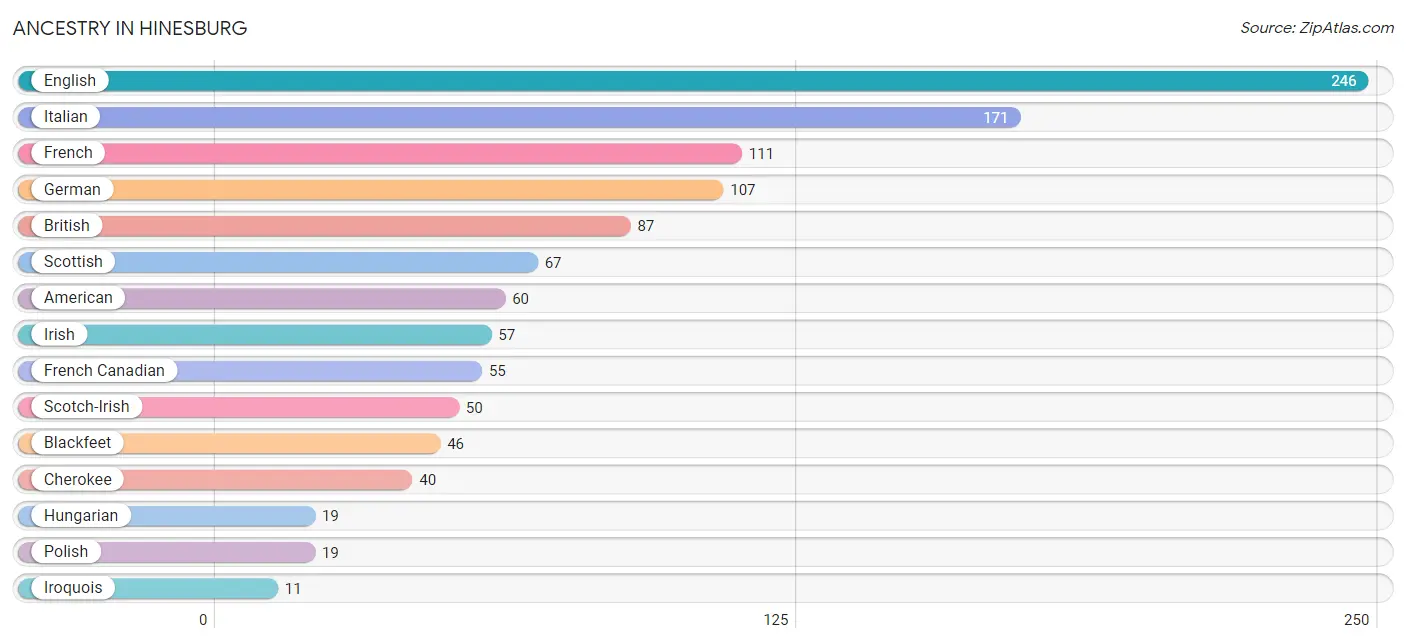
Ancestry in Hinesburg
The most populous ancestries reported in Hinesburg are English (246 | 31.1%), Italian (171 | 21.6%), French (111 | 14.1%), German (107 | 13.5%), and British (87 | 11.0%), together accounting for 91.4% of all Hinesburg residents.
| Ancestry | # Population | % Population |
| American | 60 | 7.6% |
| Blackfeet | 46 | 5.8% |
| British | 87 | 11.0% |
| Cherokee | 40 | 5.1% |
| English | 246 | 31.1% |
| French | 111 | 14.1% |
| French Canadian | 55 | 7.0% |
| German | 107 | 13.5% |
| Hungarian | 19 | 2.4% |
| Irish | 57 | 7.2% |
| Iroquois | 11 | 1.4% |
| Italian | 171 | 21.6% |
| Polish | 19 | 2.4% |
| Scotch-Irish | 50 | 6.3% |
| Scottish | 67 | 8.5% | View All 15 Rows |
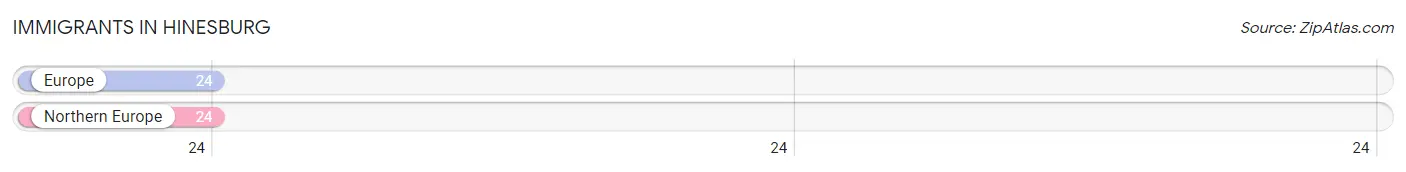
Immigrants in Hinesburg
The most numerous immigrant groups reported in Hinesburg came from Europe (24 | 3.0%), and Northern Europe (24 | 3.0%), together accounting for 6.1% of all Hinesburg residents.
| Immigration Origin | # Population | % Population |
| Europe | 24 | 3.0% |
| Northern Europe | 24 | 3.0% | View All 2 Rows |
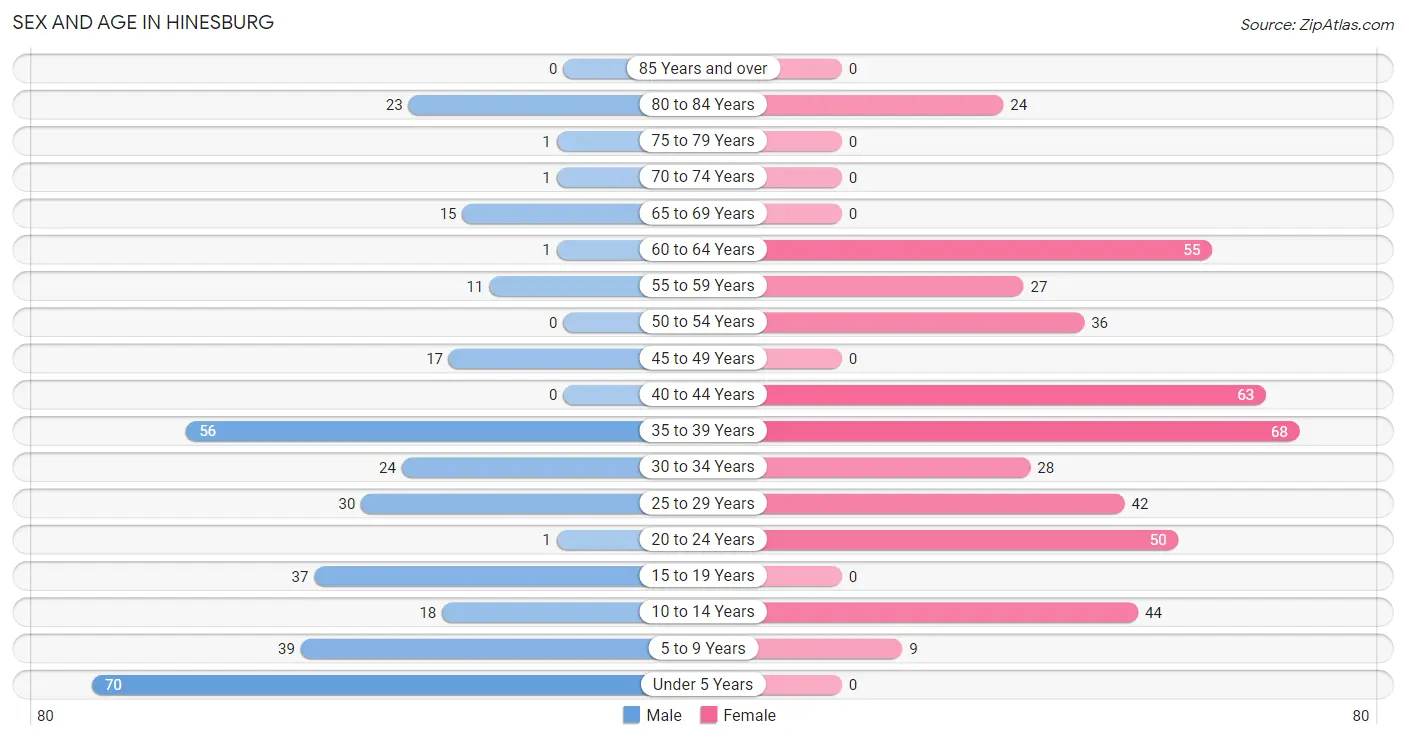
Sex and Age in Hinesburg
Sex and Age in Hinesburg
The most populous age groups in Hinesburg are Under 5 Years (70 | 20.3%) for men and 35 to 39 Years (68 | 15.2%) for women.
| Age Bracket | Male | Female |
| Under 5 Years | 70 (20.3%) | 0 (0.0%) |
| 5 to 9 Years | 39 (11.3%) | 9 (2.0%) |
| 10 to 14 Years | 18 (5.2%) | 44 (9.9%) |
| 15 to 19 Years | 37 (10.8%) | 0 (0.0%) |
| 20 to 24 Years | 1 (0.3%) | 50 (11.2%) |
| 25 to 29 Years | 30 (8.7%) | 42 (9.4%) |
| 30 to 34 Years | 24 (7.0%) | 28 (6.3%) |
| 35 to 39 Years | 56 (16.3%) | 68 (15.2%) |
| 40 to 44 Years | 0 (0.0%) | 63 (14.1%) |
| 45 to 49 Years | 17 (4.9%) | 0 (0.0%) |
| 50 to 54 Years | 0 (0.0%) | 36 (8.1%) |
| 55 to 59 Years | 11 (3.2%) | 27 (6.0%) |
| 60 to 64 Years | 1 (0.3%) | 55 (12.3%) |
| 65 to 69 Years | 15 (4.4%) | 0 (0.0%) |
| 70 to 74 Years | 1 (0.3%) | 0 (0.0%) |
| 75 to 79 Years | 1 (0.3%) | 0 (0.0%) |
| 80 to 84 Years | 23 (6.7%) | 24 (5.4%) |
| 85 Years and over | 0 (0.0%) | 0 (0.0%) |
| Total | 344 (100.0%) | 446 (100.0%) |
Families and Households in Hinesburg
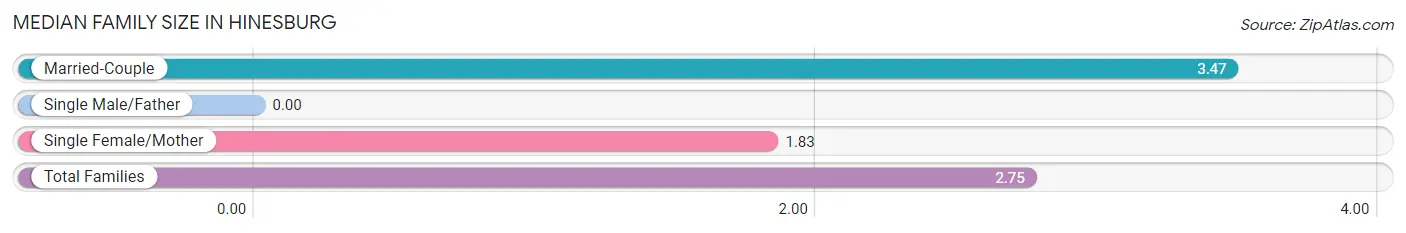
Median Family Size in Hinesburg
| Family Type | # Families | Family Size |
| Married-Couple | 117 (56.0%) | 3.47 |
| Single Male/Father | 0 (0.0%) | - |
| Single Female/Mother | 92 (44.0%) | 1.83 |
| Total Families | 209 (100.0%) | 2.75 |
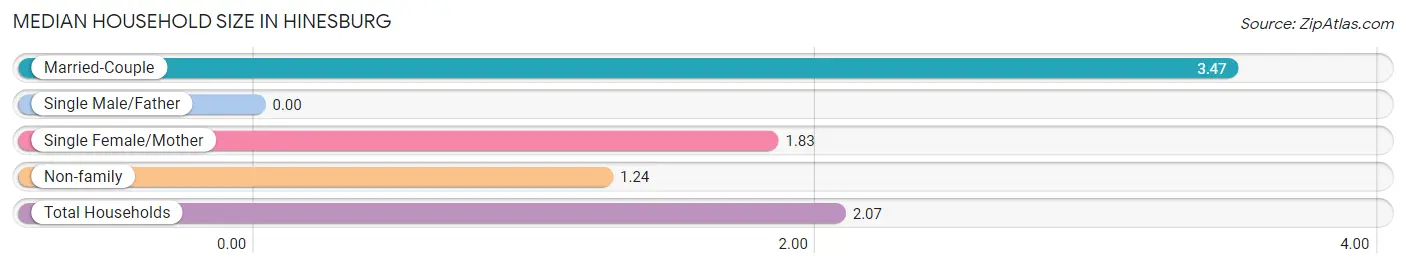
Median Household Size in Hinesburg
| Household Type | # Households | Household Size |
| Married-Couple | 117 (30.9%) | 3.47 |
| Single Male/Father | 0 (0.0%) | - |
| Single Female/Mother | 92 (24.3%) | 1.83 |
| Non-family | 170 (44.9%) | 1.24 |
| Total Households | 379 (100.0%) | 2.07 |
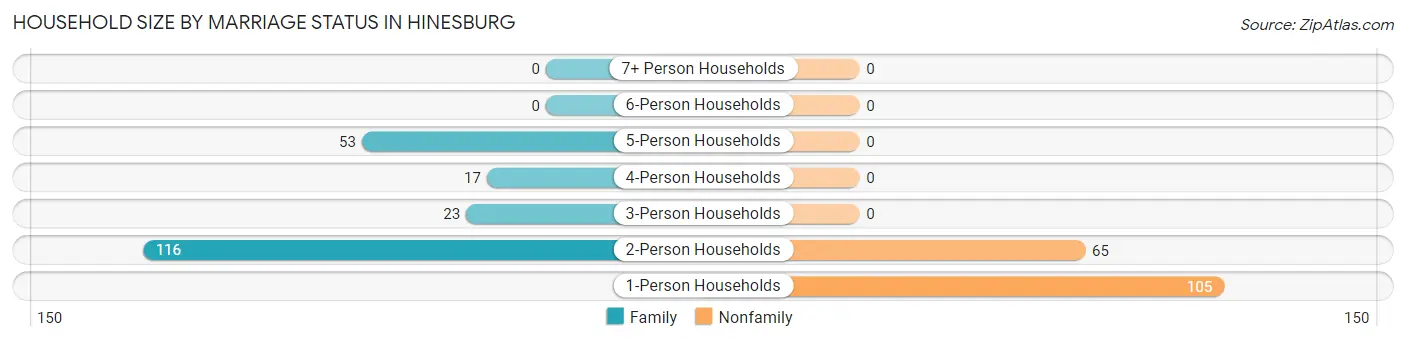
Household Size by Marriage Status in Hinesburg
Out of a total of 379 households in Hinesburg, 209 (55.1%) are family households, while 170 (44.9%) are nonfamily households. The most numerous type of family households are 2-person households, comprising 116, and the most common type of nonfamily households are 1-person households, comprising 105.
| Household Size | Family Households | Nonfamily Households |
| 1-Person Households | - | 105 (27.7%) |
| 2-Person Households | 116 (30.6%) | 65 (17.2%) |
| 3-Person Households | 23 (6.1%) | 0 (0.0%) |
| 4-Person Households | 17 (4.5%) | 0 (0.0%) |
| 5-Person Households | 53 (14.0%) | 0 (0.0%) |
| 6-Person Households | 0 (0.0%) | 0 (0.0%) |
| 7+ Person Households | 0 (0.0%) | 0 (0.0%) |
| Total | 209 (55.1%) | 170 (44.9%) |
Female Fertility in Hinesburg
Fertility by Age in Hinesburg
| Age Bracket | Women with Births | Births / 1,000 Women |
| 15 to 19 years | 0 (0.0%) | 0.0 |
| 20 to 34 years | 0 (0.0%) | 0.0 |
| 35 to 50 years | 0 (0.0%) | 0.0 |
| Total | 0 (0.0%) | 0.0 |
Fertility by Age by Marriage Status in Hinesburg
| Age Bracket | Married | Unmarried |
| 15 to 19 years | 0 (0.0%) | 0 (0.0%) |
| 20 to 34 years | 0 (0.0%) | 0 (0.0%) |
| 35 to 50 years | 0 (0.0%) | 0 (0.0%) |
| Total | 0 (0.0%) | 0 (0.0%) |
Fertility by Education in Hinesburg
| Educational Attainment | Women with Births | Births / 1,000 Women |
| Less than High School | 0 (0.0%) | 0.0 |
| High School Diploma | 0 (0.0%) | 0.0 |
| College or Associate's Degree | 0 (0.0%) | 0.0 |
| Bachelor's Degree | 0 (0.0%) | 0.0 |
| Graduate Degree | 0 (0.0%) | 0.0 |
| Total | 0 (0.0%) | 0.0 |
Fertility by Education by Marriage Status in Hinesburg
| Educational Attainment | Married | Unmarried |
| Less than High School | 0 (0.0%) | 0 (0.0%) |
| High School Diploma | 0 (0.0%) | 0 (0.0%) |
| College or Associate's Degree | 0 (0.0%) | 0 (0.0%) |
| Bachelor's Degree | 0 (0.0%) | 0 (0.0%) |
| Graduate Degree | 0 (0.0%) | 0 (0.0%) |
| Total | 0 (0.0%) | 0 (0.0%) |
Income in Hinesburg
Income Overview in Hinesburg
Per Capita Income in Hinesburg is $34,430, while median incomes of families and households are $83,177 and $62,888 respectively.
| Characteristic | Number | Measure |
| Per Capita Income | 790 | $34,430 |
| Median Family Income | 209 | $83,177 |
| Mean Family Income | 209 | $90,365 |
| Median Household Income | 379 | $62,888 |
| Mean Household Income | 379 | $72,071 |
| Income Deficit | 209 | $0 |
| Wage / Income Gap (%) | 790 | 0.00% |
| Wage / Income Gap ($) | 790 | 100.00¢ per $1 |
| Gini / Inequality Index | 790 | 0.35 |
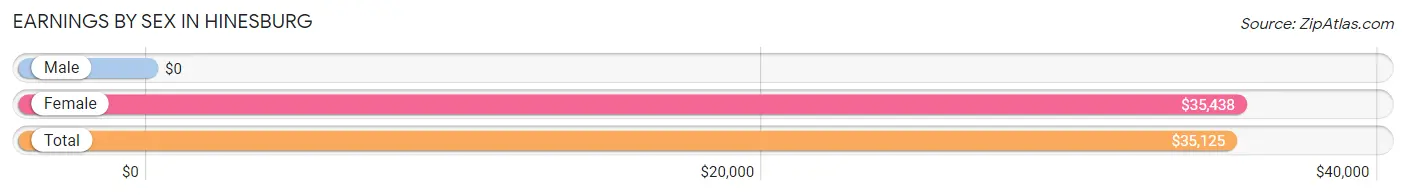
Earnings by Sex in Hinesburg
| Sex | Number | Average Earnings |
| Male | 175 (32.9%) | $0 |
| Female | 357 (67.1%) | $35,438 |
| Total | 532 (100.0%) | $35,125 |
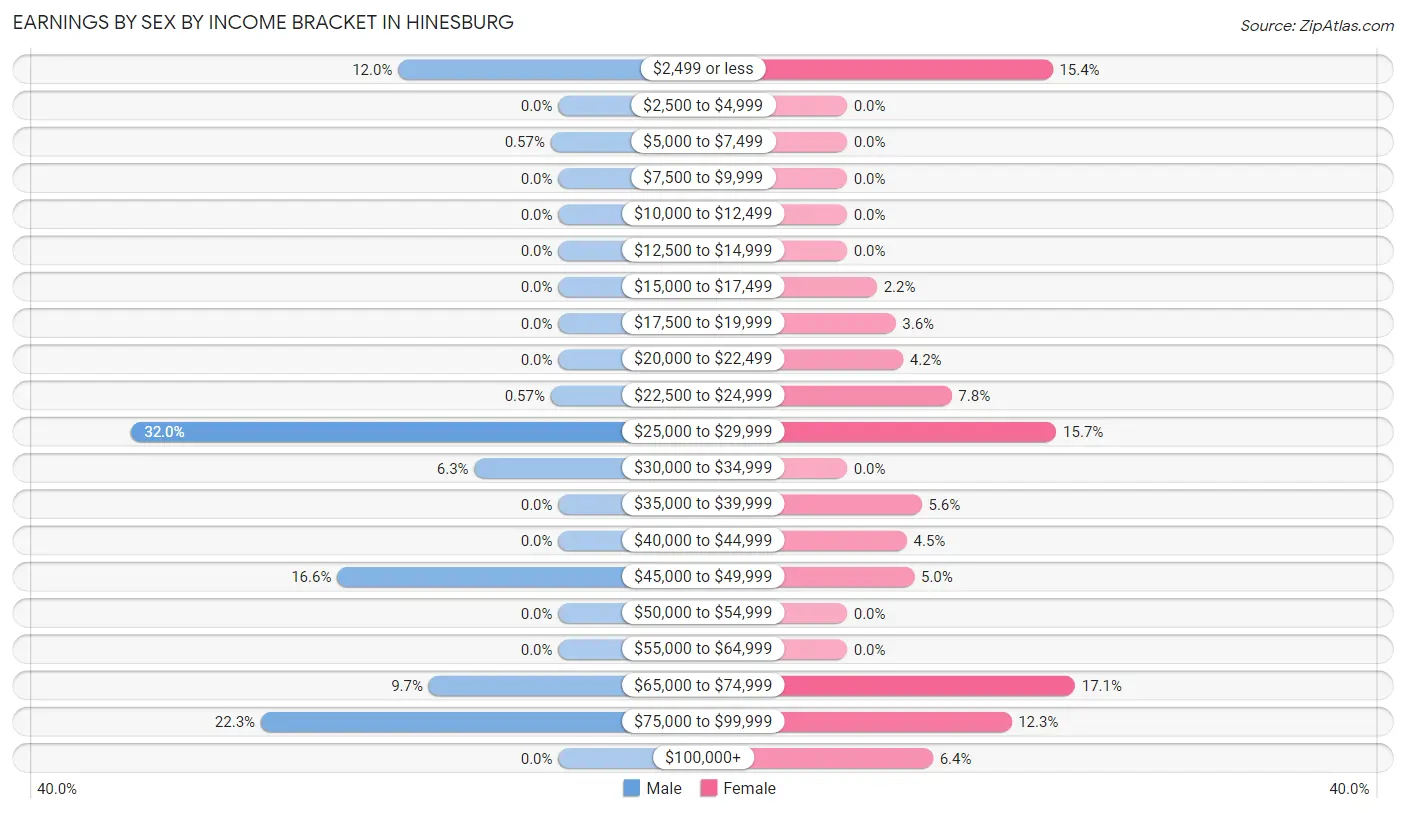
Earnings by Sex by Income Bracket in Hinesburg
The most common earnings brackets in Hinesburg are $25,000 to $29,999 for men (56 | 32.0%) and $65,000 to $74,999 for women (61 | 17.1%).
| Income | Male | Female |
| $2,499 or less | 21 (12.0%) | 55 (15.4%) |
| $2,500 to $4,999 | 0 (0.0%) | 0 (0.0%) |
| $5,000 to $7,499 | 1 (0.6%) | 0 (0.0%) |
| $7,500 to $9,999 | 0 (0.0%) | 0 (0.0%) |
| $10,000 to $12,499 | 0 (0.0%) | 0 (0.0%) |
| $12,500 to $14,999 | 0 (0.0%) | 0 (0.0%) |
| $15,000 to $17,499 | 0 (0.0%) | 8 (2.2%) |
| $17,500 to $19,999 | 0 (0.0%) | 13 (3.6%) |
| $20,000 to $22,499 | 0 (0.0%) | 15 (4.2%) |
| $22,500 to $24,999 | 1 (0.6%) | 28 (7.8%) |
| $25,000 to $29,999 | 56 (32.0%) | 56 (15.7%) |
| $30,000 to $34,999 | 11 (6.3%) | 0 (0.0%) |
| $35,000 to $39,999 | 0 (0.0%) | 20 (5.6%) |
| $40,000 to $44,999 | 0 (0.0%) | 16 (4.5%) |
| $45,000 to $49,999 | 29 (16.6%) | 18 (5.0%) |
| $50,000 to $54,999 | 0 (0.0%) | 0 (0.0%) |
| $55,000 to $64,999 | 0 (0.0%) | 0 (0.0%) |
| $65,000 to $74,999 | 17 (9.7%) | 61 (17.1%) |
| $75,000 to $99,999 | 39 (22.3%) | 44 (12.3%) |
| $100,000+ | 0 (0.0%) | 23 (6.4%) |
| Total | 175 (100.0%) | 357 (100.0%) |
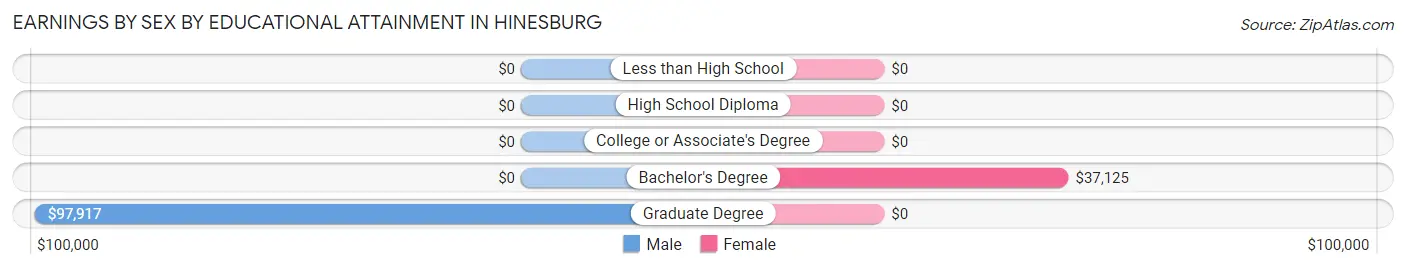
Earnings by Sex by Educational Attainment in Hinesburg
Average earnings in Hinesburg are $48,190 for men and $43,828 for women, a difference of 9.0%. Men with an educational attainment of graduate degree enjoy the highest average annual earnings of $97,917, while those with graduate degree education earn the least with $97,917. Women with an educational attainment of bachelor's degree earn the most with the average annual earnings of $37,125, while those with bachelor's degree education have the smallest earnings of $37,125.
| Educational Attainment | Male Income | Female Income |
| Less than High School | - | - |
| High School Diploma | - | - |
| College or Associate's Degree | - | - |
| Bachelor's Degree | - | - |
| Graduate Degree | $97,917 | $0 |
| Total | $48,190 | $43,828 |
Family Income in Hinesburg
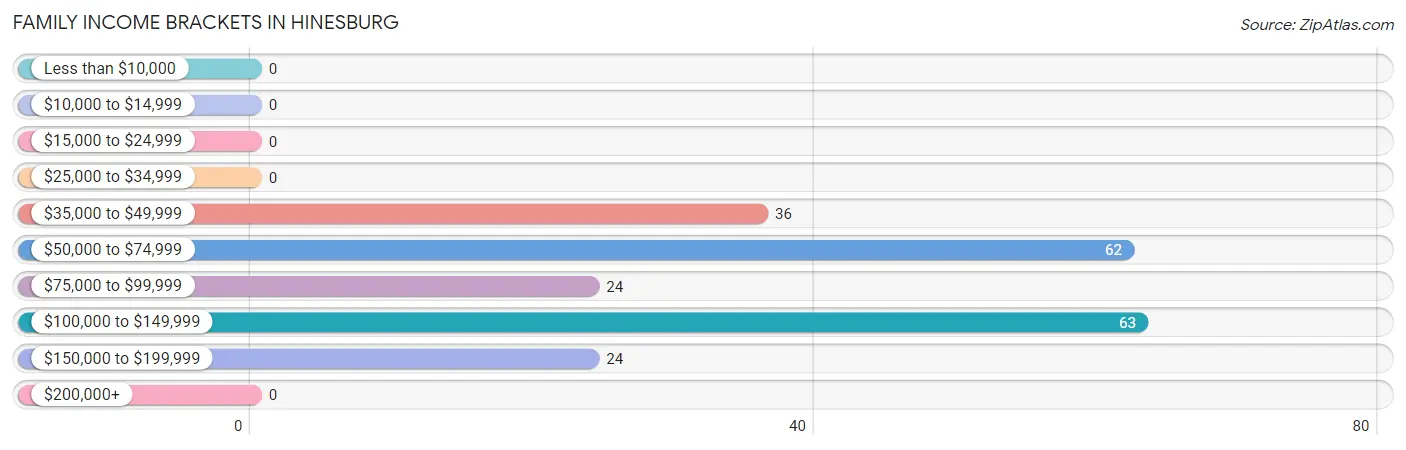
Family Income Brackets in Hinesburg
According to the Hinesburg family income data, there are 63 families falling into the $100,000 to $149,999 income range, which is the most common income bracket and makes up 30.1% of all families.
| Income Bracket | # Families | % Families |
| Less than $10,000 | 0 | 0.0% |
| $10,000 to $14,999 | 0 | 0.0% |
| $15,000 to $24,999 | 0 | 0.0% |
| $25,000 to $34,999 | 0 | 0.0% |
| $35,000 to $49,999 | 36 | 17.2% |
| $50,000 to $74,999 | 62 | 29.7% |
| $75,000 to $99,999 | 24 | 11.5% |
| $100,000 to $149,999 | 63 | 30.1% |
| $150,000 to $199,999 | 24 | 11.5% |
| $200,000+ | 0 | 0.0% |
Family Income by Famaliy Size in Hinesburg
2-person families (116 | 55.5%) account for the highest median family income in Hinesburg with $53,472 per family, while 2-person families (116 | 55.5%) have the highest median income of $26,736 per family member.
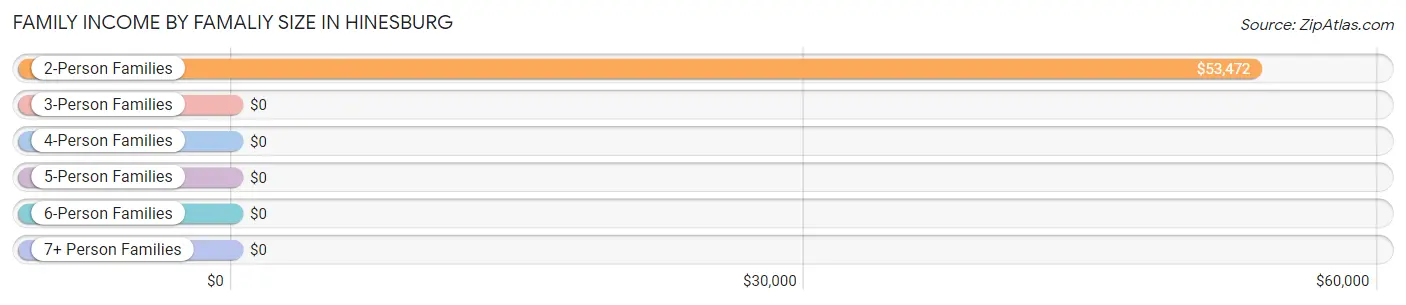
| Income Bracket | # Families | Median Income |
| 2-Person Families | 116 (55.5%) | $53,472 |
| 3-Person Families | 23 (11.0%) | $0 |
| 4-Person Families | 17 (8.1%) | $0 |
| 5-Person Families | 53 (25.4%) | $0 |
| 6-Person Families | 0 (0.0%) | $0 |
| 7+ Person Families | 0 (0.0%) | $0 |
| Total | 209 (100.0%) | $83,177 |
Family Income by Number of Earners in Hinesburg
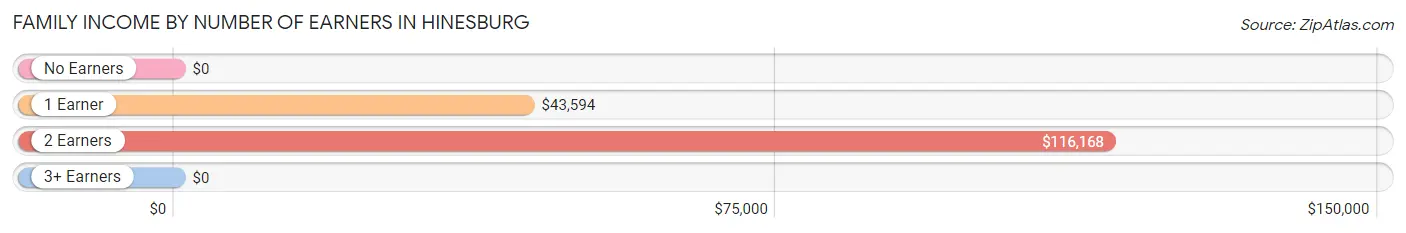
| Number of Earners | # Families | Median Income |
| No Earners | 24 (11.5%) | $0 |
| 1 Earner | 54 (25.8%) | $43,594 |
| 2 Earners | 131 (62.7%) | $116,168 |
| 3+ Earners | 0 (0.0%) | $0 |
| Total | 209 (100.0%) | $83,177 |
Household Income in Hinesburg
Household Income Brackets in Hinesburg
With 130 households falling in the category, the $50,000 to $74,999 income range is the most frequent in Hinesburg, accounting for 34.3% of all households.
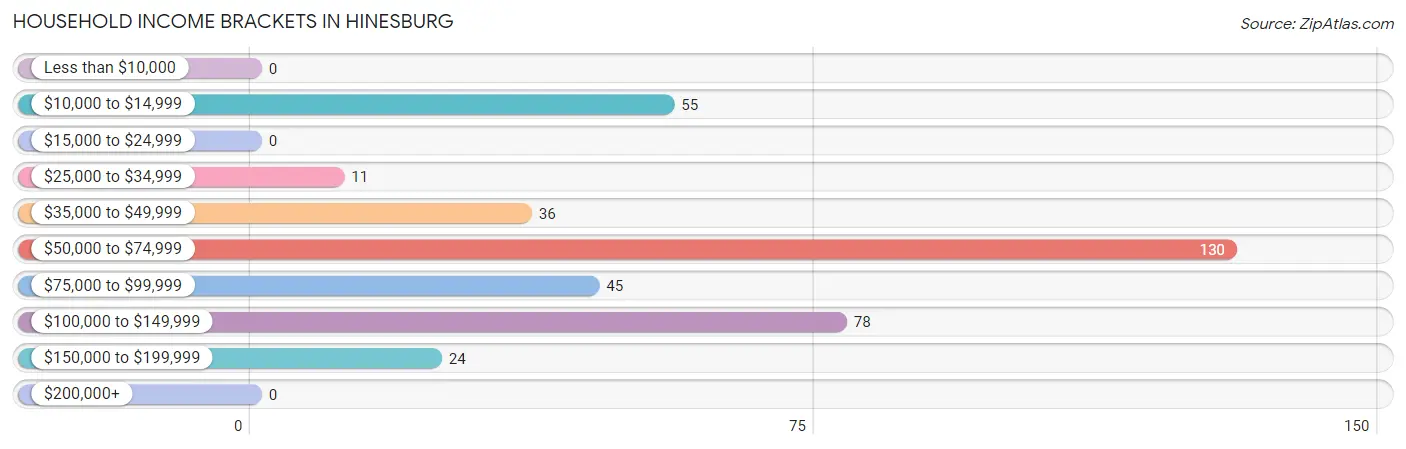
| Income Bracket | # Households | % Households |
| Less than $10,000 | 0 | 0.0% |
| $10,000 to $14,999 | 55 | 14.5% |
| $15,000 to $24,999 | 0 | 0.0% |
| $25,000 to $34,999 | 11 | 2.9% |
| $35,000 to $49,999 | 36 | 9.5% |
| $50,000 to $74,999 | 130 | 34.3% |
| $75,000 to $99,999 | 45 | 11.9% |
| $100,000 to $149,999 | 78 | 20.6% |
| $150,000 to $199,999 | 24 | 6.3% |
| $200,000+ | 0 | 0.0% |
Household Income by Householder Age in Hinesburg
The median household income in Hinesburg is $62,888, with the highest median household income of $70,208 found in the 25 to 44 years age bracket for the primary householder. A total of 169 households (44.6%) fall into this category. Meanwhile, the 15 to 24 years age bracket for the primary householder has the lowest median household income of $0, with 50 households (13.2%) in this group.
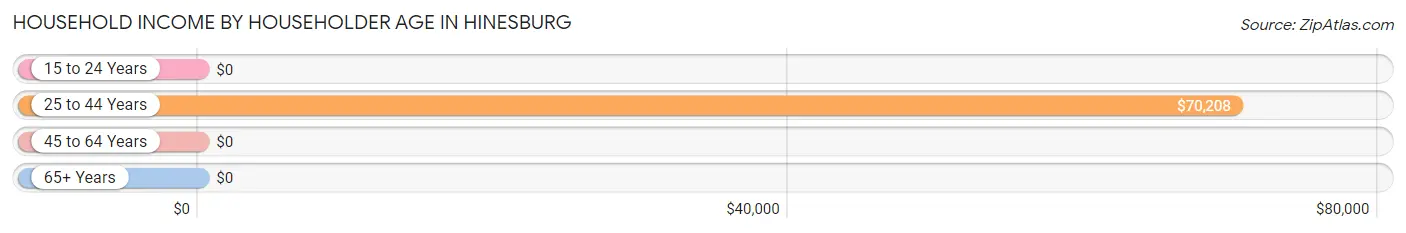
| Income Bracket | # Households | Median Income |
| 15 to 24 Years | 50 (13.2%) | $0 |
| 25 to 44 Years | 169 (44.6%) | $70,208 |
| 45 to 64 Years | 121 (31.9%) | $0 |
| 65+ Years | 39 (10.3%) | $0 |
| Total | 379 (100.0%) | $62,888 |
Poverty in Hinesburg
Income Below Poverty by Sex and Age in Hinesburg
With 0.6% poverty level for males and 12.3% for females among the residents of Hinesburg, 18 to 24 year old males and 55 to 64 year old females are the most vulnerable to poverty, with 1 males (100.0%) and 55 females (67.1%) in their respective age groups living below the poverty level.
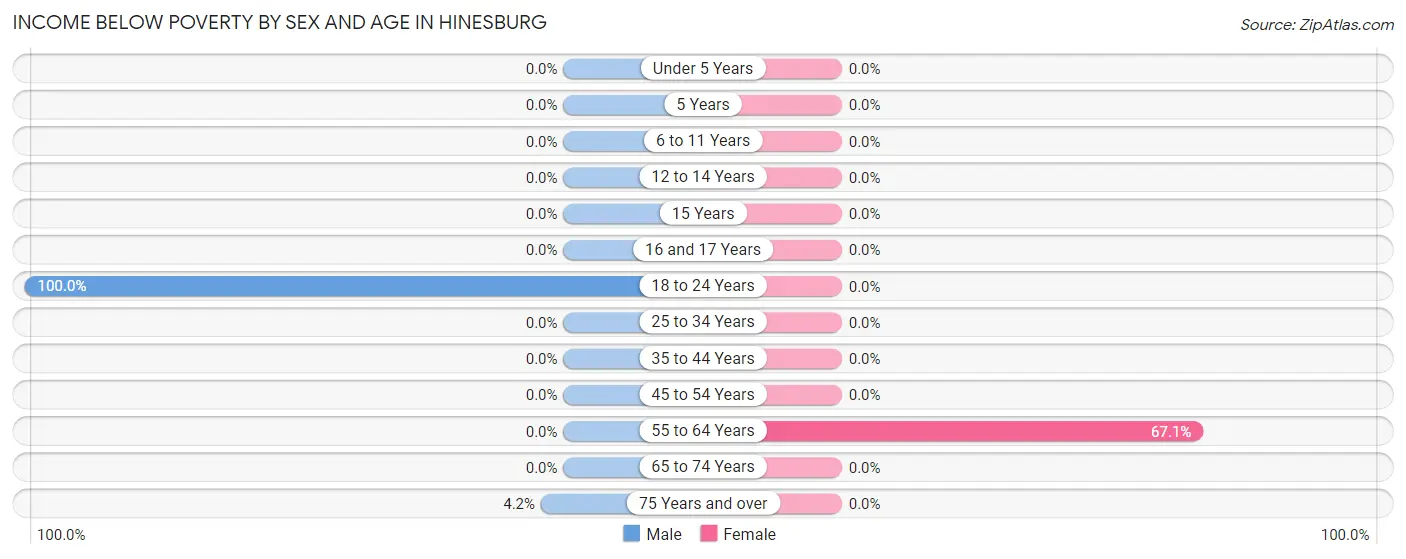
| Age Bracket | Male | Female |
| Under 5 Years | 0 (0.0%) | 0 (0.0%) |
| 5 Years | 0 (0.0%) | 0 (0.0%) |
| 6 to 11 Years | 0 (0.0%) | 0 (0.0%) |
| 12 to 14 Years | 0 (0.0%) | 0 (0.0%) |
| 15 Years | 0 (0.0%) | 0 (0.0%) |
| 16 and 17 Years | 0 (0.0%) | 0 (0.0%) |
| 18 to 24 Years | 1 (100.0%) | 0 (0.0%) |
| 25 to 34 Years | 0 (0.0%) | 0 (0.0%) |
| 35 to 44 Years | 0 (0.0%) | 0 (0.0%) |
| 45 to 54 Years | 0 (0.0%) | 0 (0.0%) |
| 55 to 64 Years | 0 (0.0%) | 55 (67.1%) |
| 65 to 74 Years | 0 (0.0%) | 0 (0.0%) |
| 75 Years and over | 1 (4.2%) | 0 (0.0%) |
| Total | 2 (0.6%) | 55 (12.3%) |
Income Above Poverty by Sex and Age in Hinesburg
According to the poverty statistics in Hinesburg, males aged under 5 years and females aged 5 years are the age groups that are most secure financially, with 100.0% of males and 100.0% of females in these age groups living above the poverty line.
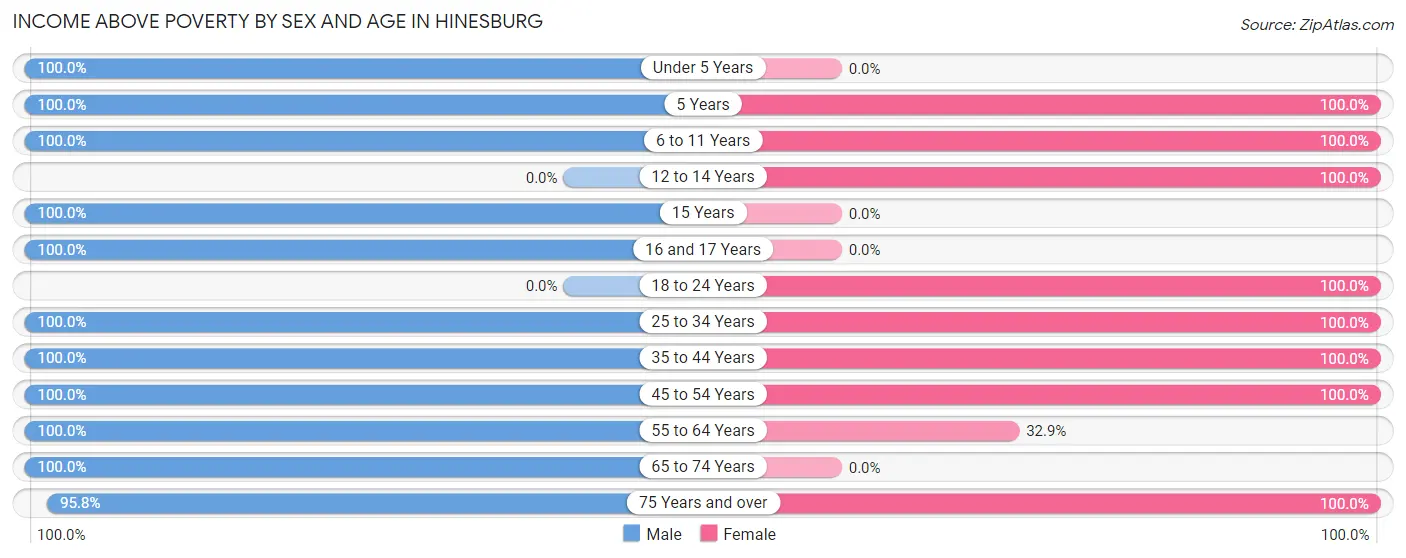
| Age Bracket | Male | Female |
| Under 5 Years | 70 (100.0%) | 0 (0.0%) |
| 5 Years | 24 (100.0%) | 9 (100.0%) |
| 6 to 11 Years | 33 (100.0%) | 25 (100.0%) |
| 12 to 14 Years | 0 (0.0%) | 19 (100.0%) |
| 15 Years | 16 (100.0%) | 0 (0.0%) |
| 16 and 17 Years | 21 (100.0%) | 0 (0.0%) |
| 18 to 24 Years | 0 (0.0%) | 50 (100.0%) |
| 25 to 34 Years | 54 (100.0%) | 70 (100.0%) |
| 35 to 44 Years | 56 (100.0%) | 131 (100.0%) |
| 45 to 54 Years | 17 (100.0%) | 36 (100.0%) |
| 55 to 64 Years | 12 (100.0%) | 27 (32.9%) |
| 65 to 74 Years | 16 (100.0%) | 0 (0.0%) |
| 75 Years and over | 23 (95.8%) | 24 (100.0%) |
| Total | 342 (99.4%) | 391 (87.7%) |
Income Below Poverty Among Married-Couple Families in Hinesburg
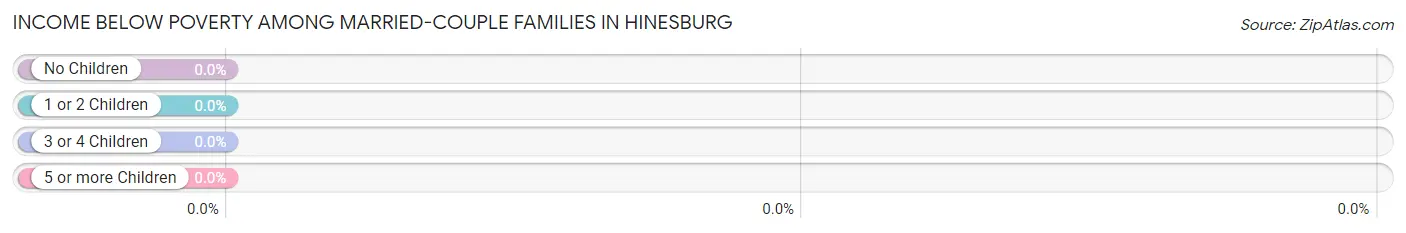
| Children | Above Poverty | Below Poverty |
| No Children | 24 (100.0%) | 0 (0.0%) |
| 1 or 2 Children | 40 (100.0%) | 0 (0.0%) |
| 3 or 4 Children | 53 (100.0%) | 0 (0.0%) |
| 5 or more Children | 0 (0.0%) | 0 (0.0%) |
| Total | 117 (100.0%) | 0 (0.0%) |
Income Below Poverty Among Single-Parent Households in Hinesburg
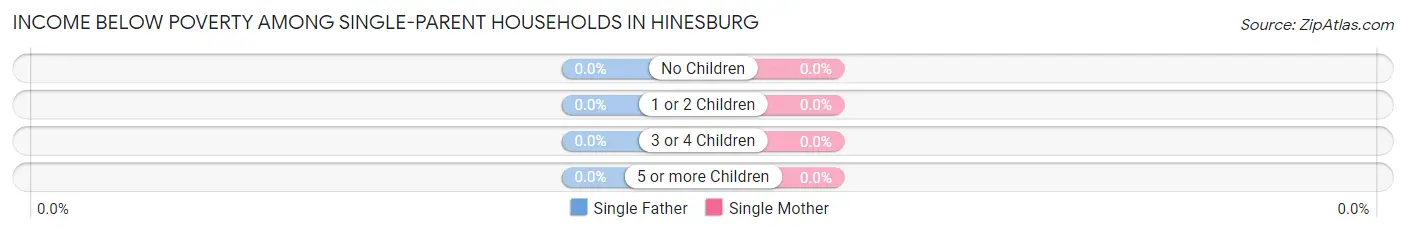
| Children | Single Father | Single Mother |
| No Children | 0 (0.0%) | 0 (0.0%) |
| 1 or 2 Children | 0 (0.0%) | 0 (0.0%) |
| 3 or 4 Children | 0 (0.0%) | 0 (0.0%) |
| 5 or more Children | 0 (0.0%) | 0 (0.0%) |
| Total | 0 (0.0%) | 0 (0.0%) |
Income Below Poverty Among Married-Couple vs Single-Parent Households in Hinesburg
| Children | Married-Couple Families | Single-Parent Households |
| No Children | 0 (0.0%) | 0 (0.0%) |
| 1 or 2 Children | 0 (0.0%) | 0 (0.0%) |
| 3 or 4 Children | 0 (0.0%) | 0 (0.0%) |
| 5 or more Children | 0 (0.0%) | 0 (0.0%) |
| Total | 0 (0.0%) | 0 (0.0%) |
Employment Characteristics in Hinesburg
Employment by Class of Employer in Hinesburg
Among the 440 employed individuals in Hinesburg, private company employees (244 | 55.4%), not-for-profit organizations (104 | 23.6%), and self-employed (not incorporated) (71 | 16.1%) make up the most common classes of employment.
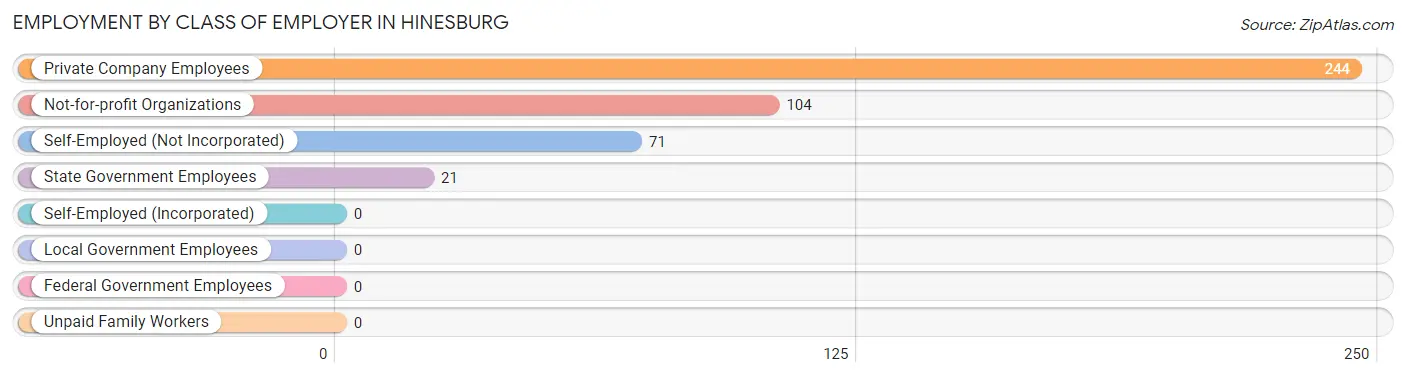
| Employer Class | # Employees | % Employees |
| Private Company Employees | 244 | 55.4% |
| Self-Employed (Incorporated) | 0 | 0.0% |
| Self-Employed (Not Incorporated) | 71 | 16.1% |
| Not-for-profit Organizations | 104 | 23.6% |
| Local Government Employees | 0 | 0.0% |
| State Government Employees | 21 | 4.8% |
| Federal Government Employees | 0 | 0.0% |
| Unpaid Family Workers | 0 | 0.0% |
| Total | 440 | 100.0% |
Employment Status by Age in Hinesburg
According to the labor force statistics for Hinesburg, out of the total population over 16 years of age (594), 86.9% or 516 individuals are in the labor force, with 4.1% or 21 of them unemployed. The age group with the highest labor force participation rate is 16 to 19 years, with 100.0% or 21 individuals in the labor force. Within the labor force, the 16 to 19 years age range has the highest percentage of unemployed individuals, with 100.0% or 21 of them being unemployed.
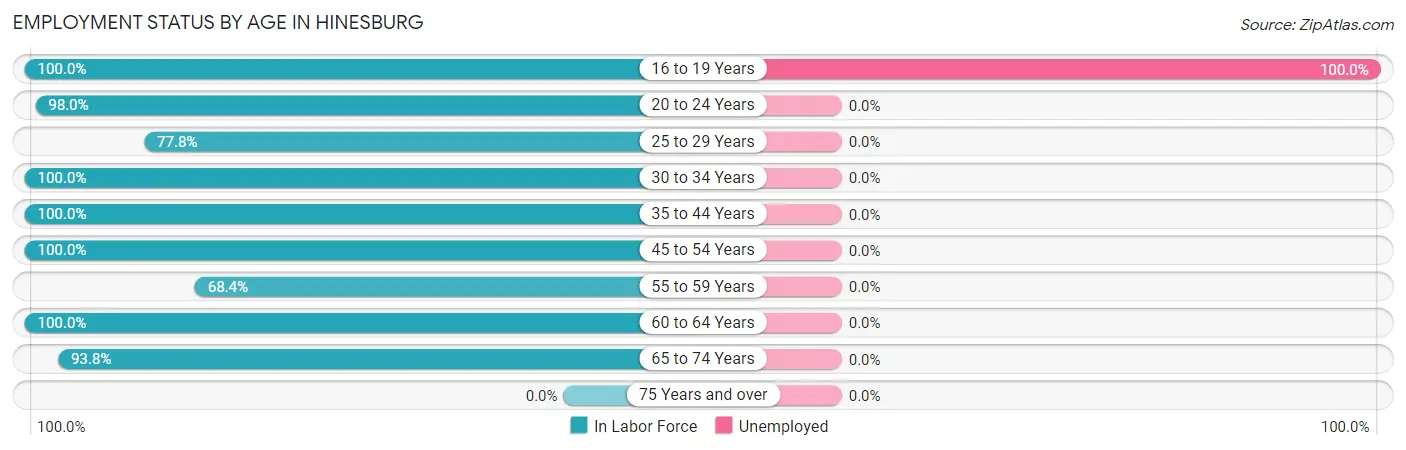
| Age Bracket | In Labor Force | Unemployed |
| 16 to 19 Years | 21 (100.0%) | 21 (100.0%) |
| 20 to 24 Years | 50 (98.0%) | 0 (0.0%) |
| 25 to 29 Years | 56 (77.8%) | 0 (0.0%) |
| 30 to 34 Years | 52 (100.0%) | 0 (0.0%) |
| 35 to 44 Years | 187 (100.0%) | 0 (0.0%) |
| 45 to 54 Years | 53 (100.0%) | 0 (0.0%) |
| 55 to 59 Years | 26 (68.4%) | 0 (0.0%) |
| 60 to 64 Years | 56 (100.0%) | 0 (0.0%) |
| 65 to 74 Years | 15 (93.8%) | 0 (0.0%) |
| 75 Years and over | 0 (0.0%) | 0 (0.0%) |
| Total | 516 (86.9%) | 21 (4.1%) |
Employment Status by Educational Attainment in Hinesburg
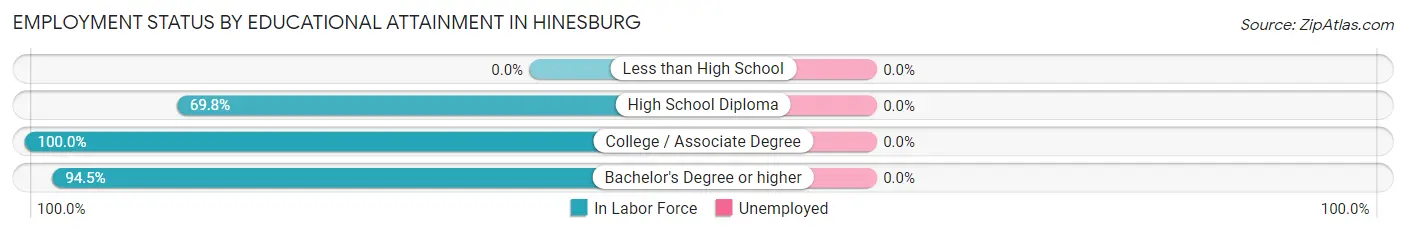
| Educational Attainment | In Labor Force | Unemployed |
| Less than High School | 0 (0.0%) | 0 (0.0%) |
| High School Diploma | 37 (69.8%) | 0 (0.0%) |
| College / Associate Degree | 187 (100.0%) | 0 (0.0%) |
| Bachelor's Degree or higher | 206 (94.5%) | 0 (0.0%) |
| Total | 430 (93.9%) | 0 (0.0%) |
Employment Occupations by Sex in Hinesburg
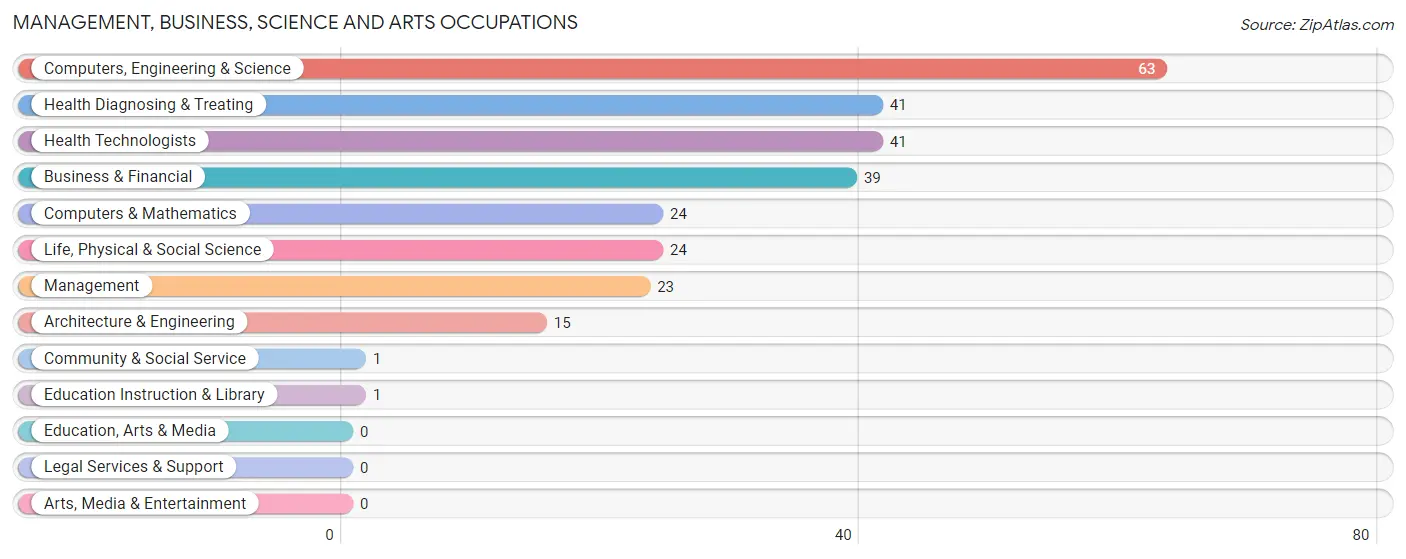
Management, Business, Science and Arts Occupations
The most common Management, Business, Science and Arts occupations in Hinesburg are Computers, Engineering & Science (63 | 12.7%), Health Diagnosing & Treating (41 | 8.3%), Health Technologists (41 | 8.3%), Business & Financial (39 | 7.9%), and Computers & Mathematics (24 | 4.9%).
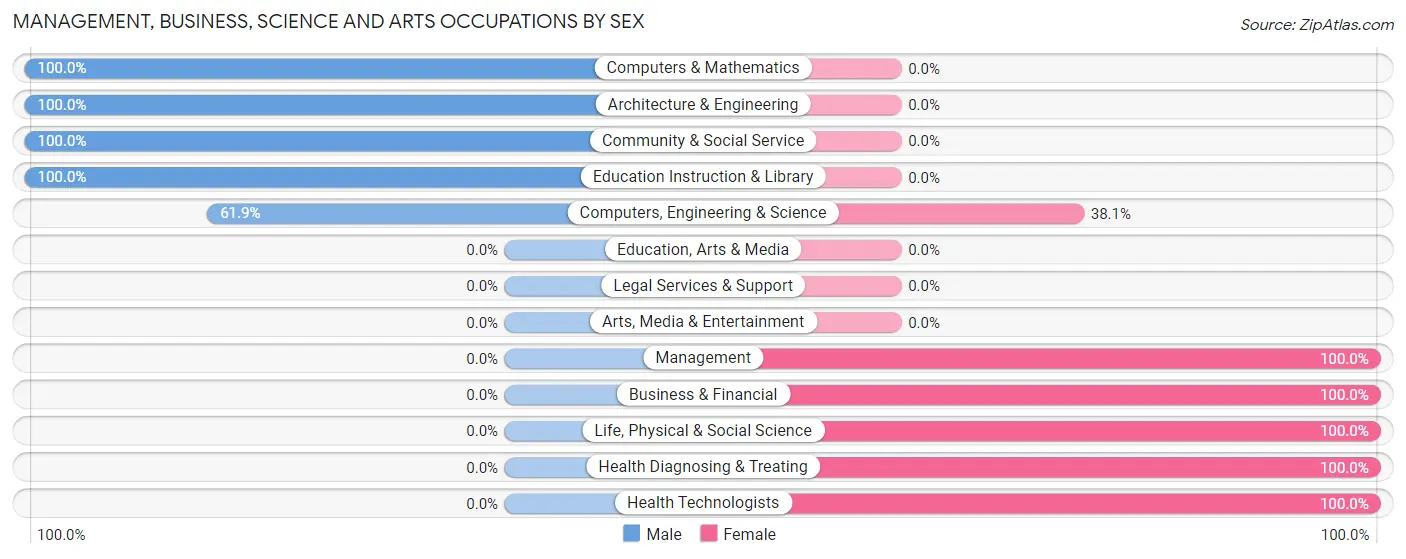
Management, Business, Science and Arts Occupations by Sex
Within the Management, Business, Science and Arts occupations in Hinesburg, the most male-oriented occupations are Computers & Mathematics (100.0%), Architecture & Engineering (100.0%), and Community & Social Service (100.0%), while the most female-oriented occupations are Management (100.0%), Business & Financial (100.0%), and Life, Physical & Social Science (100.0%).
| Occupation | Male | Female |
| Management | 0 (0.0%) | 23 (100.0%) |
| Business & Financial | 0 (0.0%) | 39 (100.0%) |
| Computers, Engineering & Science | 39 (61.9%) | 24 (38.1%) |
| Computers & Mathematics | 24 (100.0%) | 0 (0.0%) |
| Architecture & Engineering | 15 (100.0%) | 0 (0.0%) |
| Life, Physical & Social Science | 0 (0.0%) | 24 (100.0%) |
| Community & Social Service | 1 (100.0%) | 0 (0.0%) |
| Education, Arts & Media | 0 (0.0%) | 0 (0.0%) |
| Legal Services & Support | 0 (0.0%) | 0 (0.0%) |
| Education Instruction & Library | 1 (100.0%) | 0 (0.0%) |
| Arts, Media & Entertainment | 0 (0.0%) | 0 (0.0%) |
| Health Diagnosing & Treating | 0 (0.0%) | 41 (100.0%) |
| Health Technologists | 0 (0.0%) | 41 (100.0%) |
| Total (Category) | 40 (23.9%) | 127 (76.0%) |
| Total (Overall) | 154 (31.1%) | 341 (68.9%) |
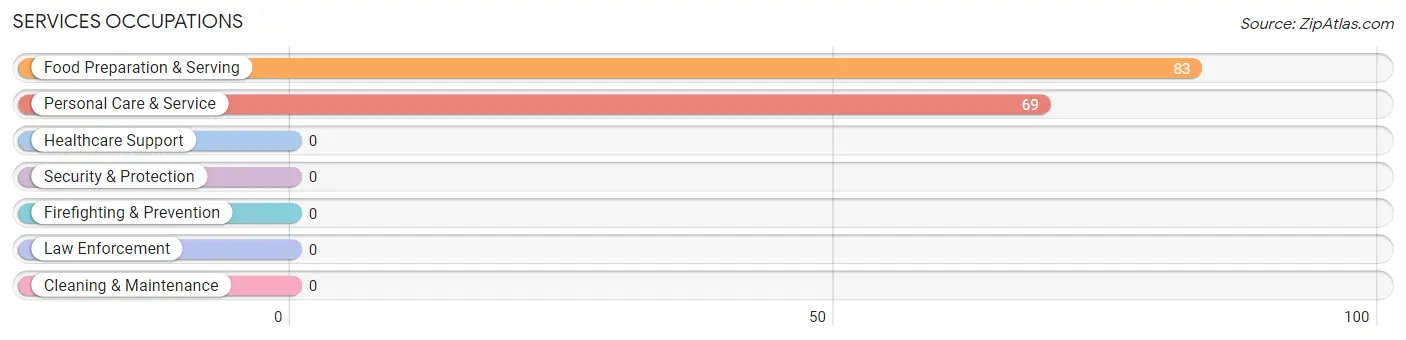
Services Occupations
The most common Services occupations in Hinesburg are Food Preparation & Serving (83 | 16.8%), and Personal Care & Service (69 | 13.9%).
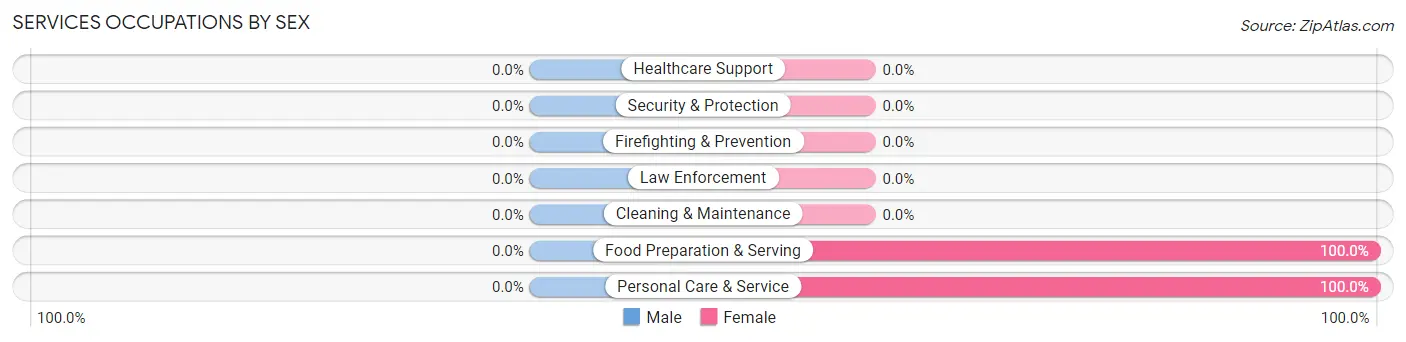
Services Occupations by Sex
| Occupation | Male | Female |
| Healthcare Support | 0 (0.0%) | 0 (0.0%) |
| Security & Protection | 0 (0.0%) | 0 (0.0%) |
| Firefighting & Prevention | 0 (0.0%) | 0 (0.0%) |
| Law Enforcement | 0 (0.0%) | 0 (0.0%) |
| Food Preparation & Serving | 0 (0.0%) | 83 (100.0%) |
| Cleaning & Maintenance | 0 (0.0%) | 0 (0.0%) |
| Personal Care & Service | 0 (0.0%) | 69 (100.0%) |
| Total (Category) | 0 (0.0%) | 152 (100.0%) |
| Total (Overall) | 154 (31.1%) | 341 (68.9%) |
Sales and Office Occupations
The most common Sales and Office occupations in Hinesburg are Office & Administration (48 | 9.7%), and Sales & Related (8 | 1.6%).
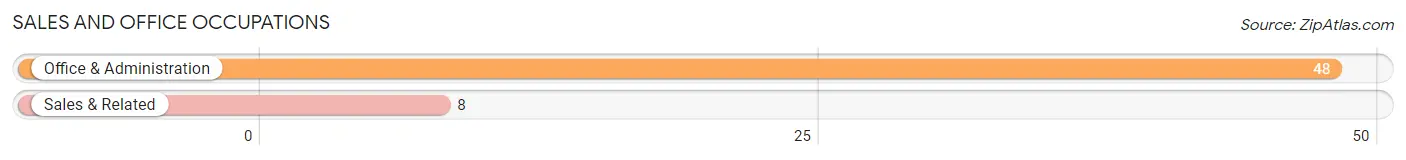
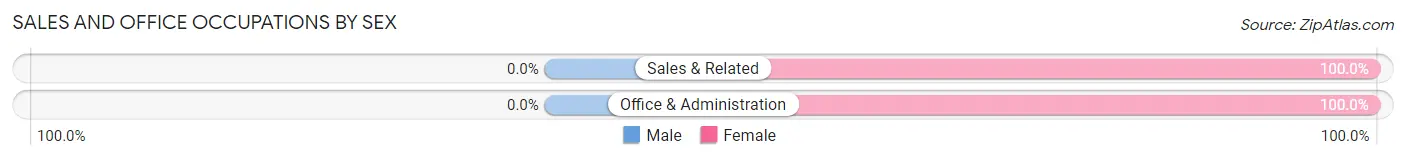
Sales and Office Occupations by Sex
| Occupation | Male | Female |
| Sales & Related | 0 (0.0%) | 8 (100.0%) |
| Office & Administration | 0 (0.0%) | 48 (100.0%) |
| Total (Category) | 0 (0.0%) | 56 (100.0%) |
| Total (Overall) | 154 (31.1%) | 341 (68.9%) |
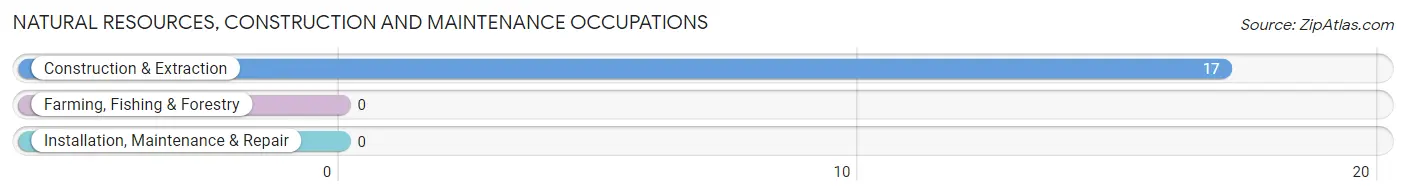
Natural Resources, Construction and Maintenance Occupations
The most common Natural Resources, Construction and Maintenance occupations in Hinesburg are , and Construction & Extraction (17 | 3.4%).
Natural Resources, Construction and Maintenance Occupations by Sex
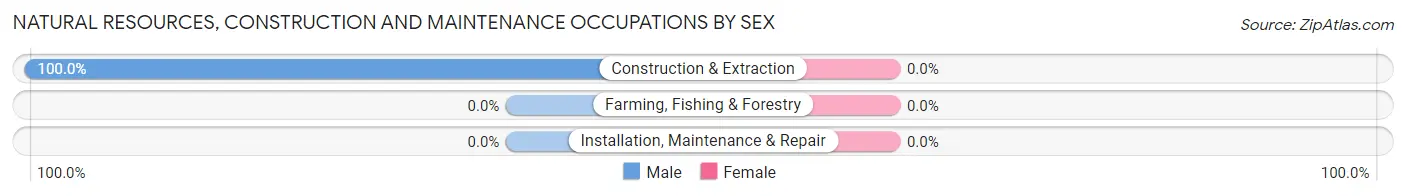
| Occupation | Male | Female |
| Farming, Fishing & Forestry | 0 (0.0%) | 0 (0.0%) |
| Construction & Extraction | 17 (100.0%) | 0 (0.0%) |
| Installation, Maintenance & Repair | 0 (0.0%) | 0 (0.0%) |
| Total (Category) | 17 (100.0%) | 0 (0.0%) |
| Total (Overall) | 154 (31.1%) | 341 (68.9%) |
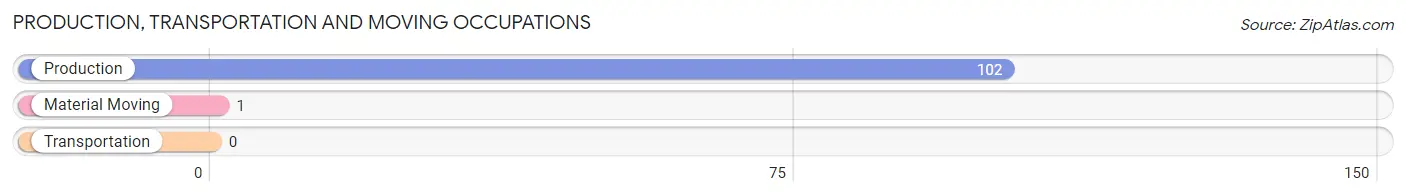
Production, Transportation and Moving Occupations
The most common Production, Transportation and Moving occupations in Hinesburg are Production (102 | 20.6%), and Material Moving (1 | 0.2%).
Production, Transportation and Moving Occupations by Sex
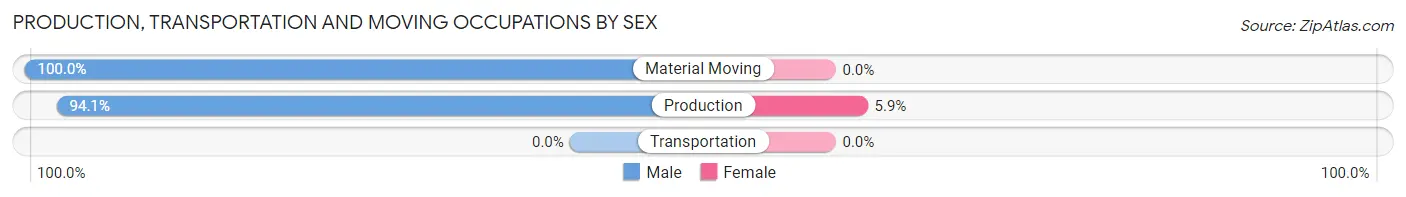
| Occupation | Male | Female |
| Production | 96 (94.1%) | 6 (5.9%) |
| Transportation | 0 (0.0%) | 0 (0.0%) |
| Material Moving | 1 (100.0%) | 0 (0.0%) |
| Total (Category) | 97 (94.2%) | 6 (5.8%) |
| Total (Overall) | 154 (31.1%) | 341 (68.9%) |
Employment Industries by Sex in Hinesburg
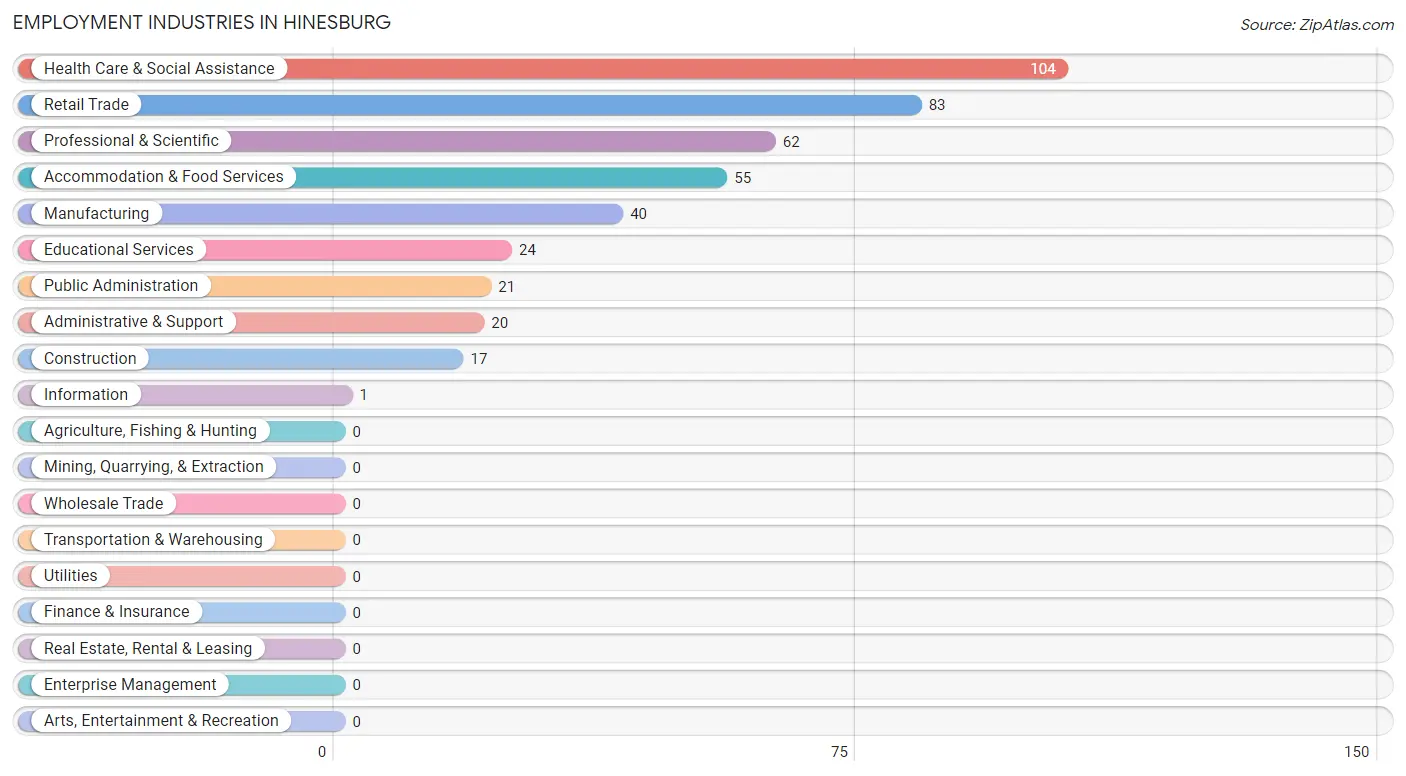
Employment Industries in Hinesburg
The major employment industries in Hinesburg include Health Care & Social Assistance (104 | 21.0%), Retail Trade (83 | 16.8%), Professional & Scientific (62 | 12.5%), Accommodation & Food Services (55 | 11.1%), and Manufacturing (40 | 8.1%).
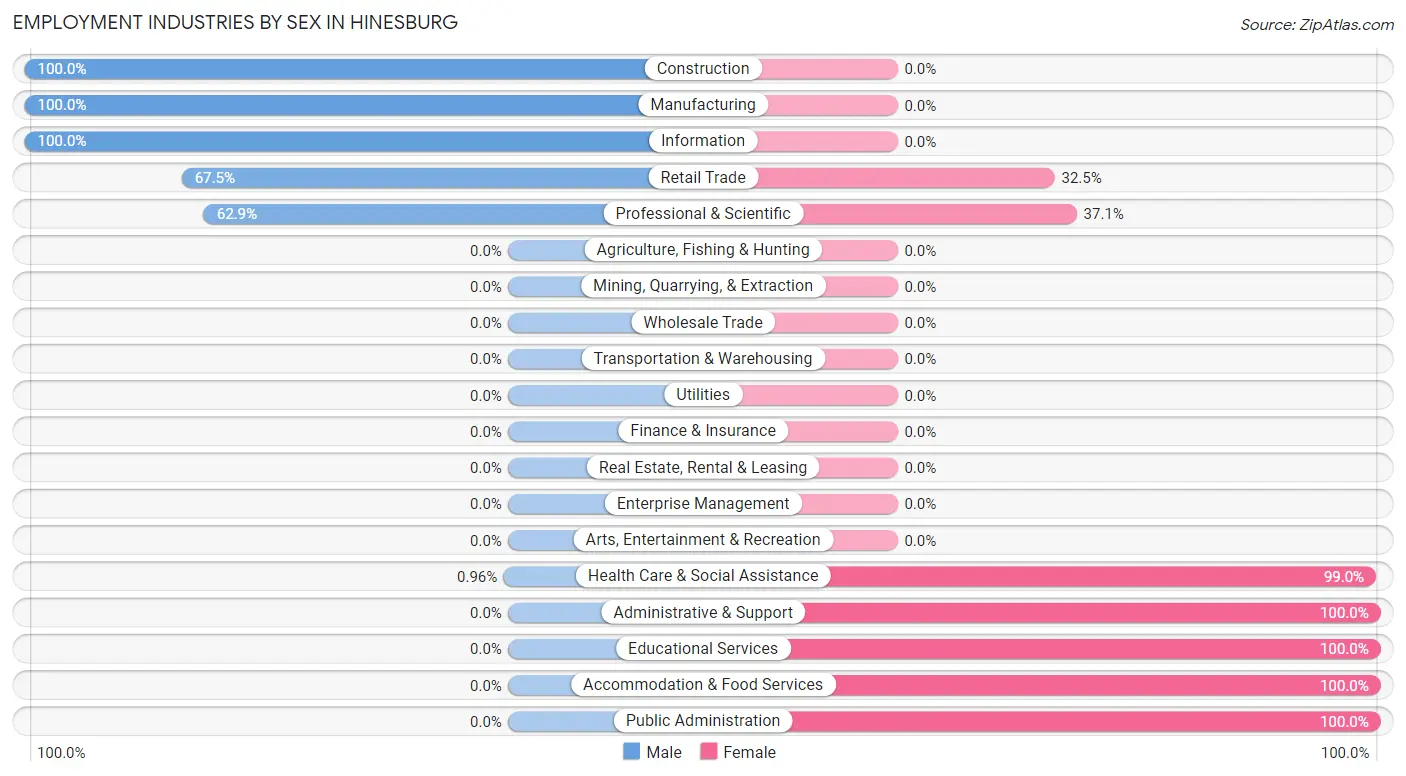
Employment Industries by Sex in Hinesburg
The Hinesburg industries that see more men than women are Construction (100.0%), Manufacturing (100.0%), and Information (100.0%), whereas the industries that tend to have a higher number of women are Administrative & Support (100.0%), Educational Services (100.0%), and Accommodation & Food Services (100.0%).
| Industry | Male | Female |
| Agriculture, Fishing & Hunting | 0 (0.0%) | 0 (0.0%) |
| Mining, Quarrying, & Extraction | 0 (0.0%) | 0 (0.0%) |
| Construction | 17 (100.0%) | 0 (0.0%) |
| Manufacturing | 40 (100.0%) | 0 (0.0%) |
| Wholesale Trade | 0 (0.0%) | 0 (0.0%) |
| Retail Trade | 56 (67.5%) | 27 (32.5%) |
| Transportation & Warehousing | 0 (0.0%) | 0 (0.0%) |
| Utilities | 0 (0.0%) | 0 (0.0%) |
| Information | 1 (100.0%) | 0 (0.0%) |
| Finance & Insurance | 0 (0.0%) | 0 (0.0%) |
| Real Estate, Rental & Leasing | 0 (0.0%) | 0 (0.0%) |
| Professional & Scientific | 39 (62.9%) | 23 (37.1%) |
| Enterprise Management | 0 (0.0%) | 0 (0.0%) |
| Administrative & Support | 0 (0.0%) | 20 (100.0%) |
| Educational Services | 0 (0.0%) | 24 (100.0%) |
| Health Care & Social Assistance | 1 (1.0%) | 103 (99.0%) |
| Arts, Entertainment & Recreation | 0 (0.0%) | 0 (0.0%) |
| Accommodation & Food Services | 0 (0.0%) | 55 (100.0%) |
| Public Administration | 0 (0.0%) | 21 (100.0%) |
| Total | 154 (31.1%) | 341 (68.9%) |
Education in Hinesburg
School Enrollment in Hinesburg
The most common levels of schooling among the 203 students in Hinesburg are middle school (54 | 26.6%), nursery / preschool (41 | 20.2%), and high school (37 | 18.2%).
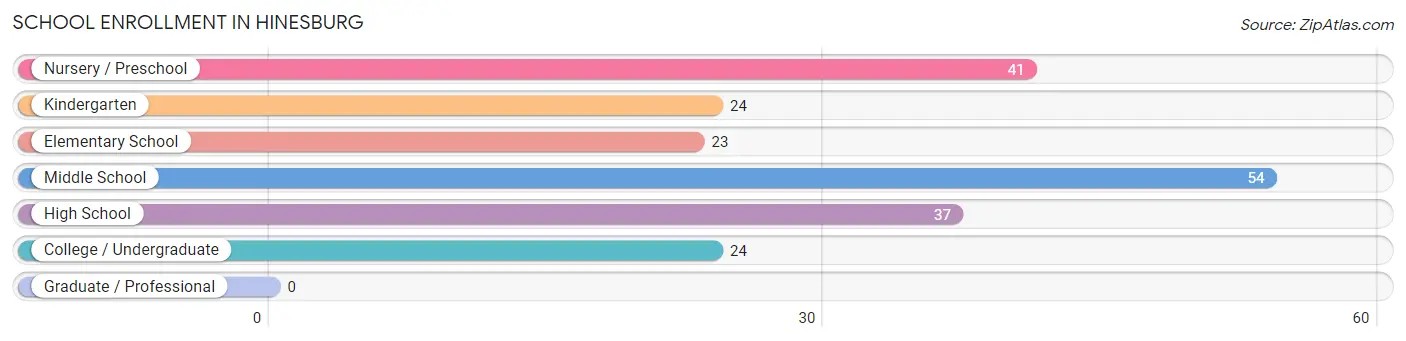
| School Level | # Students | % Students |
| Nursery / Preschool | 41 | 20.2% |
| Kindergarten | 24 | 11.8% |
| Elementary School | 23 | 11.3% |
| Middle School | 54 | 26.6% |
| High School | 37 | 18.2% |
| College / Undergraduate | 24 | 11.8% |
| Graduate / Professional | 0 | 0.0% |
| Total | 203 | 100.0% |
School Enrollment by Age by Funding Source in Hinesburg
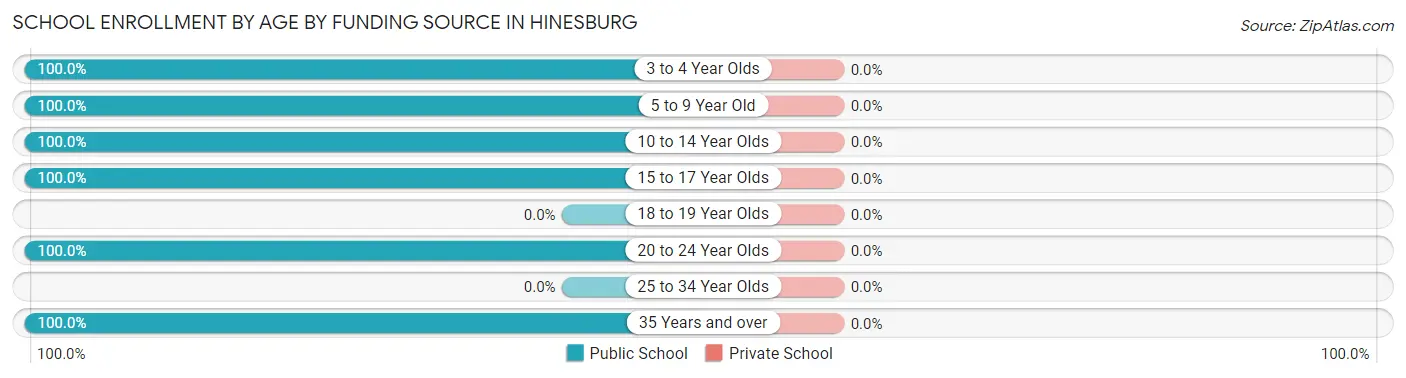
| Age Bracket | Public School | Private School |
| 3 to 4 Year Olds | 32 (100.0%) | 0 (0.0%) |
| 5 to 9 Year Old | 48 (100.0%) | 0 (0.0%) |
| 10 to 14 Year Olds | 62 (100.0%) | 0 (0.0%) |
| 15 to 17 Year Olds | 37 (100.0%) | 0 (0.0%) |
| 18 to 19 Year Olds | 0 (0.0%) | 0 (0.0%) |
| 20 to 24 Year Olds | 1 (100.0%) | 0 (0.0%) |
| 25 to 34 Year Olds | 0 (0.0%) | 0 (0.0%) |
| 35 Years and over | 23 (100.0%) | 0 (0.0%) |
| Total | 203 (100.0%) | 0 (0.0%) |
Educational Attainment by Field of Study in Hinesburg
Business (50 | 21.4%), arts & humanities (47 | 20.1%), bio, nature & agricultural (24 | 10.3%), physical & health sciences (24 | 10.3%), and social sciences (23 | 9.8%) are the most common fields of study among 234 individuals in Hinesburg who have obtained a bachelor's degree or higher.
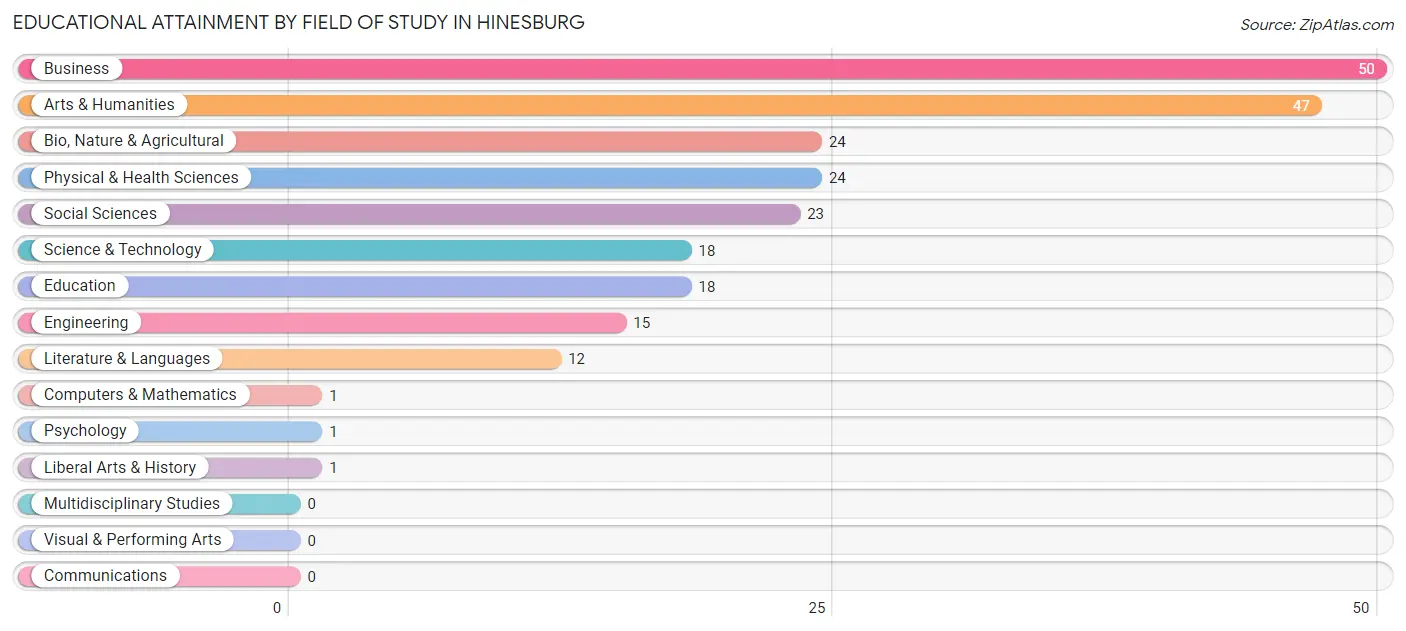
| Field of Study | # Graduates | % Graduates |
| Computers & Mathematics | 1 | 0.4% |
| Bio, Nature & Agricultural | 24 | 10.3% |
| Physical & Health Sciences | 24 | 10.3% |
| Psychology | 1 | 0.4% |
| Social Sciences | 23 | 9.8% |
| Engineering | 15 | 6.4% |
| Multidisciplinary Studies | 0 | 0.0% |
| Science & Technology | 18 | 7.7% |
| Business | 50 | 21.4% |
| Education | 18 | 7.7% |
| Literature & Languages | 12 | 5.1% |
| Liberal Arts & History | 1 | 0.4% |
| Visual & Performing Arts | 0 | 0.0% |
| Communications | 0 | 0.0% |
| Arts & Humanities | 47 | 20.1% |
| Total | 234 | 100.0% |
Transportation & Commute in Hinesburg
Vehicle Availability by Sex in Hinesburg
The most prevalent vehicle ownership categories in Hinesburg are males with 2 vehicles (112, accounting for 73.7%) and females with 2 vehicles (201, making up 39.2%).
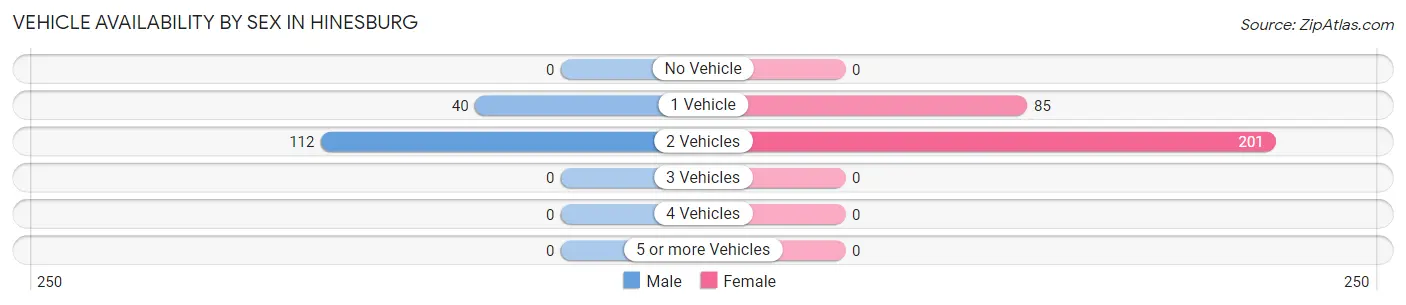
| Vehicles Available | Male | Female |
| No Vehicle | 0 (0.0%) | 0 (0.0%) |
| 1 Vehicle | 40 (26.3%) | 85 (29.7%) |
| 2 Vehicles | 112 (73.7%) | 201 (70.3%) |
| 3 Vehicles | 0 (0.0%) | 0 (0.0%) |
| 4 Vehicles | 0 (0.0%) | 0 (0.0%) |
| 5 or more Vehicles | 0 (0.0%) | 0 (0.0%) |
| Total | 152 (100.0%) | 286 (100.0%) |
Commute Time in Hinesburg
The most frequently occuring commute durations in Hinesburg are 20 to 24 minutes (151 commuters, 34.3%), 35 to 39 minutes (95 commuters, 21.6%), and 25 to 29 minutes (76 commuters, 17.3%).
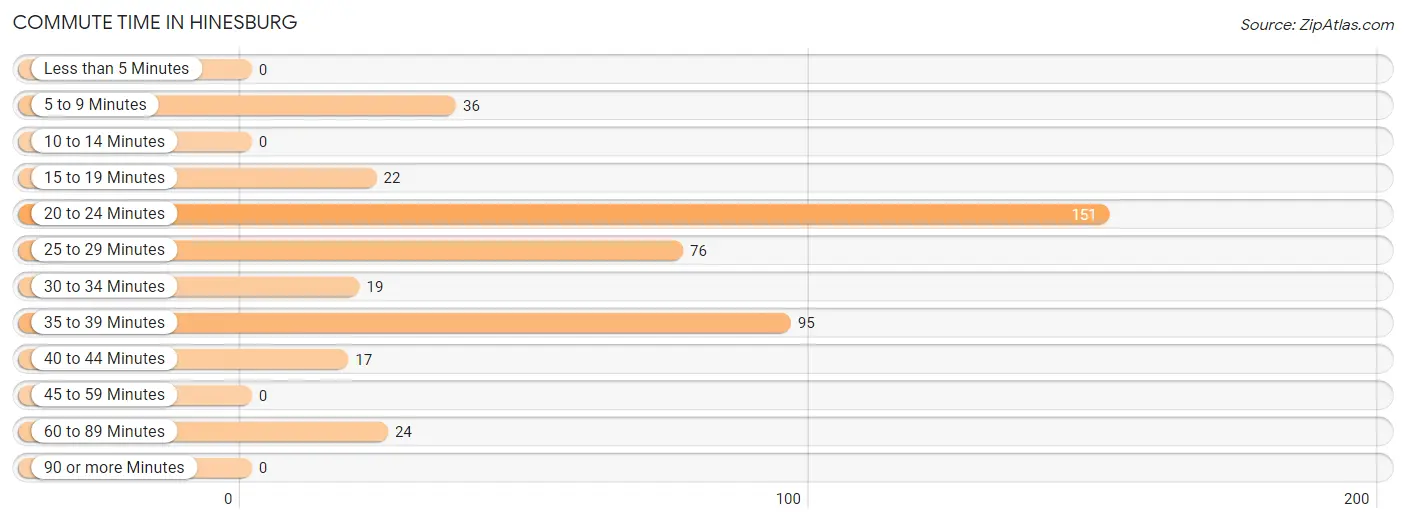
| Commute Time | # Commuters | % Commuters |
| Less than 5 Minutes | 0 | 0.0% |
| 5 to 9 Minutes | 36 | 8.2% |
| 10 to 14 Minutes | 0 | 0.0% |
| 15 to 19 Minutes | 22 | 5.0% |
| 20 to 24 Minutes | 151 | 34.3% |
| 25 to 29 Minutes | 76 | 17.3% |
| 30 to 34 Minutes | 19 | 4.3% |
| 35 to 39 Minutes | 95 | 21.6% |
| 40 to 44 Minutes | 17 | 3.9% |
| 45 to 59 Minutes | 0 | 0.0% |
| 60 to 89 Minutes | 24 | 5.4% |
| 90 or more Minutes | 0 | 0.0% |
Commute Time by Sex in Hinesburg
The most common commute times in Hinesburg are 20 to 24 minutes (57 commuters, 37.0%) for males and 20 to 24 minutes (94 commuters, 32.9%) for females.
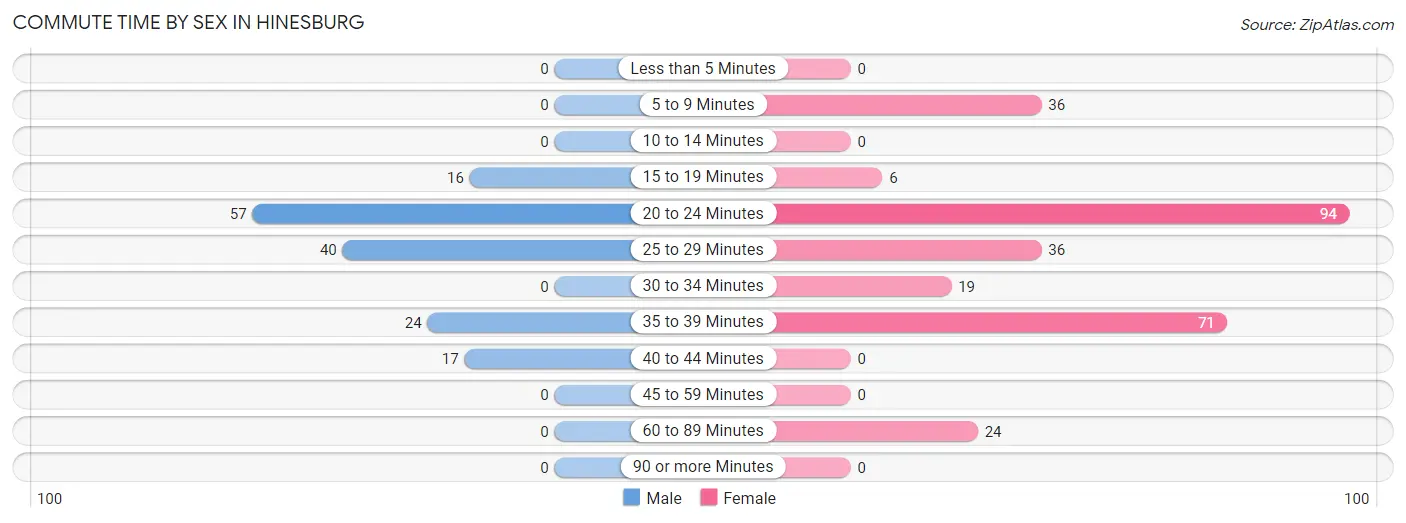
| Commute Time | Male | Female |
| Less than 5 Minutes | 0 (0.0%) | 0 (0.0%) |
| 5 to 9 Minutes | 0 (0.0%) | 36 (12.6%) |
| 10 to 14 Minutes | 0 (0.0%) | 0 (0.0%) |
| 15 to 19 Minutes | 16 (10.4%) | 6 (2.1%) |
| 20 to 24 Minutes | 57 (37.0%) | 94 (32.9%) |
| 25 to 29 Minutes | 40 (26.0%) | 36 (12.6%) |
| 30 to 34 Minutes | 0 (0.0%) | 19 (6.6%) |
| 35 to 39 Minutes | 24 (15.6%) | 71 (24.8%) |
| 40 to 44 Minutes | 17 (11.0%) | 0 (0.0%) |
| 45 to 59 Minutes | 0 (0.0%) | 0 (0.0%) |
| 60 to 89 Minutes | 0 (0.0%) | 24 (8.4%) |
| 90 or more Minutes | 0 (0.0%) | 0 (0.0%) |
Time of Departure to Work by Sex in Hinesburg
The most frequent times of departure to work in Hinesburg are 7:00 AM to 7:29 AM (56, 36.4%) for males and 5:30 AM to 5:59 AM (50, 17.5%) for females.
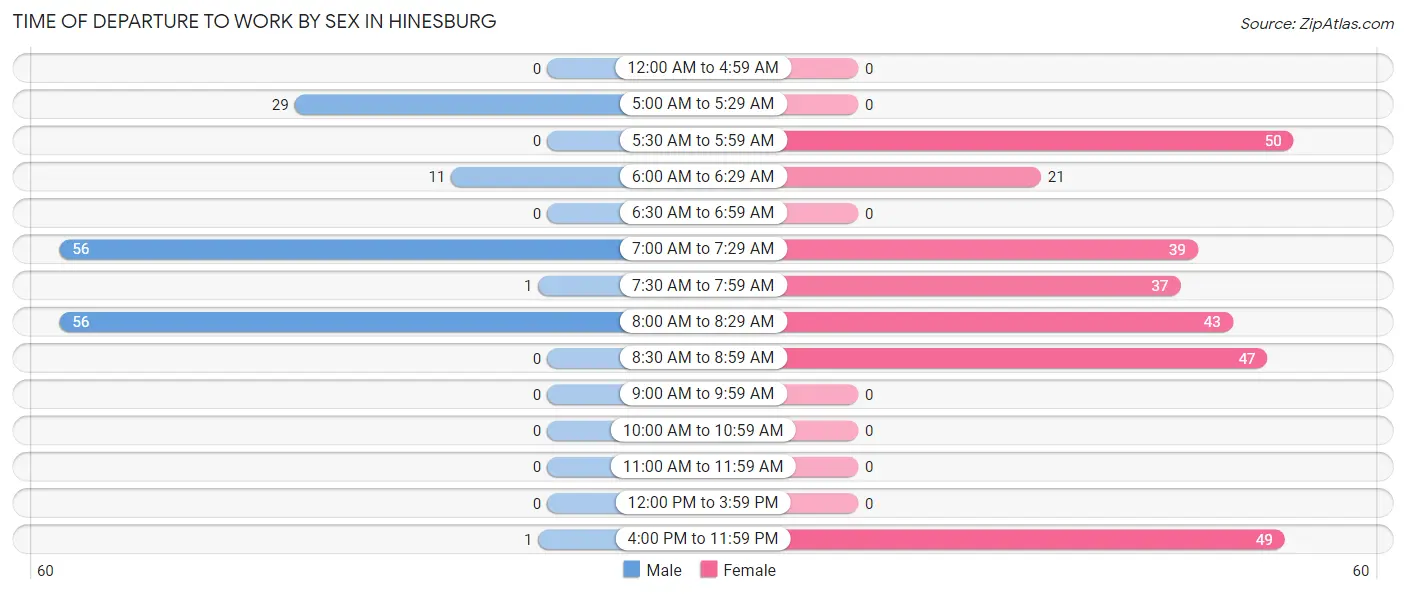
| Time of Departure | Male | Female |
| 12:00 AM to 4:59 AM | 0 (0.0%) | 0 (0.0%) |
| 5:00 AM to 5:29 AM | 29 (18.8%) | 0 (0.0%) |
| 5:30 AM to 5:59 AM | 0 (0.0%) | 50 (17.5%) |
| 6:00 AM to 6:29 AM | 11 (7.1%) | 21 (7.3%) |
| 6:30 AM to 6:59 AM | 0 (0.0%) | 0 (0.0%) |
| 7:00 AM to 7:29 AM | 56 (36.4%) | 39 (13.6%) |
| 7:30 AM to 7:59 AM | 1 (0.6%) | 37 (12.9%) |
| 8:00 AM to 8:29 AM | 56 (36.4%) | 43 (15.0%) |
| 8:30 AM to 8:59 AM | 0 (0.0%) | 47 (16.4%) |
| 9:00 AM to 9:59 AM | 0 (0.0%) | 0 (0.0%) |
| 10:00 AM to 10:59 AM | 0 (0.0%) | 0 (0.0%) |
| 11:00 AM to 11:59 AM | 0 (0.0%) | 0 (0.0%) |
| 12:00 PM to 3:59 PM | 0 (0.0%) | 0 (0.0%) |
| 4:00 PM to 11:59 PM | 1 (0.6%) | 49 (17.1%) |
| Total | 154 (100.0%) | 286 (100.0%) |
Housing Occupancy in Hinesburg
Occupancy by Ownership in Hinesburg
Of the total 379 dwellings in Hinesburg, owner-occupied units account for 134 (35.4%), while renter-occupied units make up 245 (64.6%).
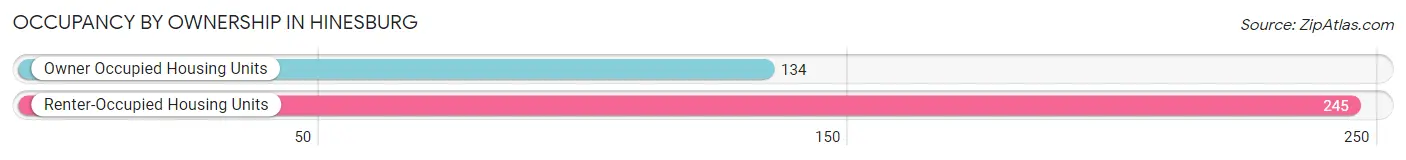
| Occupancy | # Housing Units | % Housing Units |
| Owner Occupied Housing Units | 134 | 35.4% |
| Renter-Occupied Housing Units | 245 | 64.6% |
| Total Occupied Housing Units | 379 | 100.0% |
Occupancy by Household Size in Hinesburg
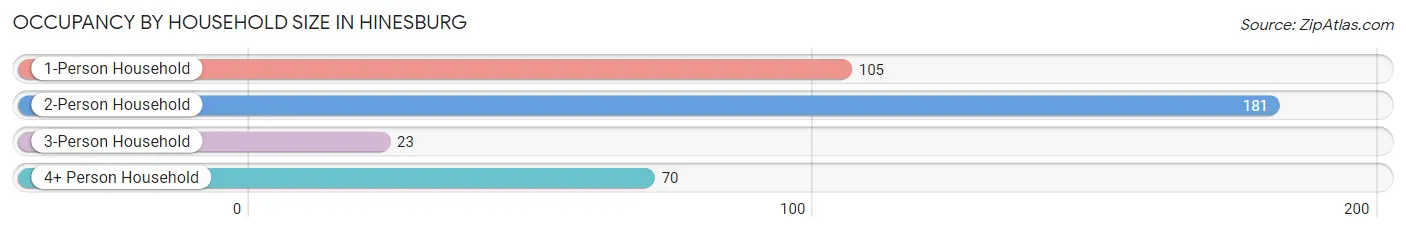
| Household Size | # Housing Units | % Housing Units |
| 1-Person Household | 105 | 27.7% |
| 2-Person Household | 181 | 47.8% |
| 3-Person Household | 23 | 6.1% |
| 4+ Person Household | 70 | 18.5% |
| Total Housing Units | 379 | 100.0% |
Occupancy by Ownership by Household Size in Hinesburg
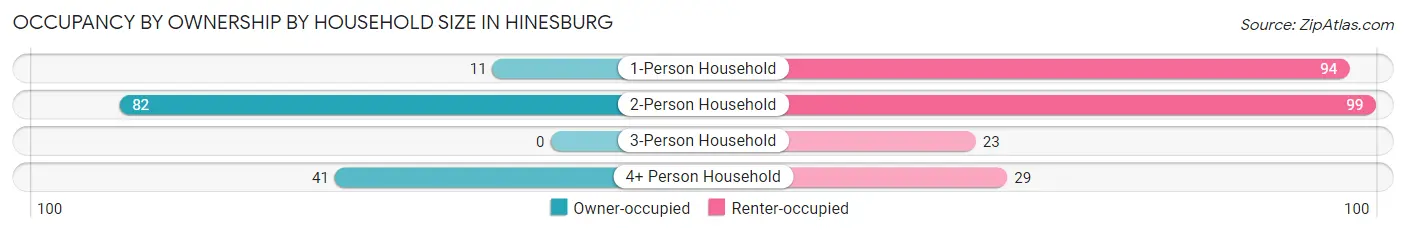
| Household Size | Owner-occupied | Renter-occupied |
| 1-Person Household | 11 (10.5%) | 94 (89.5%) |
| 2-Person Household | 82 (45.3%) | 99 (54.7%) |
| 3-Person Household | 0 (0.0%) | 23 (100.0%) |
| 4+ Person Household | 41 (58.6%) | 29 (41.4%) |
| Total Housing Units | 134 (35.4%) | 245 (64.6%) |
Occupancy by Educational Attainment in Hinesburg
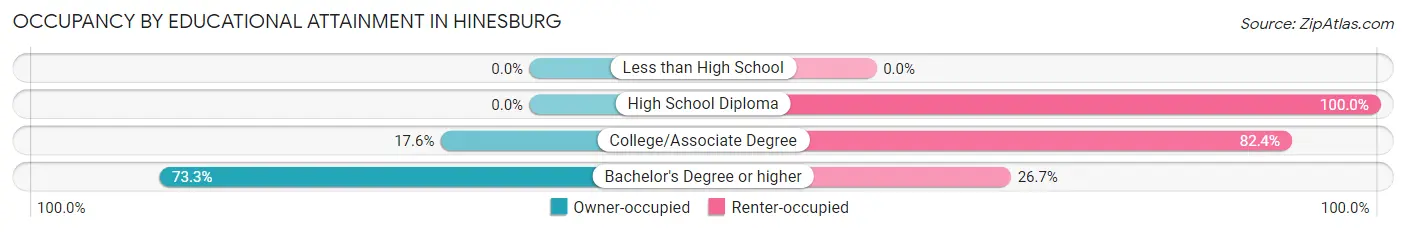
| Household Size | Owner-occupied | Renter-occupied |
| Less than High School | 0 (0.0%) | 0 (0.0%) |
| High School Diploma | 0 (0.0%) | 45 (100.0%) |
| College/Associate Degree | 35 (17.6%) | 164 (82.4%) |
| Bachelor's Degree or higher | 99 (73.3%) | 36 (26.7%) |
Occupancy by Age of Householder in Hinesburg
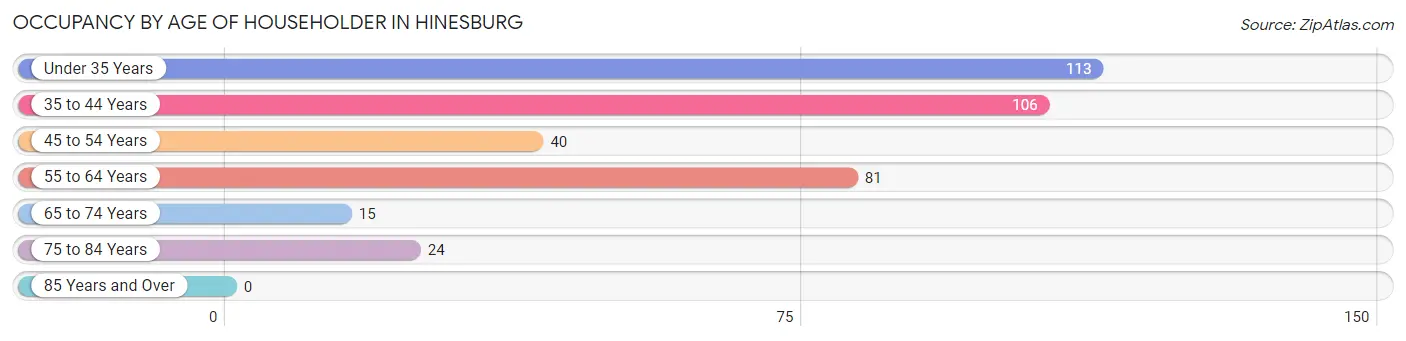
| Age Bracket | # Households | % Households |
| Under 35 Years | 113 | 29.8% |
| 35 to 44 Years | 106 | 28.0% |
| 45 to 54 Years | 40 | 10.5% |
| 55 to 64 Years | 81 | 21.4% |
| 65 to 74 Years | 15 | 4.0% |
| 75 to 84 Years | 24 | 6.3% |
| 85 Years and Over | 0 | 0.0% |
| Total | 379 | 100.0% |
Housing Finances in Hinesburg
Median Income by Occupancy in Hinesburg
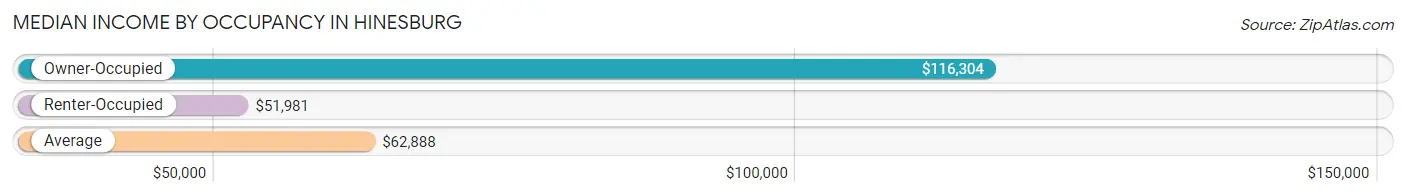
| Occupancy Type | # Households | Median Income |
| Owner-Occupied | 134 (35.4%) | $116,304 |
| Renter-Occupied | 245 (64.6%) | $51,981 |
| Average | 379 (100.0%) | $62,888 |
Occupancy by Householder Income Bracket in Hinesburg
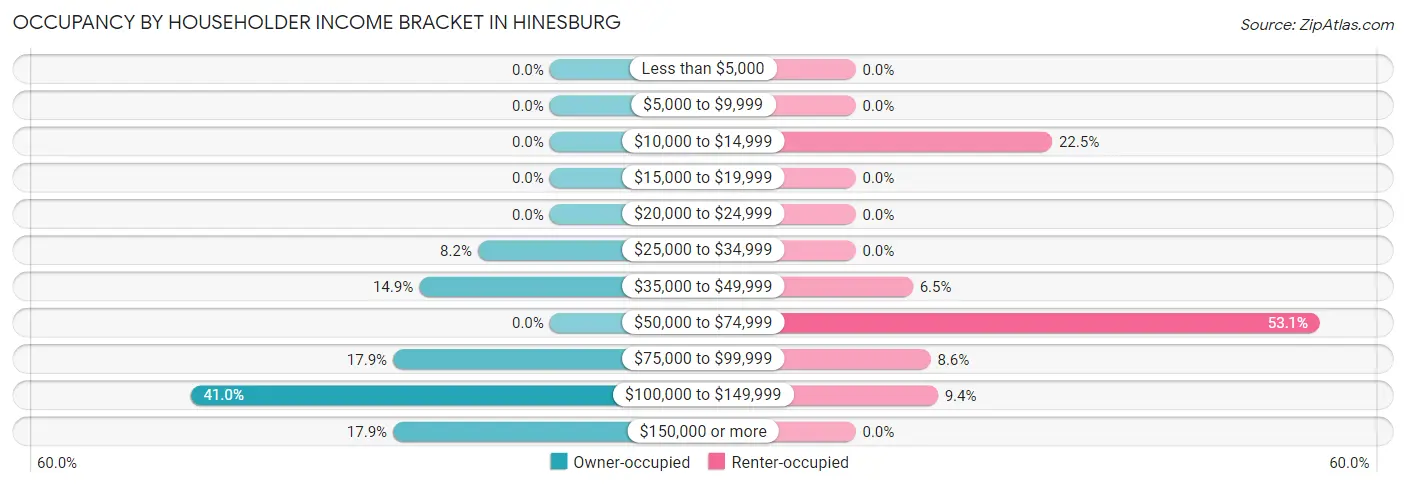
| Income Bracket | Owner-occupied | Renter-occupied |
| Less than $5,000 | 0 (0.0%) | 0 (0.0%) |
| $5,000 to $9,999 | 0 (0.0%) | 0 (0.0%) |
| $10,000 to $14,999 | 0 (0.0%) | 55 (22.5%) |
| $15,000 to $19,999 | 0 (0.0%) | 0 (0.0%) |
| $20,000 to $24,999 | 0 (0.0%) | 0 (0.0%) |
| $25,000 to $34,999 | 11 (8.2%) | 0 (0.0%) |
| $35,000 to $49,999 | 20 (14.9%) | 16 (6.5%) |
| $50,000 to $74,999 | 0 (0.0%) | 130 (53.1%) |
| $75,000 to $99,999 | 24 (17.9%) | 21 (8.6%) |
| $100,000 to $149,999 | 55 (41.0%) | 23 (9.4%) |
| $150,000 or more | 24 (17.9%) | 0 (0.0%) |
| Total | 134 (100.0%) | 245 (100.0%) |
Monthly Housing Cost Tiers in Hinesburg
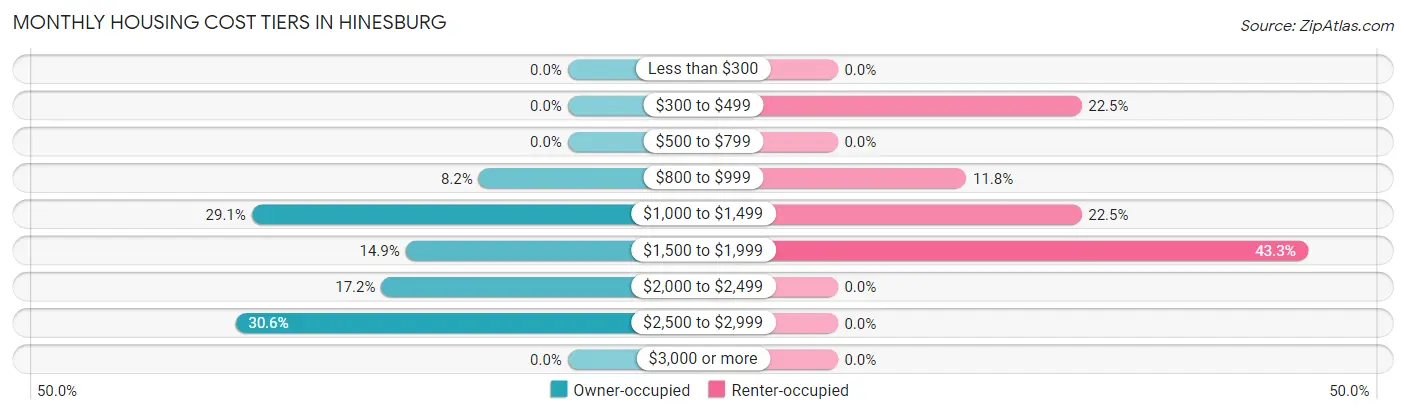
| Monthly Cost | Owner-occupied | Renter-occupied |
| Less than $300 | 0 (0.0%) | 0 (0.0%) |
| $300 to $499 | 0 (0.0%) | 55 (22.5%) |
| $500 to $799 | 0 (0.0%) | 0 (0.0%) |
| $800 to $999 | 11 (8.2%) | 29 (11.8%) |
| $1,000 to $1,499 | 39 (29.1%) | 55 (22.5%) |
| $1,500 to $1,999 | 20 (14.9%) | 106 (43.3%) |
| $2,000 to $2,499 | 23 (17.2%) | 0 (0.0%) |
| $2,500 to $2,999 | 41 (30.6%) | 0 (0.0%) |
| $3,000 or more | 0 (0.0%) | 0 (0.0%) |
| Total | 134 (100.0%) | 245 (100.0%) |
Physical Housing Characteristics in Hinesburg
Housing Structures in Hinesburg
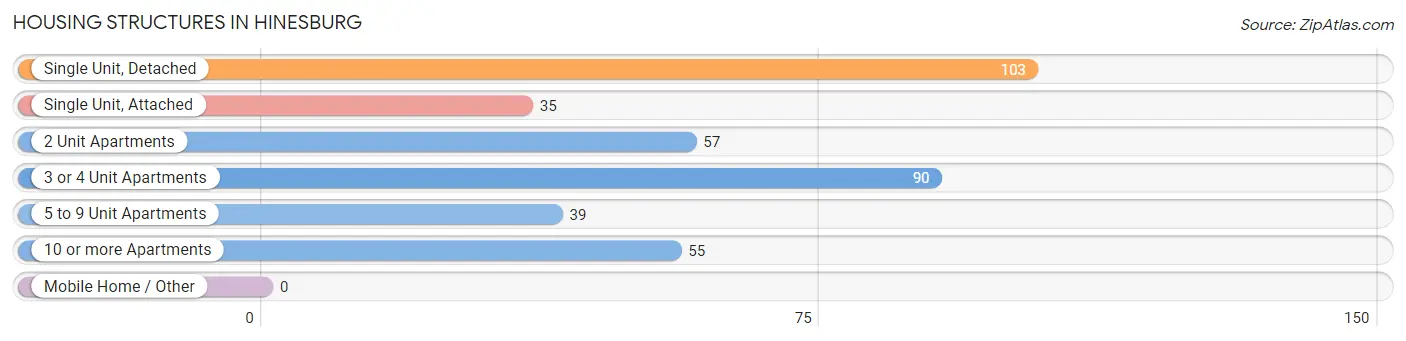
| Structure Type | # Housing Units | % Housing Units |
| Single Unit, Detached | 103 | 27.2% |
| Single Unit, Attached | 35 | 9.2% |
| 2 Unit Apartments | 57 | 15.0% |
| 3 or 4 Unit Apartments | 90 | 23.7% |
| 5 to 9 Unit Apartments | 39 | 10.3% |
| 10 or more Apartments | 55 | 14.5% |
| Mobile Home / Other | 0 | 0.0% |
| Total | 379 | 100.0% |
Housing Structures by Occupancy in Hinesburg
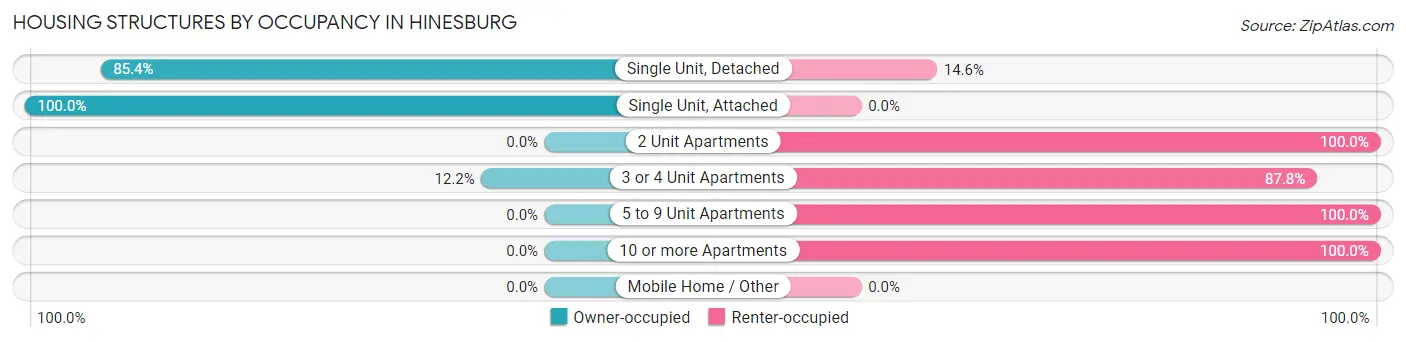
| Structure Type | Owner-occupied | Renter-occupied |
| Single Unit, Detached | 88 (85.4%) | 15 (14.6%) |
| Single Unit, Attached | 35 (100.0%) | 0 (0.0%) |
| 2 Unit Apartments | 0 (0.0%) | 57 (100.0%) |
| 3 or 4 Unit Apartments | 11 (12.2%) | 79 (87.8%) |
| 5 to 9 Unit Apartments | 0 (0.0%) | 39 (100.0%) |
| 10 or more Apartments | 0 (0.0%) | 55 (100.0%) |
| Mobile Home / Other | 0 (0.0%) | 0 (0.0%) |
| Total | 134 (35.4%) | 245 (64.6%) |
Housing Structures by Number of Rooms in Hinesburg
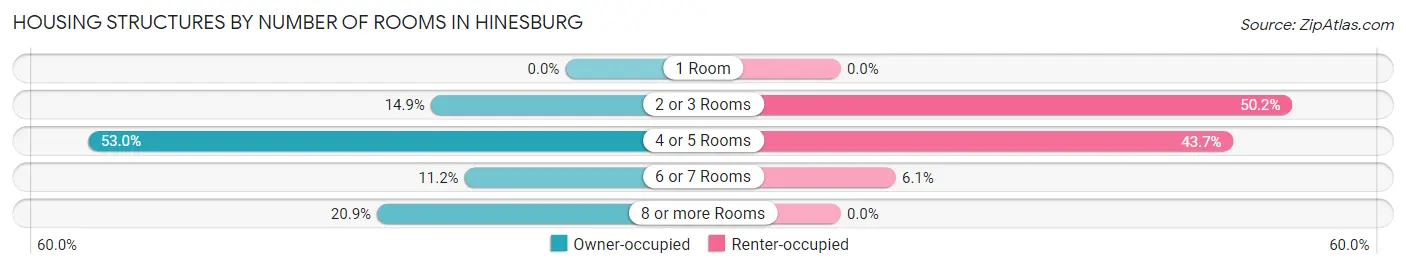
| Number of Rooms | Owner-occupied | Renter-occupied |
| 1 Room | 0 (0.0%) | 0 (0.0%) |
| 2 or 3 Rooms | 20 (14.9%) | 123 (50.2%) |
| 4 or 5 Rooms | 71 (53.0%) | 107 (43.7%) |
| 6 or 7 Rooms | 15 (11.2%) | 15 (6.1%) |
| 8 or more Rooms | 28 (20.9%) | 0 (0.0%) |
| Total | 134 (100.0%) | 245 (100.0%) |
Housing Structure by Heating Type in Hinesburg
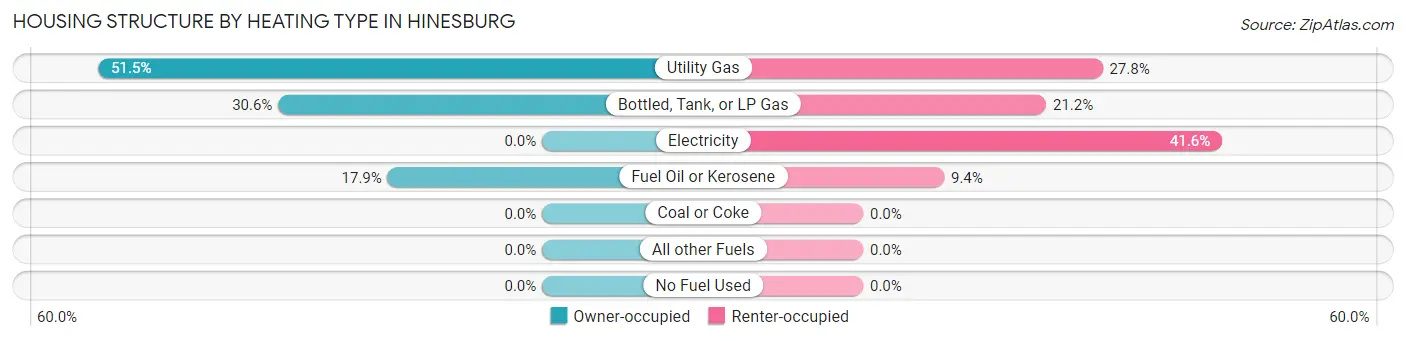
| Heating Type | Owner-occupied | Renter-occupied |
| Utility Gas | 69 (51.5%) | 68 (27.8%) |
| Bottled, Tank, or LP Gas | 41 (30.6%) | 52 (21.2%) |
| Electricity | 0 (0.0%) | 102 (41.6%) |
| Fuel Oil or Kerosene | 24 (17.9%) | 23 (9.4%) |
| Coal or Coke | 0 (0.0%) | 0 (0.0%) |
| All other Fuels | 0 (0.0%) | 0 (0.0%) |
| No Fuel Used | 0 (0.0%) | 0 (0.0%) |
| Total | 134 (100.0%) | 245 (100.0%) |
Household Vehicle Usage in Hinesburg
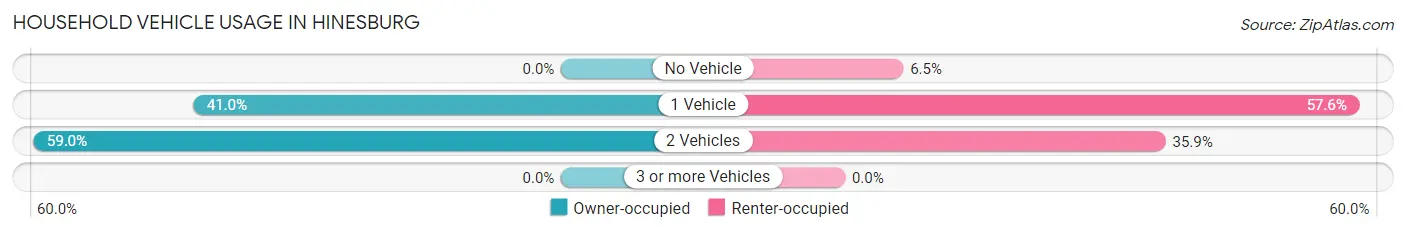
| Vehicles per Household | Owner-occupied | Renter-occupied |
| No Vehicle | 0 (0.0%) | 16 (6.5%) |
| 1 Vehicle | 55 (41.0%) | 141 (57.6%) |
| 2 Vehicles | 79 (59.0%) | 88 (35.9%) |
| 3 or more Vehicles | 0 (0.0%) | 0 (0.0%) |
| Total | 134 (100.0%) | 245 (100.0%) |
Real Estate & Mortgages in Hinesburg
Real Estate and Mortgage Overview in Hinesburg
| Characteristic | Without Mortgage | With Mortgage |
| Housing Units | 24 | 110 |
| Median Property Value | - | - |
| Median Household Income | - | - |
| Monthly Housing Costs | - | - |
| Real Estate Taxes | - | - |
Property Value by Mortgage Status in Hinesburg
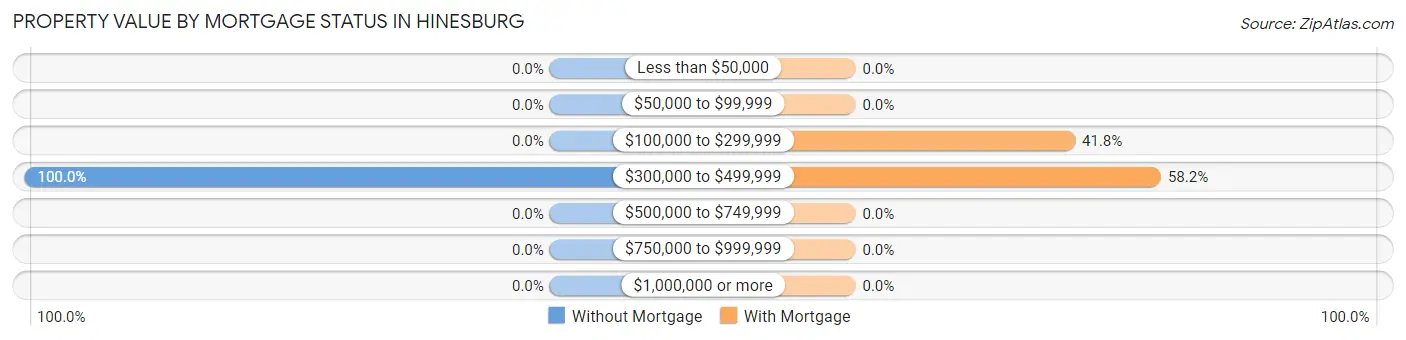
| Property Value | Without Mortgage | With Mortgage |
| Less than $50,000 | 0 (0.0%) | 0 (0.0%) |
| $50,000 to $99,999 | 0 (0.0%) | 0 (0.0%) |
| $100,000 to $299,999 | 0 (0.0%) | 46 (41.8%) |
| $300,000 to $499,999 | 24 (100.0%) | 64 (58.2%) |
| $500,000 to $749,999 | 0 (0.0%) | 0 (0.0%) |
| $750,000 to $999,999 | 0 (0.0%) | 0 (0.0%) |
| $1,000,000 or more | 0 (0.0%) | 0 (0.0%) |
| Total | 24 (100.0%) | 110 (100.0%) |
Household Income by Mortgage Status in Hinesburg
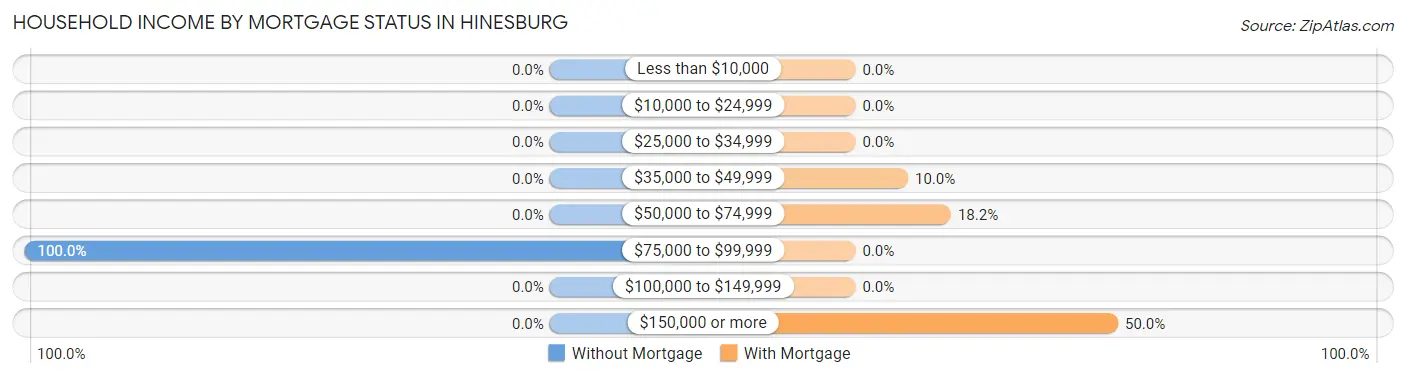
| Household Income | Without Mortgage | With Mortgage |
| Less than $10,000 | 0 (0.0%) | 0 (0.0%) |
| $10,000 to $24,999 | 0 (0.0%) | 0 (0.0%) |
| $25,000 to $34,999 | 0 (0.0%) | 0 (0.0%) |
| $35,000 to $49,999 | 0 (0.0%) | 11 (10.0%) |
| $50,000 to $74,999 | 0 (0.0%) | 20 (18.2%) |
| $75,000 to $99,999 | 24 (100.0%) | 0 (0.0%) |
| $100,000 to $149,999 | 0 (0.0%) | 0 (0.0%) |
| $150,000 or more | 0 (0.0%) | 55 (50.0%) |
| Total | 24 (100.0%) | 110 (100.0%) |
Property Value to Household Income Ratio in Hinesburg
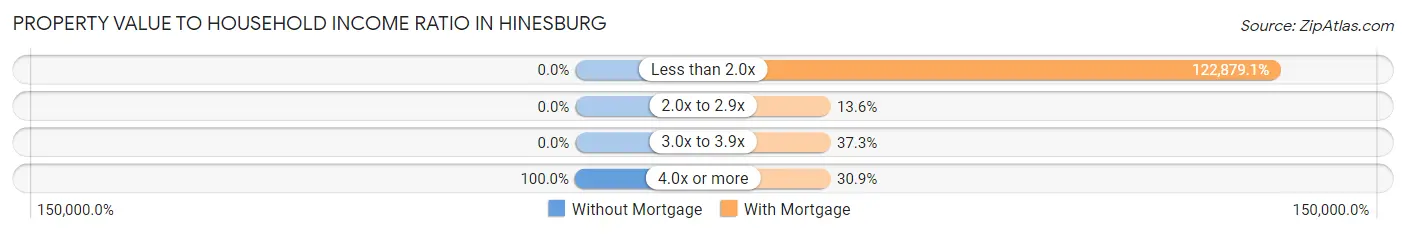
| Value-to-Income Ratio | Without Mortgage | With Mortgage |
| Less than 2.0x | 0 (0.0%) | 135,167 (122,879.1%) |
| 2.0x to 2.9x | 0 (0.0%) | 15 (13.6%) |
| 3.0x to 3.9x | 0 (0.0%) | 41 (37.3%) |
| 4.0x or more | 24 (100.0%) | 34 (30.9%) |
| Total | 24 (100.0%) | 110 (100.0%) |
Real Estate Taxes by Mortgage Status in Hinesburg
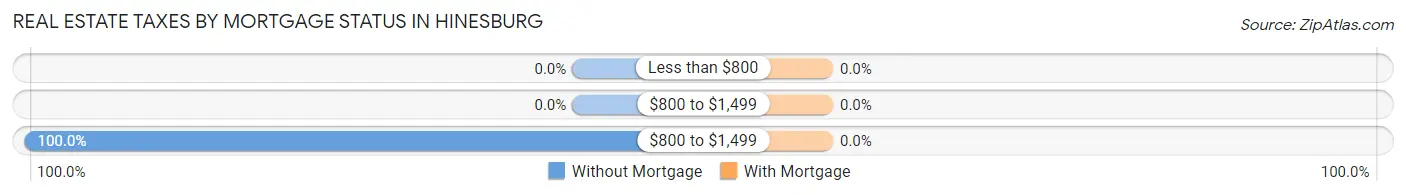
| Property Taxes | Without Mortgage | With Mortgage |
| Less than $800 | 0 (0.0%) | 0 (0.0%) |
| $800 to $1,499 | 0 (0.0%) | 0 (0.0%) |
| $800 to $1,499 | 24 (100.0%) | 0 (0.0%) |
| Total | 24 (100.0%) | 110 (100.0%) |
Health & Disability in Hinesburg
Health Insurance Coverage by Age in Hinesburg
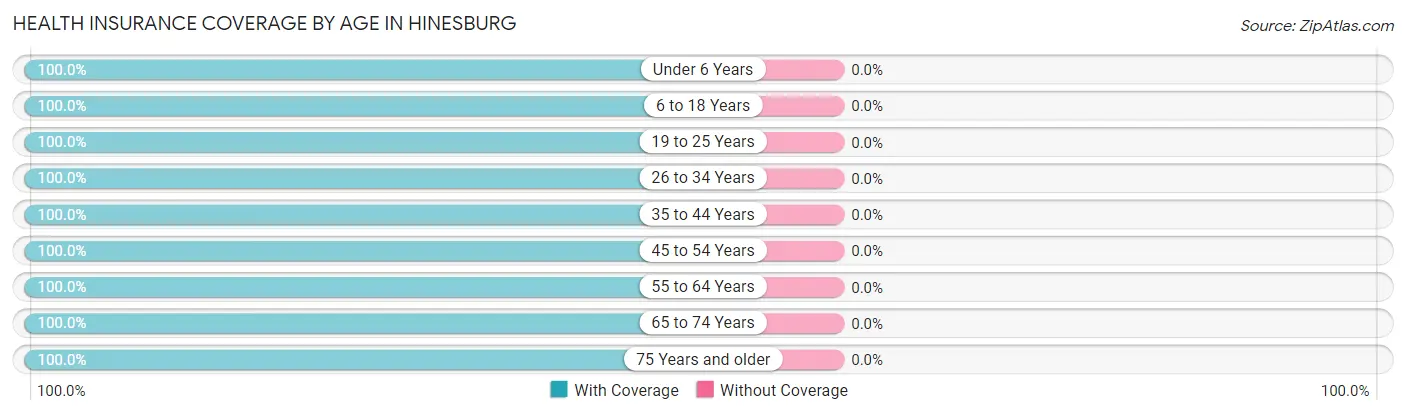
| Age Bracket | With Coverage | Without Coverage |
| Under 6 Years | 103 (100.0%) | 0 (0.0%) |
| 6 to 18 Years | 114 (100.0%) | 0 (0.0%) |
| 19 to 25 Years | 51 (100.0%) | 0 (0.0%) |
| 26 to 34 Years | 124 (100.0%) | 0 (0.0%) |
| 35 to 44 Years | 187 (100.0%) | 0 (0.0%) |
| 45 to 54 Years | 53 (100.0%) | 0 (0.0%) |
| 55 to 64 Years | 94 (100.0%) | 0 (0.0%) |
| 65 to 74 Years | 16 (100.0%) | 0 (0.0%) |
| 75 Years and older | 48 (100.0%) | 0 (0.0%) |
| Total | 790 (100.0%) | 0 (0.0%) |
Health Insurance Coverage by Citizenship Status in Hinesburg
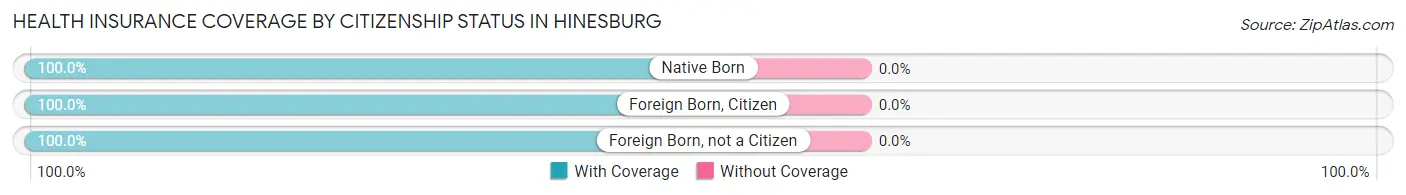
| Citizenship Status | With Coverage | Without Coverage |
| Native Born | 103 (100.0%) | 0 (0.0%) |
| Foreign Born, Citizen | 114 (100.0%) | 0 (0.0%) |
| Foreign Born, not a Citizen | 51 (100.0%) | 0 (0.0%) |
Health Insurance Coverage by Household Income in Hinesburg
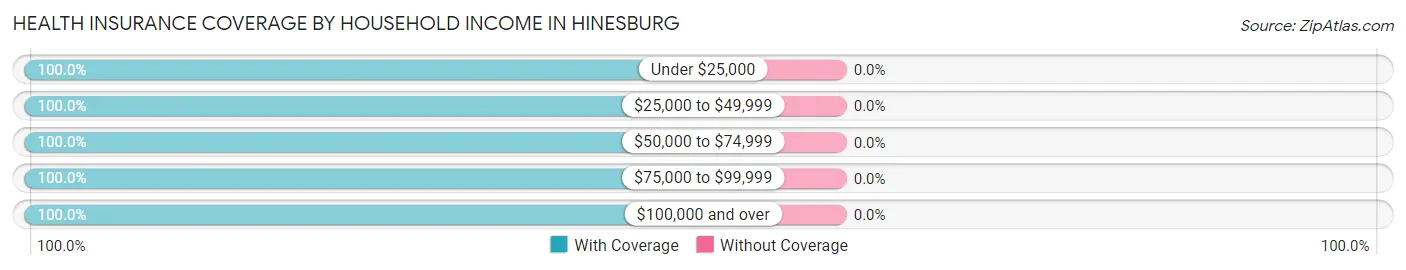
| Household Income | With Coverage | Without Coverage |
| Under $25,000 | 55 (100.0%) | 0 (0.0%) |
| $25,000 to $49,999 | 78 (100.0%) | 0 (0.0%) |
| $50,000 to $74,999 | 222 (100.0%) | 0 (0.0%) |
| $75,000 to $99,999 | 68 (100.0%) | 0 (0.0%) |
| $100,000 and over | 362 (100.0%) | 0 (0.0%) |
Public vs Private Health Insurance Coverage by Age in Hinesburg
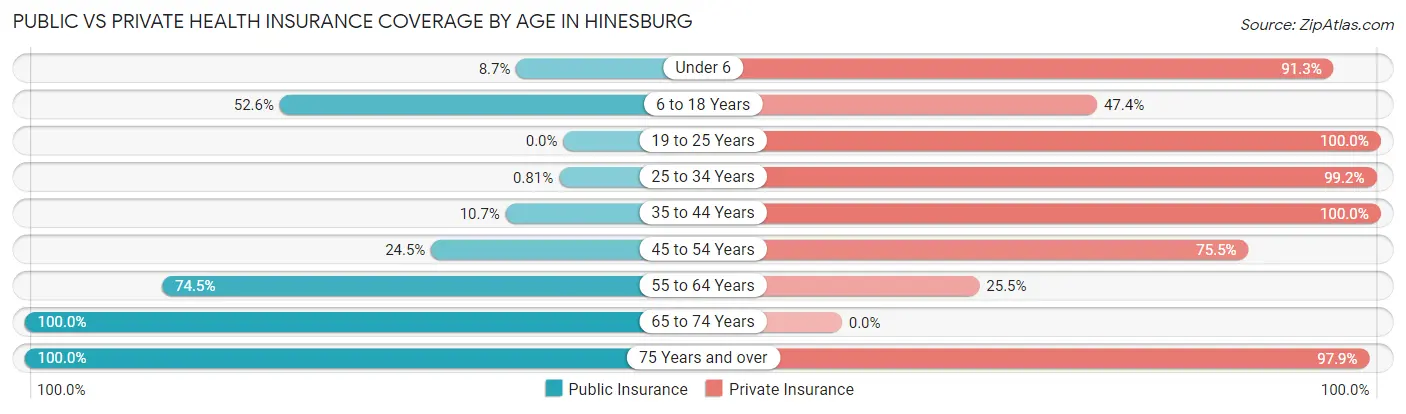
| Age Bracket | Public Insurance | Private Insurance |
| Under 6 | 9 (8.7%) | 94 (91.3%) |
| 6 to 18 Years | 60 (52.6%) | 54 (47.4%) |
| 19 to 25 Years | 0 (0.0%) | 51 (100.0%) |
| 25 to 34 Years | 1 (0.8%) | 123 (99.2%) |
| 35 to 44 Years | 20 (10.7%) | 187 (100.0%) |
| 45 to 54 Years | 13 (24.5%) | 40 (75.5%) |
| 55 to 64 Years | 70 (74.5%) | 24 (25.5%) |
| 65 to 74 Years | 16 (100.0%) | 0 (0.0%) |
| 75 Years and over | 48 (100.0%) | 47 (97.9%) |
| Total | 237 (30.0%) | 620 (78.5%) |
Disability Status by Sex by Age in Hinesburg
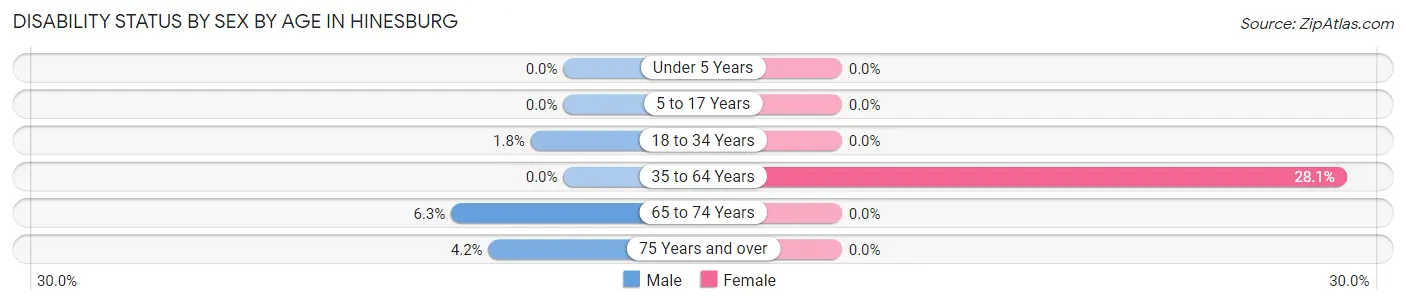
| Age Bracket | Male | Female |
| Under 5 Years | 0 (0.0%) | 0 (0.0%) |
| 5 to 17 Years | 0 (0.0%) | 0 (0.0%) |
| 18 to 34 Years | 1 (1.8%) | 0 (0.0%) |
| 35 to 64 Years | 0 (0.0%) | 70 (28.1%) |
| 65 to 74 Years | 1 (6.2%) | 0 (0.0%) |
| 75 Years and over | 1 (4.2%) | 0 (0.0%) |
Disability Class by Sex by Age in Hinesburg
Disability Class: Hearing Difficulty
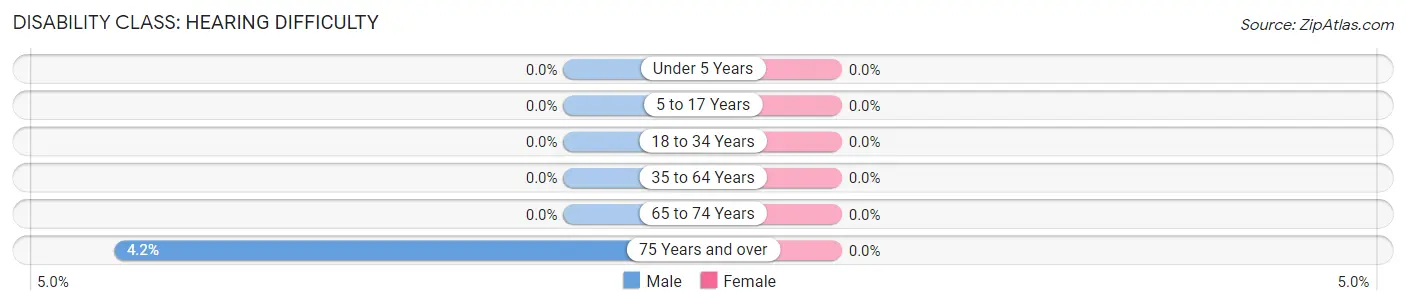
| Age Bracket | Male | Female |
| Under 5 Years | 0 (0.0%) | 0 (0.0%) |
| 5 to 17 Years | 0 (0.0%) | 0 (0.0%) |
| 18 to 34 Years | 0 (0.0%) | 0 (0.0%) |
| 35 to 64 Years | 0 (0.0%) | 0 (0.0%) |
| 65 to 74 Years | 0 (0.0%) | 0 (0.0%) |
| 75 Years and over | 1 (4.2%) | 0 (0.0%) |
Disability Class: Vision Difficulty

| Age Bracket | Male | Female |
| Under 5 Years | 0 (0.0%) | 0 (0.0%) |
| 5 to 17 Years | 0 (0.0%) | 0 (0.0%) |
| 18 to 34 Years | 0 (0.0%) | 0 (0.0%) |
| 35 to 64 Years | 0 (0.0%) | 0 (0.0%) |
| 65 to 74 Years | 0 (0.0%) | 0 (0.0%) |
| 75 Years and over | 1 (4.2%) | 0 (0.0%) |
Disability Class: Cognitive Difficulty
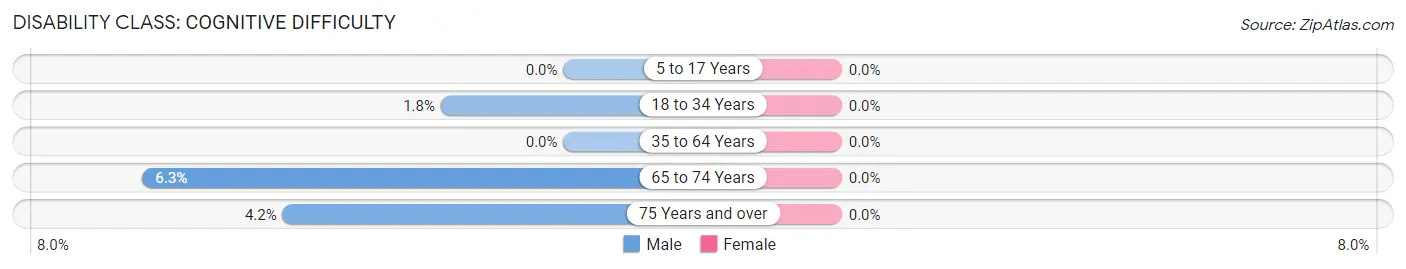
| Age Bracket | Male | Female |
| 5 to 17 Years | 0 (0.0%) | 0 (0.0%) |
| 18 to 34 Years | 1 (1.8%) | 0 (0.0%) |
| 35 to 64 Years | 0 (0.0%) | 0 (0.0%) |
| 65 to 74 Years | 1 (6.2%) | 0 (0.0%) |
| 75 Years and over | 1 (4.2%) | 0 (0.0%) |
Disability Class: Ambulatory Difficulty
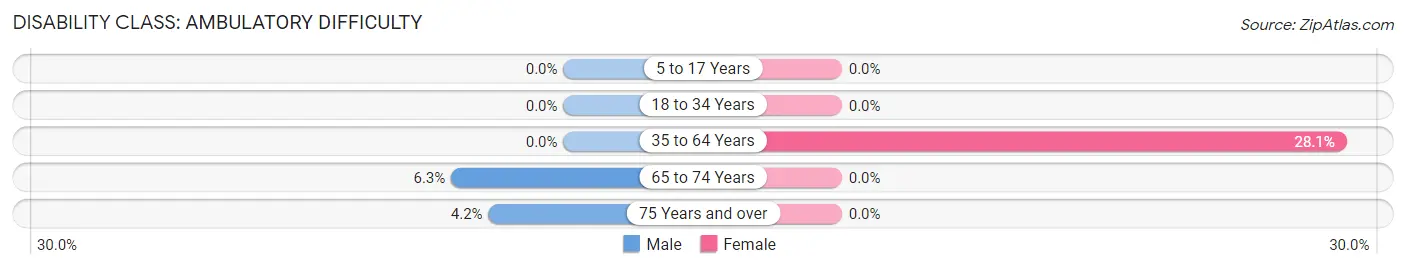
| Age Bracket | Male | Female |
| 5 to 17 Years | 0 (0.0%) | 0 (0.0%) |
| 18 to 34 Years | 0 (0.0%) | 0 (0.0%) |
| 35 to 64 Years | 0 (0.0%) | 70 (28.1%) |
| 65 to 74 Years | 1 (6.2%) | 0 (0.0%) |
| 75 Years and over | 1 (4.2%) | 0 (0.0%) |
Disability Class: Self-Care Difficulty
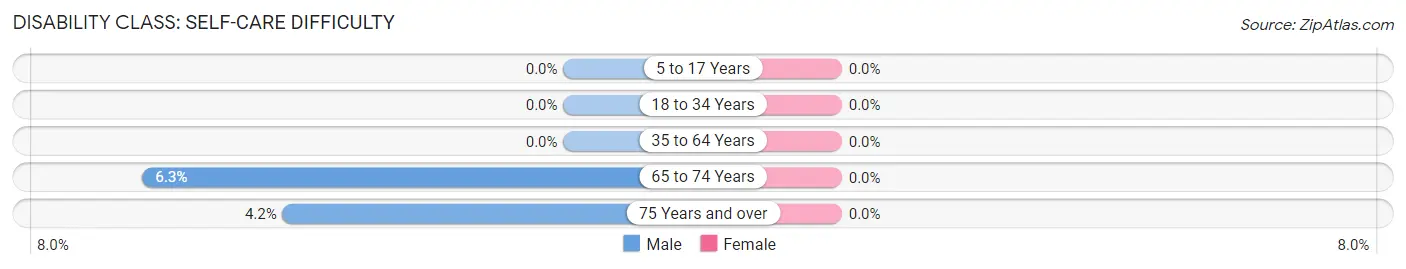
| Age Bracket | Male | Female |
| 5 to 17 Years | 0 (0.0%) | 0 (0.0%) |
| 18 to 34 Years | 0 (0.0%) | 0 (0.0%) |
| 35 to 64 Years | 0 (0.0%) | 0 (0.0%) |
| 65 to 74 Years | 1 (6.2%) | 0 (0.0%) |
| 75 Years and over | 1 (4.2%) | 0 (0.0%) |
Technology Access in Hinesburg
Computing Device Access in Hinesburg
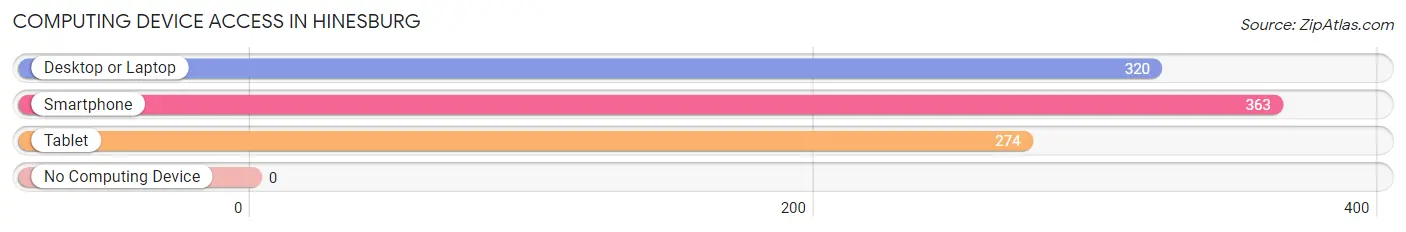
| Device Type | # Households | % Households |
| Desktop or Laptop | 320 | 84.4% |
| Smartphone | 363 | 95.8% |
| Tablet | 274 | 72.3% |
| No Computing Device | 0 | 0.0% |
| Total | 379 | 100.0% |
Internet Access in Hinesburg
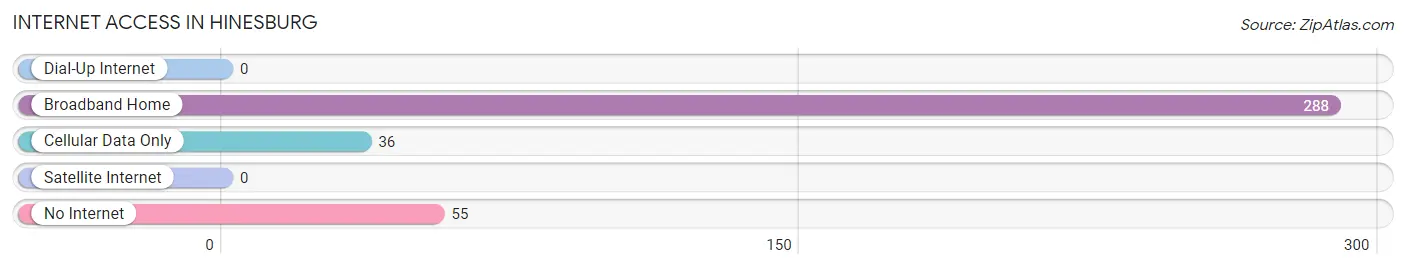
| Internet Type | # Households | % Households |
| Dial-Up Internet | 0 | 0.0% |
| Broadband Home | 288 | 76.0% |
| Cellular Data Only | 36 | 9.5% |
| Satellite Internet | 0 | 0.0% |
| No Internet | 55 | 14.5% |
| Total | 379 | 100.0% |
Hinesburg Summary
Hinesburg is a town located in Chittenden County, Vermont, United States. The population was 4,396 at the 2010 census. It is part of the Burlington–South Burlington Metropolitan Statistical Area.
History
Hinesburg was first settled in 1783 by Samuel Hine, who had served in the Revolutionary War. The town was named after him. The town was incorporated in 1790.
In the 19th century, Hinesburg was a farming community, with a few small industries such as a sawmill, gristmill, and a tannery. In the late 19th century, the town was home to a number of small factories, including a brickyard, a chair factory, and a woolen mill.
Geography
Hinesburg is located in the western part of Chittenden County, in the Champlain Valley. It is bordered to the north by Williston, to the east by Richmond, to the south by Starksboro, and to the west by Monkton.
According to the United States Census Bureau, the town has a total area of 33.2 square miles (86.1 km2), of which 33.1 square miles (85.9 km2) is land and 0.1 square miles (0.2 km2) (0.30%) is water.
Economy
Hinesburg is a rural community with a mix of small businesses, farms, and residential development. The town is home to a number of small businesses, including a general store, a hardware store, a lumber yard, a gas station, a restaurant, and a few small shops.
The town is also home to a number of farms, including dairy farms, vegetable farms, and horse farms. The town is also home to a number of small manufacturing businesses, including a furniture maker, a woodworking shop, and a metal fabrication shop.
Demographics
As of the census of 2010, there were 4,396 people, 1,717 households, and 1,204 families residing in the town. The population density was 132.9 people per square mile (51.3/km2). There were 1,817 housing units at an average density of 54.9 per square mile (21.2/km2). The racial makeup of the town was 97.2% White, 0.4% African American, 0.2% Native American, 0.7% Asian, 0.1% Pacific Islander, 0.2% from other races, and 1.2% from two or more races. Hispanic or Latino of any race were 1.2% of the population.
There were 1,717 households, out of which 33.2% had children under the age of 18 living with them, 57.2% were married couples living together, 8.7% had a female householder with no husband present, and 29.7% were non-families. 22.7% of all households were made up of individuals, and 8.2% had someone living alone who was 65 years of age or older. The average household size was 2.55 and the average family size was 3.02.
In the town, the population was spread out, with 25.2% under the age of 18, 6.2% from 18 to 24, 28.2% from 25 to 44, 28.2% from 45 to 64, and 12.2% who were 65 years of age or older. The median age was 39 years. For every 100 females, there were 97.2 males. For every 100 females age 18 and over, there were 94.2 males.
The median income for a household in the town was $54,917, and the median income for a family was $63,958. Males had a median income of $41,964 versus $30,917 for females. The per capita income for the town was $25,945. About 4.2% of families and 5.7% of the population were below the poverty line, including 6.2% of those under age 18 and 5.2% of those age 65 or over.
Common Questions
What is the Total Population of Hinesburg?
Total Population of Hinesburg is 790.
What is the Total Male Population of Hinesburg?
Total Male Population of Hinesburg is 344.
What is the Total Female Population of Hinesburg?
Total Female Population of Hinesburg is 446.
What is the Ratio of Males per 100 Females in Hinesburg?
There are 77.13 Males per 100 Females in Hinesburg.
What is the Ratio of Females per 100 Males in Hinesburg?
There are 129.65 Females per 100 Males in Hinesburg.
What is the Median Population Age in Hinesburg?
Median Population Age in Hinesburg is 35.1 Years.
What is the Average Family Size in Hinesburg
Average Family Size in Hinesburg is 2.8 People.
What is the Average Household Size in Hinesburg
Average Household Size in Hinesburg is 2.1 People.
What is Per Capita Income in Hinesburg?
Per Capita income in Hinesburg is $34,430.
What is the Median Family Income in Hinesburg?
Median Family Income in Hinesburg is $83,177.
What is the Median Household income in Hinesburg?
Median Household Income in Hinesburg is $62,888.
What is Inequality or Gini Index in Hinesburg?
Inequality or Gini Index in Hinesburg is 0.35.
How Large is the Labor Force in Hinesburg?
There are 516 People in the Labor Forcein in Hinesburg.
What is the Percentage of People in the Labor Force in Hinesburg?
86.9% of People are in the Labor Force in Hinesburg.
What is the Unemployment Rate in Hinesburg?
Unemployment Rate in Hinesburg is 4.1%.