Norwich, VT
Norwich Map
Norwich Overview
839
TOTAL POPULATION
346
MALE POPULATION
493
FEMALE POPULATION
70.18
MALES / 100 FEMALES
142.49
FEMALES / 100 MALES
41.7
MEDIAN AGE
3.1
AVG FAMILY SIZE
2.7
AVG HOUSEHOLD SIZE
$65,804
PER CAPITA INCOME
$189,861
AVG FAMILY INCOME
$138,750
AVG HOUSEHOLD INCOME
0.51
INEQUALITY / GINI INDEX
396
LABOR FORCE [ PEOPLE ]
58.8%
PERCENT IN LABOR FORCE
3.8%
UNEMPLOYMENT RATE
Norwich Zip Codes
Norwich Area Codes
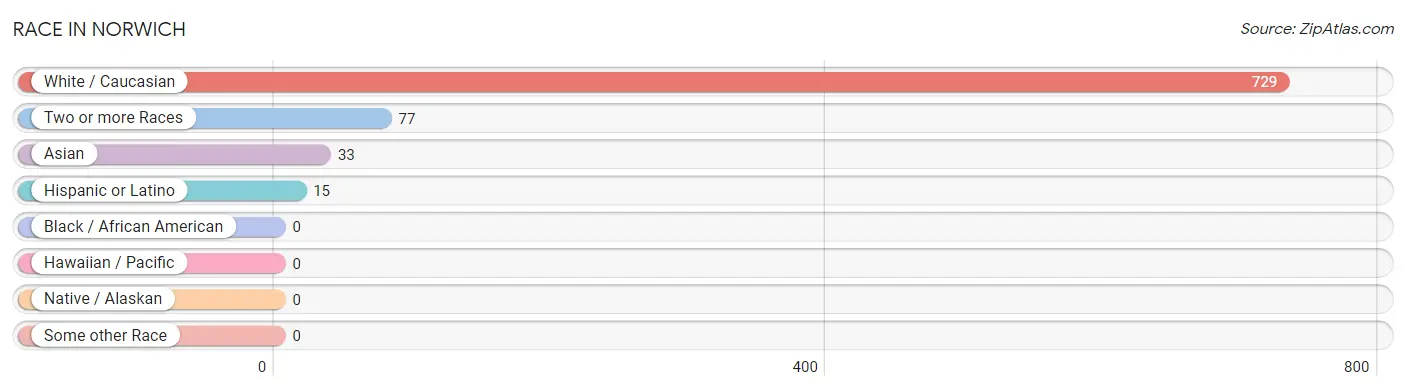
Race in Norwich
The most populous races in Norwich are White / Caucasian (729 | 86.9%), Two or more Races (77 | 9.2%), and Asian (33 | 3.9%).
| Race | # Population | % Population |
| Asian | 33 | 3.9% |
| Black / African American | 0 | 0.0% |
| Hawaiian / Pacific | 0 | 0.0% |
| Hispanic or Latino | 15 | 1.8% |
| Native / Alaskan | 0 | 0.0% |
| White / Caucasian | 729 | 86.9% |
| Two or more Races | 77 | 9.2% |
| Some other Race | 0 | 0.0% |
| Total | 839 | 100.0% |
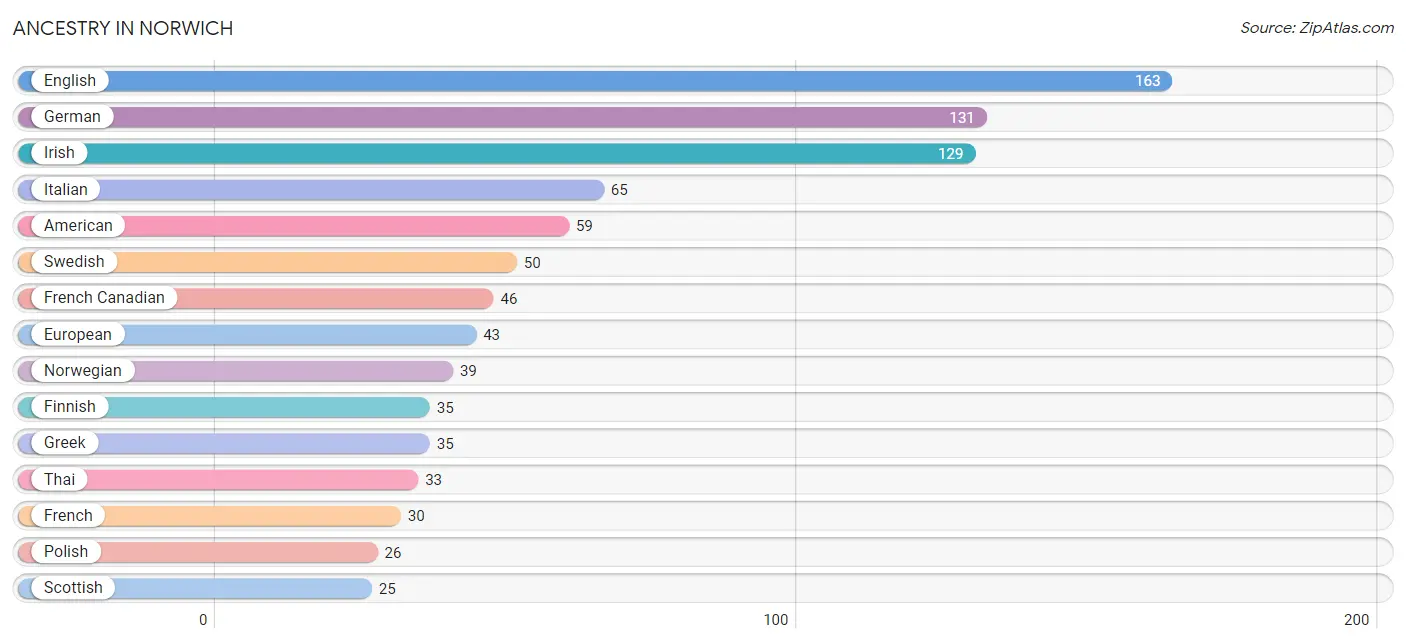
Ancestry in Norwich
The most populous ancestries reported in Norwich are English (163 | 19.4%), German (131 | 15.6%), Irish (129 | 15.4%), Italian (65 | 7.7%), and American (59 | 7.0%), together accounting for 65.2% of all Norwich residents.
| Ancestry | # Population | % Population |
| American | 59 | 7.0% |
| British | 9 | 1.1% |
| English | 163 | 19.4% |
| European | 43 | 5.1% |
| Finnish | 35 | 4.2% |
| French | 30 | 3.6% |
| French Canadian | 46 | 5.5% |
| German | 131 | 15.6% |
| Greek | 35 | 4.2% |
| Hungarian | 10 | 1.2% |
| Indian (Asian) | 21 | 2.5% |
| Irish | 129 | 15.4% |
| Italian | 65 | 7.7% |
| Mexican | 15 | 1.8% |
| Norwegian | 39 | 4.6% |
| Polish | 26 | 3.1% |
| Russian | 23 | 2.7% |
| Scotch-Irish | 12 | 1.4% |
| Scottish | 25 | 3.0% |
| Slovak | 22 | 2.6% |
| Slovene | 7 | 0.8% |
| Swedish | 50 | 6.0% |
| Thai | 33 | 3.9% |
| Ukrainian | 24 | 2.9% |
| Welsh | 9 | 1.1% | View All 25 Rows |
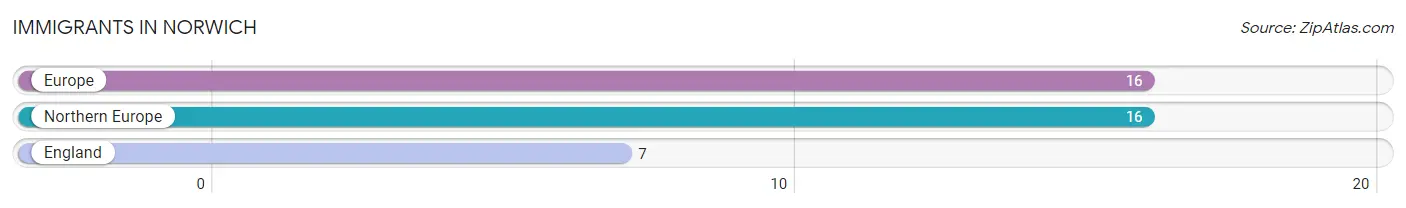
Immigrants in Norwich
The most numerous immigrant groups reported in Norwich came from Europe (16 | 1.9%), Northern Europe (16 | 1.9%), and England (7 | 0.8%), together accounting for 4.6% of all Norwich residents.
| Immigration Origin | # Population | % Population |
| England | 7 | 0.8% |
| Europe | 16 | 1.9% |
| Northern Europe | 16 | 1.9% | View All 3 Rows |
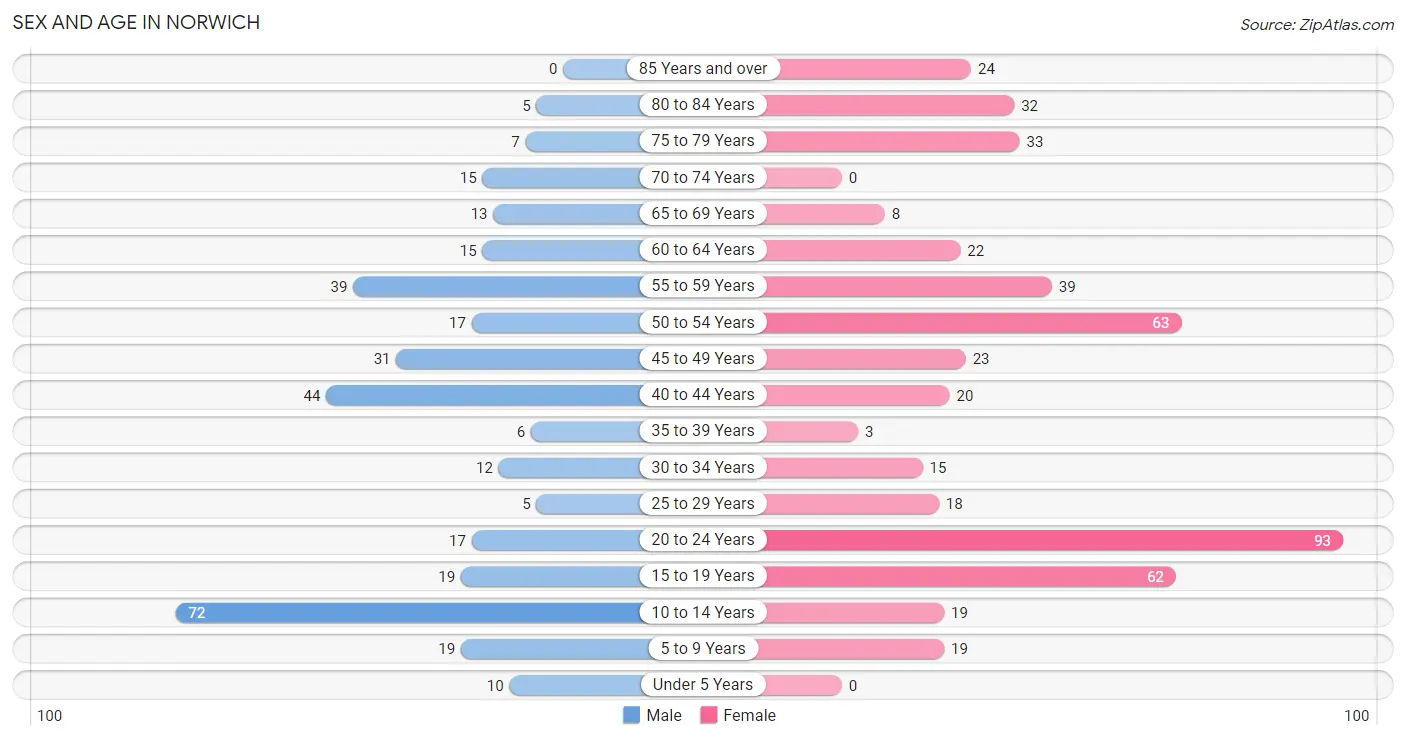
Sex and Age in Norwich
Sex and Age in Norwich
The most populous age groups in Norwich are 10 to 14 Years (72 | 20.8%) for men and 20 to 24 Years (93 | 18.9%) for women.
| Age Bracket | Male | Female |
| Under 5 Years | 10 (2.9%) | 0 (0.0%) |
| 5 to 9 Years | 19 (5.5%) | 19 (3.8%) |
| 10 to 14 Years | 72 (20.8%) | 19 (3.8%) |
| 15 to 19 Years | 19 (5.5%) | 62 (12.6%) |
| 20 to 24 Years | 17 (4.9%) | 93 (18.9%) |
| 25 to 29 Years | 5 (1.5%) | 18 (3.6%) |
| 30 to 34 Years | 12 (3.5%) | 15 (3.0%) |
| 35 to 39 Years | 6 (1.7%) | 3 (0.6%) |
| 40 to 44 Years | 44 (12.7%) | 20 (4.1%) |
| 45 to 49 Years | 31 (9.0%) | 23 (4.7%) |
| 50 to 54 Years | 17 (4.9%) | 63 (12.8%) |
| 55 to 59 Years | 39 (11.3%) | 39 (7.9%) |
| 60 to 64 Years | 15 (4.3%) | 22 (4.5%) |
| 65 to 69 Years | 13 (3.8%) | 8 (1.6%) |
| 70 to 74 Years | 15 (4.3%) | 0 (0.0%) |
| 75 to 79 Years | 7 (2.0%) | 33 (6.7%) |
| 80 to 84 Years | 5 (1.5%) | 32 (6.5%) |
| 85 Years and over | 0 (0.0%) | 24 (4.9%) |
| Total | 346 (100.0%) | 493 (100.0%) |
Families and Households in Norwich
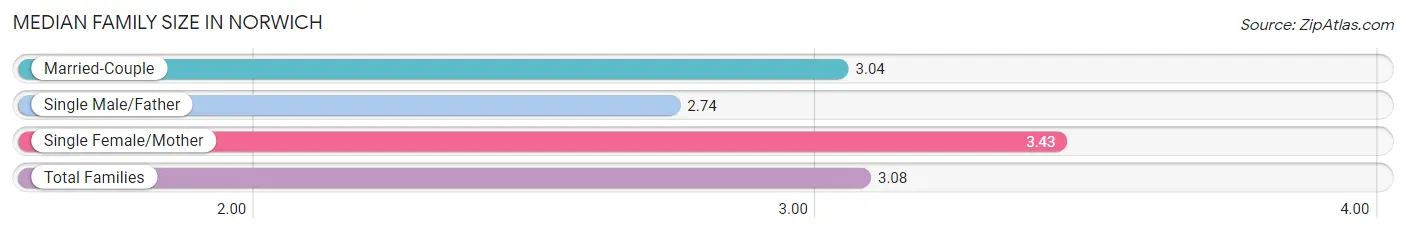
Median Family Size in Norwich
The median family size in Norwich is 3.08 persons per family, with single female/mother families (35 | 16.6%) accounting for the largest median family size of 3.43 persons per family. On the other hand, single male/father families (19 | 9.0%) represent the smallest median family size with 2.74 persons per family.
| Family Type | # Families | Family Size |
| Married-Couple | 157 (74.4%) | 3.04 |
| Single Male/Father | 19 (9.0%) | 2.74 |
| Single Female/Mother | 35 (16.6%) | 3.43 |
| Total Families | 211 (100.0%) | 3.08 |
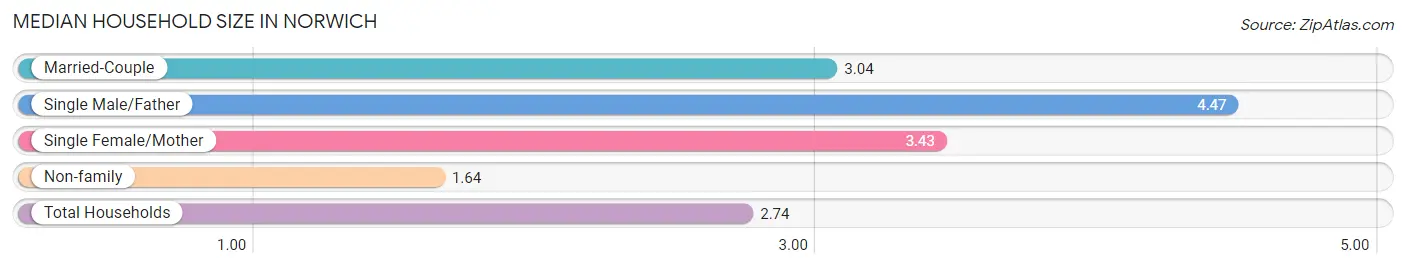
Median Household Size in Norwich
The median household size in Norwich is 2.74 persons per household, with single male/father households (19 | 6.2%) accounting for the largest median household size of 4.47 persons per household. non-family households (95 | 31.0%) represent the smallest median household size with 1.64 persons per household.
| Household Type | # Households | Household Size |
| Married-Couple | 157 (51.3%) | 3.04 |
| Single Male/Father | 19 (6.2%) | 4.47 |
| Single Female/Mother | 35 (11.4%) | 3.43 |
| Non-family | 95 (31.0%) | 1.64 |
| Total Households | 306 (100.0%) | 2.74 |
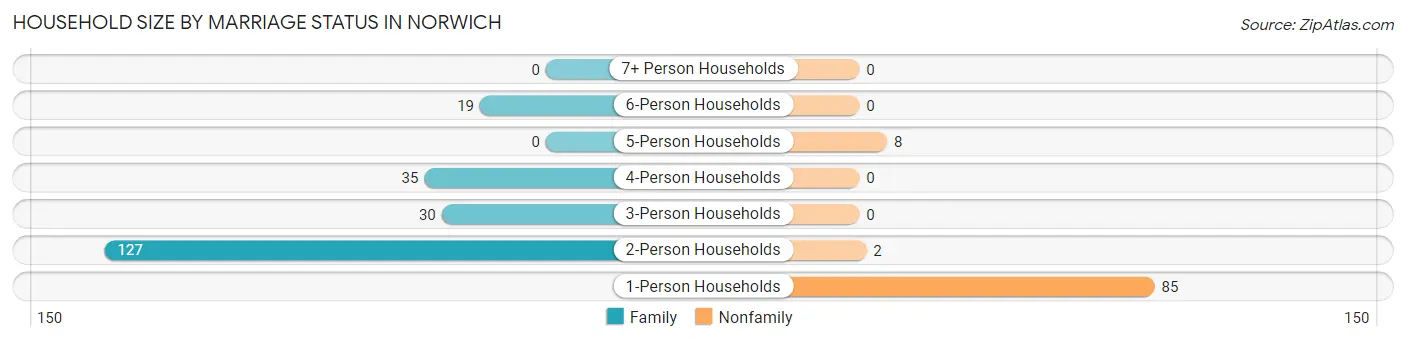
Household Size by Marriage Status in Norwich
Out of a total of 306 households in Norwich, 211 (69.0%) are family households, while 95 (31.0%) are nonfamily households. The most numerous type of family households are 2-person households, comprising 127, and the most common type of nonfamily households are 1-person households, comprising 85.
| Household Size | Family Households | Nonfamily Households |
| 1-Person Households | - | 85 (27.8%) |
| 2-Person Households | 127 (41.5%) | 2 (0.6%) |
| 3-Person Households | 30 (9.8%) | 0 (0.0%) |
| 4-Person Households | 35 (11.4%) | 0 (0.0%) |
| 5-Person Households | 0 (0.0%) | 8 (2.6%) |
| 6-Person Households | 19 (6.2%) | 0 (0.0%) |
| 7+ Person Households | 0 (0.0%) | 0 (0.0%) |
| Total | 211 (69.0%) | 95 (31.0%) |
Female Fertility in Norwich
Fertility by Age in Norwich
| Age Bracket | Women with Births | Births / 1,000 Women |
| 15 to 19 years | 0 (0.0%) | 0.0 |
| 20 to 34 years | 0 (0.0%) | 0.0 |
| 35 to 50 years | 0 (0.0%) | 0.0 |
| Total | 0 (0.0%) | 0.0 |
Fertility by Age by Marriage Status in Norwich
| Age Bracket | Married | Unmarried |
| 15 to 19 years | 0 (0.0%) | 0 (0.0%) |
| 20 to 34 years | 0 (0.0%) | 0 (0.0%) |
| 35 to 50 years | 0 (0.0%) | 0 (0.0%) |
| Total | 0 (0.0%) | 0 (0.0%) |
Fertility by Education in Norwich
| Educational Attainment | Women with Births | Births / 1,000 Women |
| Less than High School | 0 (0.0%) | 0.0 |
| High School Diploma | 0 (0.0%) | 0.0 |
| College or Associate's Degree | 0 (0.0%) | 0.0 |
| Bachelor's Degree | 0 (0.0%) | 0.0 |
| Graduate Degree | 0 (0.0%) | 0.0 |
| Total | 0 (0.0%) | 0.0 |
Fertility by Education by Marriage Status in Norwich
| Educational Attainment | Married | Unmarried |
| Less than High School | 0 (0.0%) | 0 (0.0%) |
| High School Diploma | 0 (0.0%) | 0 (0.0%) |
| College or Associate's Degree | 0 (0.0%) | 0 (0.0%) |
| Bachelor's Degree | 0 (0.0%) | 0 (0.0%) |
| Graduate Degree | 0 (0.0%) | 0 (0.0%) |
| Total | 0 (0.0%) | 0 (0.0%) |
Income in Norwich
Income Overview in Norwich
Per Capita Income in Norwich is $65,804, while median incomes of families and households are $189,861 and $138,750 respectively.
| Characteristic | Number | Measure |
| Per Capita Income | 839 | $65,804 |
| Median Family Income | 211 | $189,861 |
| Mean Family Income | 211 | $240,731 |
| Median Household Income | 306 | $138,750 |
| Mean Household Income | 306 | $179,379 |
| Income Deficit | 211 | $0 |
| Wage / Income Gap (%) | 839 | 0.00% |
| Wage / Income Gap ($) | 839 | 100.00¢ per $1 |
| Gini / Inequality Index | 839 | 0.51 |
Earnings by Sex in Norwich

| Sex | Number | Average Earnings |
| Male | 199 (45.1%) | $110,972 |
| Female | 242 (54.9%) | $0 |
| Total | 441 (100.0%) | $79,097 |
Earnings by Sex by Income Bracket in Norwich
The most common earnings brackets in Norwich are $100,000+ for men (111 | 55.8%) and $2,499 or less for women (69 | 28.5%).
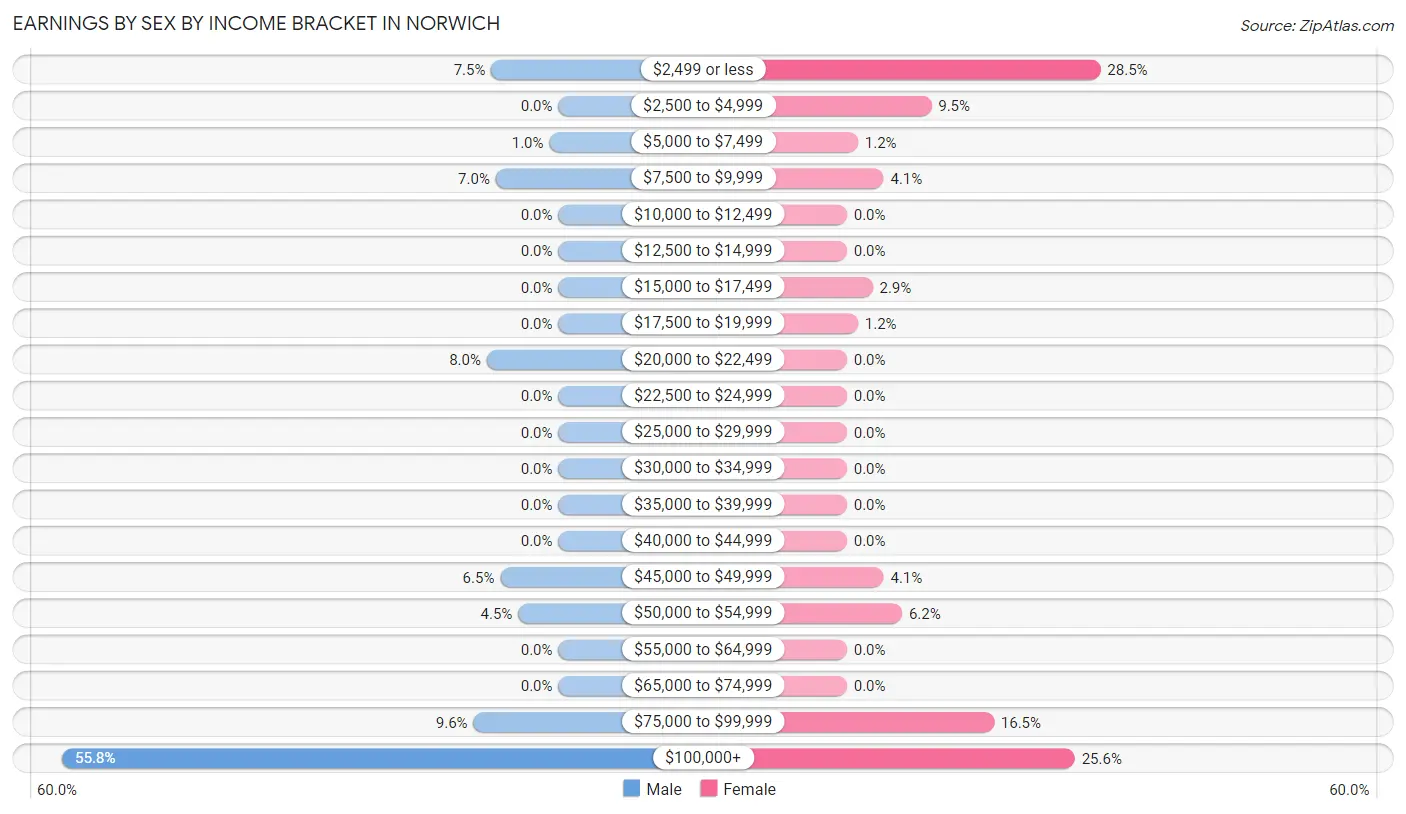
| Income | Male | Female |
| $2,499 or less | 15 (7.5%) | 69 (28.5%) |
| $2,500 to $4,999 | 0 (0.0%) | 23 (9.5%) |
| $5,000 to $7,499 | 2 (1.0%) | 3 (1.2%) |
| $7,500 to $9,999 | 14 (7.0%) | 10 (4.1%) |
| $10,000 to $12,499 | 0 (0.0%) | 0 (0.0%) |
| $12,500 to $14,999 | 0 (0.0%) | 0 (0.0%) |
| $15,000 to $17,499 | 0 (0.0%) | 7 (2.9%) |
| $17,500 to $19,999 | 0 (0.0%) | 3 (1.2%) |
| $20,000 to $22,499 | 16 (8.0%) | 0 (0.0%) |
| $22,500 to $24,999 | 0 (0.0%) | 0 (0.0%) |
| $25,000 to $29,999 | 0 (0.0%) | 0 (0.0%) |
| $30,000 to $34,999 | 0 (0.0%) | 0 (0.0%) |
| $35,000 to $39,999 | 0 (0.0%) | 0 (0.0%) |
| $40,000 to $44,999 | 0 (0.0%) | 0 (0.0%) |
| $45,000 to $49,999 | 13 (6.5%) | 10 (4.1%) |
| $50,000 to $54,999 | 9 (4.5%) | 15 (6.2%) |
| $55,000 to $64,999 | 0 (0.0%) | 0 (0.0%) |
| $65,000 to $74,999 | 0 (0.0%) | 0 (0.0%) |
| $75,000 to $99,999 | 19 (9.6%) | 40 (16.5%) |
| $100,000+ | 111 (55.8%) | 62 (25.6%) |
| Total | 199 (100.0%) | 242 (100.0%) |
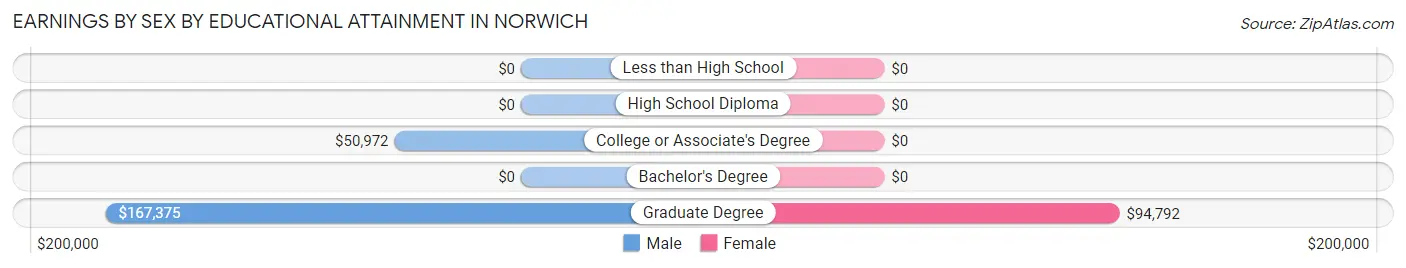
Earnings by Sex by Educational Attainment in Norwich
Average earnings in Norwich are $111,250 for men and $79,861 for women, a difference of 28.2%. Men with an educational attainment of graduate degree enjoy the highest average annual earnings of $167,375, while those with college or associate's degree education earn the least with $50,972. Women with an educational attainment of graduate degree earn the most with the average annual earnings of $94,792, while those with graduate degree education have the smallest earnings of $94,792.
| Educational Attainment | Male Income | Female Income |
| Less than High School | - | - |
| High School Diploma | - | - |
| College or Associate's Degree | $50,972 | $0 |
| Bachelor's Degree | - | - |
| Graduate Degree | $167,375 | $94,792 |
| Total | $111,250 | $79,861 |
Family Income in Norwich
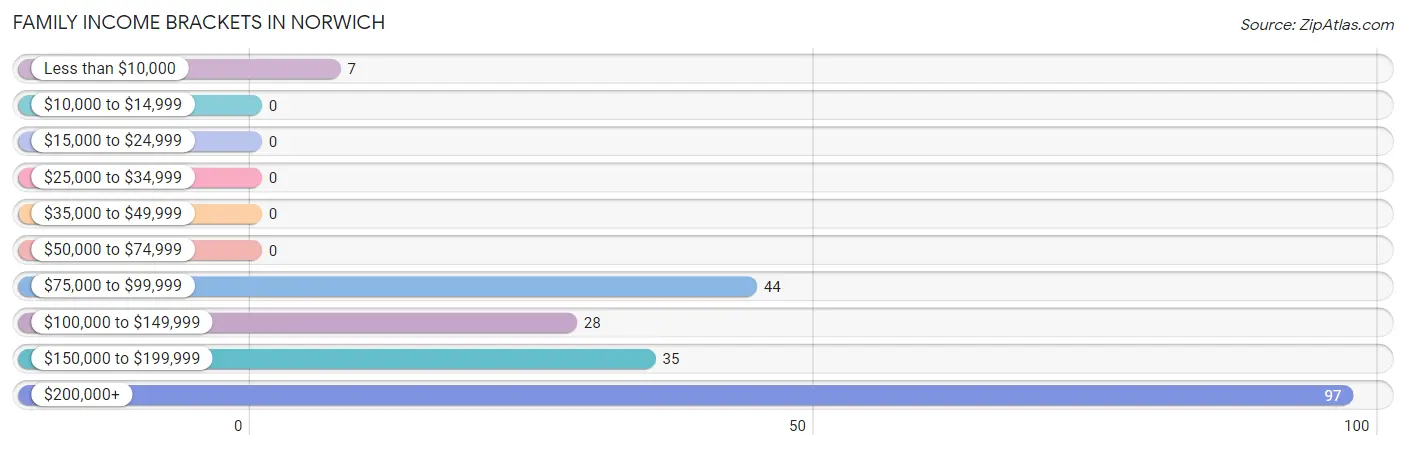
Family Income Brackets in Norwich
According to the Norwich family income data, there are 97 families falling into the $200,000+ income range, which is the most common income bracket and makes up 46.0% of all families.
| Income Bracket | # Families | % Families |
| Less than $10,000 | 7 | 3.3% |
| $10,000 to $14,999 | 0 | 0.0% |
| $15,000 to $24,999 | 0 | 0.0% |
| $25,000 to $34,999 | 0 | 0.0% |
| $35,000 to $49,999 | 0 | 0.0% |
| $50,000 to $74,999 | 0 | 0.0% |
| $75,000 to $99,999 | 44 | 20.9% |
| $100,000 to $149,999 | 28 | 13.3% |
| $150,000 to $199,999 | 35 | 16.6% |
| $200,000+ | 97 | 46.0% |
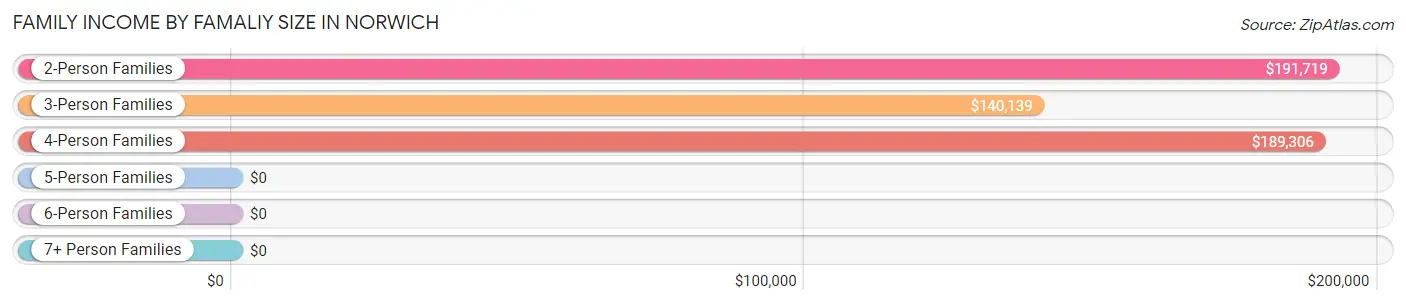
Family Income by Famaliy Size in Norwich
2-person families (127 | 60.2%) account for the highest median family income in Norwich with $191,719 per family, while 2-person families (127 | 60.2%) have the highest median income of $95,860 per family member.
| Income Bracket | # Families | Median Income |
| 2-Person Families | 127 (60.2%) | $191,719 |
| 3-Person Families | 39 (18.5%) | $140,139 |
| 4-Person Families | 35 (16.6%) | $189,306 |
| 5-Person Families | 0 (0.0%) | $0 |
| 6-Person Families | 10 (4.7%) | $0 |
| 7+ Person Families | 0 (0.0%) | $0 |
| Total | 211 (100.0%) | $189,861 |
Family Income by Number of Earners in Norwich
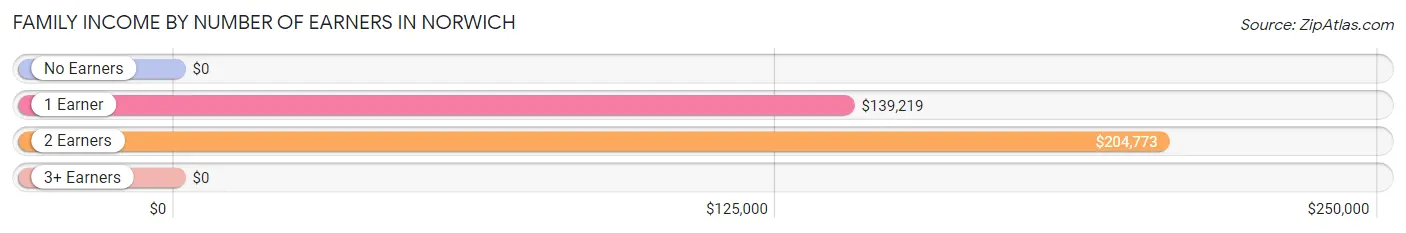
| Number of Earners | # Families | Median Income |
| No Earners | 14 (6.6%) | $0 |
| 1 Earner | 49 (23.2%) | $139,219 |
| 2 Earners | 130 (61.6%) | $204,773 |
| 3+ Earners | 18 (8.5%) | $0 |
| Total | 211 (100.0%) | $189,861 |
Household Income in Norwich
Household Income Brackets in Norwich
With 106 households falling in the category, the $200,000+ income range is the most frequent in Norwich, accounting for 34.6% of all households. In contrast, only 7 households (2.3%) fall into the less than $10,000 income bracket, making it the least populous group.
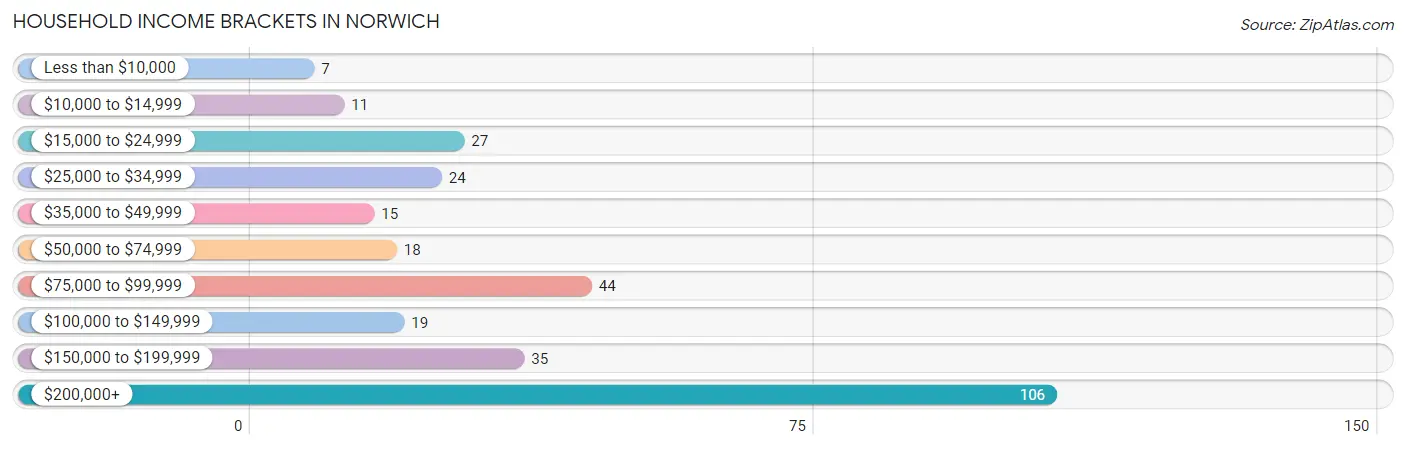
| Income Bracket | # Households | % Households |
| Less than $10,000 | 7 | 2.3% |
| $10,000 to $14,999 | 11 | 3.6% |
| $15,000 to $24,999 | 27 | 8.8% |
| $25,000 to $34,999 | 24 | 7.8% |
| $35,000 to $49,999 | 15 | 4.9% |
| $50,000 to $74,999 | 18 | 5.9% |
| $75,000 to $99,999 | 44 | 14.4% |
| $100,000 to $149,999 | 19 | 6.2% |
| $150,000 to $199,999 | 35 | 11.4% |
| $200,000+ | 106 | 34.6% |
Household Income by Householder Age in Norwich
The median household income in Norwich is $138,750, with the highest median household income of $234,271 found in the 45 to 64 years age bracket for the primary householder. A total of 141 households (46.1%) fall into this category. Meanwhile, the 15 to 24 years age bracket for the primary householder has the lowest median household income of $0, with 2 households (0.6%) in this group.
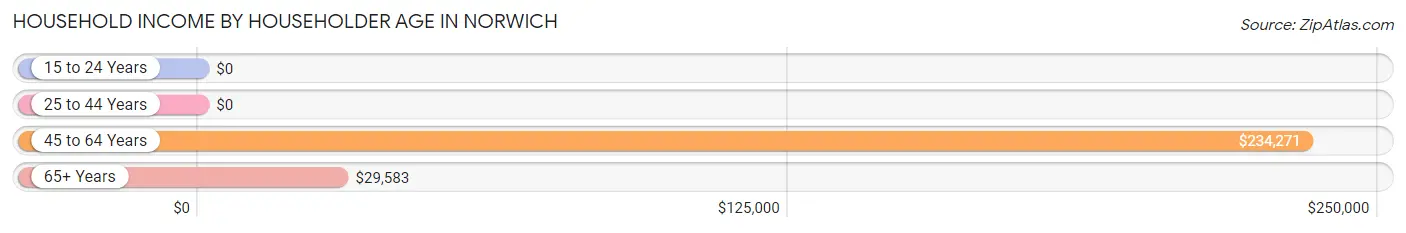
| Income Bracket | # Households | Median Income |
| 15 to 24 Years | 2 (0.6%) | $0 |
| 25 to 44 Years | 53 (17.3%) | $0 |
| 45 to 64 Years | 141 (46.1%) | $234,271 |
| 65+ Years | 110 (35.9%) | $29,583 |
| Total | 306 (100.0%) | $138,750 |
Poverty in Norwich
Income Below Poverty by Sex and Age in Norwich
With 7.8% poverty level for males and 15.0% for females among the residents of Norwich, 15 year old males and 18 to 24 year old females are the most vulnerable to poverty, with 10 males (52.6%) and 59 females (50.0%) in their respective age groups living below the poverty level.
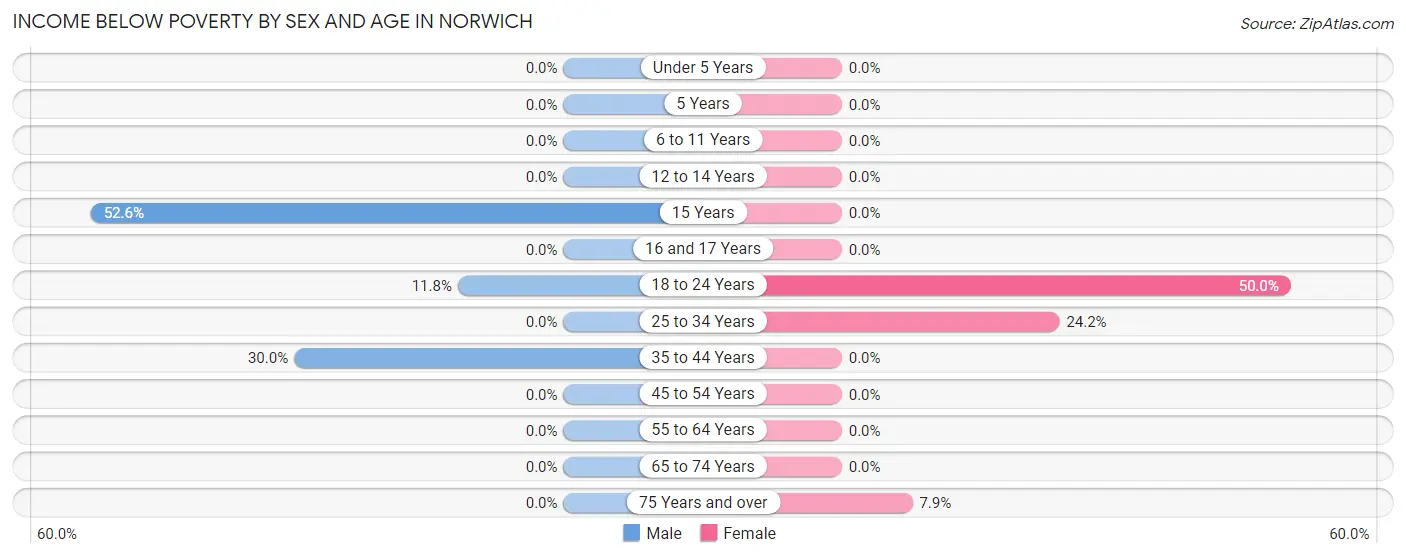
| Age Bracket | Male | Female |
| Under 5 Years | 0 (0.0%) | 0 (0.0%) |
| 5 Years | 0 (0.0%) | 0 (0.0%) |
| 6 to 11 Years | 0 (0.0%) | 0 (0.0%) |
| 12 to 14 Years | 0 (0.0%) | 0 (0.0%) |
| 15 Years | 10 (52.6%) | 0 (0.0%) |
| 16 and 17 Years | 0 (0.0%) | 0 (0.0%) |
| 18 to 24 Years | 2 (11.8%) | 59 (50.0%) |
| 25 to 34 Years | 0 (0.0%) | 8 (24.2%) |
| 35 to 44 Years | 15 (30.0%) | 0 (0.0%) |
| 45 to 54 Years | 0 (0.0%) | 0 (0.0%) |
| 55 to 64 Years | 0 (0.0%) | 0 (0.0%) |
| 65 to 74 Years | 0 (0.0%) | 0 (0.0%) |
| 75 Years and over | 0 (0.0%) | 7 (7.9%) |
| Total | 27 (7.8%) | 74 (15.0%) |
Income Above Poverty by Sex and Age in Norwich
According to the poverty statistics in Norwich, males aged under 5 years and females aged 6 to 11 years are the age groups that are most secure financially, with 100.0% of males and 100.0% of females in these age groups living above the poverty line.
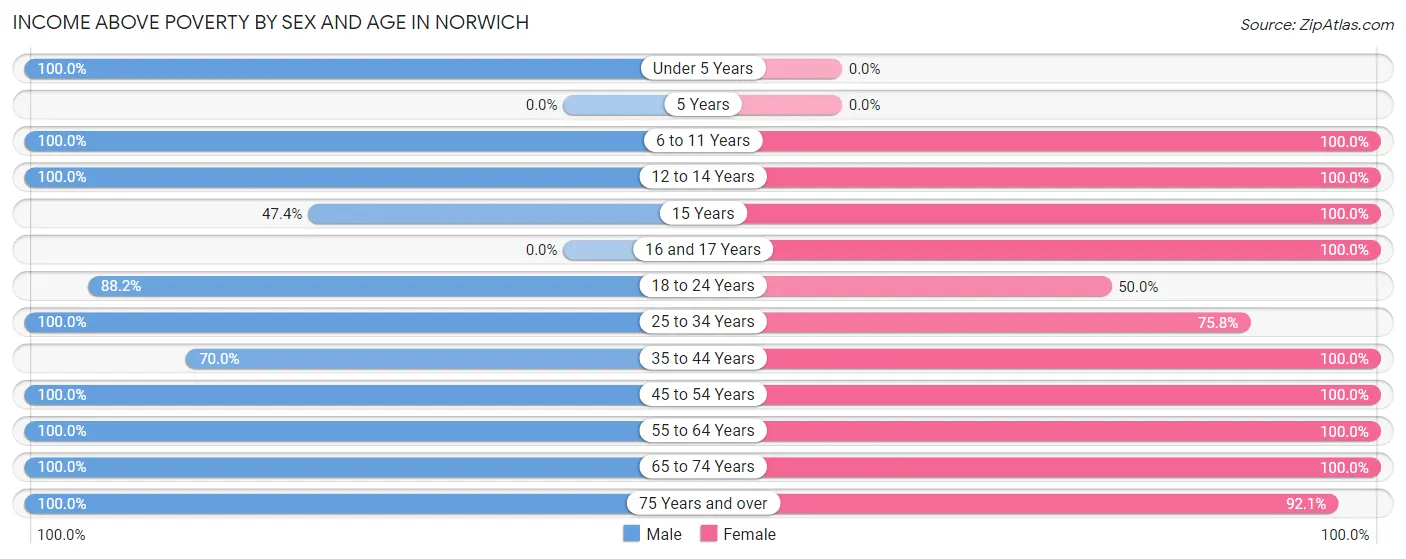
| Age Bracket | Male | Female |
| Under 5 Years | 10 (100.0%) | 0 (0.0%) |
| 5 Years | 0 (0.0%) | 0 (0.0%) |
| 6 to 11 Years | 19 (100.0%) | 19 (100.0%) |
| 12 to 14 Years | 72 (100.0%) | 19 (100.0%) |
| 15 Years | 9 (47.4%) | 8 (100.0%) |
| 16 and 17 Years | 0 (0.0%) | 29 (100.0%) |
| 18 to 24 Years | 15 (88.2%) | 59 (50.0%) |
| 25 to 34 Years | 17 (100.0%) | 25 (75.8%) |
| 35 to 44 Years | 35 (70.0%) | 23 (100.0%) |
| 45 to 54 Years | 48 (100.0%) | 86 (100.0%) |
| 55 to 64 Years | 54 (100.0%) | 61 (100.0%) |
| 65 to 74 Years | 28 (100.0%) | 8 (100.0%) |
| 75 Years and over | 12 (100.0%) | 82 (92.1%) |
| Total | 319 (92.2%) | 419 (85.0%) |
Income Below Poverty Among Married-Couple Families in Norwich
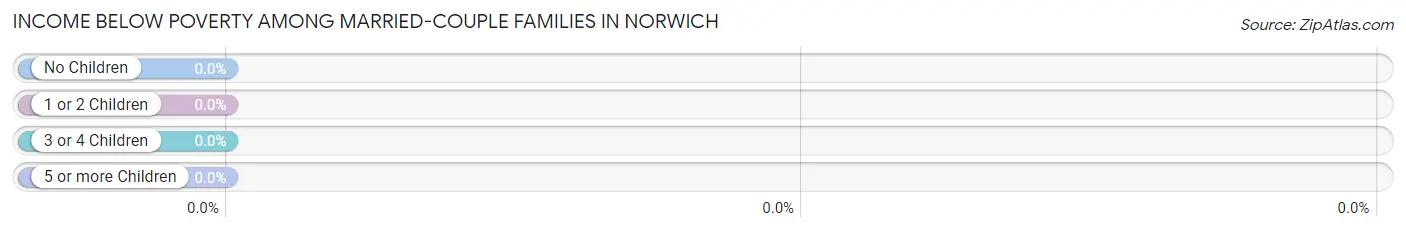
| Children | Above Poverty | Below Poverty |
| No Children | 91 (100.0%) | 0 (0.0%) |
| 1 or 2 Children | 56 (100.0%) | 0 (0.0%) |
| 3 or 4 Children | 10 (100.0%) | 0 (0.0%) |
| 5 or more Children | 0 (0.0%) | 0 (0.0%) |
| Total | 157 (100.0%) | 0 (0.0%) |
Income Below Poverty Among Single-Parent Households in Norwich
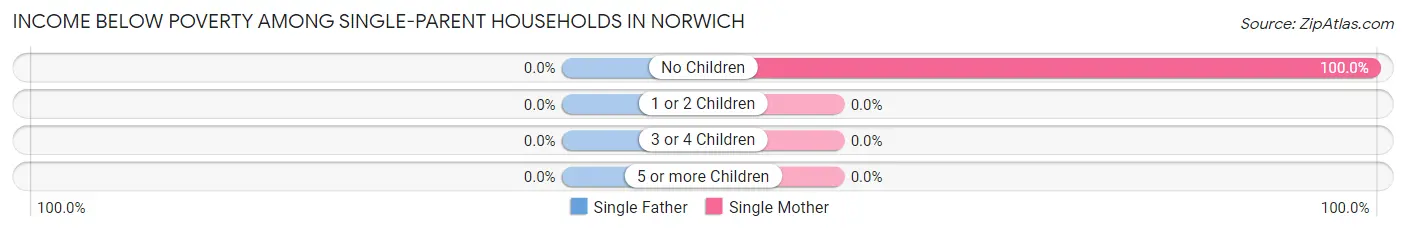
| Children | Single Father | Single Mother |
| No Children | 0 (0.0%) | 7 (100.0%) |
| 1 or 2 Children | 0 (0.0%) | 0 (0.0%) |
| 3 or 4 Children | 0 (0.0%) | 0 (0.0%) |
| 5 or more Children | 0 (0.0%) | 0 (0.0%) |
| Total | 0 (0.0%) | 7 (20.0%) |
Income Below Poverty Among Married-Couple vs Single-Parent Households in Norwich
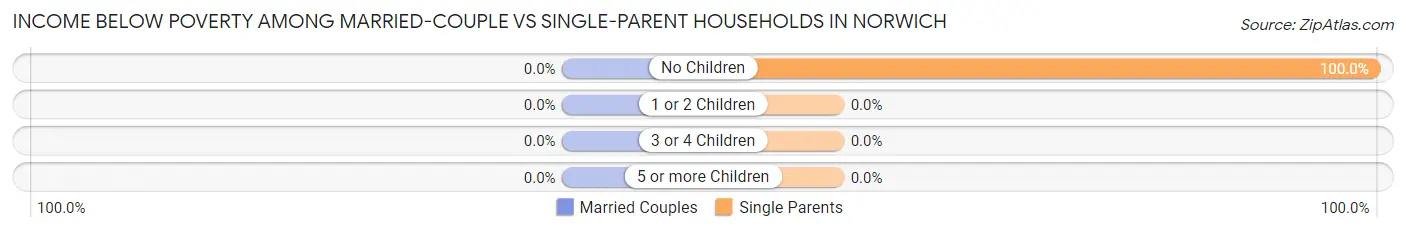
| Children | Married-Couple Families | Single-Parent Households |
| No Children | 0 (0.0%) | 7 (100.0%) |
| 1 or 2 Children | 0 (0.0%) | 0 (0.0%) |
| 3 or 4 Children | 0 (0.0%) | 0 (0.0%) |
| 5 or more Children | 0 (0.0%) | 0 (0.0%) |
| Total | 0 (0.0%) | 7 (13.0%) |
Employment Characteristics in Norwich
Employment by Class of Employer in Norwich
Among the 378 employed individuals in Norwich, private company employees (175 | 46.3%), not-for-profit organizations (119 | 31.5%), and self-employed (not incorporated) (24 | 6.4%) make up the most common classes of employment.
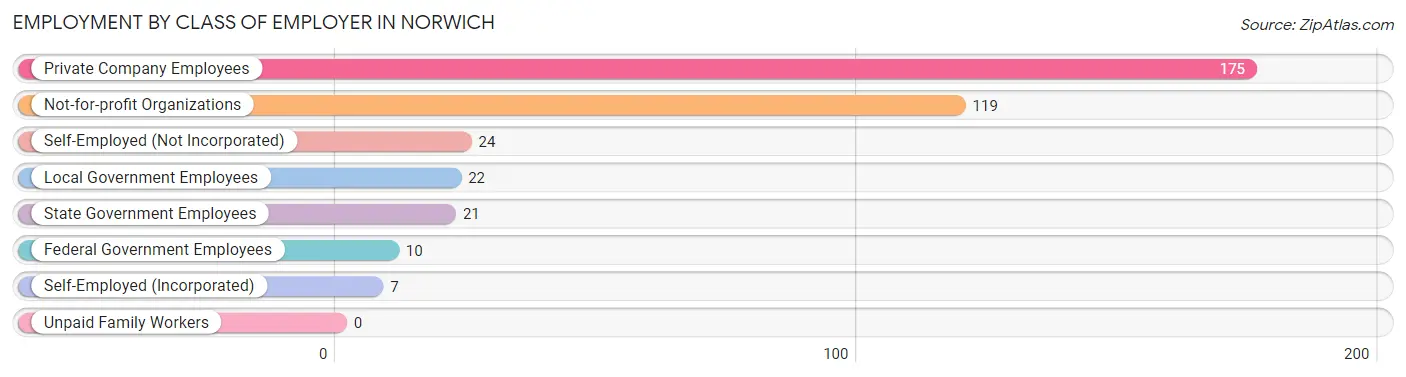
| Employer Class | # Employees | % Employees |
| Private Company Employees | 175 | 46.3% |
| Self-Employed (Incorporated) | 7 | 1.8% |
| Self-Employed (Not Incorporated) | 24 | 6.4% |
| Not-for-profit Organizations | 119 | 31.5% |
| Local Government Employees | 22 | 5.8% |
| State Government Employees | 21 | 5.6% |
| Federal Government Employees | 10 | 2.6% |
| Unpaid Family Workers | 0 | 0.0% |
| Total | 378 | 100.0% |
Employment Status by Age in Norwich
According to the labor force statistics for Norwich, out of the total population over 16 years of age (673), 58.8% or 396 individuals are in the labor force, with 3.8% or 15 of them unemployed. The age group with the highest labor force participation rate is 30 to 34 years, with 100.0% or 27 individuals in the labor force. Within the labor force, the 35 to 44 years age range has the highest percentage of unemployed individuals, with 20.5% or 15 of them being unemployed.
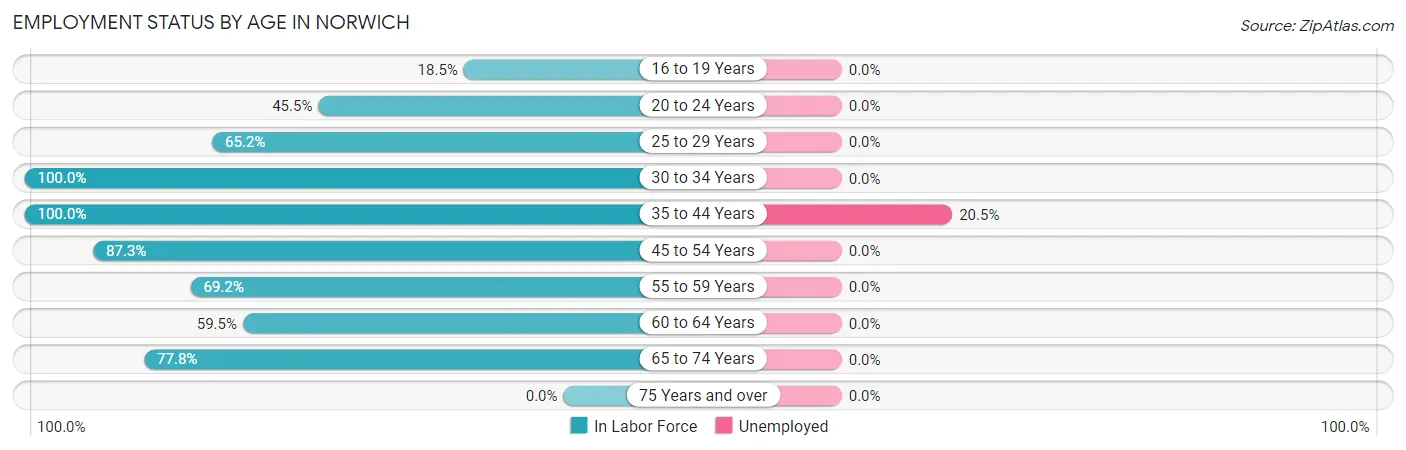
| Age Bracket | In Labor Force | Unemployed |
| 16 to 19 Years | 10 (18.5%) | 0 (0.0%) |
| 20 to 24 Years | 50 (45.5%) | 0 (0.0%) |
| 25 to 29 Years | 15 (65.2%) | 0 (0.0%) |
| 30 to 34 Years | 27 (100.0%) | 0 (0.0%) |
| 35 to 44 Years | 73 (100.0%) | 15 (20.5%) |
| 45 to 54 Years | 117 (87.3%) | 0 (0.0%) |
| 55 to 59 Years | 54 (69.2%) | 0 (0.0%) |
| 60 to 64 Years | 22 (59.5%) | 0 (0.0%) |
| 65 to 74 Years | 28 (77.8%) | 0 (0.0%) |
| 75 Years and over | 0 (0.0%) | 0 (0.0%) |
| Total | 396 (58.8%) | 15 (3.8%) |
Employment Status by Educational Attainment in Norwich
According to labor force statistics for Norwich, 82.8% of individuals (308) out of the total population between 25 and 64 years of age (372) are in the labor force, with 4.9% or 15 of them being unemployed. The group with the highest labor force participation rate are those with the educational attainment of high school diploma, with 100.0% or 21 individuals in the labor force. Within the labor force, individuals with bachelor's degree or higher education have the highest percentage of unemployment, with 5.5% or 15 of them being unemployed.
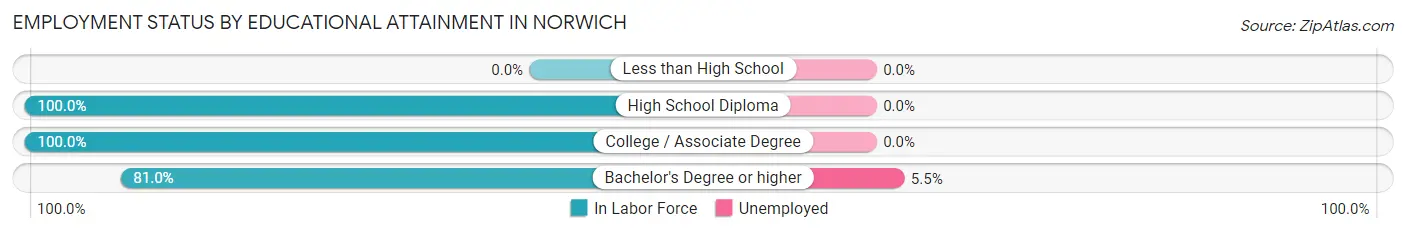
| Educational Attainment | In Labor Force | Unemployed |
| Less than High School | 0 (0.0%) | 0 (0.0%) |
| High School Diploma | 21 (100.0%) | 0 (0.0%) |
| College / Associate Degree | 14 (100.0%) | 0 (0.0%) |
| Bachelor's Degree or higher | 273 (81.0%) | 19 (5.5%) |
| Total | 308 (82.8%) | 18 (4.9%) |
Employment Occupations by Sex in Norwich
Management, Business, Science and Arts Occupations
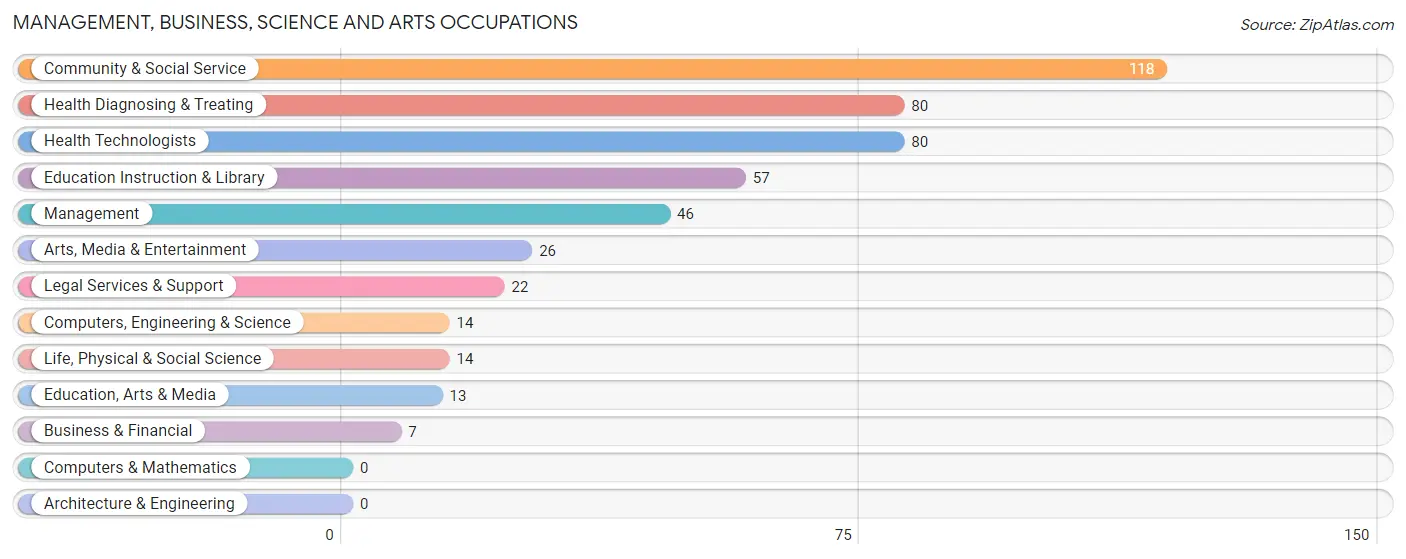
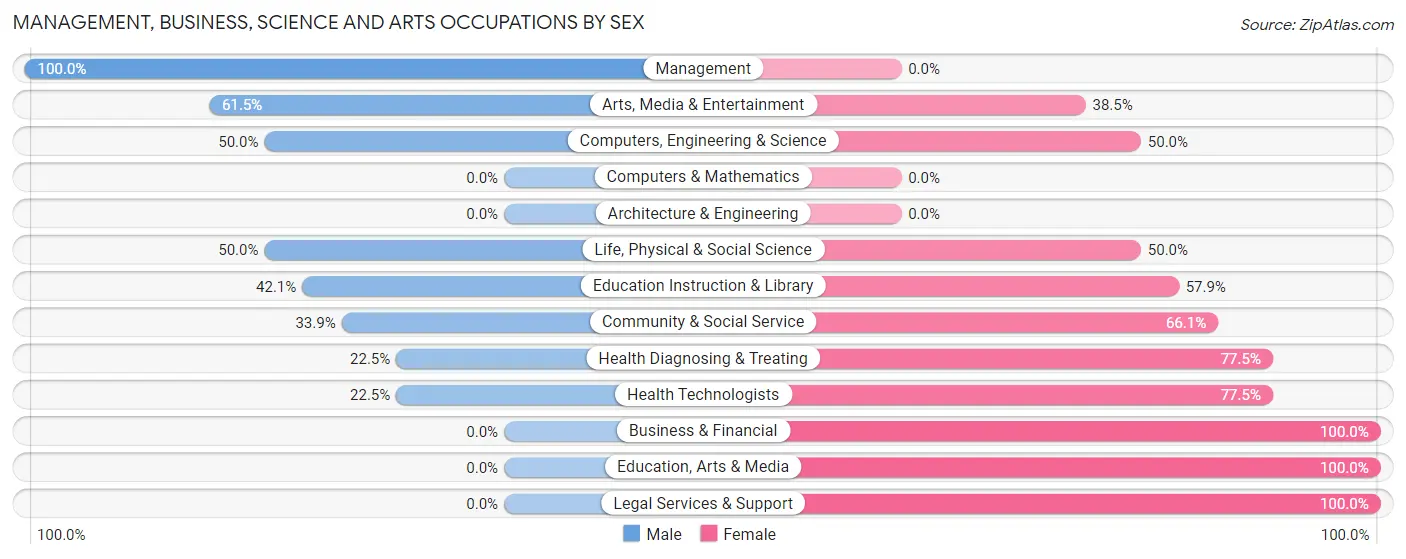
The most common Management, Business, Science and Arts occupations in Norwich are Community & Social Service (118 | 31.0%), Health Diagnosing & Treating (80 | 21.0%), Health Technologists (80 | 21.0%), Education Instruction & Library (57 | 15.0%), and Management (46 | 12.1%).
Management, Business, Science and Arts Occupations by Sex
Within the Management, Business, Science and Arts occupations in Norwich, the most male-oriented occupations are Management (100.0%), Arts, Media & Entertainment (61.5%), and Computers, Engineering & Science (50.0%), while the most female-oriented occupations are Business & Financial (100.0%), Education, Arts & Media (100.0%), and Legal Services & Support (100.0%).
| Occupation | Male | Female |
| Management | 46 (100.0%) | 0 (0.0%) |
| Business & Financial | 0 (0.0%) | 7 (100.0%) |
| Computers, Engineering & Science | 7 (50.0%) | 7 (50.0%) |
| Computers & Mathematics | 0 (0.0%) | 0 (0.0%) |
| Architecture & Engineering | 0 (0.0%) | 0 (0.0%) |
| Life, Physical & Social Science | 7 (50.0%) | 7 (50.0%) |
| Community & Social Service | 40 (33.9%) | 78 (66.1%) |
| Education, Arts & Media | 0 (0.0%) | 13 (100.0%) |
| Legal Services & Support | 0 (0.0%) | 22 (100.0%) |
| Education Instruction & Library | 24 (42.1%) | 33 (57.9%) |
| Arts, Media & Entertainment | 16 (61.5%) | 10 (38.5%) |
| Health Diagnosing & Treating | 18 (22.5%) | 62 (77.5%) |
| Health Technologists | 18 (22.5%) | 62 (77.5%) |
| Total (Category) | 111 (41.9%) | 154 (58.1%) |
| Total (Overall) | 174 (45.7%) | 207 (54.3%) |
Services Occupations
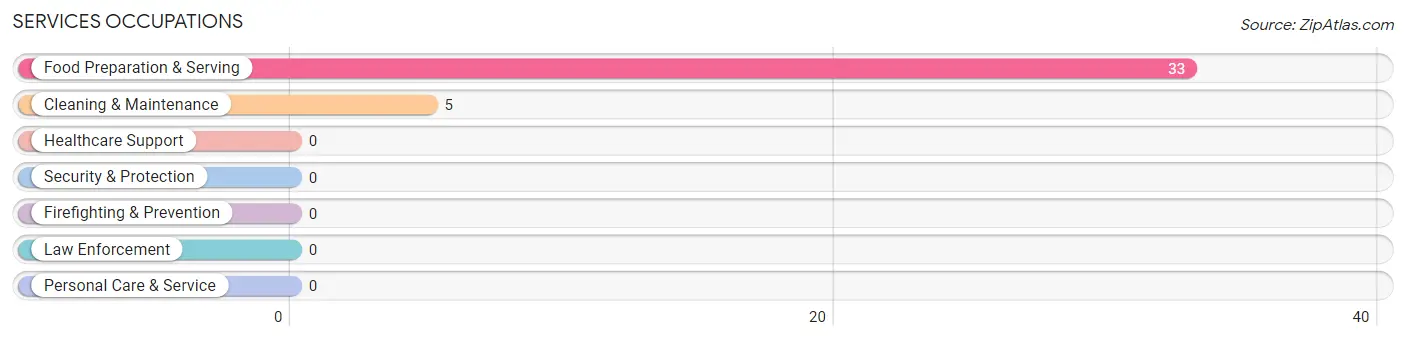
The most common Services occupations in Norwich are Food Preparation & Serving (33 | 8.7%), and Cleaning & Maintenance (5 | 1.3%).
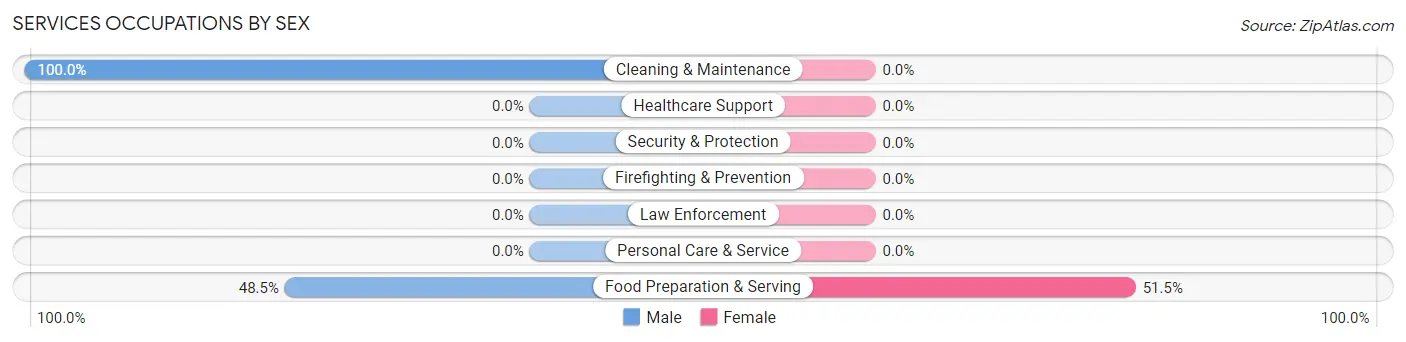
Services Occupations by Sex
| Occupation | Male | Female |
| Healthcare Support | 0 (0.0%) | 0 (0.0%) |
| Security & Protection | 0 (0.0%) | 0 (0.0%) |
| Firefighting & Prevention | 0 (0.0%) | 0 (0.0%) |
| Law Enforcement | 0 (0.0%) | 0 (0.0%) |
| Food Preparation & Serving | 16 (48.5%) | 17 (51.5%) |
| Cleaning & Maintenance | 5 (100.0%) | 0 (0.0%) |
| Personal Care & Service | 0 (0.0%) | 0 (0.0%) |
| Total (Category) | 21 (55.3%) | 17 (44.7%) |
| Total (Overall) | 174 (45.7%) | 207 (54.3%) |
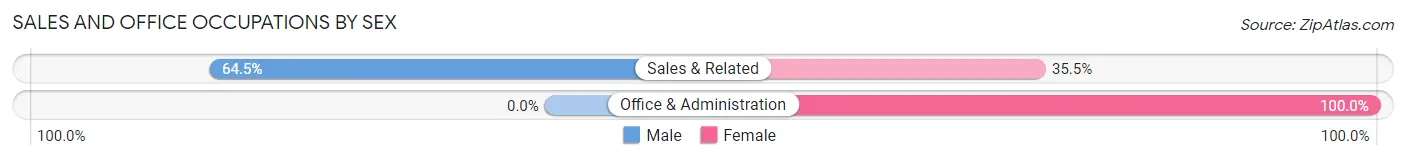
Sales and Office Occupations
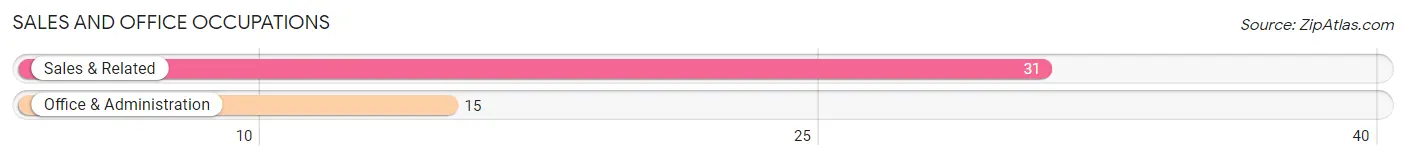
The most common Sales and Office occupations in Norwich are Sales & Related (31 | 8.1%), and Office & Administration (15 | 3.9%).
Sales and Office Occupations by Sex
| Occupation | Male | Female |
| Sales & Related | 20 (64.5%) | 11 (35.5%) |
| Office & Administration | 0 (0.0%) | 15 (100.0%) |
| Total (Category) | 20 (43.5%) | 26 (56.5%) |
| Total (Overall) | 174 (45.7%) | 207 (54.3%) |
Natural Resources, Construction and Maintenance Occupations
The most common Natural Resources, Construction and Maintenance occupations in Norwich are , and Construction & Extraction (14 | 3.7%).
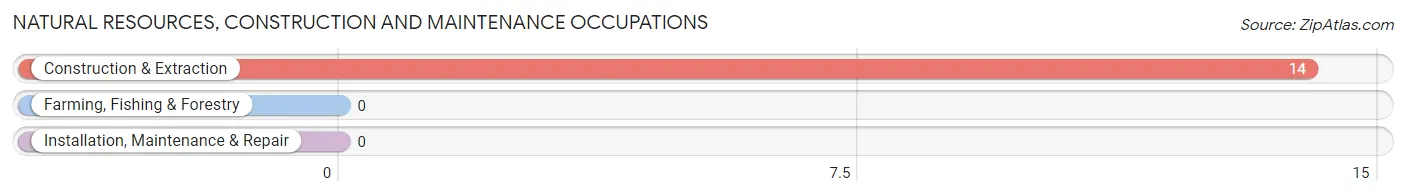
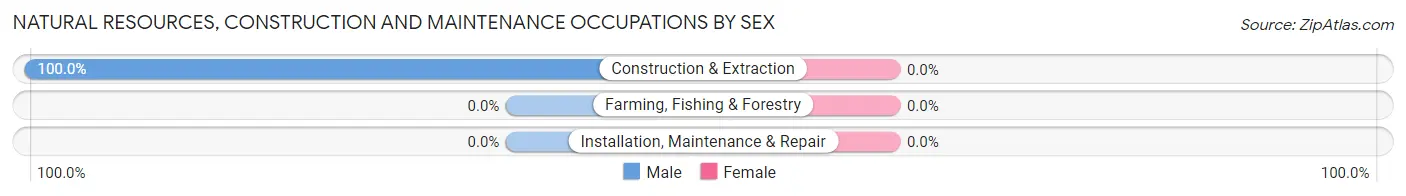
Natural Resources, Construction and Maintenance Occupations by Sex
| Occupation | Male | Female |
| Farming, Fishing & Forestry | 0 (0.0%) | 0 (0.0%) |
| Construction & Extraction | 14 (100.0%) | 0 (0.0%) |
| Installation, Maintenance & Repair | 0 (0.0%) | 0 (0.0%) |
| Total (Category) | 14 (100.0%) | 0 (0.0%) |
| Total (Overall) | 174 (45.7%) | 207 (54.3%) |
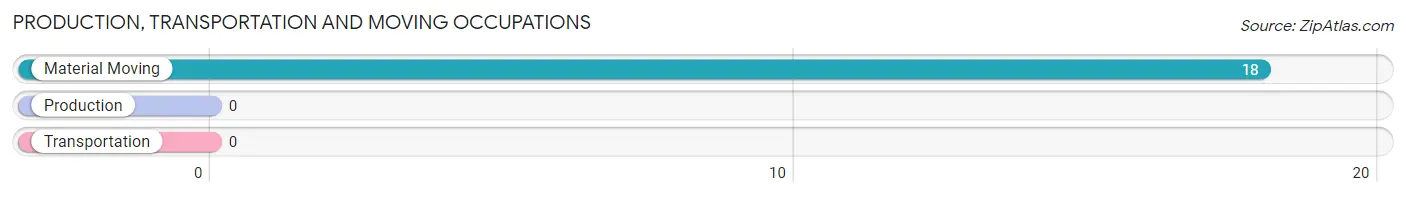
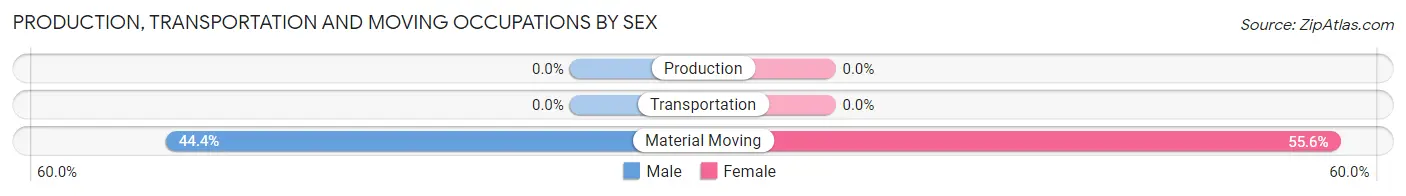
Production, Transportation and Moving Occupations
The most common Production, Transportation and Moving occupations in Norwich are , and Material Moving (18 | 4.7%).
Production, Transportation and Moving Occupations by Sex
| Occupation | Male | Female |
| Production | 0 (0.0%) | 0 (0.0%) |
| Transportation | 0 (0.0%) | 0 (0.0%) |
| Material Moving | 8 (44.4%) | 10 (55.6%) |
| Total (Category) | 8 (44.4%) | 10 (55.6%) |
| Total (Overall) | 174 (45.7%) | 207 (54.3%) |
Employment Industries by Sex in Norwich
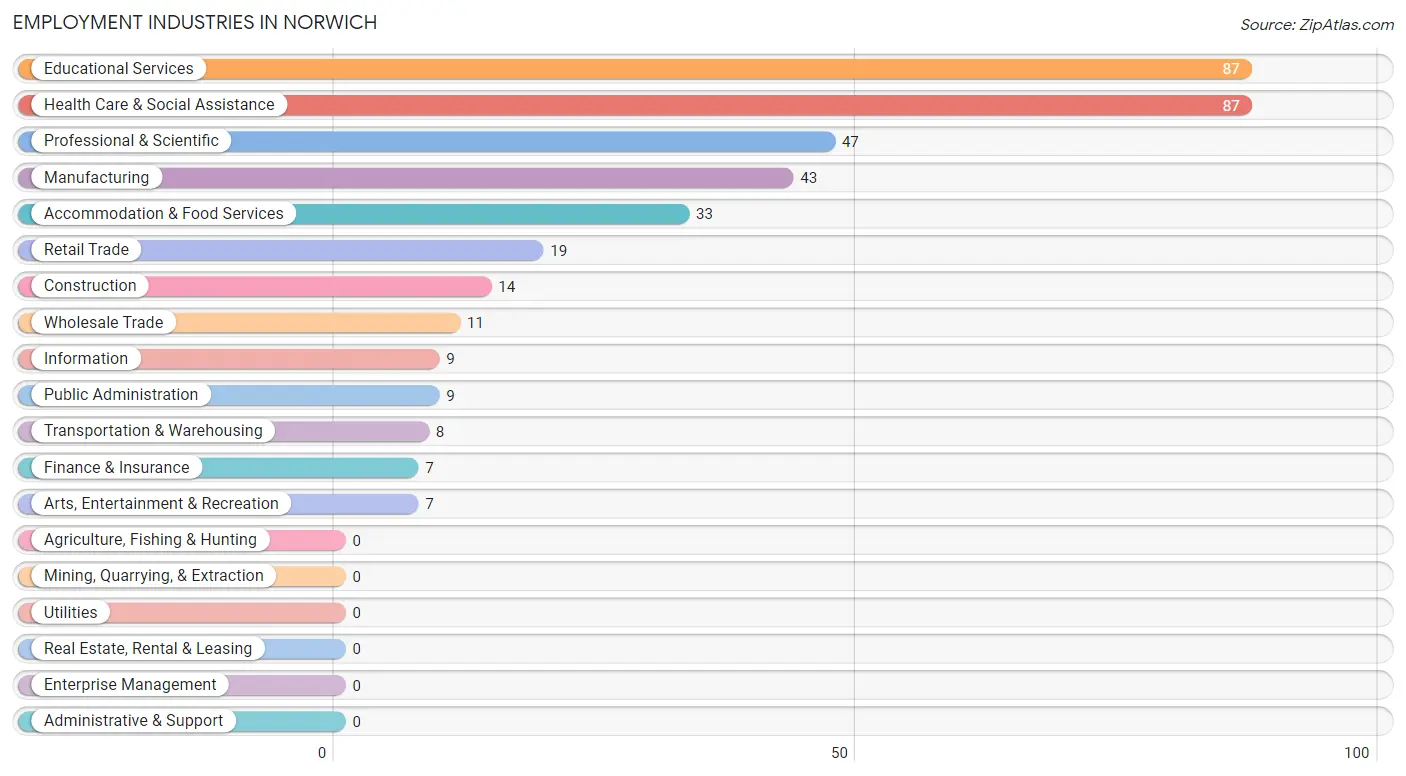
Employment Industries in Norwich
The major employment industries in Norwich include Educational Services (87 | 22.8%), Health Care & Social Assistance (87 | 22.8%), Professional & Scientific (47 | 12.3%), Manufacturing (43 | 11.3%), and Accommodation & Food Services (33 | 8.7%).
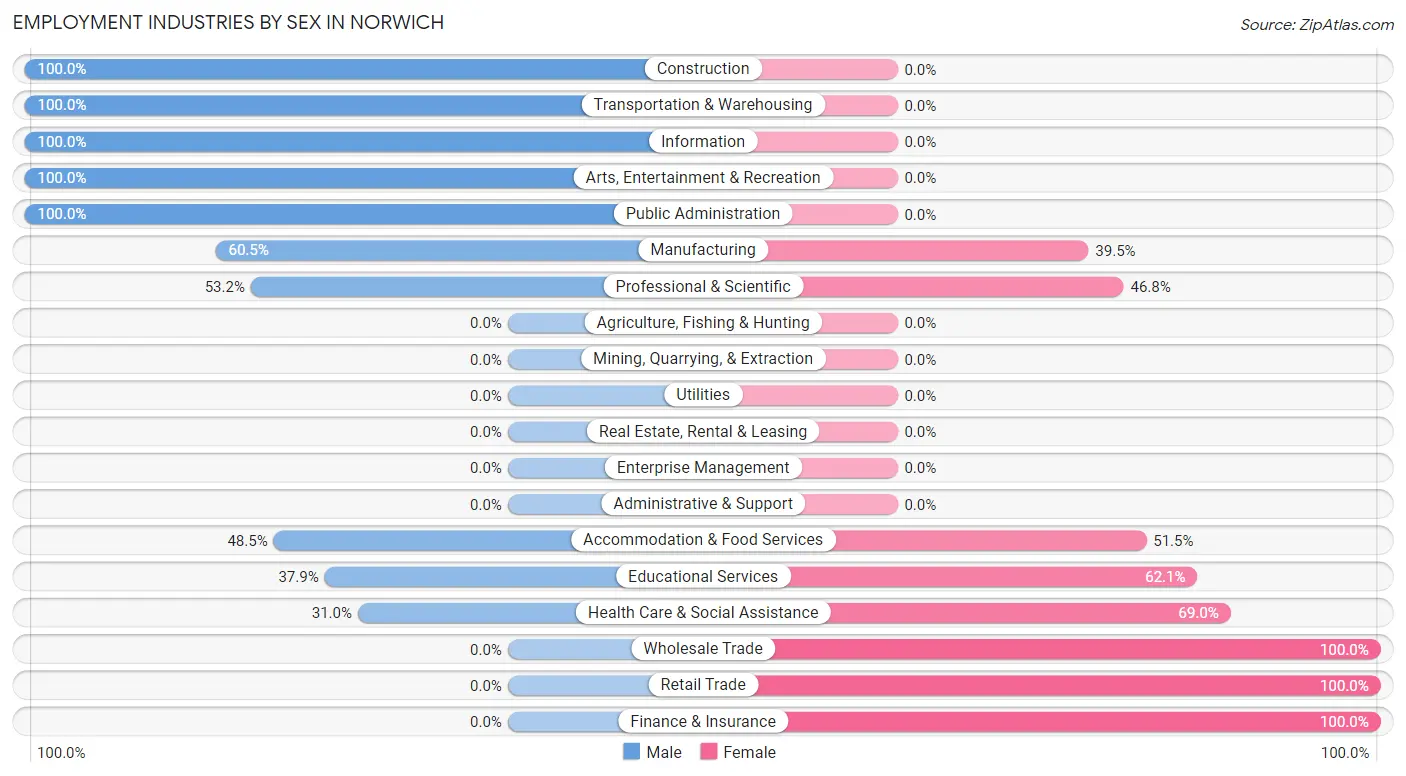
Employment Industries by Sex in Norwich
The Norwich industries that see more men than women are Construction (100.0%), Transportation & Warehousing (100.0%), and Information (100.0%), whereas the industries that tend to have a higher number of women are Wholesale Trade (100.0%), Retail Trade (100.0%), and Finance & Insurance (100.0%).
| Industry | Male | Female |
| Agriculture, Fishing & Hunting | 0 (0.0%) | 0 (0.0%) |
| Mining, Quarrying, & Extraction | 0 (0.0%) | 0 (0.0%) |
| Construction | 14 (100.0%) | 0 (0.0%) |
| Manufacturing | 26 (60.5%) | 17 (39.5%) |
| Wholesale Trade | 0 (0.0%) | 11 (100.0%) |
| Retail Trade | 0 (0.0%) | 19 (100.0%) |
| Transportation & Warehousing | 8 (100.0%) | 0 (0.0%) |
| Utilities | 0 (0.0%) | 0 (0.0%) |
| Information | 9 (100.0%) | 0 (0.0%) |
| Finance & Insurance | 0 (0.0%) | 7 (100.0%) |
| Real Estate, Rental & Leasing | 0 (0.0%) | 0 (0.0%) |
| Professional & Scientific | 25 (53.2%) | 22 (46.8%) |
| Enterprise Management | 0 (0.0%) | 0 (0.0%) |
| Administrative & Support | 0 (0.0%) | 0 (0.0%) |
| Educational Services | 33 (37.9%) | 54 (62.1%) |
| Health Care & Social Assistance | 27 (31.0%) | 60 (69.0%) |
| Arts, Entertainment & Recreation | 7 (100.0%) | 0 (0.0%) |
| Accommodation & Food Services | 16 (48.5%) | 17 (51.5%) |
| Public Administration | 9 (100.0%) | 0 (0.0%) |
| Total | 174 (45.7%) | 207 (54.3%) |
Education in Norwich
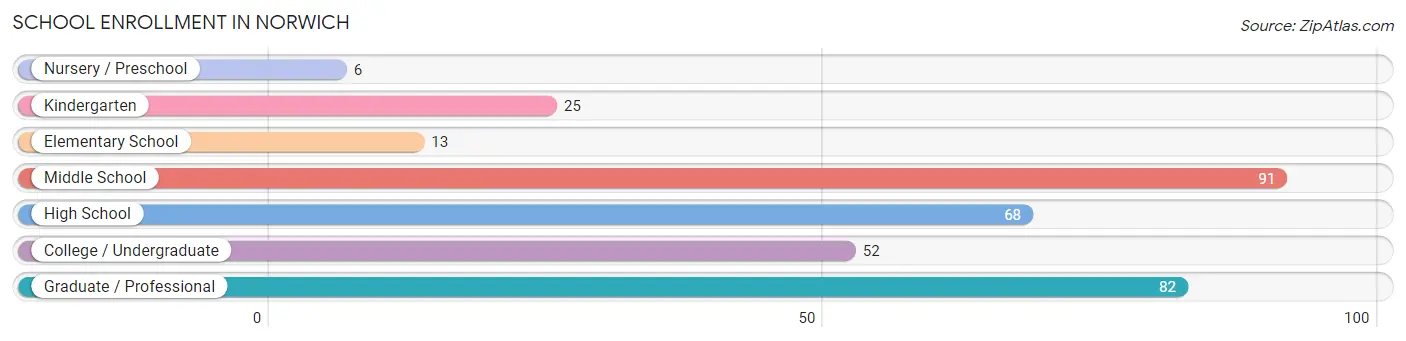
School Enrollment in Norwich
The most common levels of schooling among the 337 students in Norwich are middle school (91 | 27.0%), graduate / professional (82 | 24.3%), and high school (68 | 20.2%).
| School Level | # Students | % Students |
| Nursery / Preschool | 6 | 1.8% |
| Kindergarten | 25 | 7.4% |
| Elementary School | 13 | 3.9% |
| Middle School | 91 | 27.0% |
| High School | 68 | 20.2% |
| College / Undergraduate | 52 | 15.4% |
| Graduate / Professional | 82 | 24.3% |
| Total | 337 | 100.0% |
School Enrollment by Age by Funding Source in Norwich
Out of a total of 337 students who are enrolled in schools in Norwich, 149 (44.2%) attend a private institution, while the remaining 188 (55.8%) are enrolled in public schools. The age group of 3 to 4 year olds has the highest likelihood of being enrolled in private schools, with 6 (100.0% in the age bracket) enrolled. Conversely, the age group of 5 to 9 year old has the lowest likelihood of being enrolled in a private school, with 38 (100.0% in the age bracket) attending a public institution.
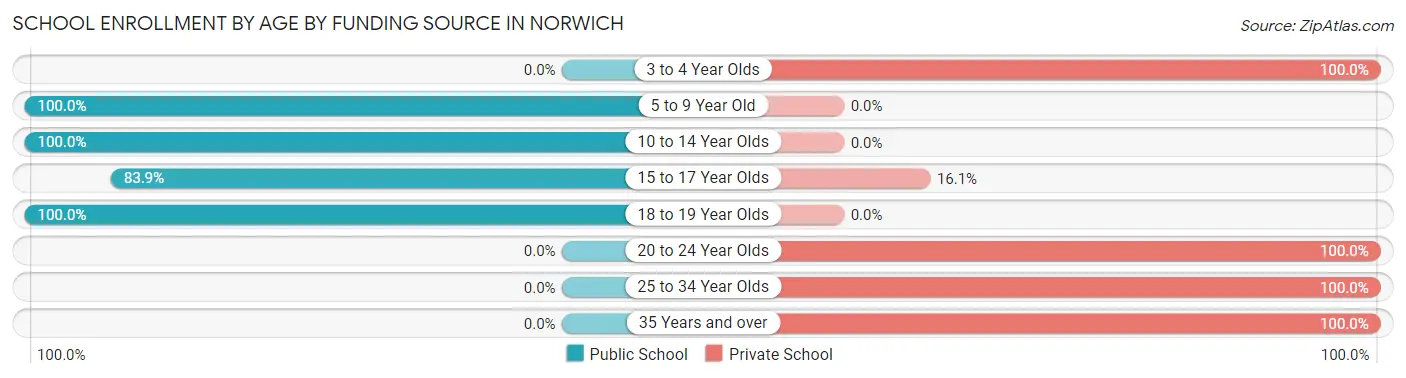
| Age Bracket | Public School | Private School |
| 3 to 4 Year Olds | 0 (0.0%) | 6 (100.0%) |
| 5 to 9 Year Old | 38 (100.0%) | 0 (0.0%) |
| 10 to 14 Year Olds | 91 (100.0%) | 0 (0.0%) |
| 15 to 17 Year Olds | 47 (83.9%) | 9 (16.1%) |
| 18 to 19 Year Olds | 12 (100.0%) | 0 (0.0%) |
| 20 to 24 Year Olds | 0 (0.0%) | 110 (100.0%) |
| 25 to 34 Year Olds | 0 (0.0%) | 8 (100.0%) |
| 35 Years and over | 0 (0.0%) | 16 (100.0%) |
| Total | 188 (55.8%) | 149 (44.2%) |
Educational Attainment by Field of Study in Norwich
Bio, nature & agricultural (71 | 14.3%), social sciences (70 | 14.1%), visual & performing arts (66 | 13.3%), science & technology (61 | 12.3%), and literature & languages (54 | 10.9%) are the most common fields of study among 497 individuals in Norwich who have obtained a bachelor's degree or higher.
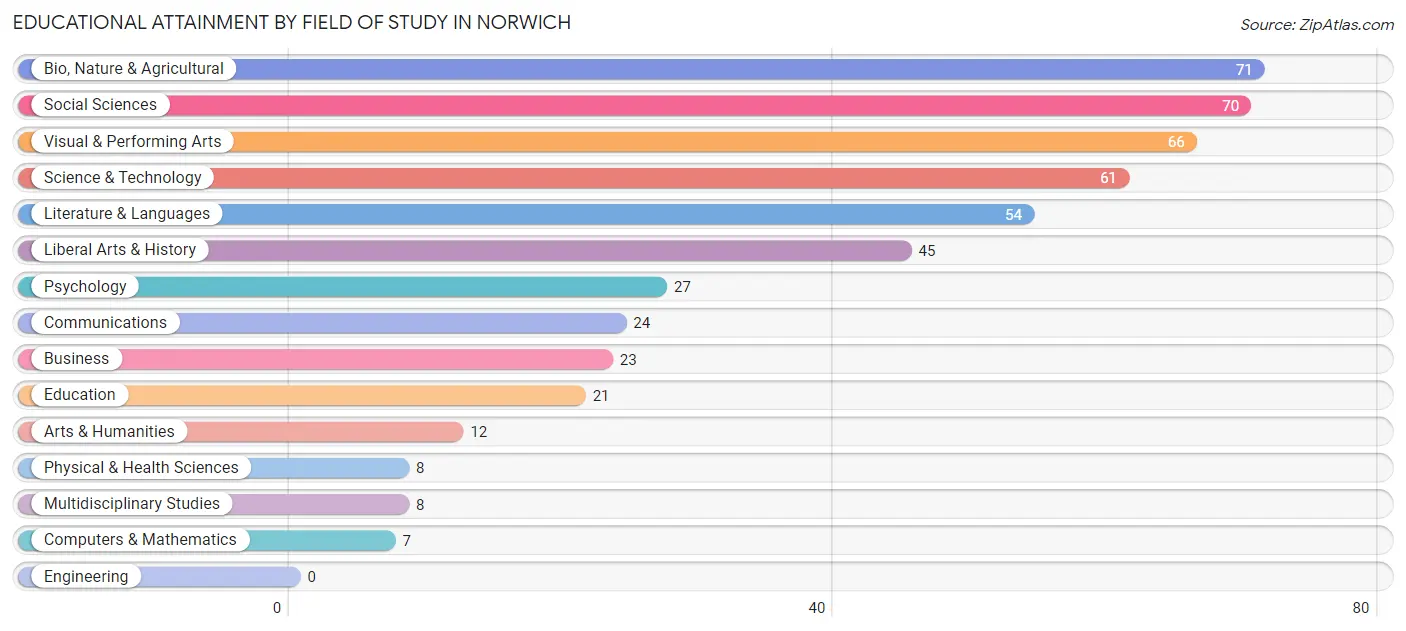
| Field of Study | # Graduates | % Graduates |
| Computers & Mathematics | 7 | 1.4% |
| Bio, Nature & Agricultural | 71 | 14.3% |
| Physical & Health Sciences | 8 | 1.6% |
| Psychology | 27 | 5.4% |
| Social Sciences | 70 | 14.1% |
| Engineering | 0 | 0.0% |
| Multidisciplinary Studies | 8 | 1.6% |
| Science & Technology | 61 | 12.3% |
| Business | 23 | 4.6% |
| Education | 21 | 4.2% |
| Literature & Languages | 54 | 10.9% |
| Liberal Arts & History | 45 | 9.0% |
| Visual & Performing Arts | 66 | 13.3% |
| Communications | 24 | 4.8% |
| Arts & Humanities | 12 | 2.4% |
| Total | 497 | 100.0% |
Transportation & Commute in Norwich
Vehicle Availability by Sex in Norwich
The most prevalent vehicle ownership categories in Norwich are males with 2 vehicles (75, accounting for 43.1%) and females with 2 vehicles (64, making up 36.8%).
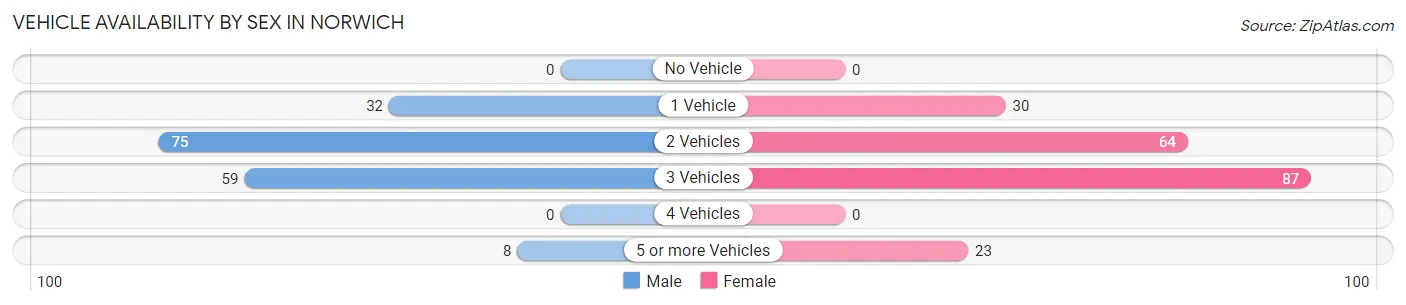
| Vehicles Available | Male | Female |
| No Vehicle | 0 (0.0%) | 0 (0.0%) |
| 1 Vehicle | 32 (18.4%) | 30 (14.7%) |
| 2 Vehicles | 75 (43.1%) | 64 (31.4%) |
| 3 Vehicles | 59 (33.9%) | 87 (42.6%) |
| 4 Vehicles | 0 (0.0%) | 0 (0.0%) |
| 5 or more Vehicles | 8 (4.6%) | 23 (11.3%) |
| Total | 174 (100.0%) | 204 (100.0%) |
Commute Time in Norwich
The most frequently occuring commute durations in Norwich are 10 to 14 minutes (99 commuters, 30.6%), 5 to 9 minutes (63 commuters, 19.5%), and 15 to 19 minutes (50 commuters, 15.5%).
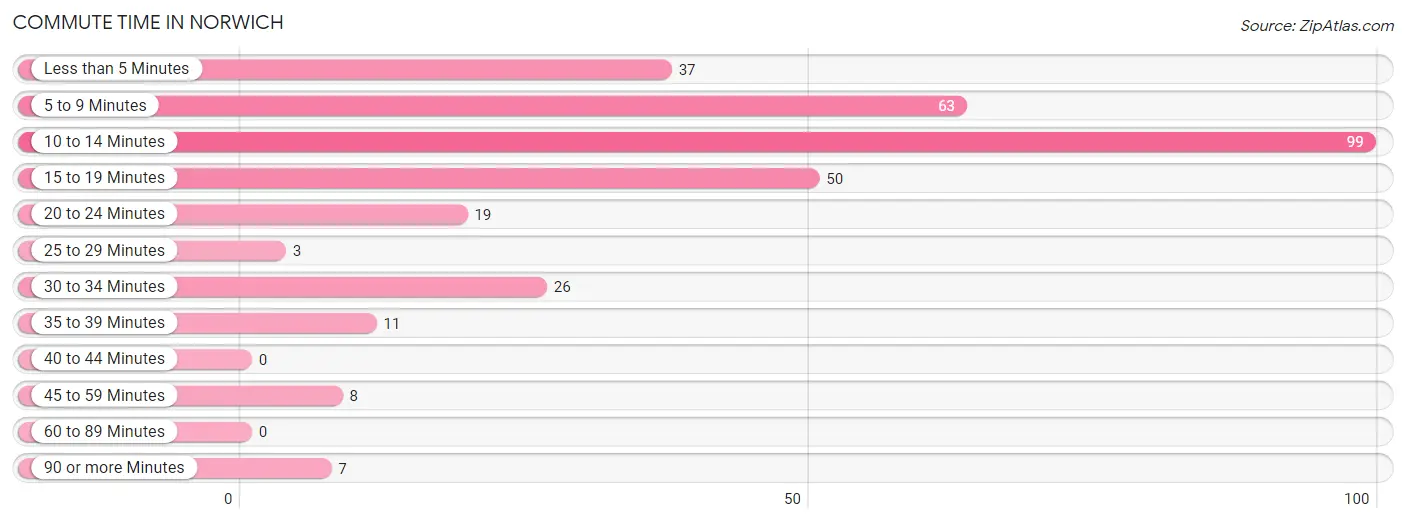
| Commute Time | # Commuters | % Commuters |
| Less than 5 Minutes | 37 | 11.5% |
| 5 to 9 Minutes | 63 | 19.5% |
| 10 to 14 Minutes | 99 | 30.6% |
| 15 to 19 Minutes | 50 | 15.5% |
| 20 to 24 Minutes | 19 | 5.9% |
| 25 to 29 Minutes | 3 | 0.9% |
| 30 to 34 Minutes | 26 | 8.1% |
| 35 to 39 Minutes | 11 | 3.4% |
| 40 to 44 Minutes | 0 | 0.0% |
| 45 to 59 Minutes | 8 | 2.5% |
| 60 to 89 Minutes | 0 | 0.0% |
| 90 or more Minutes | 7 | 2.2% |
Commute Time by Sex in Norwich
The most common commute times in Norwich are 5 to 9 minutes (56 commuters, 33.5%) for males and 10 to 14 minutes (76 commuters, 48.7%) for females.
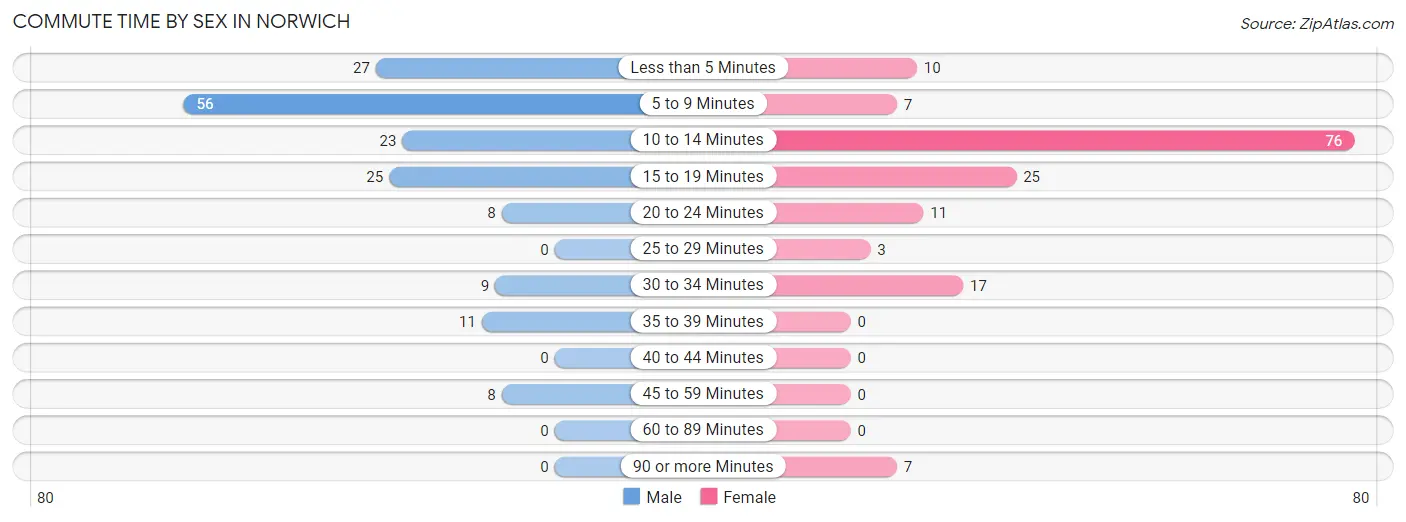
| Commute Time | Male | Female |
| Less than 5 Minutes | 27 (16.2%) | 10 (6.4%) |
| 5 to 9 Minutes | 56 (33.5%) | 7 (4.5%) |
| 10 to 14 Minutes | 23 (13.8%) | 76 (48.7%) |
| 15 to 19 Minutes | 25 (15.0%) | 25 (16.0%) |
| 20 to 24 Minutes | 8 (4.8%) | 11 (7.0%) |
| 25 to 29 Minutes | 0 (0.0%) | 3 (1.9%) |
| 30 to 34 Minutes | 9 (5.4%) | 17 (10.9%) |
| 35 to 39 Minutes | 11 (6.6%) | 0 (0.0%) |
| 40 to 44 Minutes | 0 (0.0%) | 0 (0.0%) |
| 45 to 59 Minutes | 8 (4.8%) | 0 (0.0%) |
| 60 to 89 Minutes | 0 (0.0%) | 0 (0.0%) |
| 90 or more Minutes | 0 (0.0%) | 7 (4.5%) |
Time of Departure to Work by Sex in Norwich
The most frequent times of departure to work in Norwich are 8:00 AM to 8:29 AM (61, 36.5%) for males and 8:00 AM to 8:29 AM (32, 20.5%) for females.
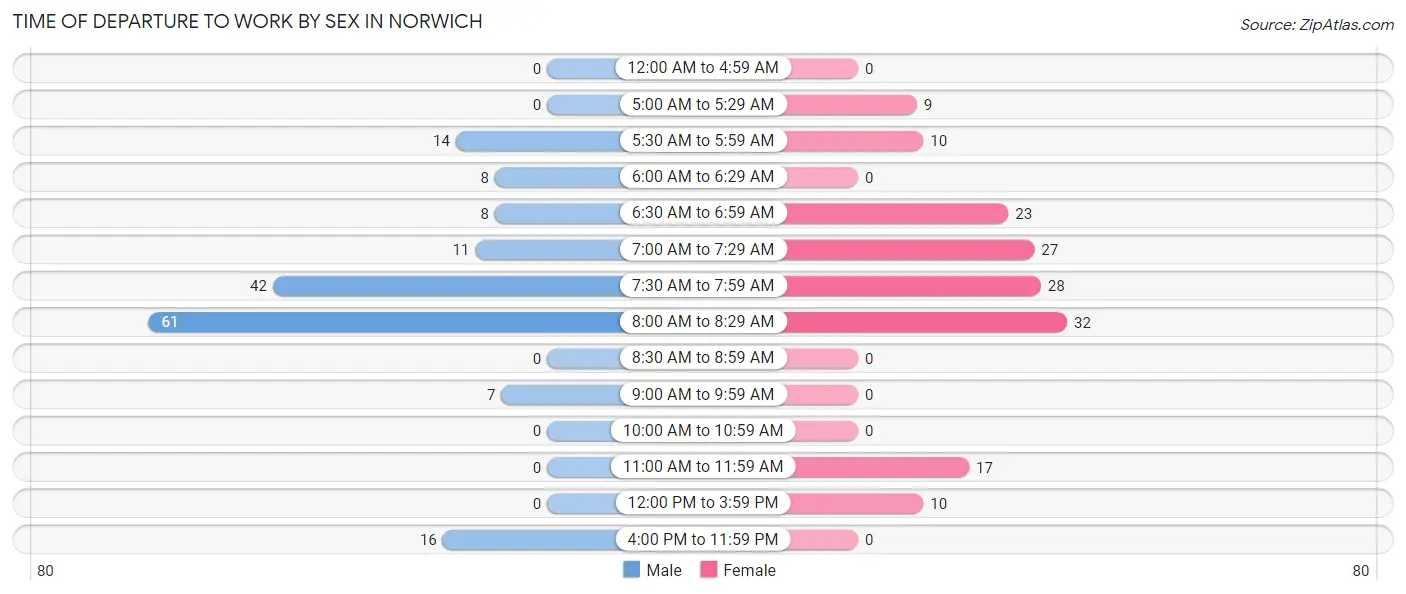
| Time of Departure | Male | Female |
| 12:00 AM to 4:59 AM | 0 (0.0%) | 0 (0.0%) |
| 5:00 AM to 5:29 AM | 0 (0.0%) | 9 (5.8%) |
| 5:30 AM to 5:59 AM | 14 (8.4%) | 10 (6.4%) |
| 6:00 AM to 6:29 AM | 8 (4.8%) | 0 (0.0%) |
| 6:30 AM to 6:59 AM | 8 (4.8%) | 23 (14.7%) |
| 7:00 AM to 7:29 AM | 11 (6.6%) | 27 (17.3%) |
| 7:30 AM to 7:59 AM | 42 (25.2%) | 28 (17.9%) |
| 8:00 AM to 8:29 AM | 61 (36.5%) | 32 (20.5%) |
| 8:30 AM to 8:59 AM | 0 (0.0%) | 0 (0.0%) |
| 9:00 AM to 9:59 AM | 7 (4.2%) | 0 (0.0%) |
| 10:00 AM to 10:59 AM | 0 (0.0%) | 0 (0.0%) |
| 11:00 AM to 11:59 AM | 0 (0.0%) | 17 (10.9%) |
| 12:00 PM to 3:59 PM | 0 (0.0%) | 10 (6.4%) |
| 4:00 PM to 11:59 PM | 16 (9.6%) | 0 (0.0%) |
| Total | 167 (100.0%) | 156 (100.0%) |
Housing Occupancy in Norwich
Occupancy by Ownership in Norwich
Of the total 306 dwellings in Norwich, owner-occupied units account for 189 (61.8%), while renter-occupied units make up 117 (38.2%).
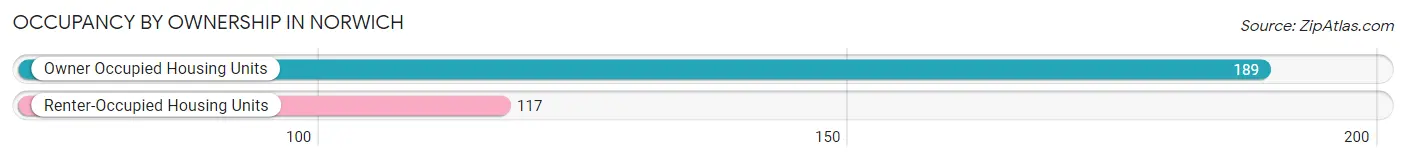
| Occupancy | # Housing Units | % Housing Units |
| Owner Occupied Housing Units | 189 | 61.8% |
| Renter-Occupied Housing Units | 117 | 38.2% |
| Total Occupied Housing Units | 306 | 100.0% |
Occupancy by Household Size in Norwich
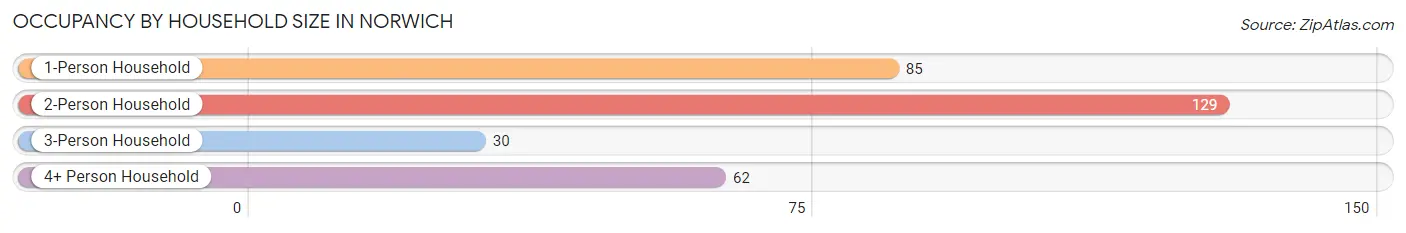
| Household Size | # Housing Units | % Housing Units |
| 1-Person Household | 85 | 27.8% |
| 2-Person Household | 129 | 42.2% |
| 3-Person Household | 30 | 9.8% |
| 4+ Person Household | 62 | 20.3% |
| Total Housing Units | 306 | 100.0% |
Occupancy by Ownership by Household Size in Norwich
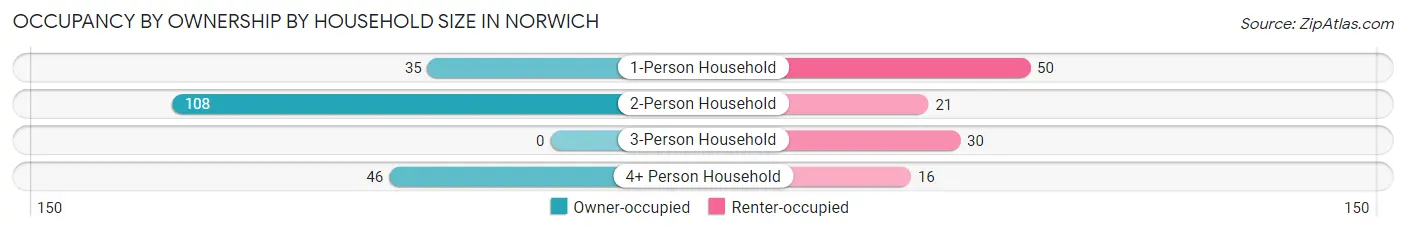
| Household Size | Owner-occupied | Renter-occupied |
| 1-Person Household | 35 (41.2%) | 50 (58.8%) |
| 2-Person Household | 108 (83.7%) | 21 (16.3%) |
| 3-Person Household | 0 (0.0%) | 30 (100.0%) |
| 4+ Person Household | 46 (74.2%) | 16 (25.8%) |
| Total Housing Units | 189 (61.8%) | 117 (38.2%) |
Occupancy by Educational Attainment in Norwich
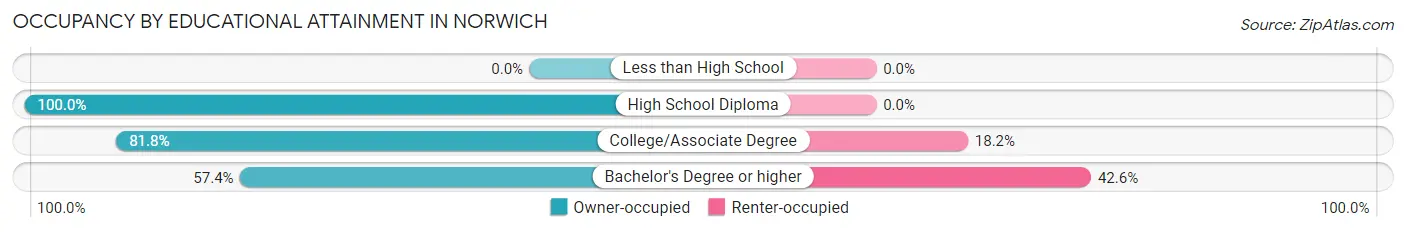
| Household Size | Owner-occupied | Renter-occupied |
| Less than High School | 0 (0.0%) | 0 (0.0%) |
| High School Diploma | 25 (100.0%) | 0 (0.0%) |
| College/Associate Degree | 9 (81.8%) | 2 (18.2%) |
| Bachelor's Degree or higher | 155 (57.4%) | 115 (42.6%) |
Occupancy by Age of Householder in Norwich
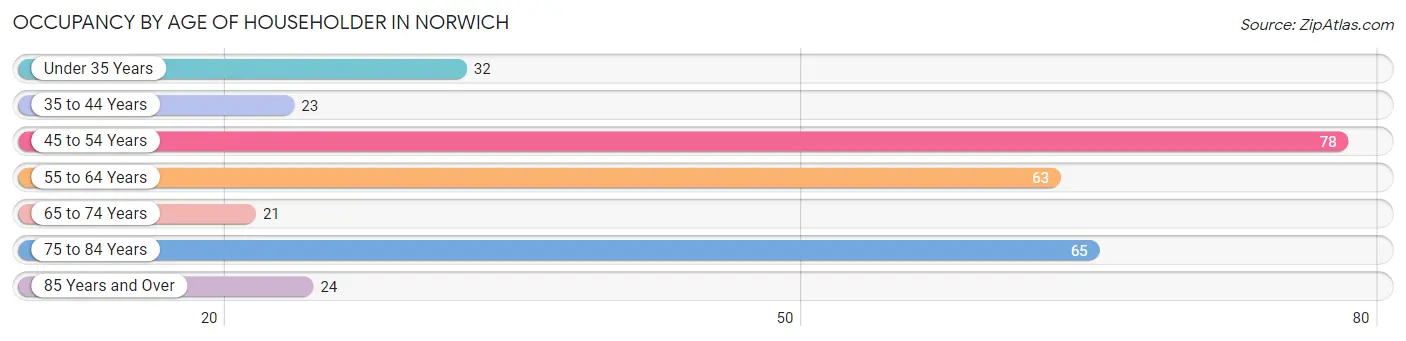
| Age Bracket | # Households | % Households |
| Under 35 Years | 32 | 10.5% |
| 35 to 44 Years | 23 | 7.5% |
| 45 to 54 Years | 78 | 25.5% |
| 55 to 64 Years | 63 | 20.6% |
| 65 to 74 Years | 21 | 6.9% |
| 75 to 84 Years | 65 | 21.2% |
| 85 Years and Over | 24 | 7.8% |
| Total | 306 | 100.0% |
Housing Finances in Norwich
Median Income by Occupancy in Norwich
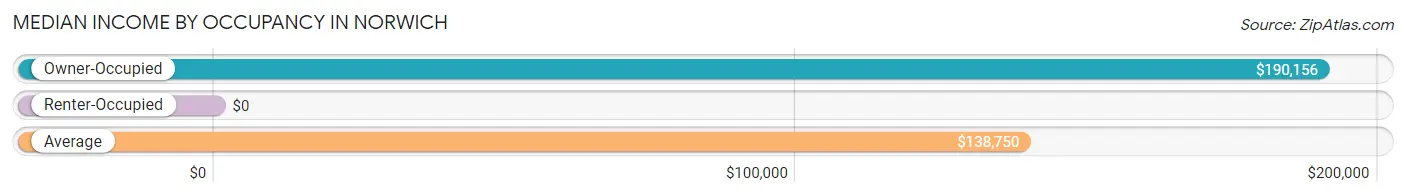
| Occupancy Type | # Households | Median Income |
| Owner-Occupied | 189 (61.8%) | $190,156 |
| Renter-Occupied | 117 (38.2%) | $0 |
| Average | 306 (100.0%) | $138,750 |
Occupancy by Householder Income Bracket in Norwich
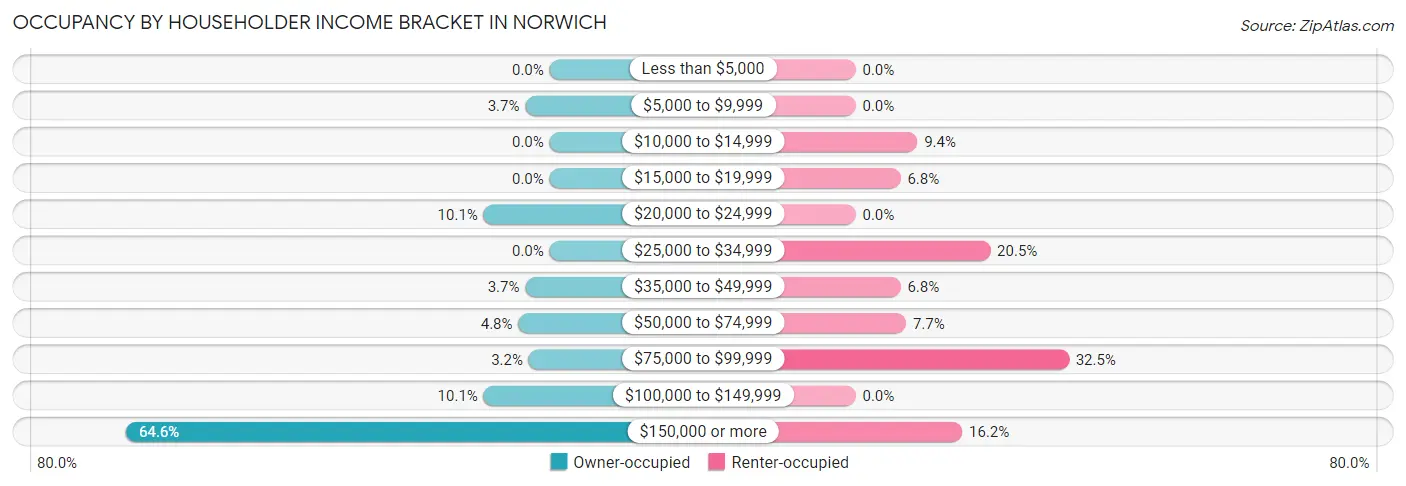
| Income Bracket | Owner-occupied | Renter-occupied |
| Less than $5,000 | 0 (0.0%) | 0 (0.0%) |
| $5,000 to $9,999 | 7 (3.7%) | 0 (0.0%) |
| $10,000 to $14,999 | 0 (0.0%) | 11 (9.4%) |
| $15,000 to $19,999 | 0 (0.0%) | 8 (6.8%) |
| $20,000 to $24,999 | 19 (10.1%) | 0 (0.0%) |
| $25,000 to $34,999 | 0 (0.0%) | 24 (20.5%) |
| $35,000 to $49,999 | 7 (3.7%) | 8 (6.8%) |
| $50,000 to $74,999 | 9 (4.8%) | 9 (7.7%) |
| $75,000 to $99,999 | 6 (3.2%) | 38 (32.5%) |
| $100,000 to $149,999 | 19 (10.1%) | 0 (0.0%) |
| $150,000 or more | 122 (64.5%) | 19 (16.2%) |
| Total | 189 (100.0%) | 117 (100.0%) |
Monthly Housing Cost Tiers in Norwich
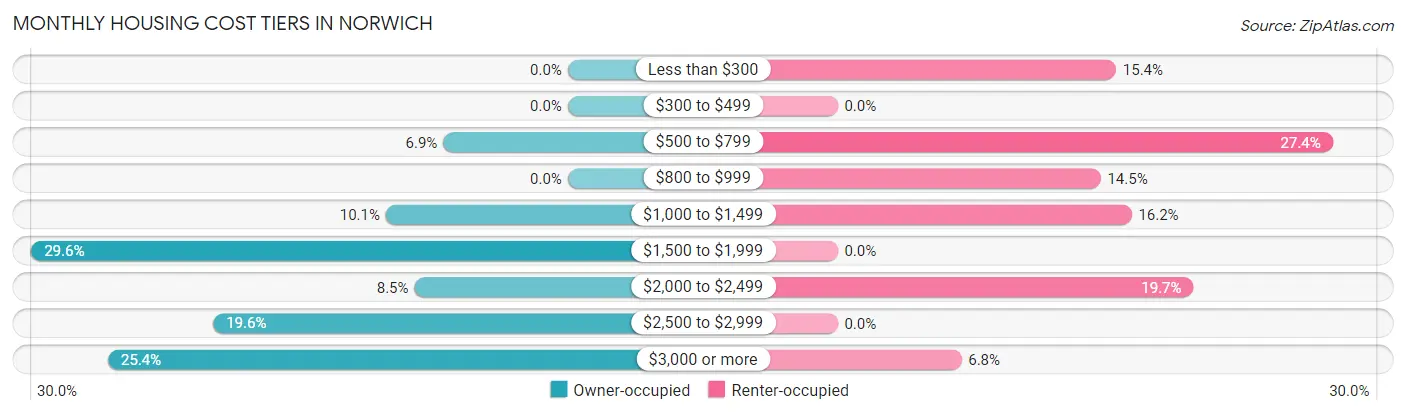
| Monthly Cost | Owner-occupied | Renter-occupied |
| Less than $300 | 0 (0.0%) | 18 (15.4%) |
| $300 to $499 | 0 (0.0%) | 0 (0.0%) |
| $500 to $799 | 13 (6.9%) | 32 (27.4%) |
| $800 to $999 | 0 (0.0%) | 17 (14.5%) |
| $1,000 to $1,499 | 19 (10.1%) | 19 (16.2%) |
| $1,500 to $1,999 | 56 (29.6%) | 0 (0.0%) |
| $2,000 to $2,499 | 16 (8.5%) | 23 (19.7%) |
| $2,500 to $2,999 | 37 (19.6%) | 0 (0.0%) |
| $3,000 or more | 48 (25.4%) | 8 (6.8%) |
| Total | 189 (100.0%) | 117 (100.0%) |
Physical Housing Characteristics in Norwich
Housing Structures in Norwich
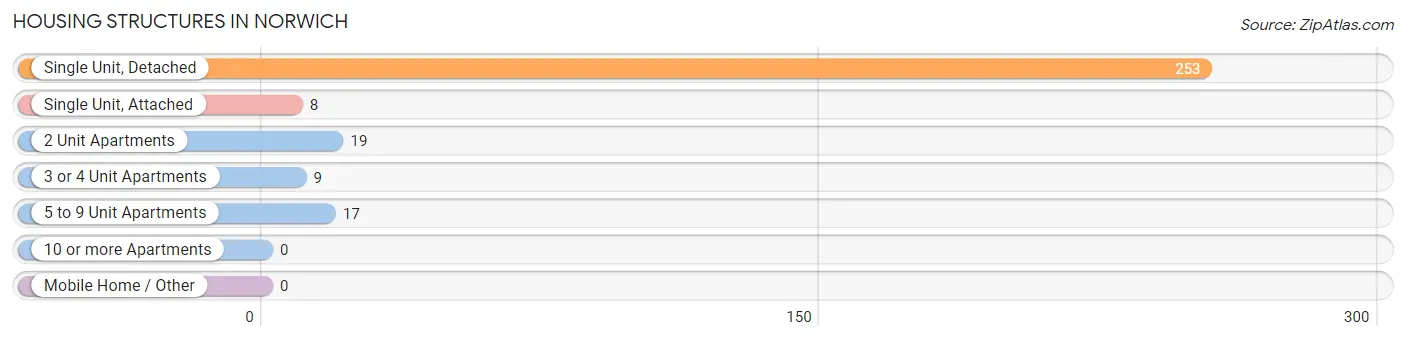
| Structure Type | # Housing Units | % Housing Units |
| Single Unit, Detached | 253 | 82.7% |
| Single Unit, Attached | 8 | 2.6% |
| 2 Unit Apartments | 19 | 6.2% |
| 3 or 4 Unit Apartments | 9 | 2.9% |
| 5 to 9 Unit Apartments | 17 | 5.6% |
| 10 or more Apartments | 0 | 0.0% |
| Mobile Home / Other | 0 | 0.0% |
| Total | 306 | 100.0% |
Housing Structures by Occupancy in Norwich
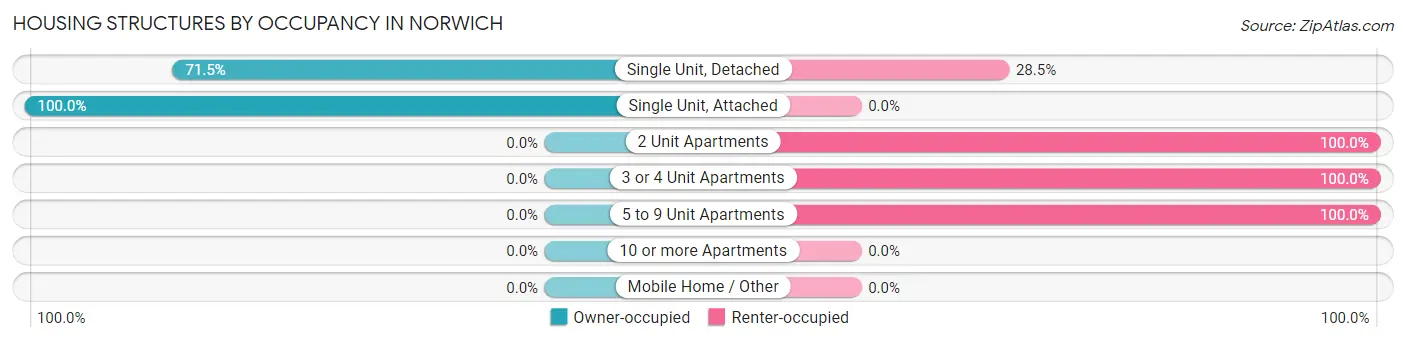
| Structure Type | Owner-occupied | Renter-occupied |
| Single Unit, Detached | 181 (71.5%) | 72 (28.5%) |
| Single Unit, Attached | 8 (100.0%) | 0 (0.0%) |
| 2 Unit Apartments | 0 (0.0%) | 19 (100.0%) |
| 3 or 4 Unit Apartments | 0 (0.0%) | 9 (100.0%) |
| 5 to 9 Unit Apartments | 0 (0.0%) | 17 (100.0%) |
| 10 or more Apartments | 0 (0.0%) | 0 (0.0%) |
| Mobile Home / Other | 0 (0.0%) | 0 (0.0%) |
| Total | 189 (61.8%) | 117 (38.2%) |
Housing Structures by Number of Rooms in Norwich
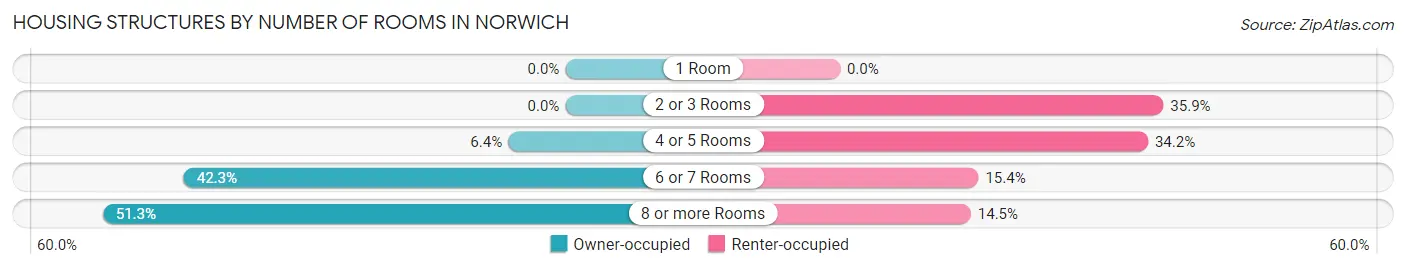
| Number of Rooms | Owner-occupied | Renter-occupied |
| 1 Room | 0 (0.0%) | 0 (0.0%) |
| 2 or 3 Rooms | 0 (0.0%) | 42 (35.9%) |
| 4 or 5 Rooms | 12 (6.4%) | 40 (34.2%) |
| 6 or 7 Rooms | 80 (42.3%) | 18 (15.4%) |
| 8 or more Rooms | 97 (51.3%) | 17 (14.5%) |
| Total | 189 (100.0%) | 117 (100.0%) |
Housing Structure by Heating Type in Norwich
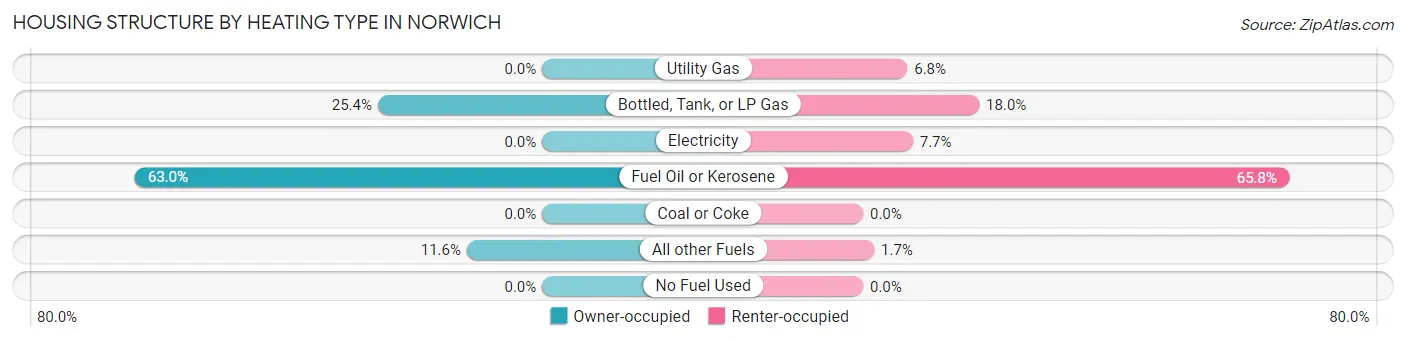
| Heating Type | Owner-occupied | Renter-occupied |
| Utility Gas | 0 (0.0%) | 8 (6.8%) |
| Bottled, Tank, or LP Gas | 48 (25.4%) | 21 (17.9%) |
| Electricity | 0 (0.0%) | 9 (7.7%) |
| Fuel Oil or Kerosene | 119 (63.0%) | 77 (65.8%) |
| Coal or Coke | 0 (0.0%) | 0 (0.0%) |
| All other Fuels | 22 (11.6%) | 2 (1.7%) |
| No Fuel Used | 0 (0.0%) | 0 (0.0%) |
| Total | 189 (100.0%) | 117 (100.0%) |
Household Vehicle Usage in Norwich
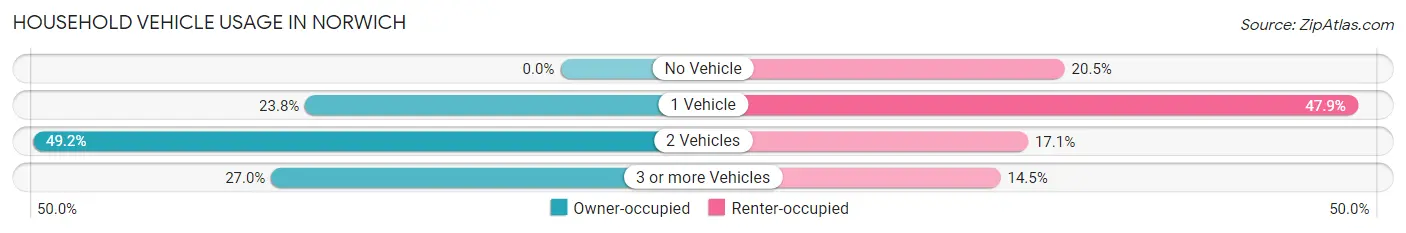
| Vehicles per Household | Owner-occupied | Renter-occupied |
| No Vehicle | 0 (0.0%) | 24 (20.5%) |
| 1 Vehicle | 45 (23.8%) | 56 (47.9%) |
| 2 Vehicles | 93 (49.2%) | 20 (17.1%) |
| 3 or more Vehicles | 51 (27.0%) | 17 (14.5%) |
| Total | 189 (100.0%) | 117 (100.0%) |
Real Estate & Mortgages in Norwich
Real Estate and Mortgage Overview in Norwich
| Characteristic | Without Mortgage | With Mortgage |
| Housing Units | 90 | 99 |
| Median Property Value | $622,400 | $579,500 |
| Median Household Income | $139,375 | $87 |
| Monthly Housing Costs | $1,501 | $48 |
| Real Estate Taxes | $10,001 | $0 |
Property Value by Mortgage Status in Norwich
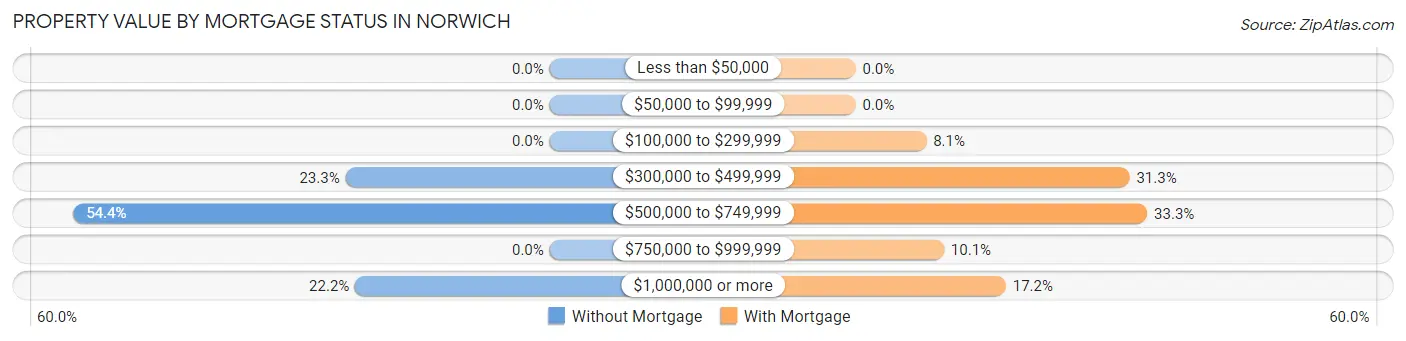
| Property Value | Without Mortgage | With Mortgage |
| Less than $50,000 | 0 (0.0%) | 0 (0.0%) |
| $50,000 to $99,999 | 0 (0.0%) | 0 (0.0%) |
| $100,000 to $299,999 | 0 (0.0%) | 8 (8.1%) |
| $300,000 to $499,999 | 21 (23.3%) | 31 (31.3%) |
| $500,000 to $749,999 | 49 (54.4%) | 33 (33.3%) |
| $750,000 to $999,999 | 0 (0.0%) | 10 (10.1%) |
| $1,000,000 or more | 20 (22.2%) | 17 (17.2%) |
| Total | 90 (100.0%) | 99 (100.0%) |
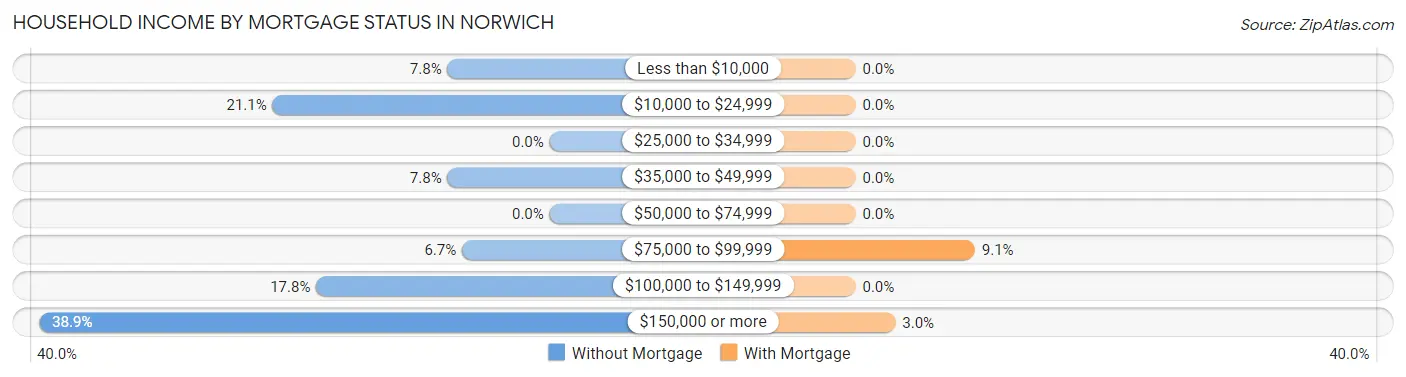
Household Income by Mortgage Status in Norwich
| Household Income | Without Mortgage | With Mortgage |
| Less than $10,000 | 7 (7.8%) | 0 (0.0%) |
| $10,000 to $24,999 | 19 (21.1%) | 0 (0.0%) |
| $25,000 to $34,999 | 0 (0.0%) | 0 (0.0%) |
| $35,000 to $49,999 | 7 (7.8%) | 0 (0.0%) |
| $50,000 to $74,999 | 0 (0.0%) | 0 (0.0%) |
| $75,000 to $99,999 | 6 (6.7%) | 9 (9.1%) |
| $100,000 to $149,999 | 16 (17.8%) | 0 (0.0%) |
| $150,000 or more | 35 (38.9%) | 3 (3.0%) |
| Total | 90 (100.0%) | 99 (100.0%) |
Property Value to Household Income Ratio in Norwich
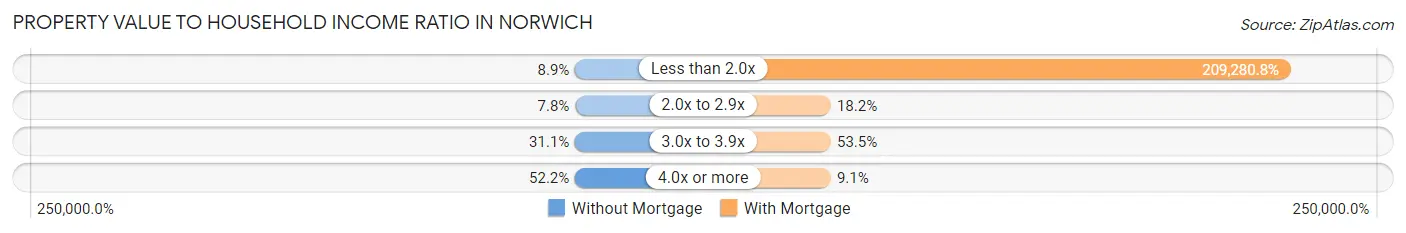
| Value-to-Income Ratio | Without Mortgage | With Mortgage |
| Less than 2.0x | 8 (8.9%) | 207,188 (209,280.8%) |
| 2.0x to 2.9x | 7 (7.8%) | 18 (18.2%) |
| 3.0x to 3.9x | 28 (31.1%) | 53 (53.5%) |
| 4.0x or more | 47 (52.2%) | 9 (9.1%) |
| Total | 90 (100.0%) | 99 (100.0%) |
Real Estate Taxes by Mortgage Status in Norwich
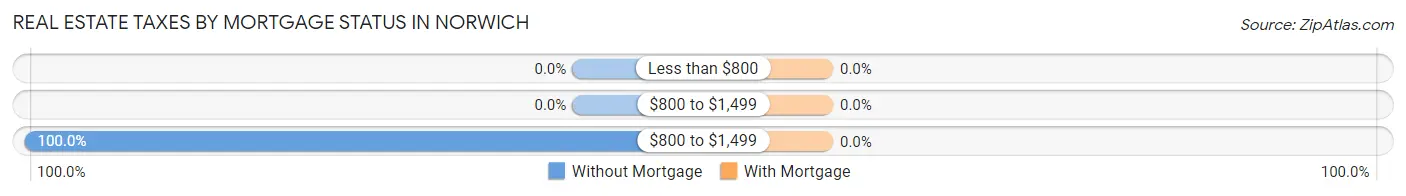
| Property Taxes | Without Mortgage | With Mortgage |
| Less than $800 | 0 (0.0%) | 0 (0.0%) |
| $800 to $1,499 | 0 (0.0%) | 0 (0.0%) |
| $800 to $1,499 | 90 (100.0%) | 0 (0.0%) |
| Total | 90 (100.0%) | 99 (100.0%) |
Health & Disability in Norwich
Health Insurance Coverage by Age in Norwich
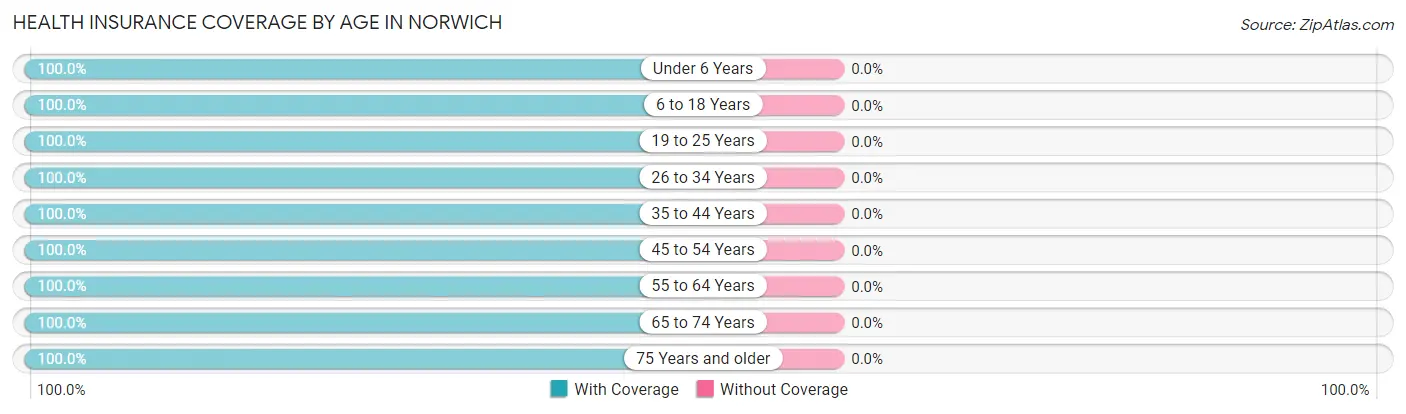
| Age Bracket | With Coverage | Without Coverage |
| Under 6 Years | 10 (100.0%) | 0 (0.0%) |
| 6 to 18 Years | 210 (100.0%) | 0 (0.0%) |
| 19 to 25 Years | 118 (100.0%) | 0 (0.0%) |
| 26 to 34 Years | 42 (100.0%) | 0 (0.0%) |
| 35 to 44 Years | 73 (100.0%) | 0 (0.0%) |
| 45 to 54 Years | 134 (100.0%) | 0 (0.0%) |
| 55 to 64 Years | 115 (100.0%) | 0 (0.0%) |
| 65 to 74 Years | 36 (100.0%) | 0 (0.0%) |
| 75 Years and older | 101 (100.0%) | 0 (0.0%) |
| Total | 839 (100.0%) | 0 (0.0%) |
Health Insurance Coverage by Citizenship Status in Norwich
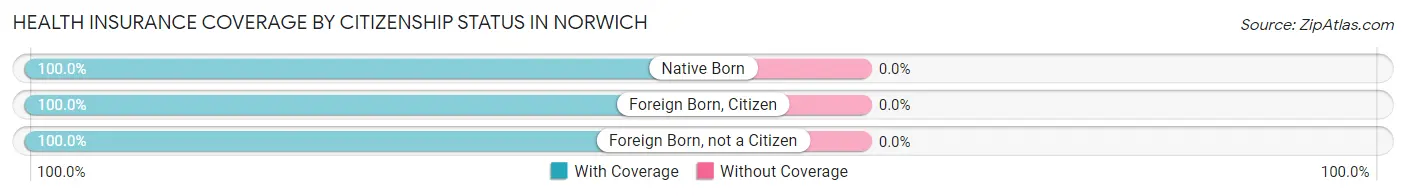
| Citizenship Status | With Coverage | Without Coverage |
| Native Born | 10 (100.0%) | 0 (0.0%) |
| Foreign Born, Citizen | 210 (100.0%) | 0 (0.0%) |
| Foreign Born, not a Citizen | 118 (100.0%) | 0 (0.0%) |
Health Insurance Coverage by Household Income in Norwich
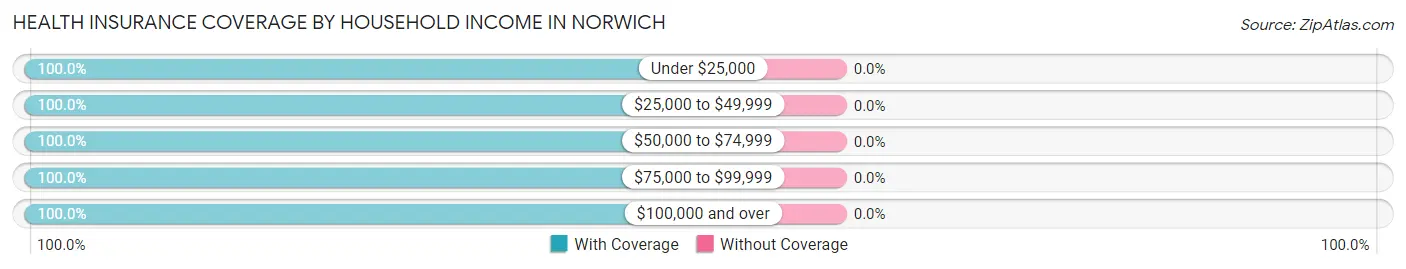
| Household Income | With Coverage | Without Coverage |
| Under $25,000 | 63 (100.0%) | 0 (0.0%) |
| $25,000 to $49,999 | 97 (100.0%) | 0 (0.0%) |
| $50,000 to $74,999 | 18 (100.0%) | 0 (0.0%) |
| $75,000 to $99,999 | 128 (100.0%) | 0 (0.0%) |
| $100,000 and over | 533 (100.0%) | 0 (0.0%) |
Public vs Private Health Insurance Coverage by Age in Norwich
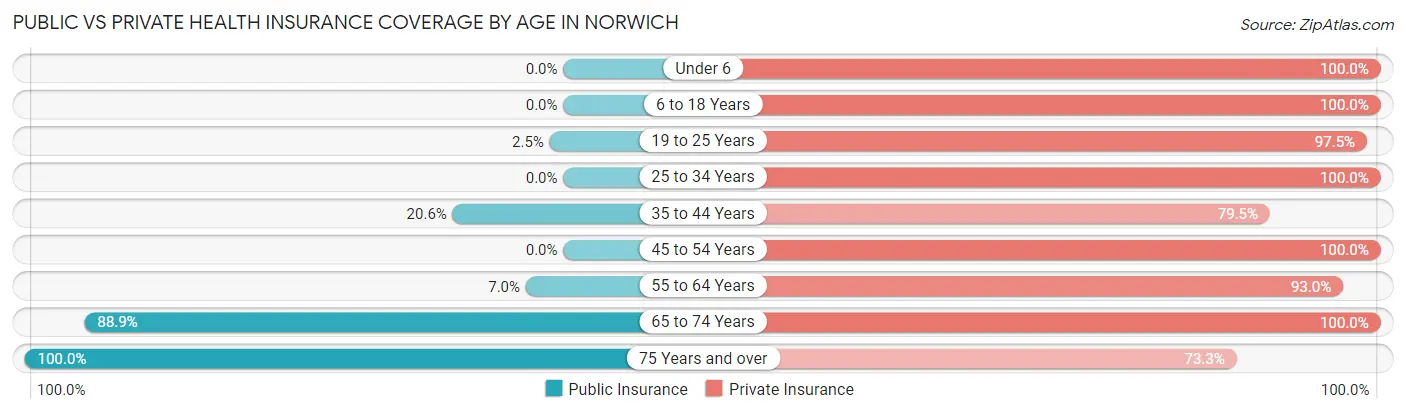
| Age Bracket | Public Insurance | Private Insurance |
| Under 6 | 0 (0.0%) | 10 (100.0%) |
| 6 to 18 Years | 0 (0.0%) | 210 (100.0%) |
| 19 to 25 Years | 3 (2.5%) | 115 (97.5%) |
| 25 to 34 Years | 0 (0.0%) | 42 (100.0%) |
| 35 to 44 Years | 15 (20.5%) | 58 (79.4%) |
| 45 to 54 Years | 0 (0.0%) | 134 (100.0%) |
| 55 to 64 Years | 8 (7.0%) | 107 (93.0%) |
| 65 to 74 Years | 32 (88.9%) | 36 (100.0%) |
| 75 Years and over | 101 (100.0%) | 74 (73.3%) |
| Total | 159 (19.0%) | 786 (93.7%) |
Disability Status by Sex by Age in Norwich
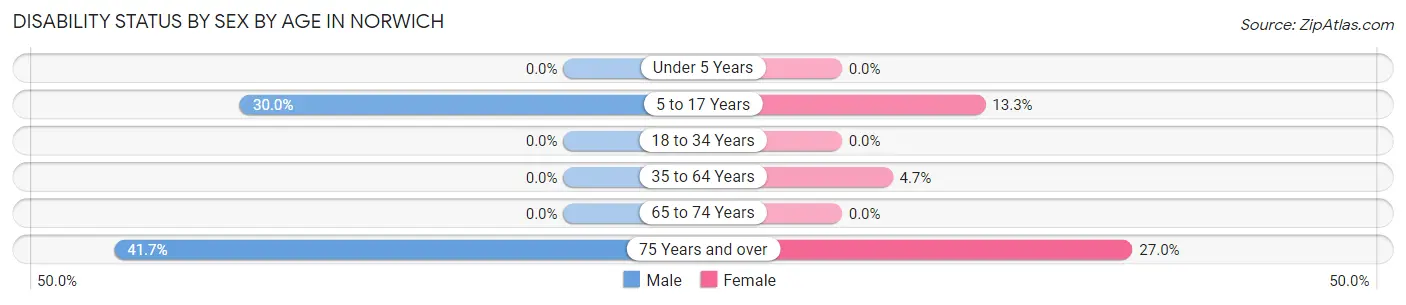
| Age Bracket | Male | Female |
| Under 5 Years | 0 (0.0%) | 0 (0.0%) |
| 5 to 17 Years | 33 (30.0%) | 10 (13.3%) |
| 18 to 34 Years | 0 (0.0%) | 0 (0.0%) |
| 35 to 64 Years | 0 (0.0%) | 8 (4.7%) |
| 65 to 74 Years | 0 (0.0%) | 0 (0.0%) |
| 75 Years and over | 5 (41.7%) | 24 (27.0%) |
Disability Class by Sex by Age in Norwich
Disability Class: Hearing Difficulty
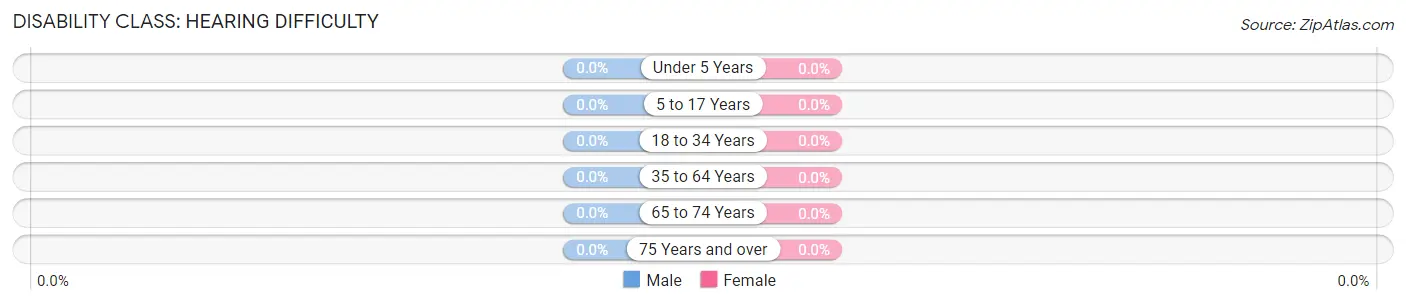
| Age Bracket | Male | Female |
| Under 5 Years | 0 (0.0%) | 0 (0.0%) |
| 5 to 17 Years | 0 (0.0%) | 0 (0.0%) |
| 18 to 34 Years | 0 (0.0%) | 0 (0.0%) |
| 35 to 64 Years | 0 (0.0%) | 0 (0.0%) |
| 65 to 74 Years | 0 (0.0%) | 0 (0.0%) |
| 75 Years and over | 0 (0.0%) | 0 (0.0%) |
Disability Class: Vision Difficulty
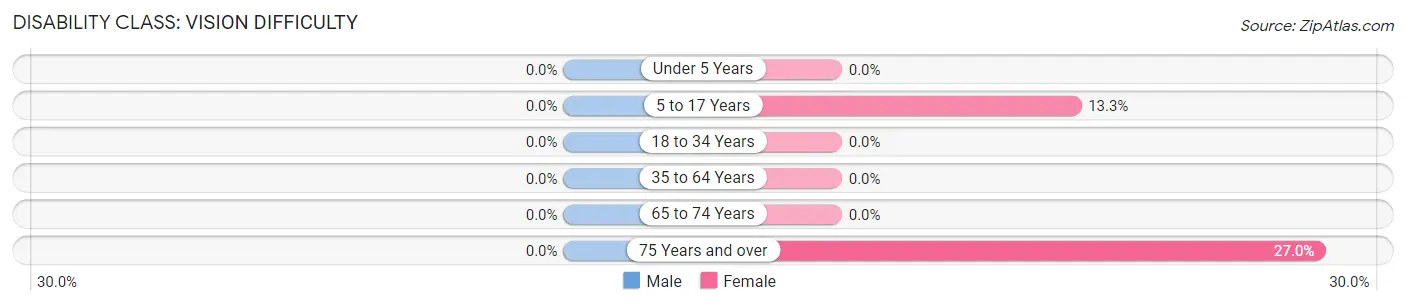
| Age Bracket | Male | Female |
| Under 5 Years | 0 (0.0%) | 0 (0.0%) |
| 5 to 17 Years | 0 (0.0%) | 10 (13.3%) |
| 18 to 34 Years | 0 (0.0%) | 0 (0.0%) |
| 35 to 64 Years | 0 (0.0%) | 0 (0.0%) |
| 65 to 74 Years | 0 (0.0%) | 0 (0.0%) |
| 75 Years and over | 0 (0.0%) | 24 (27.0%) |
Disability Class: Cognitive Difficulty
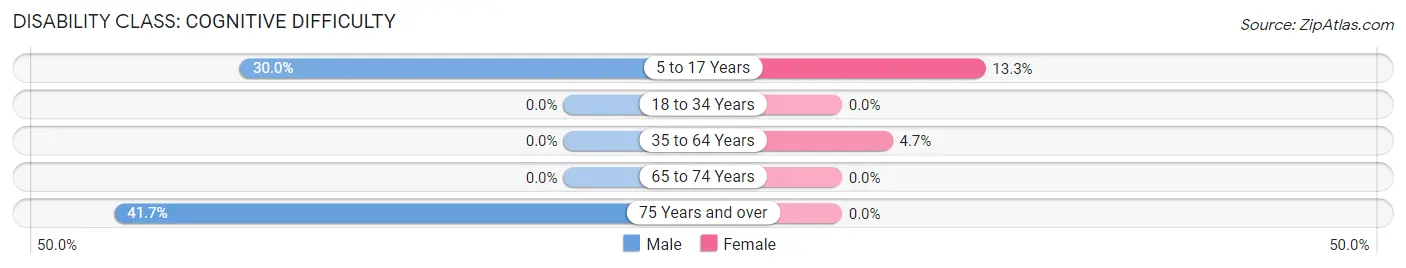
| Age Bracket | Male | Female |
| 5 to 17 Years | 33 (30.0%) | 10 (13.3%) |
| 18 to 34 Years | 0 (0.0%) | 0 (0.0%) |
| 35 to 64 Years | 0 (0.0%) | 8 (4.7%) |
| 65 to 74 Years | 0 (0.0%) | 0 (0.0%) |
| 75 Years and over | 5 (41.7%) | 0 (0.0%) |
Disability Class: Ambulatory Difficulty
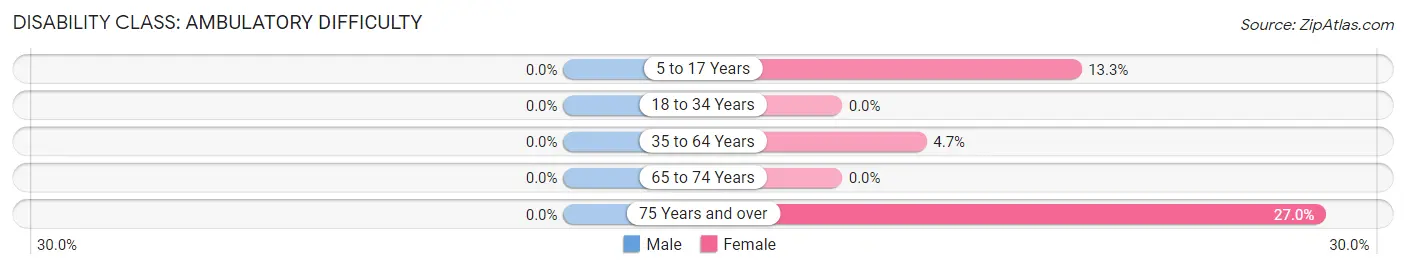
| Age Bracket | Male | Female |
| 5 to 17 Years | 0 (0.0%) | 10 (13.3%) |
| 18 to 34 Years | 0 (0.0%) | 0 (0.0%) |
| 35 to 64 Years | 0 (0.0%) | 8 (4.7%) |
| 65 to 74 Years | 0 (0.0%) | 0 (0.0%) |
| 75 Years and over | 0 (0.0%) | 24 (27.0%) |
Disability Class: Self-Care Difficulty
| Age Bracket | Male | Female |
| 5 to 17 Years | 0 (0.0%) | 0 (0.0%) |
| 18 to 34 Years | 0 (0.0%) | 0 (0.0%) |
| 35 to 64 Years | 0 (0.0%) | 0 (0.0%) |
| 65 to 74 Years | 0 (0.0%) | 0 (0.0%) |
| 75 Years and over | 0 (0.0%) | 0 (0.0%) |
Technology Access in Norwich
Computing Device Access in Norwich
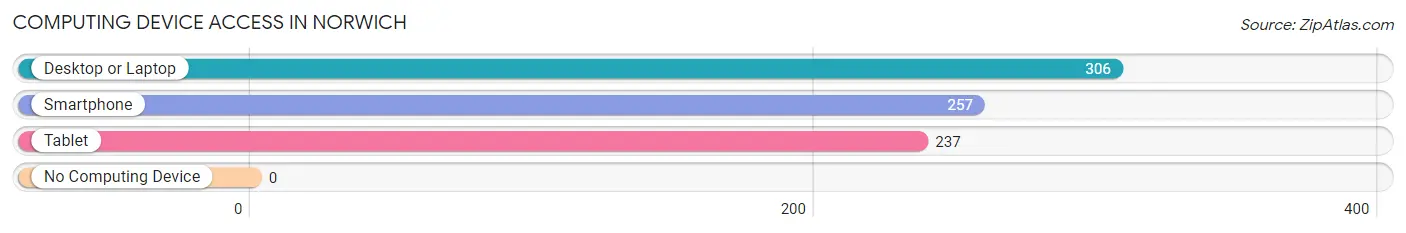
| Device Type | # Households | % Households |
| Desktop or Laptop | 306 | 100.0% |
| Smartphone | 257 | 84.0% |
| Tablet | 237 | 77.4% |
| No Computing Device | 0 | 0.0% |
| Total | 306 | 100.0% |
Internet Access in Norwich
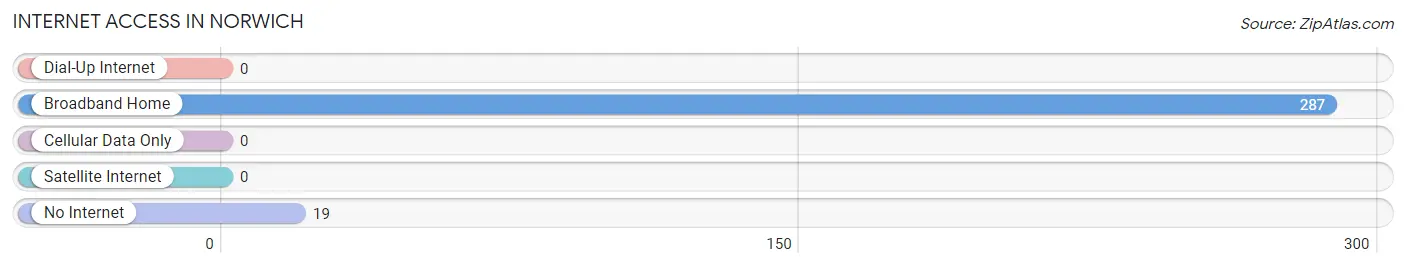
| Internet Type | # Households | % Households |
| Dial-Up Internet | 0 | 0.0% |
| Broadband Home | 287 | 93.8% |
| Cellular Data Only | 0 | 0.0% |
| Satellite Internet | 0 | 0.0% |
| No Internet | 19 | 6.2% |
| Total | 306 | 100.0% |
Norwich Summary
Norwich is a town located in Windsor County, Vermont, United States. The population was 3,414 at the 2010 census. It is the home of Dartmouth College and is located along the Connecticut River, across from Hanover, New Hampshire.
History
The area that is now Norwich was originally inhabited by the Abenaki people. The town was chartered in 1761 by Governor Benning Wentworth of New Hampshire, and was named after Norwich, England. The town was settled in 1763 by settlers from Massachusetts and Connecticut.
In 1769, the town was the site of the first free public library in the United States. The library was founded by Reverend Eleazar Wheelock, who later founded Dartmouth College.
In 1771, the town was the site of the first medical school in the United States, the Medical School of Dartmouth College.
In 1773 the town was the site of the first college in the United States Dartmouth College
In 1777 the town was the site of the first post office in the United States
In 1791 the town was the site of the first bank in the United States the Bank of Vermont
Geography
Norwich is located in the Connecticut River Valley of Vermont. The town is bordered by the towns of Hartford to the north, Sharon to the east, Thetford to the south, and Hanover, New Hampshire to the west.
The town is located at the intersection of U.S. Route 5 and Vermont Route 10. The town is located approximately 10 miles south of White River Junction, Vermont, and approximately 25 miles north of Lebanon, New Hampshire.
The town is located in the Connecticut River Valley, and is surrounded by hills and mountains. The highest point in the town is the summit of Mount Tom, which has an elevation of 1,922 feet.
Economy
The economy of Norwich is largely based on tourism and education. The town is home to Dartmouth College, which is a major employer in the area. The college also attracts many visitors to the area, as do the nearby ski resorts.
The town is also home to several small businesses, including restaurants, retail stores, and professional services.
Demographics
As of the 2010 census, there were 3,414 people, 1,521 households, and 845 families residing in the town. The population density was 97.2 people per square mile. The racial makeup of the town was 94.3% White, 1.2% African American, 0.3% Native American, 2.2% Asian, 0.1% Pacific Islander, 0.7% from other races, and 1.3% from two or more races. Hispanic or Latino of any race were 2.2% of the population.
The median income for a household in the town was $50,938, and the median income for a family was $68,750. The per capita income for the town was $30,945. About 5.2% of families and 11.2% of the population were below the poverty line, including 8.3% of those under age 18 and 5.2% of those age 65 or over.
Common Questions
What is the Total Population of Norwich?
Total Population of Norwich is 839.
What is the Total Male Population of Norwich?
Total Male Population of Norwich is 346.
What is the Total Female Population of Norwich?
Total Female Population of Norwich is 493.
What is the Ratio of Males per 100 Females in Norwich?
There are 70.18 Males per 100 Females in Norwich.
What is the Ratio of Females per 100 Males in Norwich?
There are 142.49 Females per 100 Males in Norwich.
What is the Median Population Age in Norwich?
Median Population Age in Norwich is 41.7 Years.
What is the Average Family Size in Norwich
Average Family Size in Norwich is 3.1 People.
What is the Average Household Size in Norwich
Average Household Size in Norwich is 2.7 People.
What is Per Capita Income in Norwich?
Per Capita income in Norwich is $65,804.
What is the Median Family Income in Norwich?
Median Family Income in Norwich is $189,861.
What is the Median Household income in Norwich?
Median Household Income in Norwich is $138,750.
What is Inequality or Gini Index in Norwich?
Inequality or Gini Index in Norwich is 0.51.
How Large is the Labor Force in Norwich?
There are 396 People in the Labor Forcein in Norwich.
What is the Percentage of People in the Labor Force in Norwich?
58.8% of People are in the Labor Force in Norwich.
What is the Unemployment Rate in Norwich?
Unemployment Rate in Norwich is 3.8%.