Enosburg Falls, VT
Enosburg Falls Map
Enosburg Falls Overview
1,554
TOTAL POPULATION
796
MALE POPULATION
758
FEMALE POPULATION
105.01
MALES / 100 FEMALES
95.23
FEMALES / 100 MALES
37.1
MEDIAN AGE
3.5
AVG FAMILY SIZE
2.7
AVG HOUSEHOLD SIZE
$22,928
PER CAPITA INCOME
$58,000
AVG FAMILY INCOME
$46,250
AVG HOUSEHOLD INCOME
34.7%
WAGE / INCOME GAP [ % ]
65.3¢/ $1
WAGE / INCOME GAP [ $ ]
0.43
INEQUALITY / GINI INDEX
719
LABOR FORCE [ PEOPLE ]
59.9%
PERCENT IN LABOR FORCE
7.1%
UNEMPLOYMENT RATE
Enosburg Falls Zip Codes
Enosburg Falls Area Codes
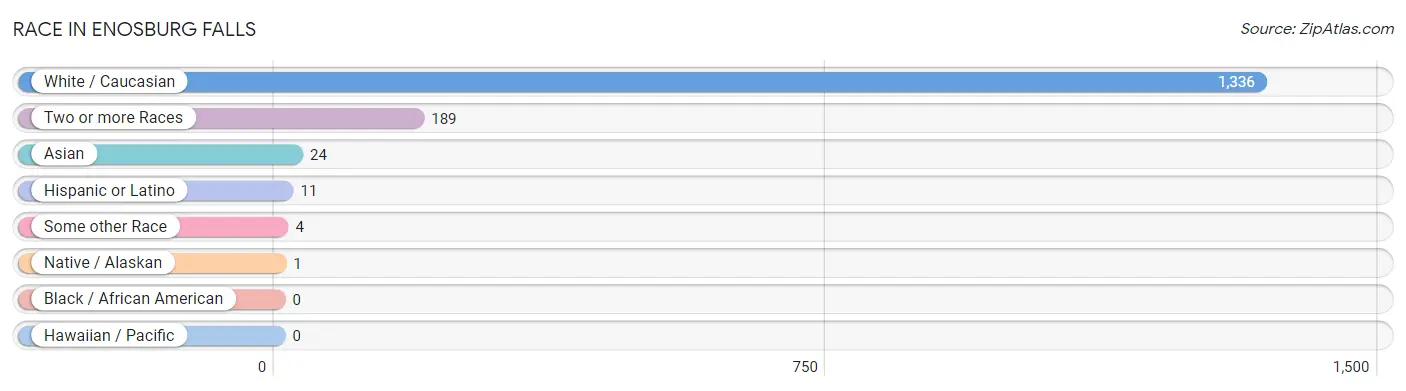
Race in Enosburg Falls
The most populous races in Enosburg Falls are White / Caucasian (1,336 | 86.0%), Two or more Races (189 | 12.2%), and Asian (24 | 1.5%).
| Race | # Population | % Population |
| Asian | 24 | 1.5% |
| Black / African American | 0 | 0.0% |
| Hawaiian / Pacific | 0 | 0.0% |
| Hispanic or Latino | 11 | 0.7% |
| Native / Alaskan | 1 | 0.1% |
| White / Caucasian | 1,336 | 86.0% |
| Two or more Races | 189 | 12.2% |
| Some other Race | 4 | 0.3% |
| Total | 1,554 | 100.0% |
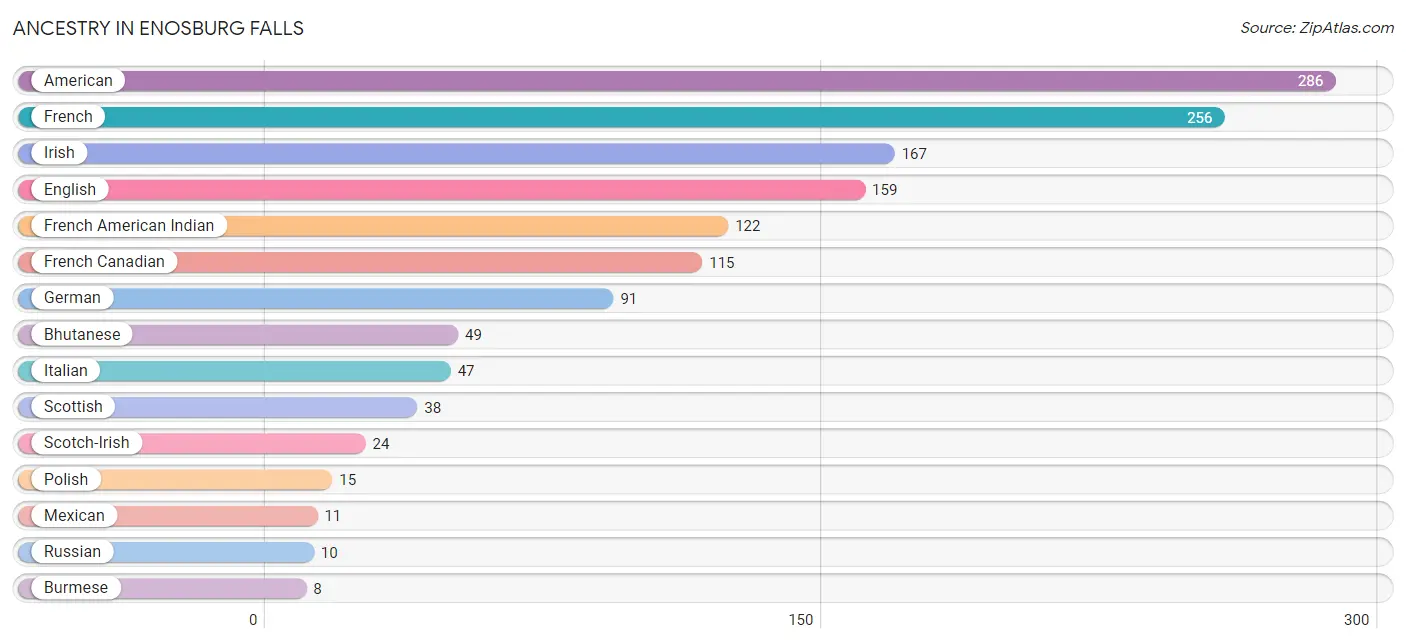
Ancestry in Enosburg Falls
The most populous ancestries reported in Enosburg Falls are American (286 | 18.4%), French (256 | 16.5%), Irish (167 | 10.7%), English (159 | 10.2%), and French American Indian (122 | 7.9%), together accounting for 63.7% of all Enosburg Falls residents.
| Ancestry | # Population | % Population |
| American | 286 | 18.4% |
| Bhutanese | 49 | 3.2% |
| British | 3 | 0.2% |
| Burmese | 8 | 0.5% |
| Canadian | 8 | 0.5% |
| Eastern European | 4 | 0.3% |
| English | 159 | 10.2% |
| European | 7 | 0.4% |
| French | 256 | 16.5% |
| French American Indian | 122 | 7.9% |
| French Canadian | 115 | 7.4% |
| German | 91 | 5.9% |
| Irish | 167 | 10.7% |
| Iroquois | 2 | 0.1% |
| Italian | 47 | 3.0% |
| Mexican | 11 | 0.7% |
| Polish | 15 | 1.0% |
| Russian | 10 | 0.6% |
| Scotch-Irish | 24 | 1.5% |
| Scottish | 38 | 2.5% |
| Swedish | 7 | 0.4% |
| Swiss | 3 | 0.2% | View All 22 Rows |
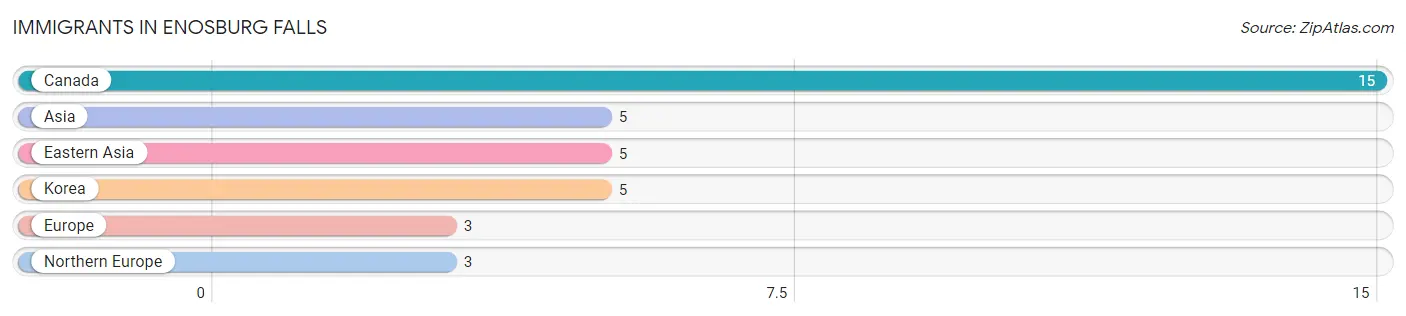
Immigrants in Enosburg Falls
The most numerous immigrant groups reported in Enosburg Falls came from Canada (15 | 1.0%), Asia (5 | 0.3%), Eastern Asia (5 | 0.3%), Korea (5 | 0.3%), and Europe (3 | 0.2%), together accounting for 2.1% of all Enosburg Falls residents.
| Immigration Origin | # Population | % Population |
| Asia | 5 | 0.3% |
| Canada | 15 | 1.0% |
| Eastern Asia | 5 | 0.3% |
| Europe | 3 | 0.2% |
| Korea | 5 | 0.3% |
| Northern Europe | 3 | 0.2% | View All 6 Rows |
Sex and Age in Enosburg Falls
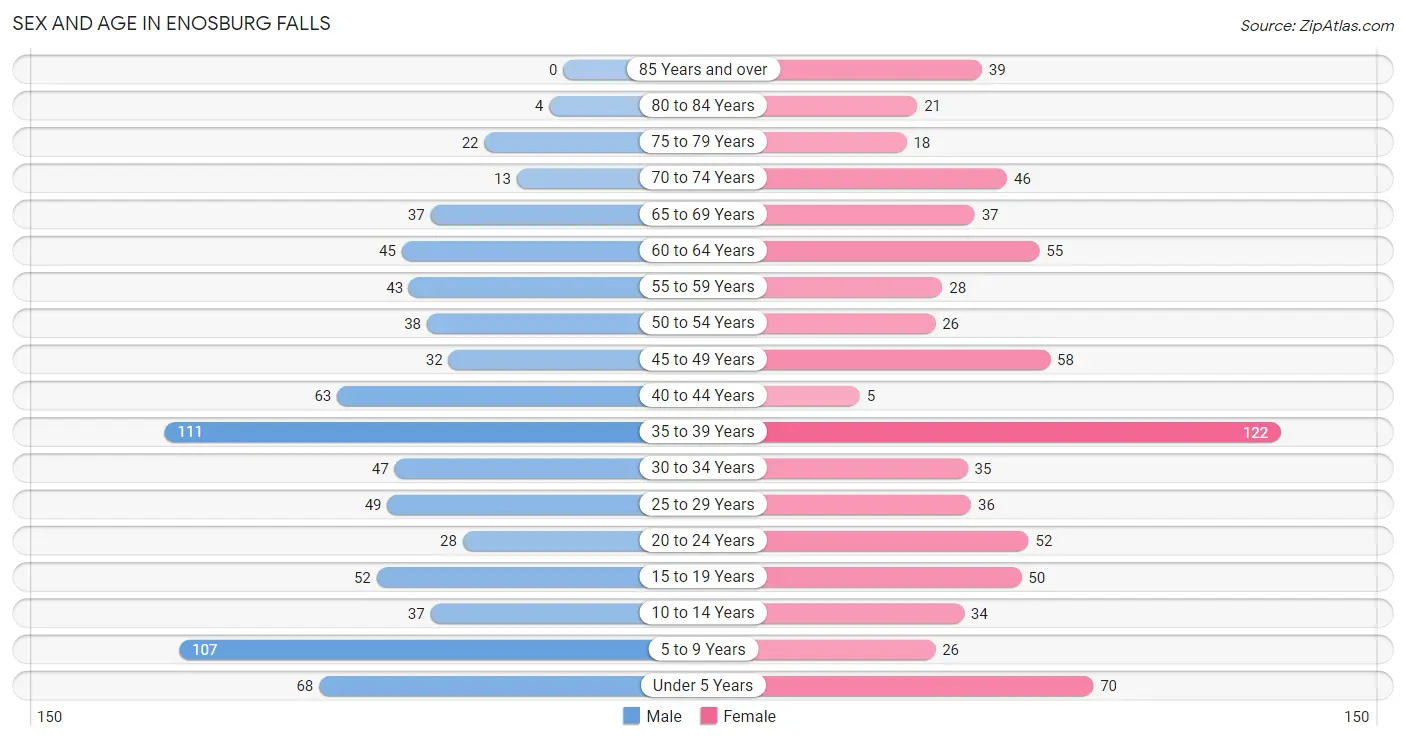
Sex and Age in Enosburg Falls
The most populous age groups in Enosburg Falls are 35 to 39 Years (111 | 13.9%) for men and 35 to 39 Years (122 | 16.1%) for women.
| Age Bracket | Male | Female |
| Under 5 Years | 68 (8.5%) | 70 (9.2%) |
| 5 to 9 Years | 107 (13.4%) | 26 (3.4%) |
| 10 to 14 Years | 37 (4.6%) | 34 (4.5%) |
| 15 to 19 Years | 52 (6.5%) | 50 (6.6%) |
| 20 to 24 Years | 28 (3.5%) | 52 (6.9%) |
| 25 to 29 Years | 49 (6.2%) | 36 (4.8%) |
| 30 to 34 Years | 47 (5.9%) | 35 (4.6%) |
| 35 to 39 Years | 111 (13.9%) | 122 (16.1%) |
| 40 to 44 Years | 63 (7.9%) | 5 (0.7%) |
| 45 to 49 Years | 32 (4.0%) | 58 (7.6%) |
| 50 to 54 Years | 38 (4.8%) | 26 (3.4%) |
| 55 to 59 Years | 43 (5.4%) | 28 (3.7%) |
| 60 to 64 Years | 45 (5.7%) | 55 (7.3%) |
| 65 to 69 Years | 37 (4.6%) | 37 (4.9%) |
| 70 to 74 Years | 13 (1.6%) | 46 (6.1%) |
| 75 to 79 Years | 22 (2.8%) | 18 (2.4%) |
| 80 to 84 Years | 4 (0.5%) | 21 (2.8%) |
| 85 Years and over | 0 (0.0%) | 39 (5.1%) |
| Total | 796 (100.0%) | 758 (100.0%) |
Families and Households in Enosburg Falls
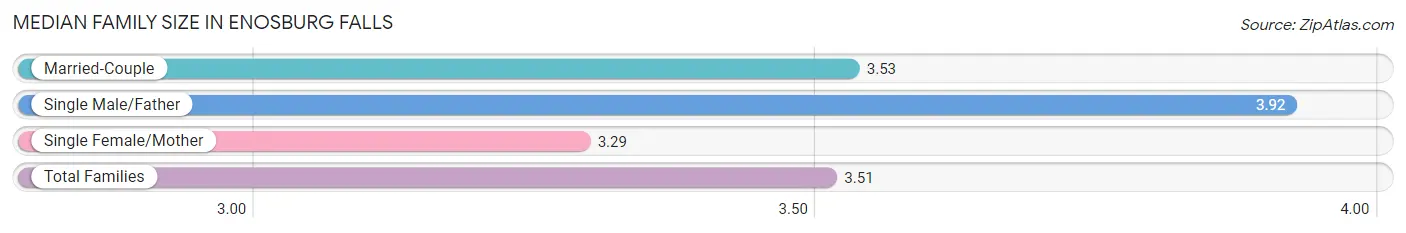
Median Family Size in Enosburg Falls
The median family size in Enosburg Falls is 3.51 persons per family, with single male/father families (26 | 7.6%) accounting for the largest median family size of 3.92 persons per family. On the other hand, single female/mother families (68 | 19.8%) represent the smallest median family size with 3.29 persons per family.
| Family Type | # Families | Family Size |
| Married-Couple | 250 (72.7%) | 3.53 |
| Single Male/Father | 26 (7.6%) | 3.92 |
| Single Female/Mother | 68 (19.8%) | 3.29 |
| Total Families | 344 (100.0%) | 3.51 |
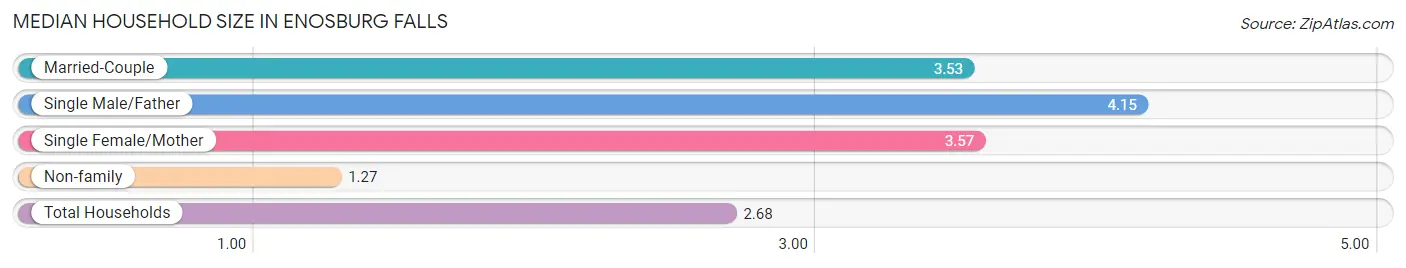
Median Household Size in Enosburg Falls
The median household size in Enosburg Falls is 2.68 persons per household, with single male/father households (26 | 4.6%) accounting for the largest median household size of 4.15 persons per household. non-family households (221 | 39.1%) represent the smallest median household size with 1.27 persons per household.
| Household Type | # Households | Household Size |
| Married-Couple | 250 (44.3%) | 3.53 |
| Single Male/Father | 26 (4.6%) | 4.15 |
| Single Female/Mother | 68 (12.0%) | 3.57 |
| Non-family | 221 (39.1%) | 1.27 |
| Total Households | 565 (100.0%) | 2.68 |
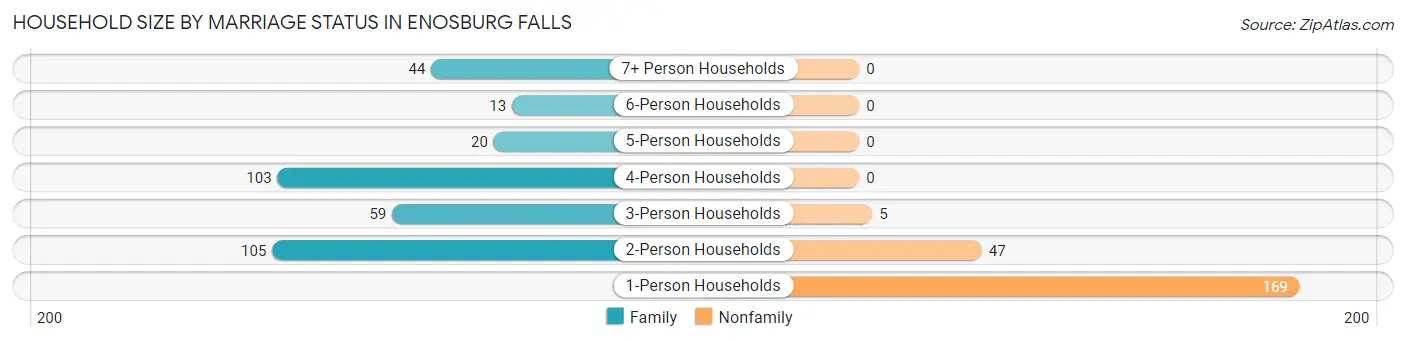
Household Size by Marriage Status in Enosburg Falls
Out of a total of 565 households in Enosburg Falls, 344 (60.9%) are family households, while 221 (39.1%) are nonfamily households. The most numerous type of family households are 2-person households, comprising 105, and the most common type of nonfamily households are 1-person households, comprising 169.
| Household Size | Family Households | Nonfamily Households |
| 1-Person Households | - | 169 (29.9%) |
| 2-Person Households | 105 (18.6%) | 47 (8.3%) |
| 3-Person Households | 59 (10.4%) | 5 (0.9%) |
| 4-Person Households | 103 (18.2%) | 0 (0.0%) |
| 5-Person Households | 20 (3.5%) | 0 (0.0%) |
| 6-Person Households | 13 (2.3%) | 0 (0.0%) |
| 7+ Person Households | 44 (7.8%) | 0 (0.0%) |
| Total | 344 (60.9%) | 221 (39.1%) |
Female Fertility in Enosburg Falls
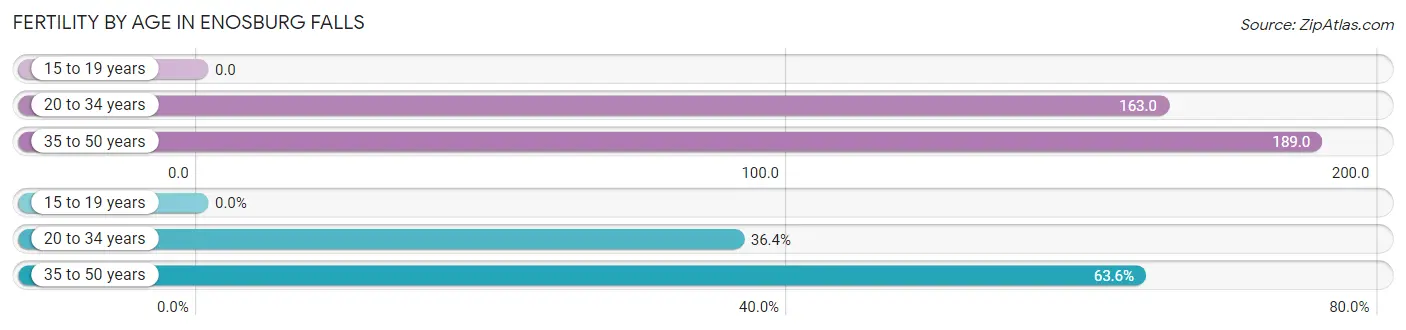
Fertility by Age in Enosburg Falls
Average fertility rate in Enosburg Falls is 154.0 births per 1,000 women. Women in the age bracket of 35 to 50 years have the highest fertility rate with 189.0 births per 1,000 women. Women in the age bracket of 35 to 50 years acount for 63.6% of all women with births.
| Age Bracket | Women with Births | Births / 1,000 Women |
| 15 to 19 years | 0 (0.0%) | 0.0 |
| 20 to 34 years | 20 (36.4%) | 163.0 |
| 35 to 50 years | 35 (63.6%) | 189.0 |
| Total | 55 (100.0%) | 154.0 |
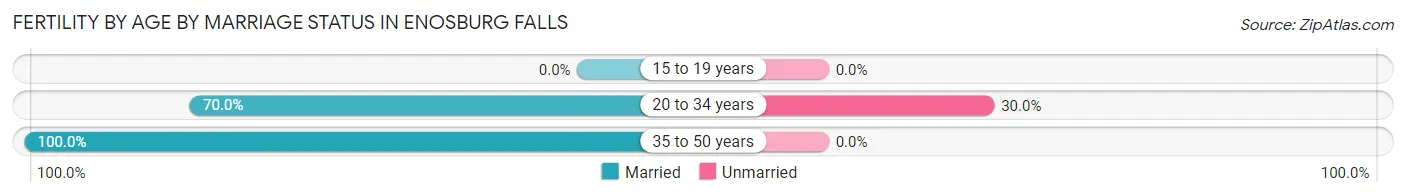
Fertility by Age by Marriage Status in Enosburg Falls
89.1% of women with births (55) in Enosburg Falls are married. The highest percentage of unmarried women with births falls into 20 to 34 years age bracket with 30.0% of them unmarried at the time of birth, while the lowest percentage of unmarried women with births belong to 35 to 50 years age bracket with 0.0% of them unmarried.
| Age Bracket | Married | Unmarried |
| 15 to 19 years | 0 (0.0%) | 0 (0.0%) |
| 20 to 34 years | 14 (70.0%) | 6 (30.0%) |
| 35 to 50 years | 35 (100.0%) | 0 (0.0%) |
| Total | 49 (89.1%) | 6 (10.9%) |
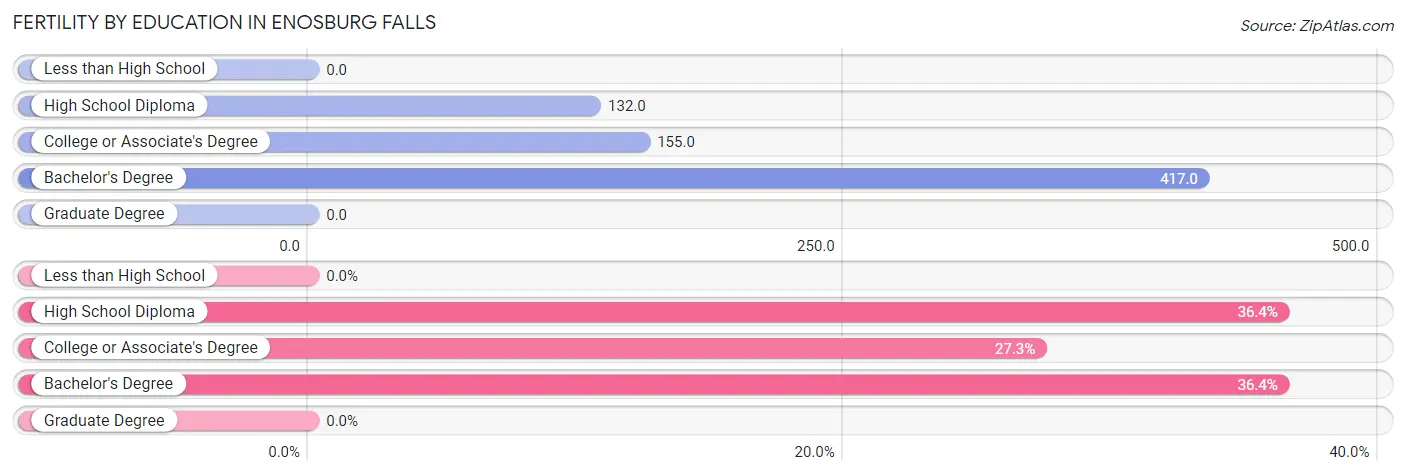
Fertility by Education in Enosburg Falls
| Educational Attainment | Women with Births | Births / 1,000 Women |
| Less than High School | 0 (0.0%) | 0.0 |
| High School Diploma | 20 (36.4%) | 132.0 |
| College or Associate's Degree | 15 (27.3%) | 155.0 |
| Bachelor's Degree | 20 (36.4%) | 417.0 |
| Graduate Degree | 0 (0.0%) | 0.0 |
| Total | 55 (100.0%) | 154.0 |
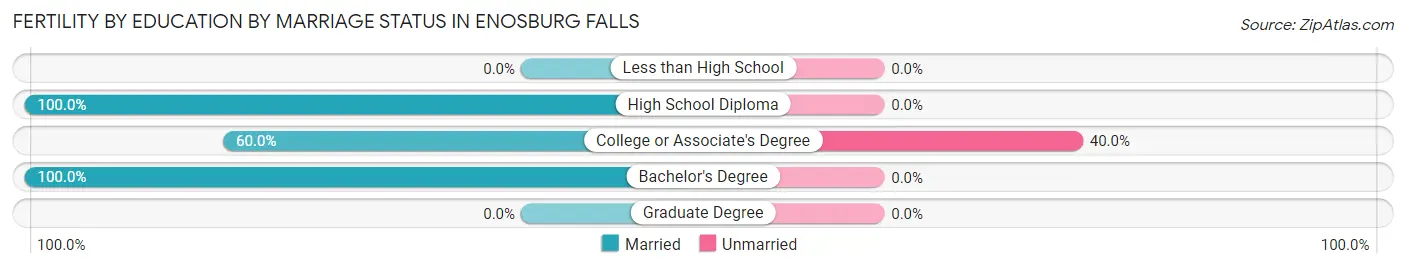
Fertility by Education by Marriage Status in Enosburg Falls
10.9% of women with births in Enosburg Falls are unmarried. Women with the educational attainment of high school diploma are most likely to be married with 100.0% of them married at childbirth, while women with the educational attainment of college or associate's degree are least likely to be married with 40.0% of them unmarried at childbirth.
| Educational Attainment | Married | Unmarried |
| Less than High School | 0 (0.0%) | 0 (0.0%) |
| High School Diploma | 20 (100.0%) | 0 (0.0%) |
| College or Associate's Degree | 9 (60.0%) | 6 (40.0%) |
| Bachelor's Degree | 20 (100.0%) | 0 (0.0%) |
| Graduate Degree | 0 (0.0%) | 0 (0.0%) |
| Total | 49 (89.1%) | 6 (10.9%) |
Income in Enosburg Falls
Income Overview in Enosburg Falls
Per Capita Income in Enosburg Falls is $22,928, while median incomes of families and households are $58,000 and $46,250 respectively.
| Characteristic | Number | Measure |
| Per Capita Income | 1,554 | $22,928 |
| Median Family Income | 344 | $58,000 |
| Mean Family Income | 344 | $69,699 |
| Median Household Income | 565 | $46,250 |
| Mean Household Income | 565 | $59,756 |
| Income Deficit | 344 | $0 |
| Wage / Income Gap (%) | 1,554 | 34.67% |
| Wage / Income Gap ($) | 1,554 | 65.33¢ per $1 |
| Gini / Inequality Index | 1,554 | 0.43 |
Earnings by Sex in Enosburg Falls
Average Earnings in Enosburg Falls are $36,010, $43,533 for men and $28,438 for women, a difference of 34.7%.
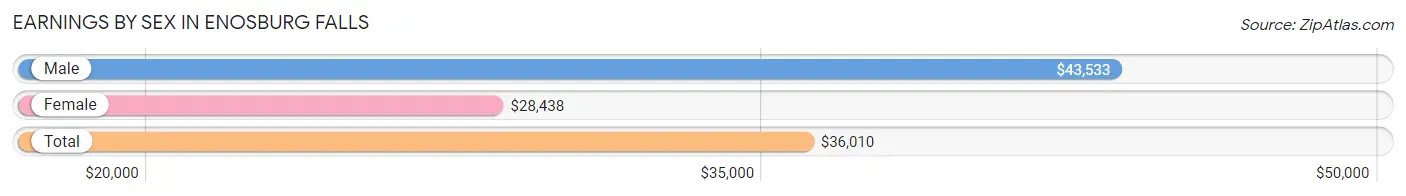
| Sex | Number | Average Earnings |
| Male | 369 (51.3%) | $43,533 |
| Female | 350 (48.7%) | $28,438 |
| Total | 719 (100.0%) | $36,010 |
Earnings by Sex by Income Bracket in Enosburg Falls
The most common earnings brackets in Enosburg Falls are $50,000 to $54,999 for men (55 | 14.9%) and $45,000 to $49,999 for women (35 | 10.0%).
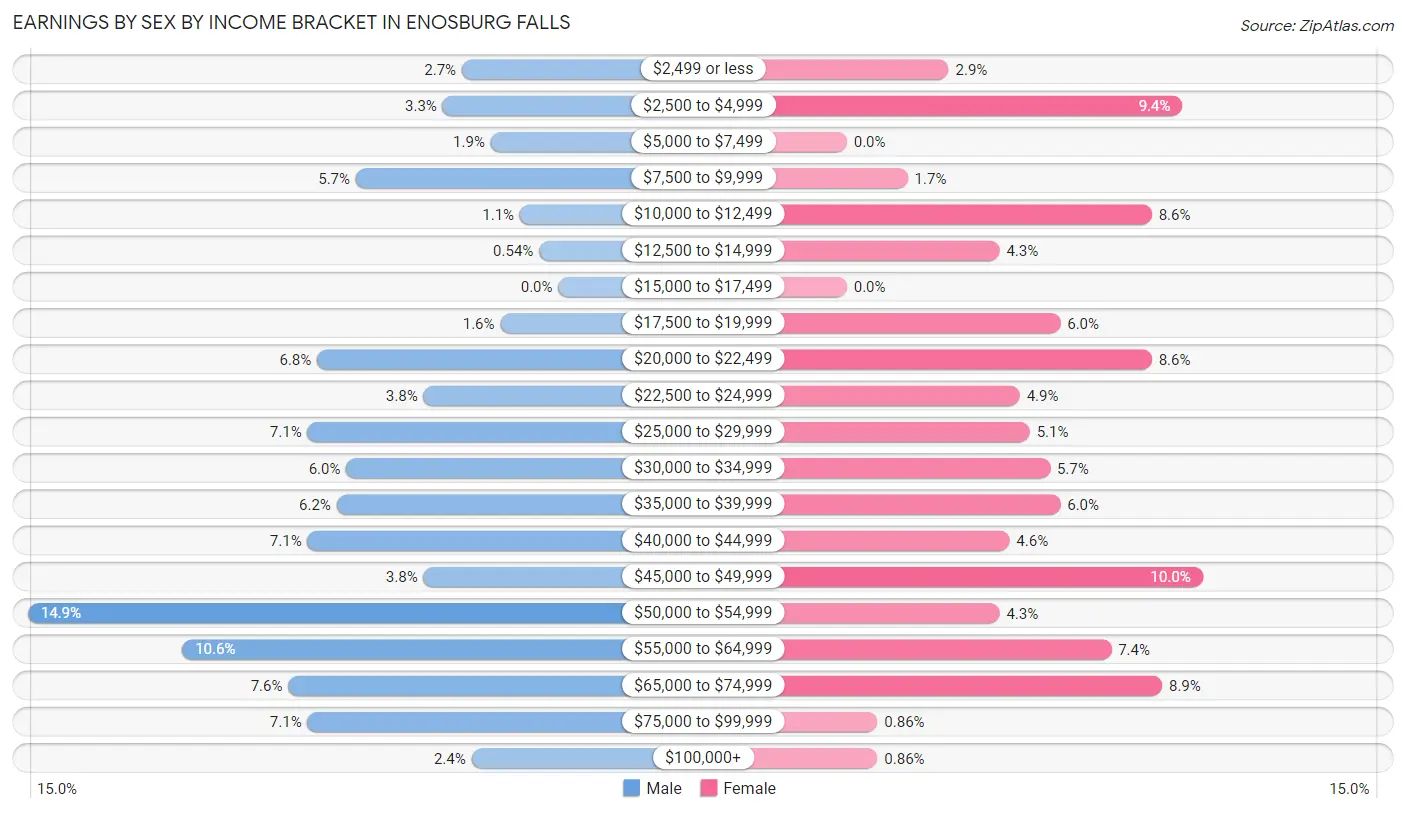
| Income | Male | Female |
| $2,499 or less | 10 (2.7%) | 10 (2.9%) |
| $2,500 to $4,999 | 12 (3.3%) | 33 (9.4%) |
| $5,000 to $7,499 | 7 (1.9%) | 0 (0.0%) |
| $7,500 to $9,999 | 21 (5.7%) | 6 (1.7%) |
| $10,000 to $12,499 | 4 (1.1%) | 30 (8.6%) |
| $12,500 to $14,999 | 2 (0.5%) | 15 (4.3%) |
| $15,000 to $17,499 | 0 (0.0%) | 0 (0.0%) |
| $17,500 to $19,999 | 6 (1.6%) | 21 (6.0%) |
| $20,000 to $22,499 | 25 (6.8%) | 30 (8.6%) |
| $22,500 to $24,999 | 14 (3.8%) | 17 (4.9%) |
| $25,000 to $29,999 | 26 (7.0%) | 18 (5.1%) |
| $30,000 to $34,999 | 22 (6.0%) | 20 (5.7%) |
| $35,000 to $39,999 | 23 (6.2%) | 21 (6.0%) |
| $40,000 to $44,999 | 26 (7.0%) | 16 (4.6%) |
| $45,000 to $49,999 | 14 (3.8%) | 35 (10.0%) |
| $50,000 to $54,999 | 55 (14.9%) | 15 (4.3%) |
| $55,000 to $64,999 | 39 (10.6%) | 26 (7.4%) |
| $65,000 to $74,999 | 28 (7.6%) | 31 (8.9%) |
| $75,000 to $99,999 | 26 (7.0%) | 3 (0.9%) |
| $100,000+ | 9 (2.4%) | 3 (0.9%) |
| Total | 369 (100.0%) | 350 (100.0%) |
Earnings by Sex by Educational Attainment in Enosburg Falls
Average earnings in Enosburg Falls are $46,750 for men and $35,455 for women, a difference of 24.2%. Men with an educational attainment of bachelor's degree enjoy the highest average annual earnings of $53,333, while those with college or associate's degree education earn the least with $34,750. Women with an educational attainment of graduate degree earn the most with the average annual earnings of $58,250, while those with high school diploma education have the smallest earnings of $26,458.
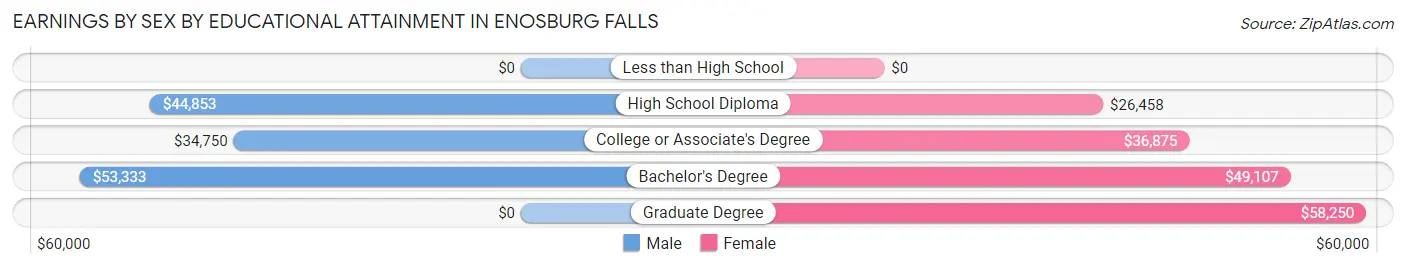
| Educational Attainment | Male Income | Female Income |
| Less than High School | - | - |
| High School Diploma | $44,853 | $26,458 |
| College or Associate's Degree | $34,750 | $36,875 |
| Bachelor's Degree | $53,333 | $49,107 |
| Graduate Degree | - | - |
| Total | $46,750 | $35,455 |
Family Income in Enosburg Falls
Family Income Brackets in Enosburg Falls
According to the Enosburg Falls family income data, there are 69 families falling into the $75,000 to $99,999 income range, which is the most common income bracket and makes up 20.1% of all families. Conversely, the $200,000+ income bracket is the least frequent group with only 7 families (2.0%) belonging to this category.
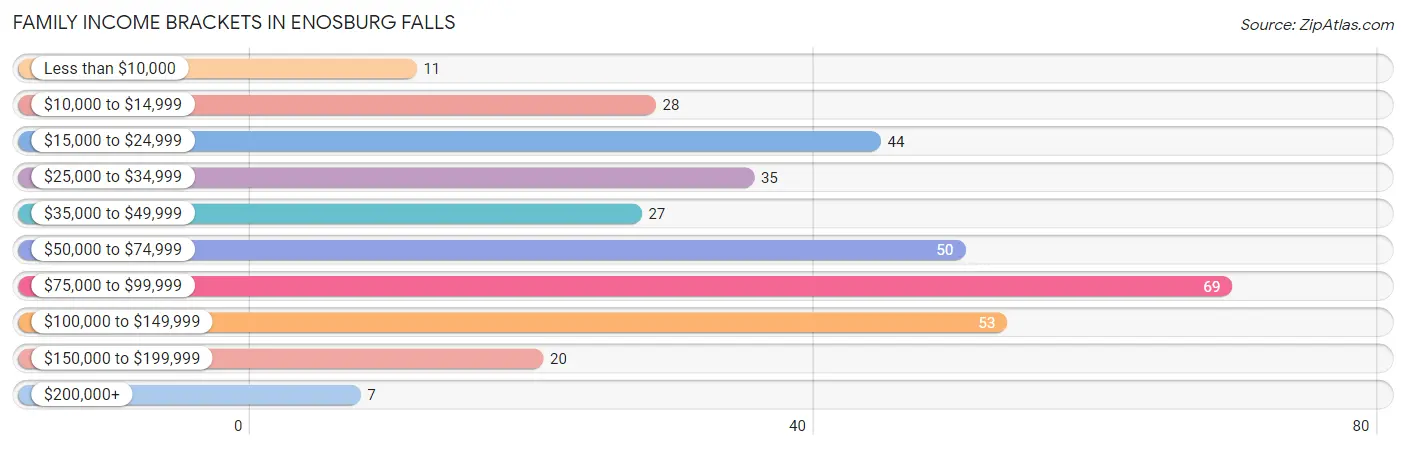
| Income Bracket | # Families | % Families |
| Less than $10,000 | 11 | 3.2% |
| $10,000 to $14,999 | 28 | 8.1% |
| $15,000 to $24,999 | 44 | 12.8% |
| $25,000 to $34,999 | 35 | 10.2% |
| $35,000 to $49,999 | 27 | 7.8% |
| $50,000 to $74,999 | 50 | 14.5% |
| $75,000 to $99,999 | 69 | 20.1% |
| $100,000 to $149,999 | 53 | 15.4% |
| $150,000 to $199,999 | 20 | 5.8% |
| $200,000+ | 7 | 2.0% |
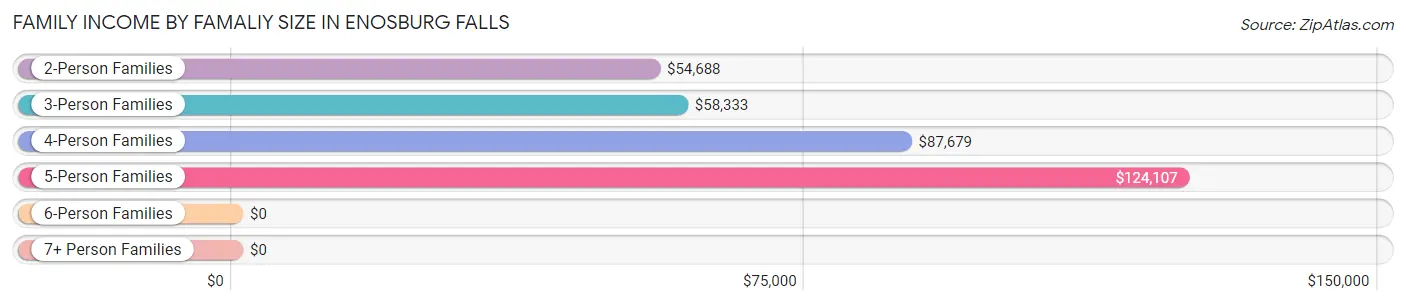
Family Income by Famaliy Size in Enosburg Falls
5-person families (21 | 6.1%) account for the highest median family income in Enosburg Falls with $124,107 per family, while 2-person families (107 | 31.1%) have the highest median income of $27,344 per family member.
| Income Bracket | # Families | Median Income |
| 2-Person Families | 107 (31.1%) | $54,688 |
| 3-Person Families | 70 (20.3%) | $58,333 |
| 4-Person Families | 95 (27.6%) | $87,679 |
| 5-Person Families | 21 (6.1%) | $124,107 |
| 6-Person Families | 7 (2.0%) | $0 |
| 7+ Person Families | 44 (12.8%) | $0 |
| Total | 344 (100.0%) | $58,000 |
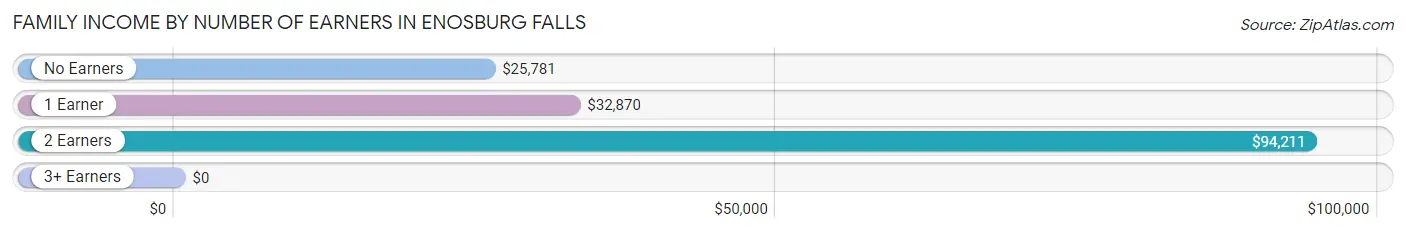
Family Income by Number of Earners in Enosburg Falls
| Number of Earners | # Families | Median Income |
| No Earners | 33 (9.6%) | $25,781 |
| 1 Earner | 146 (42.4%) | $32,870 |
| 2 Earners | 122 (35.5%) | $94,211 |
| 3+ Earners | 43 (12.5%) | $0 |
| Total | 344 (100.0%) | $58,000 |
Household Income in Enosburg Falls
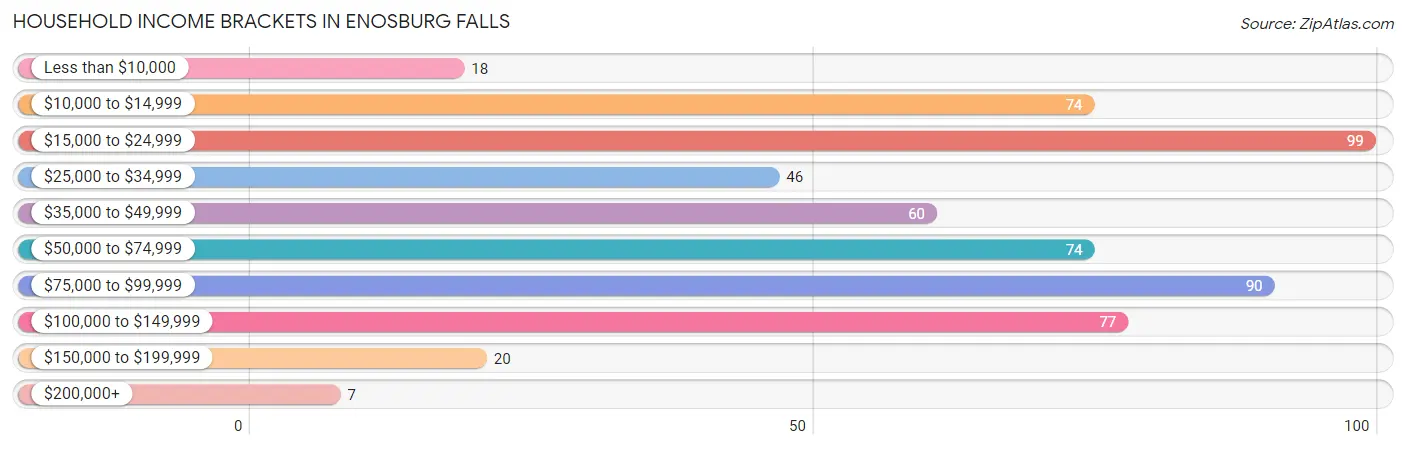
Household Income Brackets in Enosburg Falls
With 99 households falling in the category, the $15,000 to $24,999 income range is the most frequent in Enosburg Falls, accounting for 17.5% of all households. In contrast, only 7 households (1.2%) fall into the $200,000+ income bracket, making it the least populous group.
| Income Bracket | # Households | % Households |
| Less than $10,000 | 18 | 3.2% |
| $10,000 to $14,999 | 74 | 13.1% |
| $15,000 to $24,999 | 99 | 17.5% |
| $25,000 to $34,999 | 46 | 8.1% |
| $35,000 to $49,999 | 60 | 10.6% |
| $50,000 to $74,999 | 74 | 13.1% |
| $75,000 to $99,999 | 90 | 15.9% |
| $100,000 to $149,999 | 77 | 13.6% |
| $150,000 to $199,999 | 20 | 3.5% |
| $200,000+ | 7 | 1.2% |
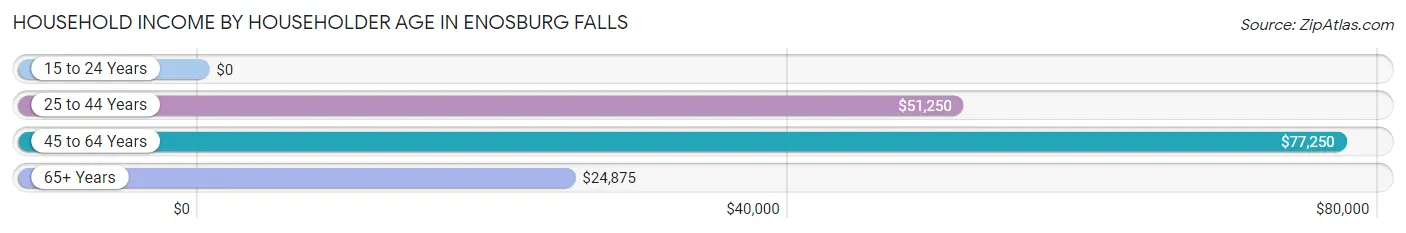
Household Income by Householder Age in Enosburg Falls
The median household income in Enosburg Falls is $46,250, with the highest median household income of $77,250 found in the 45 to 64 years age bracket for the primary householder. A total of 190 households (33.6%) fall into this category. Meanwhile, the 15 to 24 years age bracket for the primary householder has the lowest median household income of $0, with 38 households (6.7%) in this group.
| Income Bracket | # Households | Median Income |
| 15 to 24 Years | 38 (6.7%) | $0 |
| 25 to 44 Years | 200 (35.4%) | $51,250 |
| 45 to 64 Years | 190 (33.6%) | $77,250 |
| 65+ Years | 137 (24.2%) | $24,875 |
| Total | 565 (100.0%) | $46,250 |
Poverty in Enosburg Falls
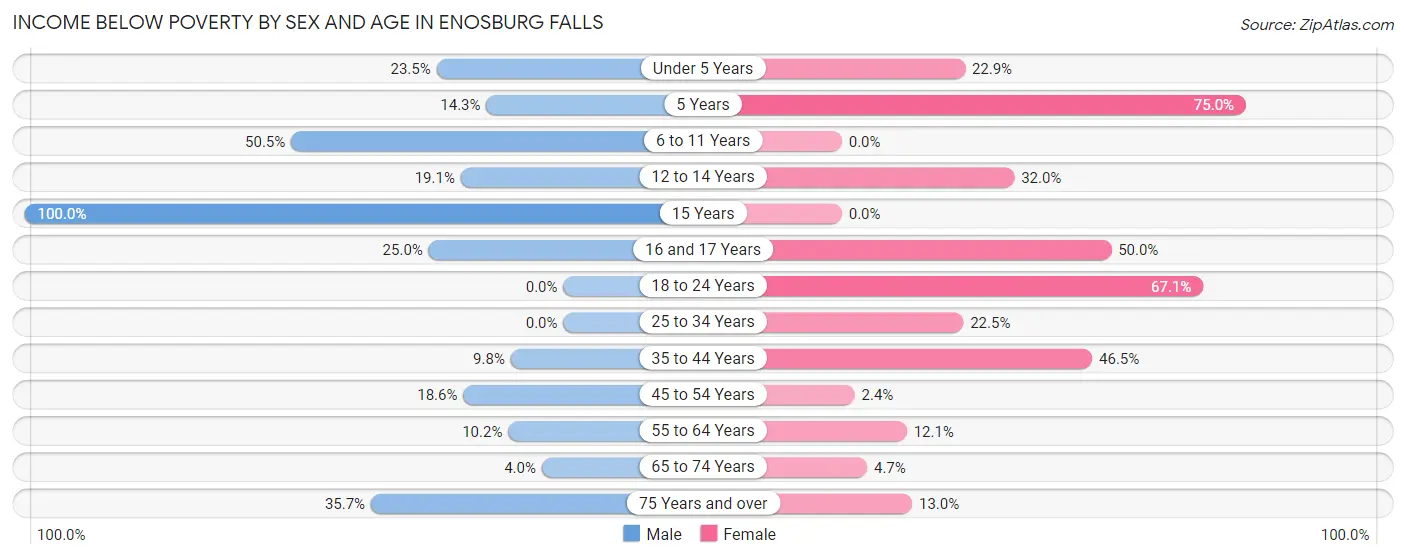
Income Below Poverty by Sex and Age in Enosburg Falls
With 16.6% poverty level for males and 26.9% for females among the residents of Enosburg Falls, 15 year old males and 5 year old females are the most vulnerable to poverty, with 7 males (100.0%) and 9 females (75.0%) in their respective age groups living below the poverty level.
| Age Bracket | Male | Female |
| Under 5 Years | 16 (23.5%) | 16 (22.9%) |
| 5 Years | 4 (14.3%) | 9 (75.0%) |
| 6 to 11 Years | 48 (50.5%) | 0 (0.0%) |
| 12 to 14 Years | 4 (19.1%) | 8 (32.0%) |
| 15 Years | 7 (100.0%) | 0 (0.0%) |
| 16 and 17 Years | 5 (25.0%) | 8 (50.0%) |
| 18 to 24 Years | 0 (0.0%) | 55 (67.1%) |
| 25 to 34 Years | 0 (0.0%) | 16 (22.5%) |
| 35 to 44 Years | 17 (9.8%) | 59 (46.5%) |
| 45 to 54 Years | 13 (18.6%) | 2 (2.4%) |
| 55 to 64 Years | 9 (10.2%) | 10 (12.0%) |
| 65 to 74 Years | 2 (4.0%) | 3 (4.7%) |
| 75 Years and over | 5 (35.7%) | 9 (13.0%) |
| Total | 130 (16.6%) | 195 (26.9%) |
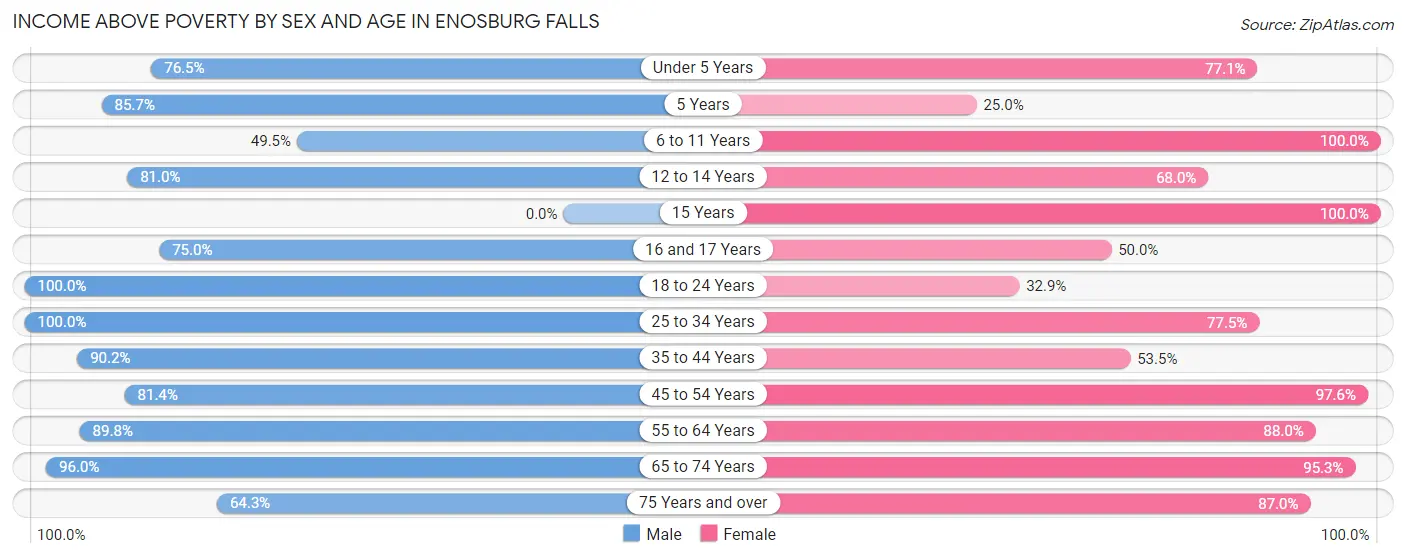
Income Above Poverty by Sex and Age in Enosburg Falls
According to the poverty statistics in Enosburg Falls, males aged 18 to 24 years and females aged 6 to 11 years are the age groups that are most secure financially, with 100.0% of males and 100.0% of females in these age groups living above the poverty line.
| Age Bracket | Male | Female |
| Under 5 Years | 52 (76.5%) | 54 (77.1%) |
| 5 Years | 24 (85.7%) | 3 (25.0%) |
| 6 to 11 Years | 47 (49.5%) | 17 (100.0%) |
| 12 to 14 Years | 17 (80.9%) | 17 (68.0%) |
| 15 Years | 0 (0.0%) | 4 (100.0%) |
| 16 and 17 Years | 15 (75.0%) | 8 (50.0%) |
| 18 to 24 Years | 53 (100.0%) | 27 (32.9%) |
| 25 to 34 Years | 96 (100.0%) | 55 (77.5%) |
| 35 to 44 Years | 157 (90.2%) | 68 (53.5%) |
| 45 to 54 Years | 57 (81.4%) | 82 (97.6%) |
| 55 to 64 Years | 79 (89.8%) | 73 (87.9%) |
| 65 to 74 Years | 48 (96.0%) | 61 (95.3%) |
| 75 Years and over | 9 (64.3%) | 60 (87.0%) |
| Total | 654 (83.4%) | 529 (73.1%) |
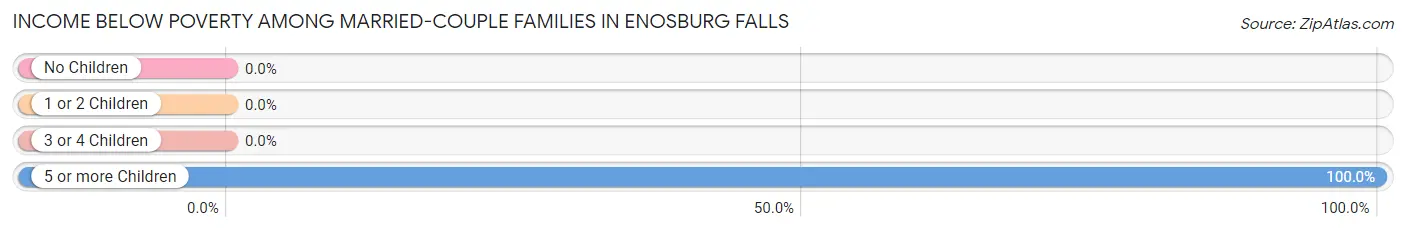
Income Below Poverty Among Married-Couple Families in Enosburg Falls
The poverty statistics for married-couple families in Enosburg Falls show that 17.6% or 44 of the total 250 families live below the poverty line. Families with 5 or more children have the highest poverty rate of 100.0%, comprising of 44 families. On the other hand, families with no children have the lowest poverty rate of 0.0%, which includes 0 families.
| Children | Above Poverty | Below Poverty |
| No Children | 107 (100.0%) | 0 (0.0%) |
| 1 or 2 Children | 92 (100.0%) | 0 (0.0%) |
| 3 or 4 Children | 7 (100.0%) | 0 (0.0%) |
| 5 or more Children | 0 (0.0%) | 44 (100.0%) |
| Total | 206 (82.4%) | 44 (17.6%) |
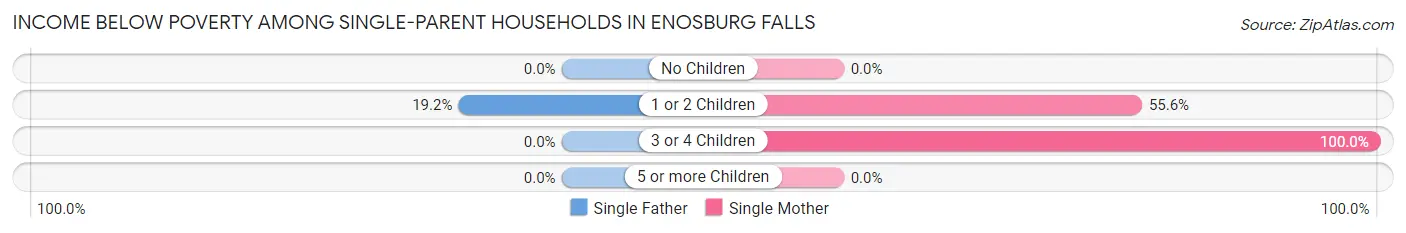
Income Below Poverty Among Single-Parent Households in Enosburg Falls
According to the poverty data in Enosburg Falls, 19.2% or 5 single-father households and 50.0% or 34 single-mother households are living below the poverty line. Among single-father households, those with 1 or 2 children have the highest poverty rate, with 5 households (19.2%) experiencing poverty. Likewise, among single-mother households, those with 3 or 4 children have the highest poverty rate, with 14 households (100.0%) falling below the poverty line.
| Children | Single Father | Single Mother |
| No Children | 0 (0.0%) | 0 (0.0%) |
| 1 or 2 Children | 5 (19.2%) | 20 (55.6%) |
| 3 or 4 Children | 0 (0.0%) | 14 (100.0%) |
| 5 or more Children | 0 (0.0%) | 0 (0.0%) |
| Total | 5 (19.2%) | 34 (50.0%) |
Income Below Poverty Among Married-Couple vs Single-Parent Households in Enosburg Falls
The poverty data for Enosburg Falls shows that 44 of the married-couple family households (17.6%) and 39 of the single-parent households (41.5%) are living below the poverty level. Within the married-couple family households, those with 5 or more children have the highest poverty rate, with 44 households (100.0%) falling below the poverty line. Among the single-parent households, those with 3 or 4 children have the highest poverty rate, with 14 household (100.0%) living below poverty.
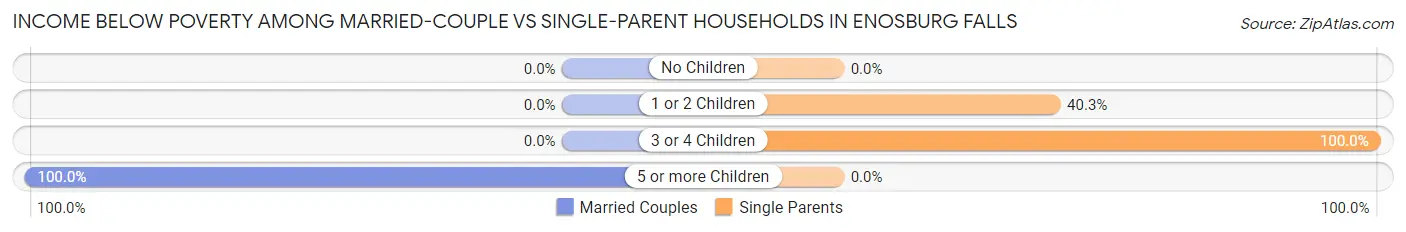
| Children | Married-Couple Families | Single-Parent Households |
| No Children | 0 (0.0%) | 0 (0.0%) |
| 1 or 2 Children | 0 (0.0%) | 25 (40.3%) |
| 3 or 4 Children | 0 (0.0%) | 14 (100.0%) |
| 5 or more Children | 44 (100.0%) | 0 (0.0%) |
| Total | 44 (17.6%) | 39 (41.5%) |
Employment Characteristics in Enosburg Falls
Employment by Class of Employer in Enosburg Falls
Among the 602 employed individuals in Enosburg Falls, private company employees (423 | 70.3%), not-for-profit organizations (81 | 13.5%), and state government employees (31 | 5.1%) make up the most common classes of employment.
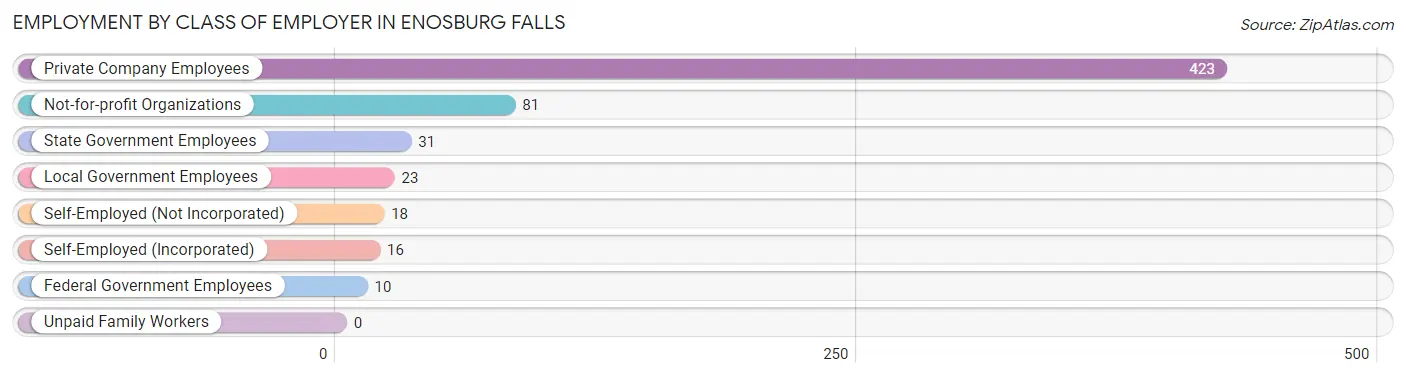
| Employer Class | # Employees | % Employees |
| Private Company Employees | 423 | 70.3% |
| Self-Employed (Incorporated) | 16 | 2.7% |
| Self-Employed (Not Incorporated) | 18 | 3.0% |
| Not-for-profit Organizations | 81 | 13.5% |
| Local Government Employees | 23 | 3.8% |
| State Government Employees | 31 | 5.1% |
| Federal Government Employees | 10 | 1.7% |
| Unpaid Family Workers | 0 | 0.0% |
| Total | 602 | 100.0% |
Employment Status by Age in Enosburg Falls
According to the labor force statistics for Enosburg Falls, out of the total population over 16 years of age (1,201), 59.9% or 719 individuals are in the labor force, with 7.1% or 51 of them unemployed. The age group with the highest labor force participation rate is 45 to 54 years, with 90.3% or 139 individuals in the labor force. Within the labor force, the 35 to 44 years age range has the highest percentage of unemployed individuals, with 22.3% or 41 of them being unemployed.
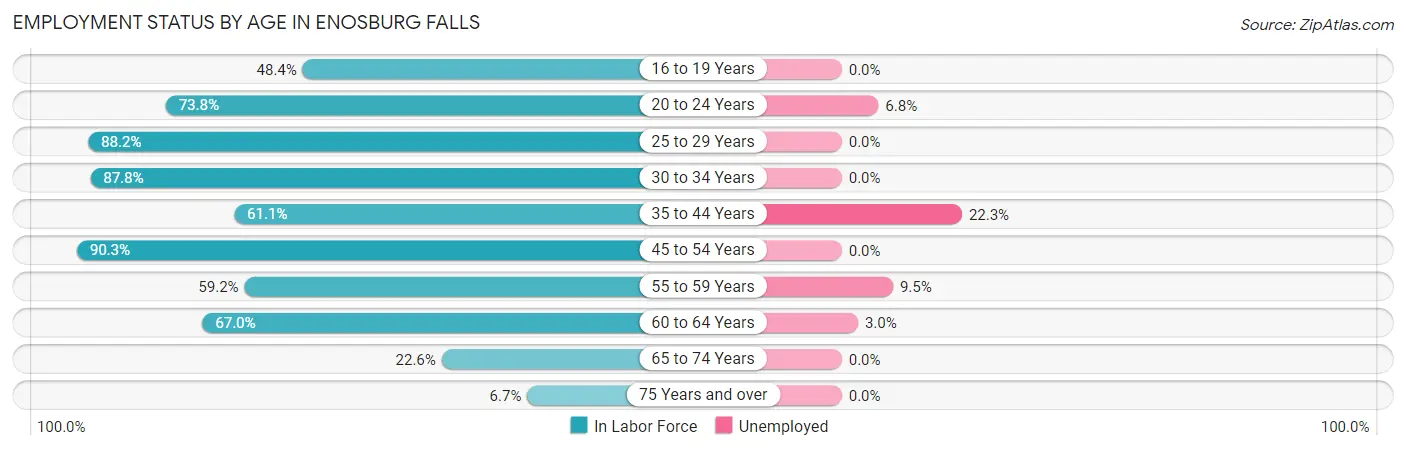
| Age Bracket | In Labor Force | Unemployed |
| 16 to 19 Years | 44 (48.4%) | 0 (0.0%) |
| 20 to 24 Years | 59 (73.8%) | 4 (6.8%) |
| 25 to 29 Years | 75 (88.2%) | 0 (0.0%) |
| 30 to 34 Years | 72 (87.8%) | 0 (0.0%) |
| 35 to 44 Years | 184 (61.1%) | 41 (22.3%) |
| 45 to 54 Years | 139 (90.3%) | 0 (0.0%) |
| 55 to 59 Years | 42 (59.2%) | 4 (9.5%) |
| 60 to 64 Years | 67 (67.0%) | 2 (3.0%) |
| 65 to 74 Years | 30 (22.6%) | 0 (0.0%) |
| 75 Years and over | 7 (6.7%) | 0 (0.0%) |
| Total | 719 (59.9%) | 51 (7.1%) |
Employment Status by Educational Attainment in Enosburg Falls
According to labor force statistics for Enosburg Falls, 73.0% of individuals (579) out of the total population between 25 and 64 years of age (793) are in the labor force, with 8.1% or 47 of them being unemployed. The group with the highest labor force participation rate are those with the educational attainment of bachelor's degree or higher, with 96.0% or 119 individuals in the labor force. Within the labor force, individuals with less than high school education have the highest percentage of unemployment, with 32.1% or 9 of them being unemployed.
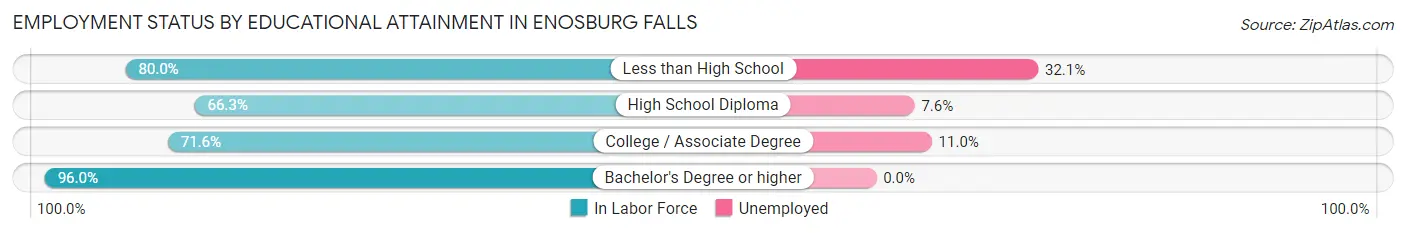
| Educational Attainment | In Labor Force | Unemployed |
| Less than High School | 28 (80.0%) | 11 (32.1%) |
| High School Diploma | 278 (66.3%) | 32 (7.6%) |
| College / Associate Degree | 154 (71.6%) | 24 (11.0%) |
| Bachelor's Degree or higher | 119 (96.0%) | 0 (0.0%) |
| Total | 579 (73.0%) | 64 (8.1%) |
Employment Occupations by Sex in Enosburg Falls
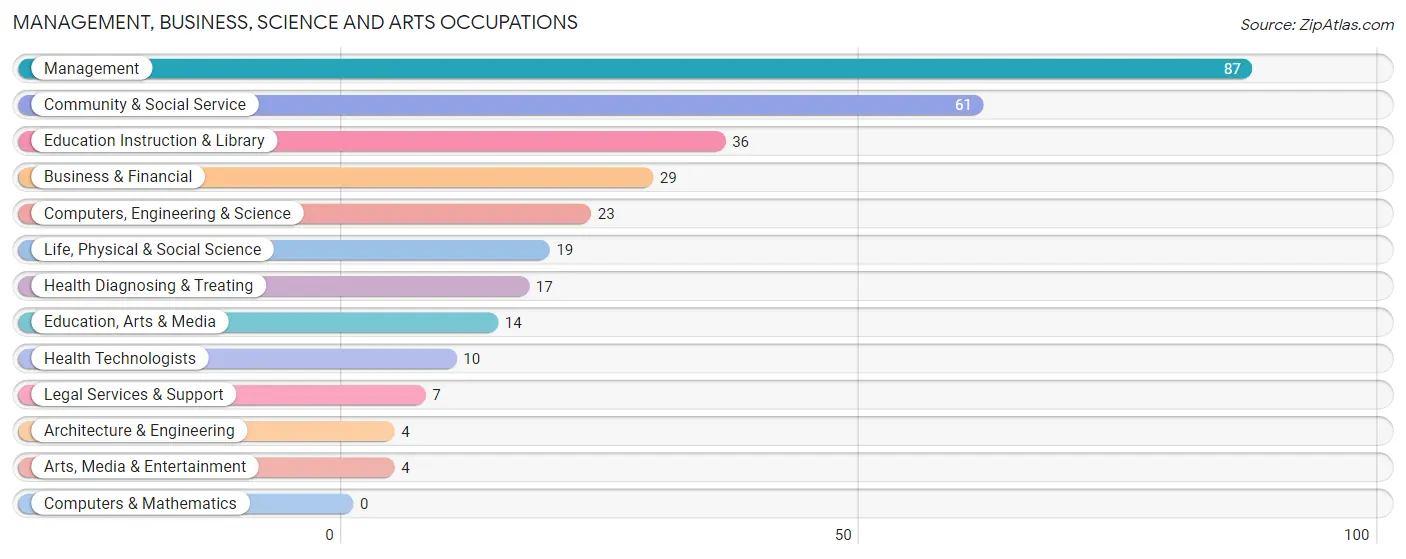
Management, Business, Science and Arts Occupations
The most common Management, Business, Science and Arts occupations in Enosburg Falls are Management (87 | 13.0%), Community & Social Service (61 | 9.1%), Education Instruction & Library (36 | 5.4%), Business & Financial (29 | 4.3%), and Computers, Engineering & Science (23 | 3.4%).
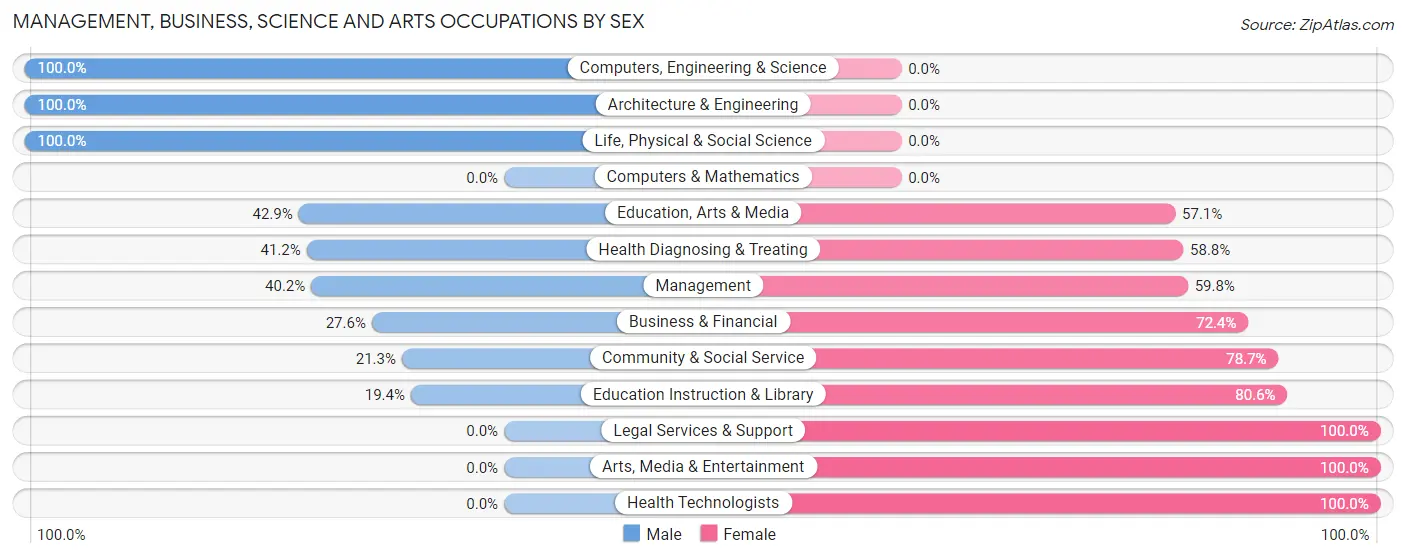
Management, Business, Science and Arts Occupations by Sex
Within the Management, Business, Science and Arts occupations in Enosburg Falls, the most male-oriented occupations are Computers, Engineering & Science (100.0%), Architecture & Engineering (100.0%), and Life, Physical & Social Science (100.0%), while the most female-oriented occupations are Legal Services & Support (100.0%), Arts, Media & Entertainment (100.0%), and Health Technologists (100.0%).
| Occupation | Male | Female |
| Management | 35 (40.2%) | 52 (59.8%) |
| Business & Financial | 8 (27.6%) | 21 (72.4%) |
| Computers, Engineering & Science | 23 (100.0%) | 0 (0.0%) |
| Computers & Mathematics | 0 (0.0%) | 0 (0.0%) |
| Architecture & Engineering | 4 (100.0%) | 0 (0.0%) |
| Life, Physical & Social Science | 19 (100.0%) | 0 (0.0%) |
| Community & Social Service | 13 (21.3%) | 48 (78.7%) |
| Education, Arts & Media | 6 (42.9%) | 8 (57.1%) |
| Legal Services & Support | 0 (0.0%) | 7 (100.0%) |
| Education Instruction & Library | 7 (19.4%) | 29 (80.6%) |
| Arts, Media & Entertainment | 0 (0.0%) | 4 (100.0%) |
| Health Diagnosing & Treating | 7 (41.2%) | 10 (58.8%) |
| Health Technologists | 0 (0.0%) | 10 (100.0%) |
| Total (Category) | 86 (39.6%) | 131 (60.4%) |
| Total (Overall) | 361 (54.0%) | 307 (46.0%) |
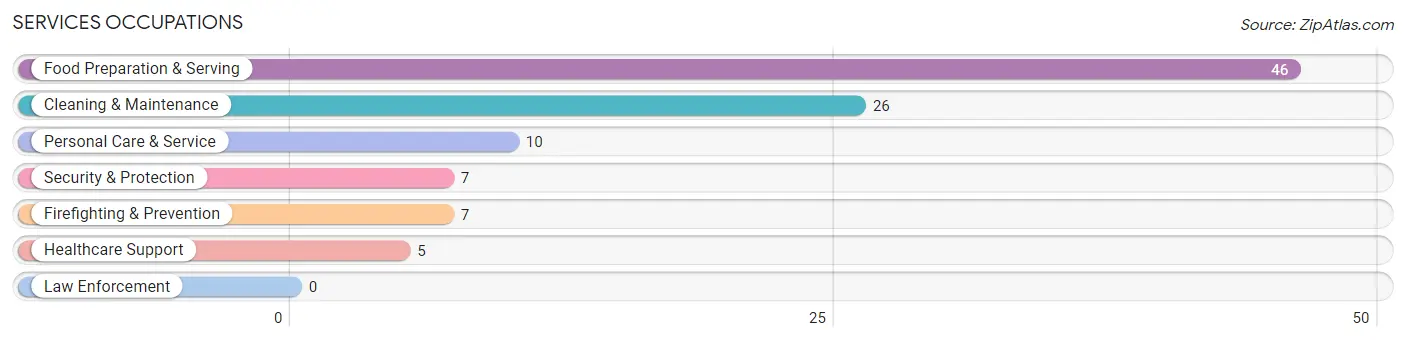
Services Occupations
The most common Services occupations in Enosburg Falls are Food Preparation & Serving (46 | 6.9%), Cleaning & Maintenance (26 | 3.9%), Personal Care & Service (10 | 1.5%), Security & Protection (7 | 1.1%), and Firefighting & Prevention (7 | 1.1%).
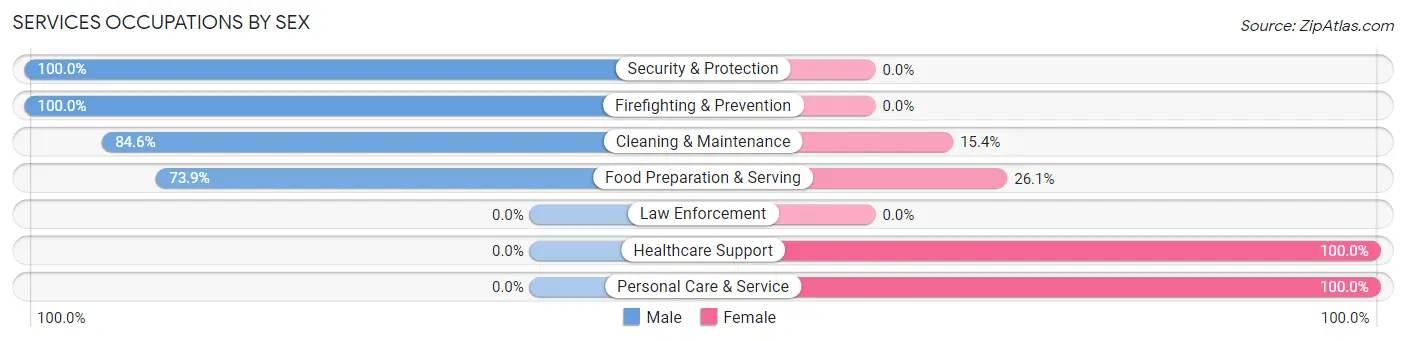
Services Occupations by Sex
Within the Services occupations in Enosburg Falls, the most male-oriented occupations are Security & Protection (100.0%), Firefighting & Prevention (100.0%), and Cleaning & Maintenance (84.6%), while the most female-oriented occupations are Healthcare Support (100.0%), Personal Care & Service (100.0%), and Food Preparation & Serving (26.1%).
| Occupation | Male | Female |
| Healthcare Support | 0 (0.0%) | 5 (100.0%) |
| Security & Protection | 7 (100.0%) | 0 (0.0%) |
| Firefighting & Prevention | 7 (100.0%) | 0 (0.0%) |
| Law Enforcement | 0 (0.0%) | 0 (0.0%) |
| Food Preparation & Serving | 34 (73.9%) | 12 (26.1%) |
| Cleaning & Maintenance | 22 (84.6%) | 4 (15.4%) |
| Personal Care & Service | 0 (0.0%) | 10 (100.0%) |
| Total (Category) | 63 (67.0%) | 31 (33.0%) |
| Total (Overall) | 361 (54.0%) | 307 (46.0%) |
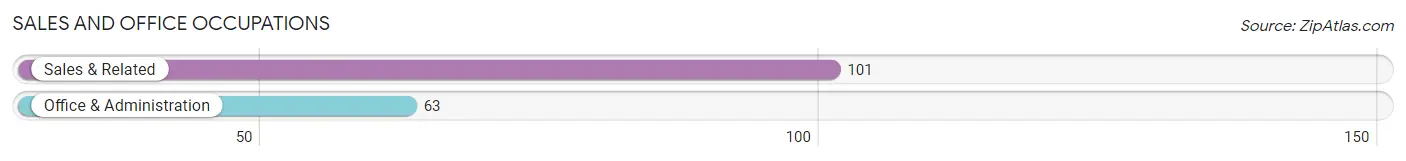
Sales and Office Occupations
The most common Sales and Office occupations in Enosburg Falls are Sales & Related (101 | 15.1%), and Office & Administration (63 | 9.4%).
Sales and Office Occupations by Sex
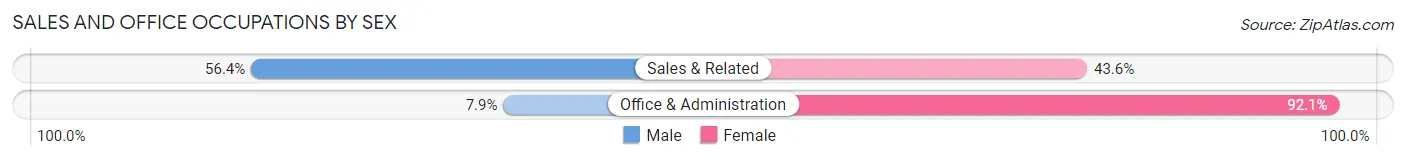
| Occupation | Male | Female |
| Sales & Related | 57 (56.4%) | 44 (43.6%) |
| Office & Administration | 5 (7.9%) | 58 (92.1%) |
| Total (Category) | 62 (37.8%) | 102 (62.2%) |
| Total (Overall) | 361 (54.0%) | 307 (46.0%) |
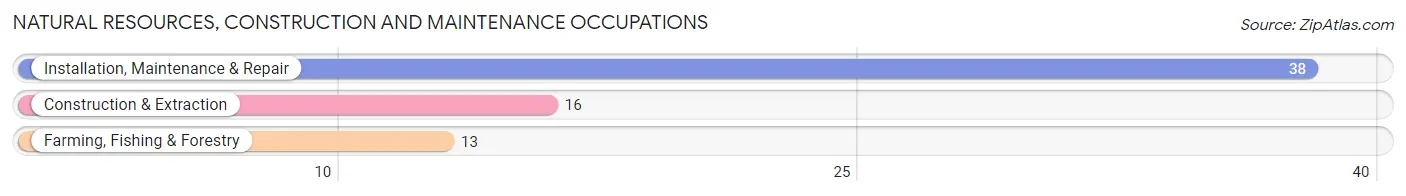
Natural Resources, Construction and Maintenance Occupations
The most common Natural Resources, Construction and Maintenance occupations in Enosburg Falls are Installation, Maintenance & Repair (38 | 5.7%), Construction & Extraction (16 | 2.4%), and Farming, Fishing & Forestry (13 | 1.9%).
Natural Resources, Construction and Maintenance Occupations by Sex
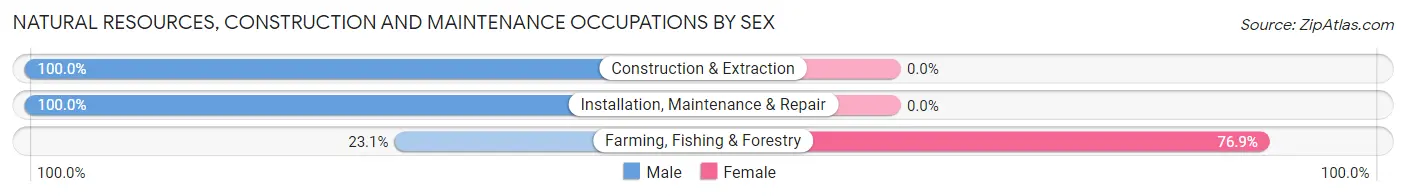
| Occupation | Male | Female |
| Farming, Fishing & Forestry | 3 (23.1%) | 10 (76.9%) |
| Construction & Extraction | 16 (100.0%) | 0 (0.0%) |
| Installation, Maintenance & Repair | 38 (100.0%) | 0 (0.0%) |
| Total (Category) | 57 (85.1%) | 10 (14.9%) |
| Total (Overall) | 361 (54.0%) | 307 (46.0%) |
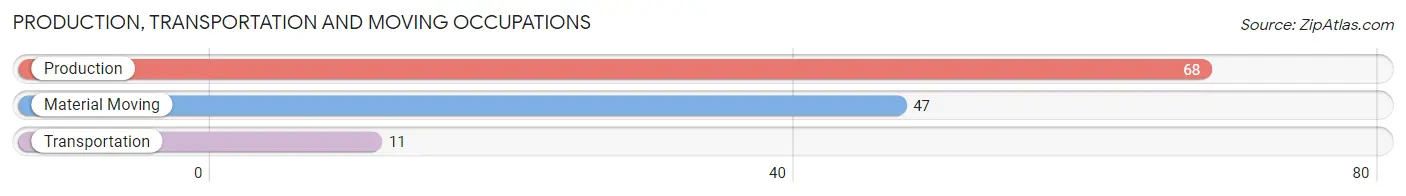
Production, Transportation and Moving Occupations
The most common Production, Transportation and Moving occupations in Enosburg Falls are Production (68 | 10.2%), Material Moving (47 | 7.0%), and Transportation (11 | 1.7%).
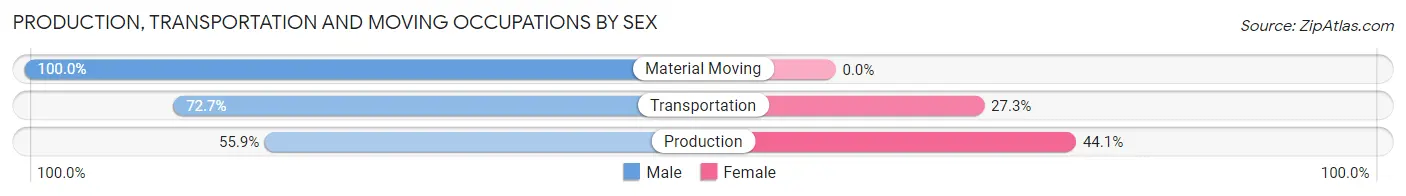
Production, Transportation and Moving Occupations by Sex
| Occupation | Male | Female |
| Production | 38 (55.9%) | 30 (44.1%) |
| Transportation | 8 (72.7%) | 3 (27.3%) |
| Material Moving | 47 (100.0%) | 0 (0.0%) |
| Total (Category) | 93 (73.8%) | 33 (26.2%) |
| Total (Overall) | 361 (54.0%) | 307 (46.0%) |
Employment Industries by Sex in Enosburg Falls
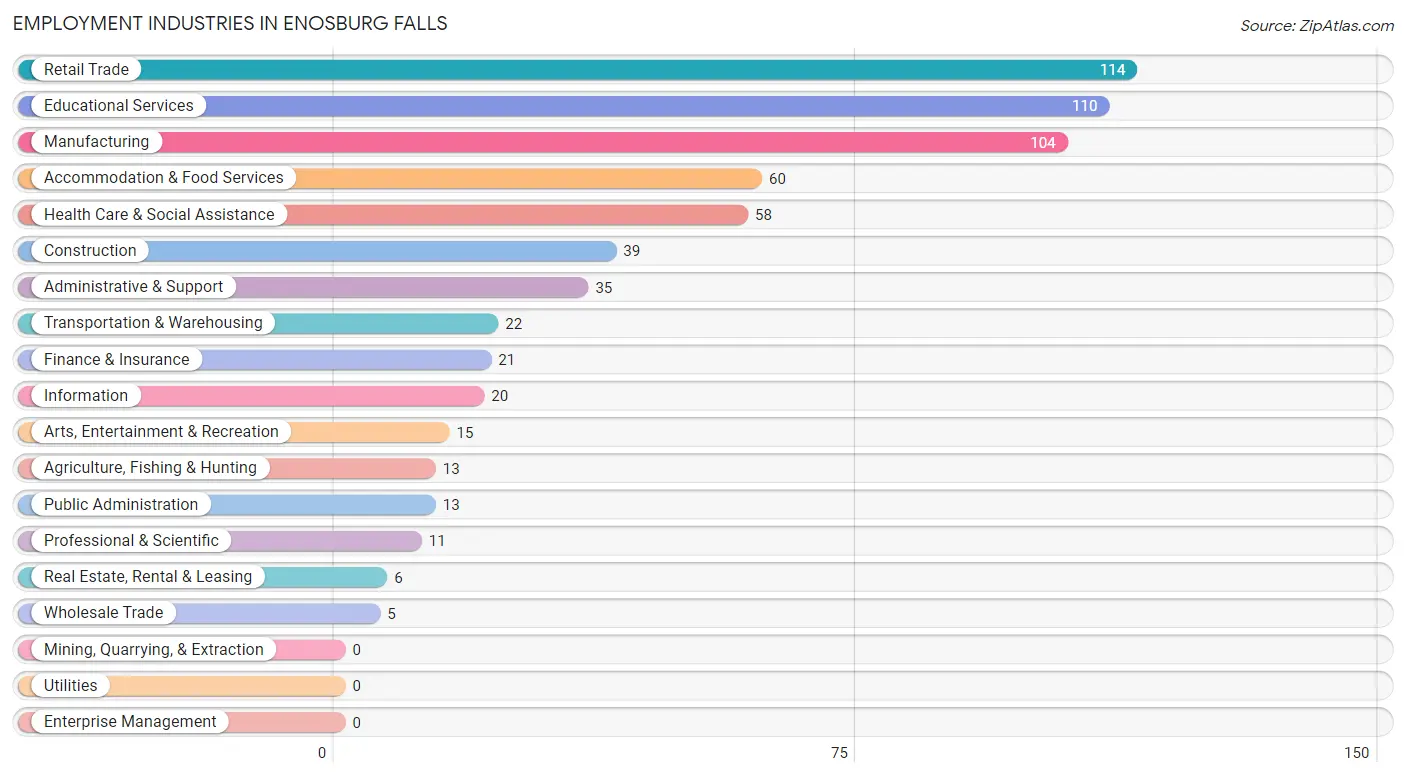
Employment Industries in Enosburg Falls
The major employment industries in Enosburg Falls include Retail Trade (114 | 17.1%), Educational Services (110 | 16.5%), Manufacturing (104 | 15.6%), Accommodation & Food Services (60 | 9.0%), and Health Care & Social Assistance (58 | 8.7%).
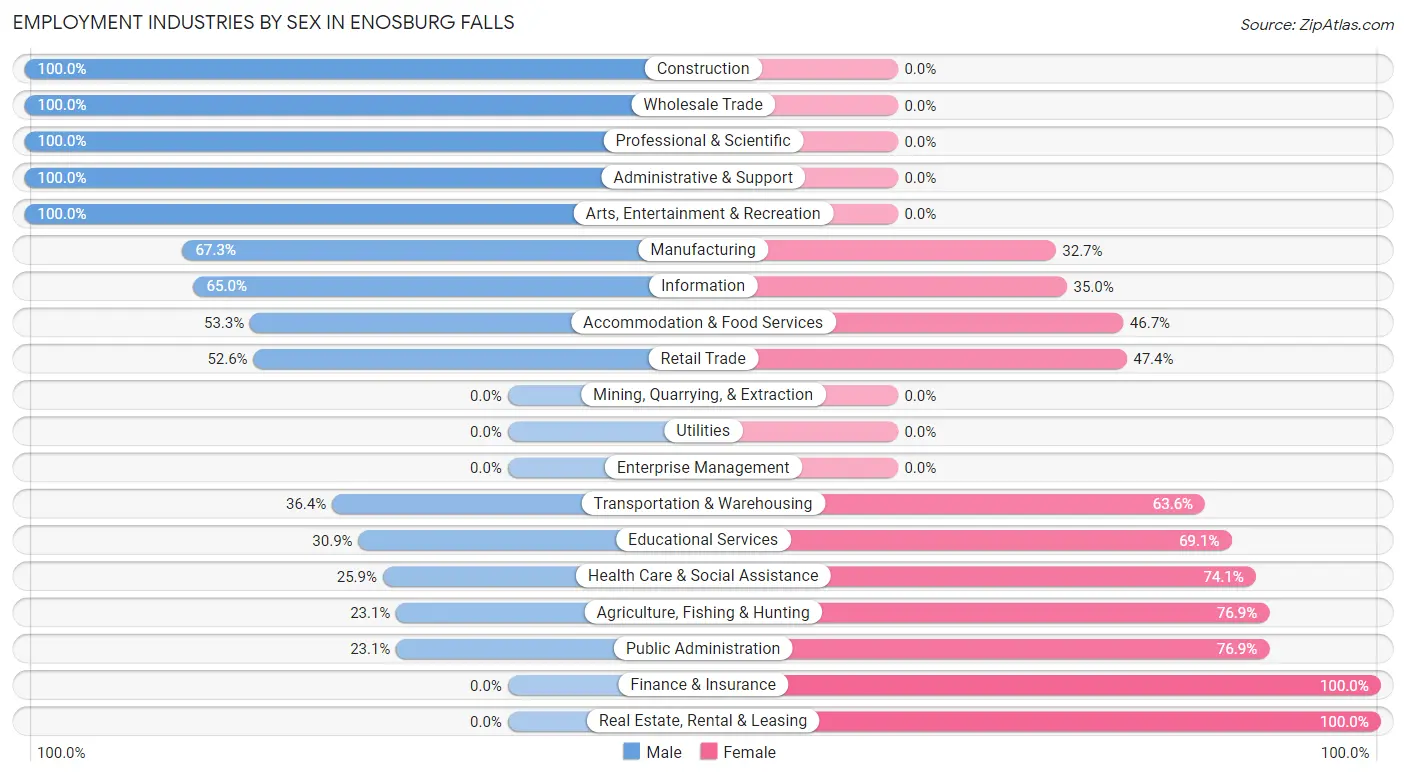
Employment Industries by Sex in Enosburg Falls
The Enosburg Falls industries that see more men than women are Construction (100.0%), Wholesale Trade (100.0%), and Professional & Scientific (100.0%), whereas the industries that tend to have a higher number of women are Finance & Insurance (100.0%), Real Estate, Rental & Leasing (100.0%), and Agriculture, Fishing & Hunting (76.9%).
| Industry | Male | Female |
| Agriculture, Fishing & Hunting | 3 (23.1%) | 10 (76.9%) |
| Mining, Quarrying, & Extraction | 0 (0.0%) | 0 (0.0%) |
| Construction | 39 (100.0%) | 0 (0.0%) |
| Manufacturing | 70 (67.3%) | 34 (32.7%) |
| Wholesale Trade | 5 (100.0%) | 0 (0.0%) |
| Retail Trade | 60 (52.6%) | 54 (47.4%) |
| Transportation & Warehousing | 8 (36.4%) | 14 (63.6%) |
| Utilities | 0 (0.0%) | 0 (0.0%) |
| Information | 13 (65.0%) | 7 (35.0%) |
| Finance & Insurance | 0 (0.0%) | 21 (100.0%) |
| Real Estate, Rental & Leasing | 0 (0.0%) | 6 (100.0%) |
| Professional & Scientific | 11 (100.0%) | 0 (0.0%) |
| Enterprise Management | 0 (0.0%) | 0 (0.0%) |
| Administrative & Support | 35 (100.0%) | 0 (0.0%) |
| Educational Services | 34 (30.9%) | 76 (69.1%) |
| Health Care & Social Assistance | 15 (25.9%) | 43 (74.1%) |
| Arts, Entertainment & Recreation | 15 (100.0%) | 0 (0.0%) |
| Accommodation & Food Services | 32 (53.3%) | 28 (46.7%) |
| Public Administration | 3 (23.1%) | 10 (76.9%) |
| Total | 361 (54.0%) | 307 (46.0%) |
Education in Enosburg Falls
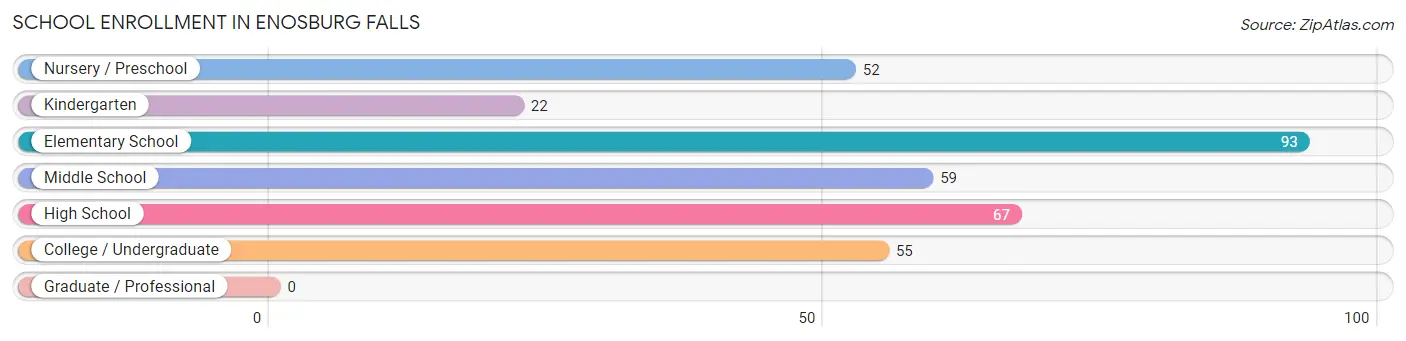
School Enrollment in Enosburg Falls
The most common levels of schooling among the 348 students in Enosburg Falls are elementary school (93 | 26.7%), high school (67 | 19.3%), and middle school (59 | 17.0%).
| School Level | # Students | % Students |
| Nursery / Preschool | 52 | 14.9% |
| Kindergarten | 22 | 6.3% |
| Elementary School | 93 | 26.7% |
| Middle School | 59 | 17.0% |
| High School | 67 | 19.3% |
| College / Undergraduate | 55 | 15.8% |
| Graduate / Professional | 0 | 0.0% |
| Total | 348 | 100.0% |
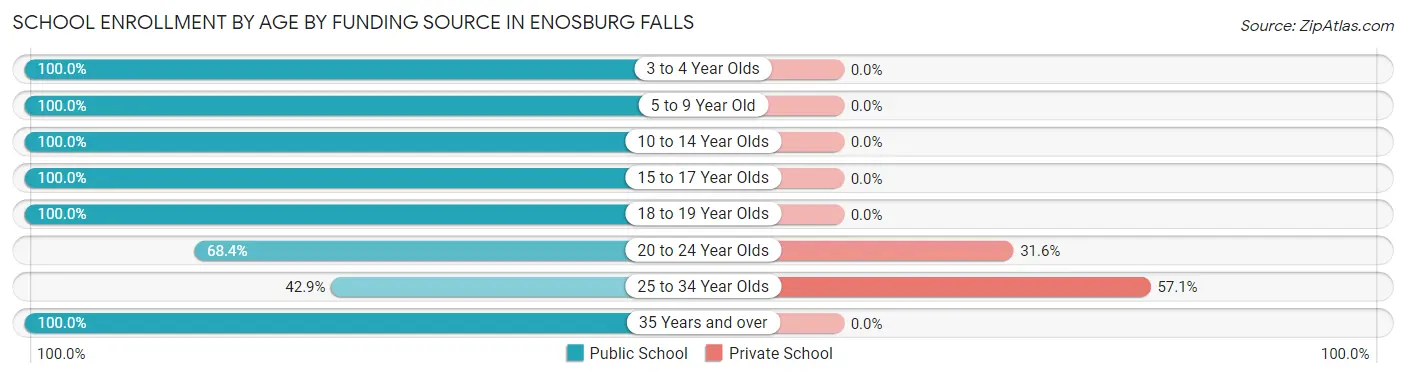
School Enrollment by Age by Funding Source in Enosburg Falls
Out of a total of 348 students who are enrolled in schools in Enosburg Falls, 16 (4.6%) attend a private institution, while the remaining 332 (95.4%) are enrolled in public schools. The age group of 25 to 34 year olds has the highest likelihood of being enrolled in private schools, with 4 (57.1% in the age bracket) enrolled. Conversely, the age group of 3 to 4 year olds has the lowest likelihood of being enrolled in a private school, with 35 (100.0% in the age bracket) attending a public institution.
| Age Bracket | Public School | Private School |
| 3 to 4 Year Olds | 35 (100.0%) | 0 (0.0%) |
| 5 to 9 Year Old | 126 (100.0%) | 0 (0.0%) |
| 10 to 14 Year Olds | 71 (100.0%) | 0 (0.0%) |
| 15 to 17 Year Olds | 41 (100.0%) | 0 (0.0%) |
| 18 to 19 Year Olds | 22 (100.0%) | 0 (0.0%) |
| 20 to 24 Year Olds | 26 (68.4%) | 12 (31.6%) |
| 25 to 34 Year Olds | 3 (42.9%) | 4 (57.1%) |
| 35 Years and over | 8 (100.0%) | 0 (0.0%) |
| Total | 332 (95.4%) | 16 (4.6%) |
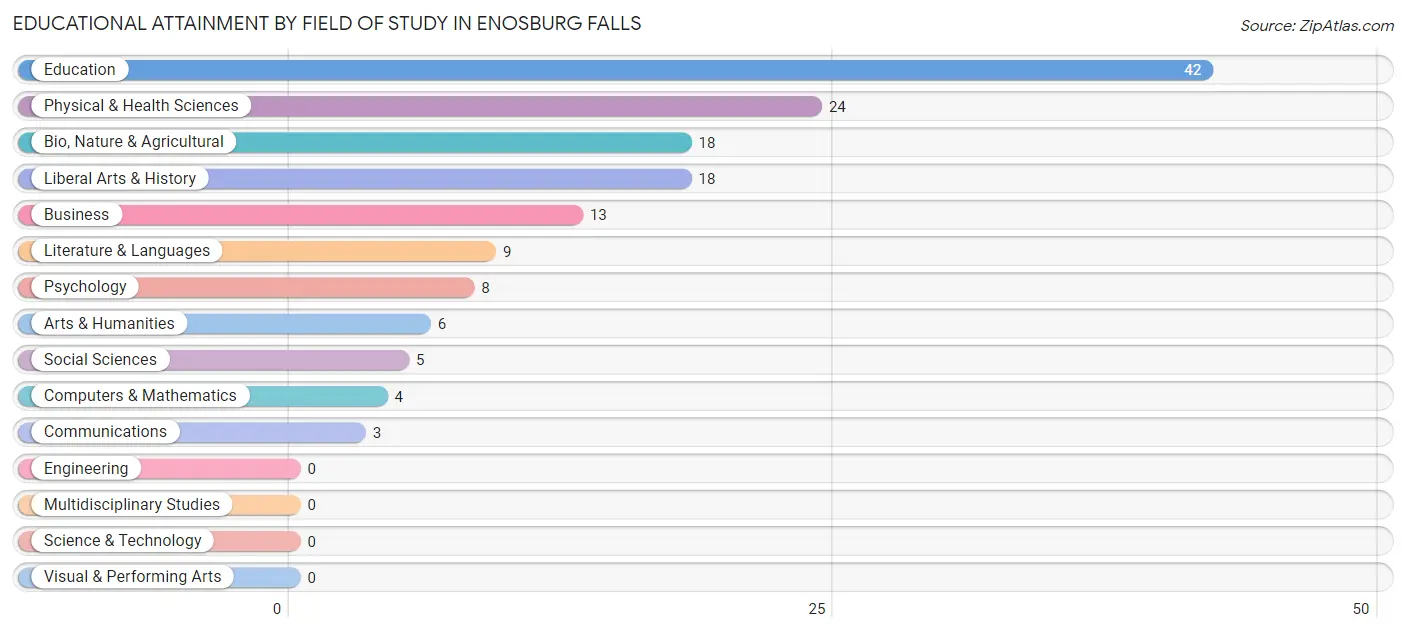
Educational Attainment by Field of Study in Enosburg Falls
Education (42 | 28.0%), physical & health sciences (24 | 16.0%), bio, nature & agricultural (18 | 12.0%), liberal arts & history (18 | 12.0%), and business (13 | 8.7%) are the most common fields of study among 150 individuals in Enosburg Falls who have obtained a bachelor's degree or higher.
| Field of Study | # Graduates | % Graduates |
| Computers & Mathematics | 4 | 2.7% |
| Bio, Nature & Agricultural | 18 | 12.0% |
| Physical & Health Sciences | 24 | 16.0% |
| Psychology | 8 | 5.3% |
| Social Sciences | 5 | 3.3% |
| Engineering | 0 | 0.0% |
| Multidisciplinary Studies | 0 | 0.0% |
| Science & Technology | 0 | 0.0% |
| Business | 13 | 8.7% |
| Education | 42 | 28.0% |
| Literature & Languages | 9 | 6.0% |
| Liberal Arts & History | 18 | 12.0% |
| Visual & Performing Arts | 0 | 0.0% |
| Communications | 3 | 2.0% |
| Arts & Humanities | 6 | 4.0% |
| Total | 150 | 100.0% |
Transportation & Commute in Enosburg Falls
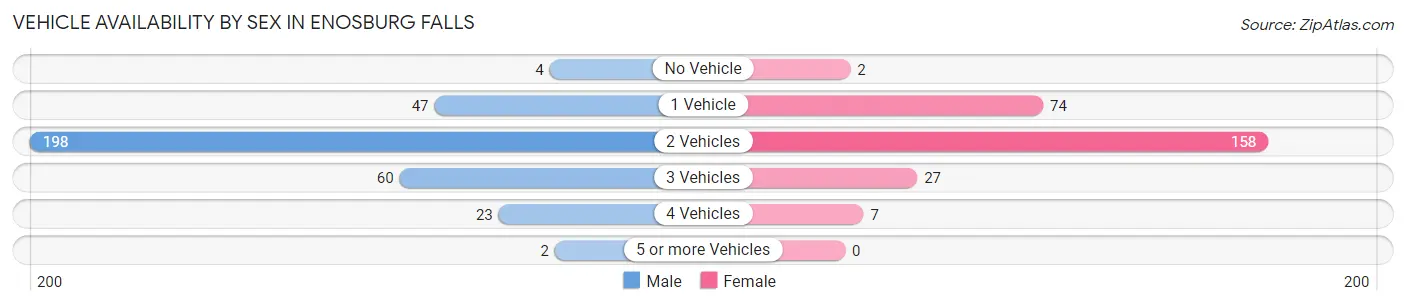
Vehicle Availability by Sex in Enosburg Falls
The most prevalent vehicle ownership categories in Enosburg Falls are males with 2 vehicles (198, accounting for 59.3%) and females with 2 vehicles (158, making up 73.9%).
| Vehicles Available | Male | Female |
| No Vehicle | 4 (1.2%) | 2 (0.7%) |
| 1 Vehicle | 47 (14.1%) | 74 (27.6%) |
| 2 Vehicles | 198 (59.3%) | 158 (59.0%) |
| 3 Vehicles | 60 (18.0%) | 27 (10.1%) |
| 4 Vehicles | 23 (6.9%) | 7 (2.6%) |
| 5 or more Vehicles | 2 (0.6%) | 0 (0.0%) |
| Total | 334 (100.0%) | 268 (100.0%) |
Commute Time in Enosburg Falls
The most frequently occuring commute durations in Enosburg Falls are 5 to 9 minutes (130 commuters, 22.2%), 60 to 89 minutes (74 commuters, 12.6%), and less than 5 minutes (70 commuters, 11.9%).
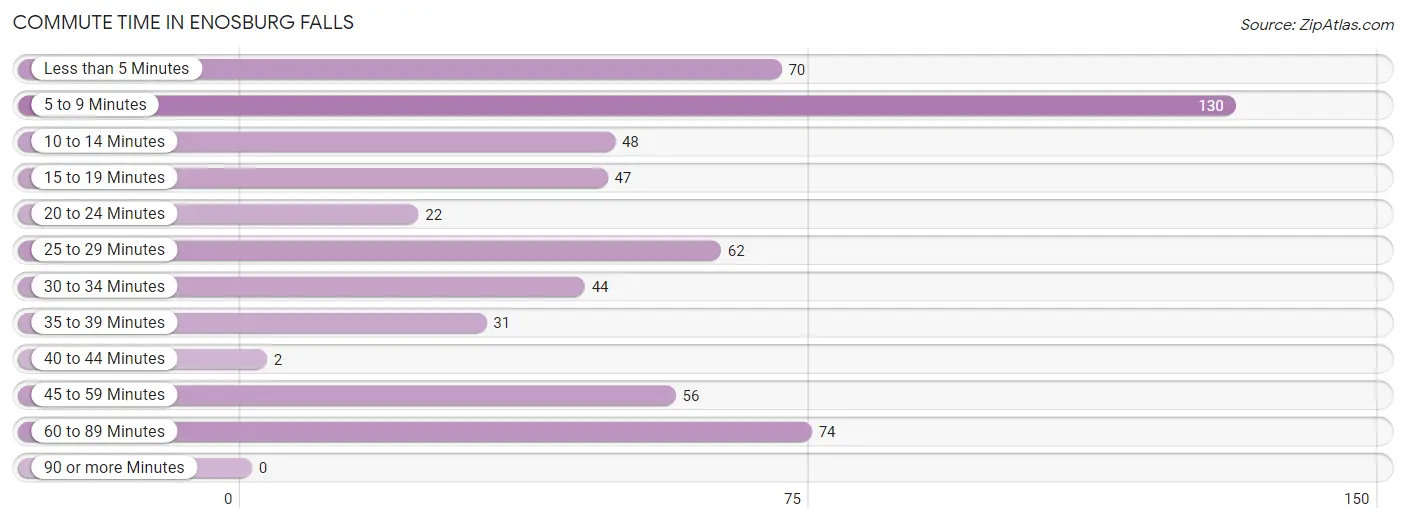
| Commute Time | # Commuters | % Commuters |
| Less than 5 Minutes | 70 | 11.9% |
| 5 to 9 Minutes | 130 | 22.2% |
| 10 to 14 Minutes | 48 | 8.2% |
| 15 to 19 Minutes | 47 | 8.0% |
| 20 to 24 Minutes | 22 | 3.7% |
| 25 to 29 Minutes | 62 | 10.6% |
| 30 to 34 Minutes | 44 | 7.5% |
| 35 to 39 Minutes | 31 | 5.3% |
| 40 to 44 Minutes | 2 | 0.3% |
| 45 to 59 Minutes | 56 | 9.6% |
| 60 to 89 Minutes | 74 | 12.6% |
| 90 or more Minutes | 0 | 0.0% |
Commute Time by Sex in Enosburg Falls
The most common commute times in Enosburg Falls are 5 to 9 minutes (64 commuters, 19.3%) for males and 5 to 9 minutes (66 commuters, 25.9%) for females.
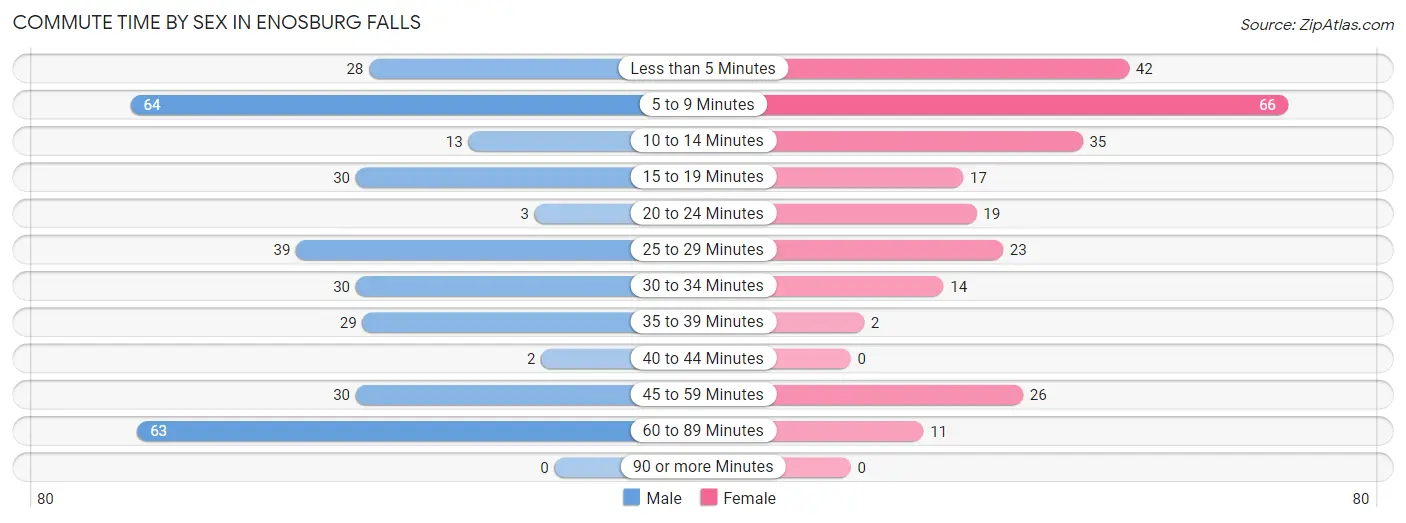
| Commute Time | Male | Female |
| Less than 5 Minutes | 28 (8.5%) | 42 (16.5%) |
| 5 to 9 Minutes | 64 (19.3%) | 66 (25.9%) |
| 10 to 14 Minutes | 13 (3.9%) | 35 (13.7%) |
| 15 to 19 Minutes | 30 (9.1%) | 17 (6.7%) |
| 20 to 24 Minutes | 3 (0.9%) | 19 (7.4%) |
| 25 to 29 Minutes | 39 (11.8%) | 23 (9.0%) |
| 30 to 34 Minutes | 30 (9.1%) | 14 (5.5%) |
| 35 to 39 Minutes | 29 (8.8%) | 2 (0.8%) |
| 40 to 44 Minutes | 2 (0.6%) | 0 (0.0%) |
| 45 to 59 Minutes | 30 (9.1%) | 26 (10.2%) |
| 60 to 89 Minutes | 63 (19.0%) | 11 (4.3%) |
| 90 or more Minutes | 0 (0.0%) | 0 (0.0%) |
Time of Departure to Work by Sex in Enosburg Falls
The most frequent times of departure to work in Enosburg Falls are 6:30 AM to 6:59 AM (74, 22.4%) for males and 8:00 AM to 8:29 AM (40, 15.7%) for females.
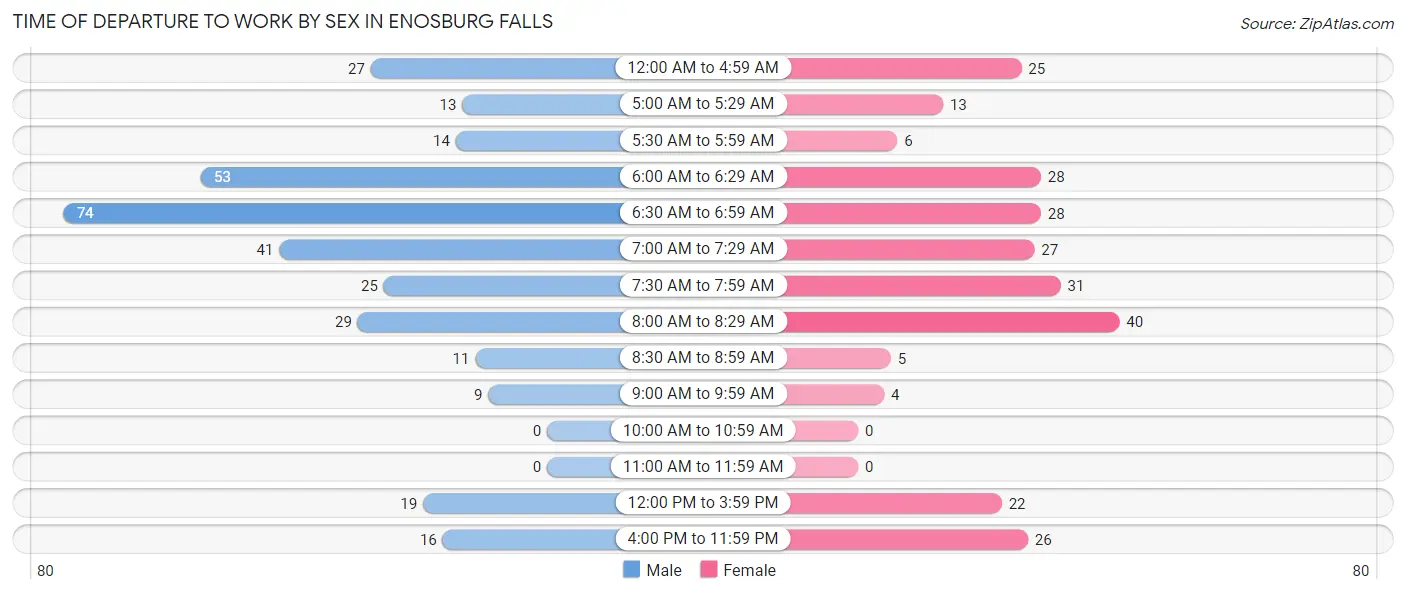
| Time of Departure | Male | Female |
| 12:00 AM to 4:59 AM | 27 (8.2%) | 25 (9.8%) |
| 5:00 AM to 5:29 AM | 13 (3.9%) | 13 (5.1%) |
| 5:30 AM to 5:59 AM | 14 (4.2%) | 6 (2.4%) |
| 6:00 AM to 6:29 AM | 53 (16.0%) | 28 (11.0%) |
| 6:30 AM to 6:59 AM | 74 (22.4%) | 28 (11.0%) |
| 7:00 AM to 7:29 AM | 41 (12.4%) | 27 (10.6%) |
| 7:30 AM to 7:59 AM | 25 (7.5%) | 31 (12.2%) |
| 8:00 AM to 8:29 AM | 29 (8.8%) | 40 (15.7%) |
| 8:30 AM to 8:59 AM | 11 (3.3%) | 5 (2.0%) |
| 9:00 AM to 9:59 AM | 9 (2.7%) | 4 (1.6%) |
| 10:00 AM to 10:59 AM | 0 (0.0%) | 0 (0.0%) |
| 11:00 AM to 11:59 AM | 0 (0.0%) | 0 (0.0%) |
| 12:00 PM to 3:59 PM | 19 (5.7%) | 22 (8.6%) |
| 4:00 PM to 11:59 PM | 16 (4.8%) | 26 (10.2%) |
| Total | 331 (100.0%) | 255 (100.0%) |
Housing Occupancy in Enosburg Falls
Occupancy by Ownership in Enosburg Falls
Of the total 565 dwellings in Enosburg Falls, owner-occupied units account for 393 (69.6%), while renter-occupied units make up 172 (30.4%).
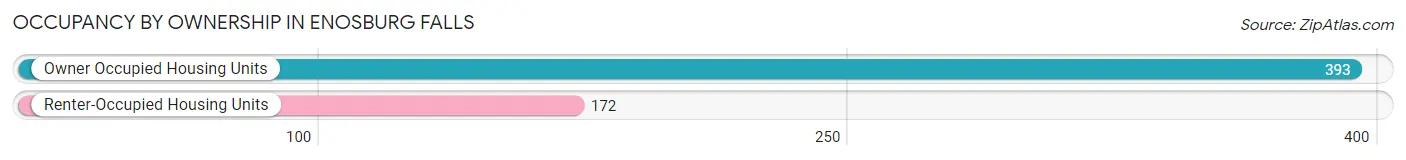
| Occupancy | # Housing Units | % Housing Units |
| Owner Occupied Housing Units | 393 | 69.6% |
| Renter-Occupied Housing Units | 172 | 30.4% |
| Total Occupied Housing Units | 565 | 100.0% |
Occupancy by Household Size in Enosburg Falls
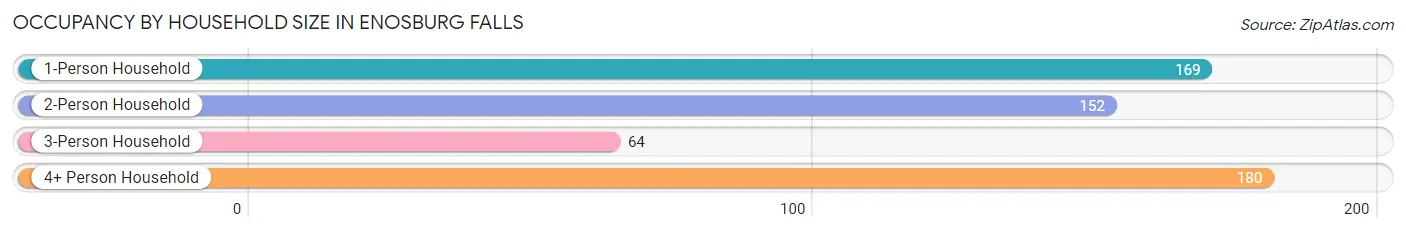
| Household Size | # Housing Units | % Housing Units |
| 1-Person Household | 169 | 29.9% |
| 2-Person Household | 152 | 26.9% |
| 3-Person Household | 64 | 11.3% |
| 4+ Person Household | 180 | 31.9% |
| Total Housing Units | 565 | 100.0% |
Occupancy by Ownership by Household Size in Enosburg Falls
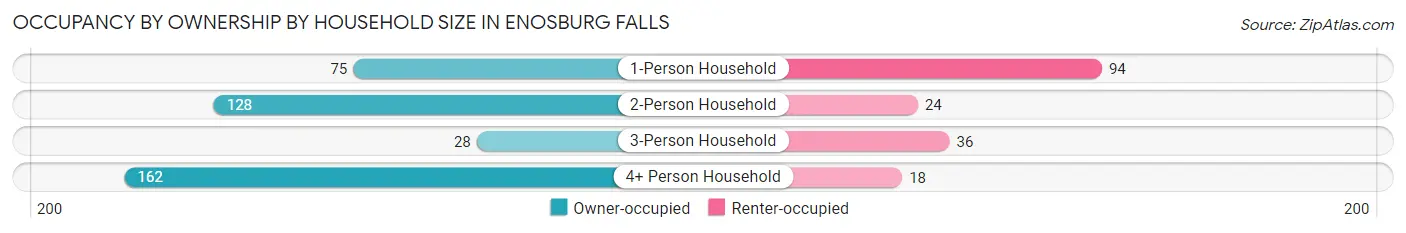
| Household Size | Owner-occupied | Renter-occupied |
| 1-Person Household | 75 (44.4%) | 94 (55.6%) |
| 2-Person Household | 128 (84.2%) | 24 (15.8%) |
| 3-Person Household | 28 (43.8%) | 36 (56.2%) |
| 4+ Person Household | 162 (90.0%) | 18 (10.0%) |
| Total Housing Units | 393 (69.6%) | 172 (30.4%) |
Occupancy by Educational Attainment in Enosburg Falls
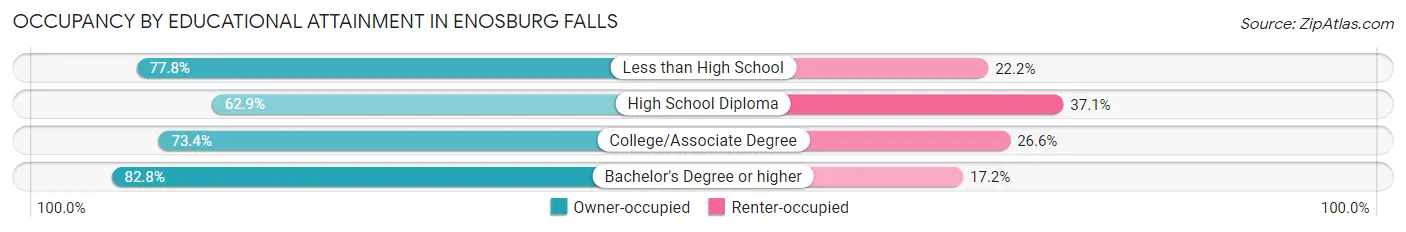
| Household Size | Owner-occupied | Renter-occupied |
| Less than High School | 28 (77.8%) | 8 (22.2%) |
| High School Diploma | 188 (62.9%) | 111 (37.1%) |
| College/Associate Degree | 105 (73.4%) | 38 (26.6%) |
| Bachelor's Degree or higher | 72 (82.8%) | 15 (17.2%) |
Occupancy by Age of Householder in Enosburg Falls
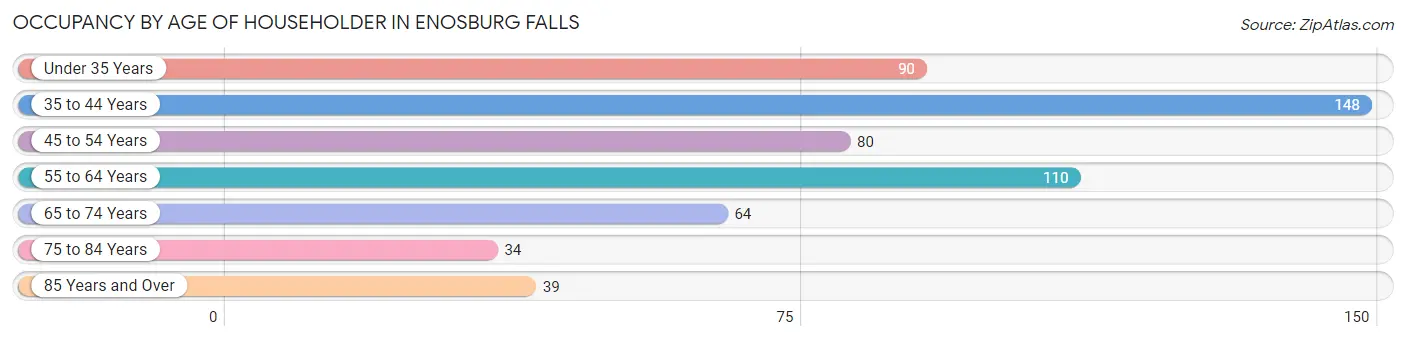
| Age Bracket | # Households | % Households |
| Under 35 Years | 90 | 15.9% |
| 35 to 44 Years | 148 | 26.2% |
| 45 to 54 Years | 80 | 14.2% |
| 55 to 64 Years | 110 | 19.5% |
| 65 to 74 Years | 64 | 11.3% |
| 75 to 84 Years | 34 | 6.0% |
| 85 Years and Over | 39 | 6.9% |
| Total | 565 | 100.0% |
Housing Finances in Enosburg Falls
Median Income by Occupancy in Enosburg Falls
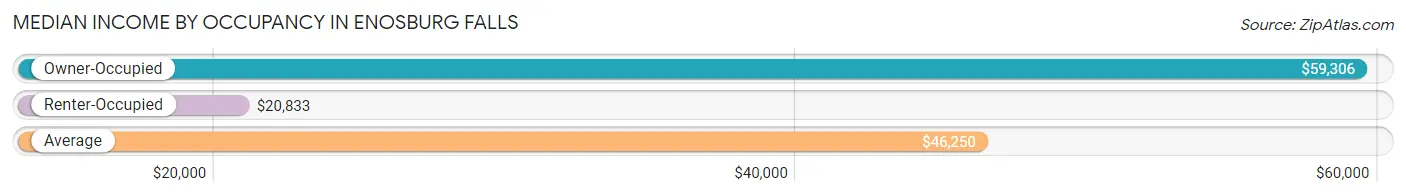
| Occupancy Type | # Households | Median Income |
| Owner-Occupied | 393 (69.6%) | $59,306 |
| Renter-Occupied | 172 (30.4%) | $20,833 |
| Average | 565 (100.0%) | $46,250 |
Occupancy by Householder Income Bracket in Enosburg Falls
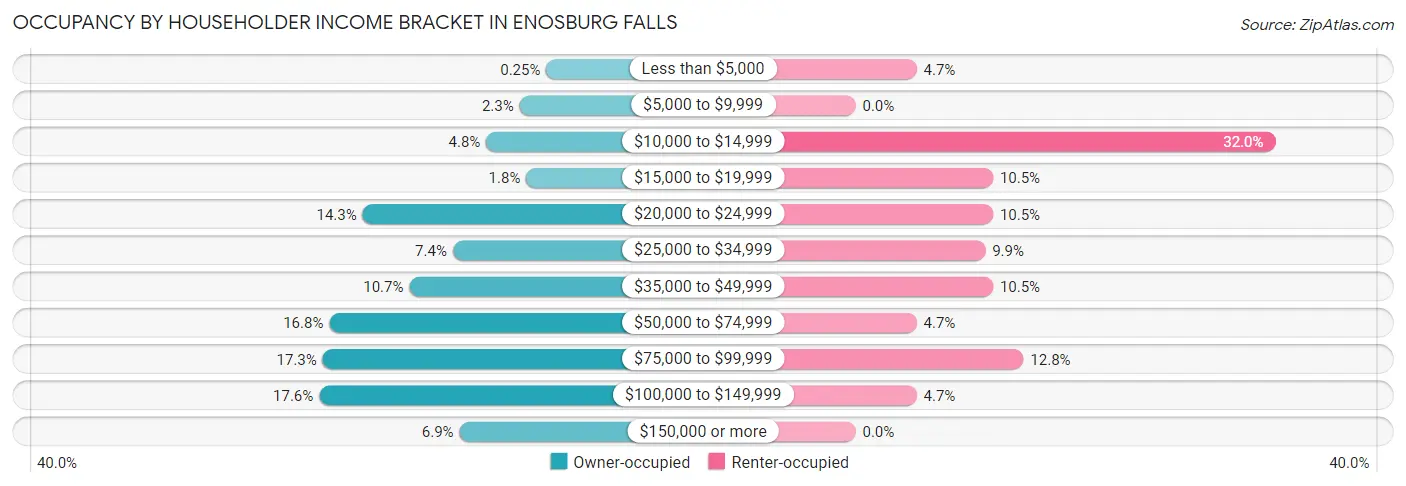
| Income Bracket | Owner-occupied | Renter-occupied |
| Less than $5,000 | 1 (0.3%) | 8 (4.6%) |
| $5,000 to $9,999 | 9 (2.3%) | 0 (0.0%) |
| $10,000 to $14,999 | 19 (4.8%) | 55 (32.0%) |
| $15,000 to $19,999 | 7 (1.8%) | 18 (10.5%) |
| $20,000 to $24,999 | 56 (14.2%) | 18 (10.5%) |
| $25,000 to $34,999 | 29 (7.4%) | 17 (9.9%) |
| $35,000 to $49,999 | 42 (10.7%) | 18 (10.5%) |
| $50,000 to $74,999 | 66 (16.8%) | 8 (4.6%) |
| $75,000 to $99,999 | 68 (17.3%) | 22 (12.8%) |
| $100,000 to $149,999 | 69 (17.6%) | 8 (4.6%) |
| $150,000 or more | 27 (6.9%) | 0 (0.0%) |
| Total | 393 (100.0%) | 172 (100.0%) |
Monthly Housing Cost Tiers in Enosburg Falls
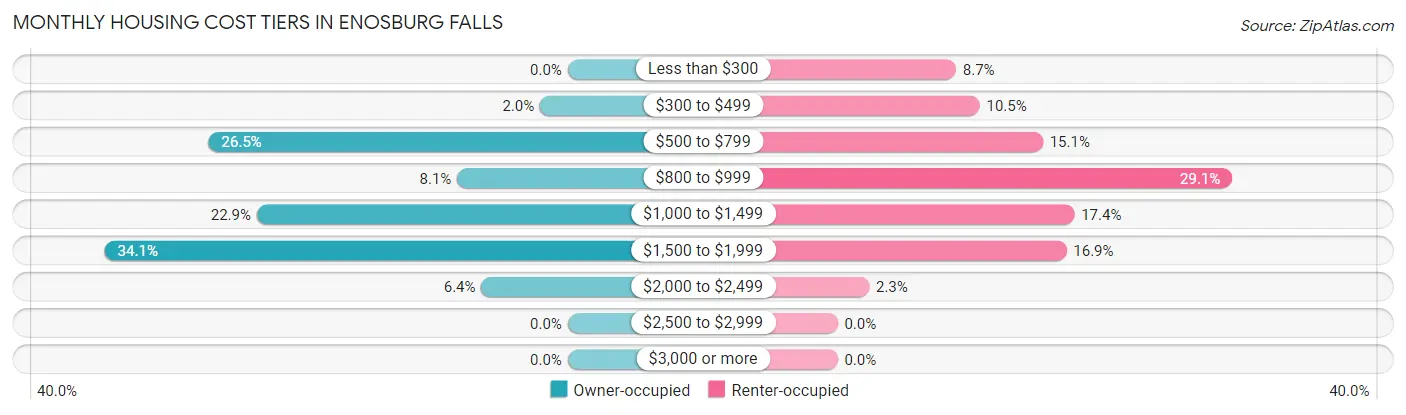
| Monthly Cost | Owner-occupied | Renter-occupied |
| Less than $300 | 0 (0.0%) | 15 (8.7%) |
| $300 to $499 | 8 (2.0%) | 18 (10.5%) |
| $500 to $799 | 104 (26.5%) | 26 (15.1%) |
| $800 to $999 | 32 (8.1%) | 50 (29.1%) |
| $1,000 to $1,499 | 90 (22.9%) | 30 (17.4%) |
| $1,500 to $1,999 | 134 (34.1%) | 29 (16.9%) |
| $2,000 to $2,499 | 25 (6.4%) | 4 (2.3%) |
| $2,500 to $2,999 | 0 (0.0%) | 0 (0.0%) |
| $3,000 or more | 0 (0.0%) | 0 (0.0%) |
| Total | 393 (100.0%) | 172 (100.0%) |
Physical Housing Characteristics in Enosburg Falls
Housing Structures in Enosburg Falls
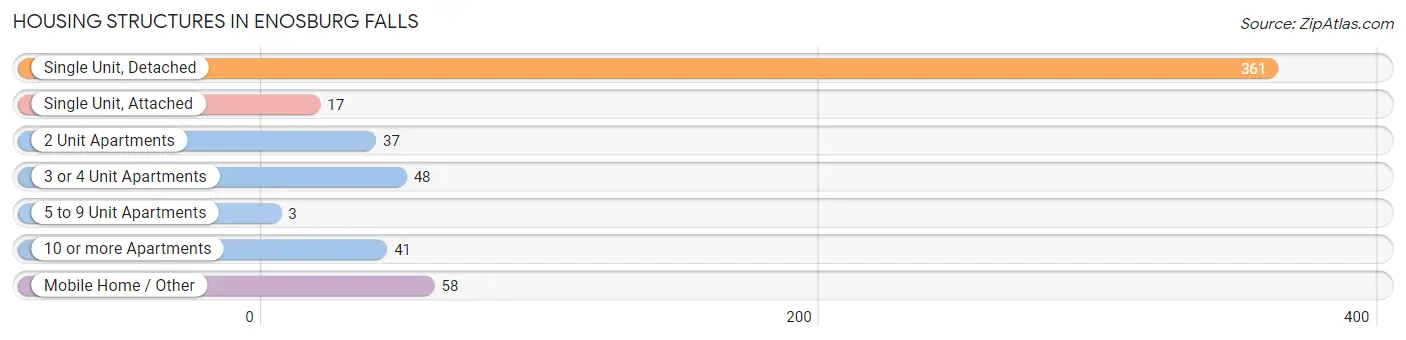
| Structure Type | # Housing Units | % Housing Units |
| Single Unit, Detached | 361 | 63.9% |
| Single Unit, Attached | 17 | 3.0% |
| 2 Unit Apartments | 37 | 6.6% |
| 3 or 4 Unit Apartments | 48 | 8.5% |
| 5 to 9 Unit Apartments | 3 | 0.5% |
| 10 or more Apartments | 41 | 7.3% |
| Mobile Home / Other | 58 | 10.3% |
| Total | 565 | 100.0% |
Housing Structures by Occupancy in Enosburg Falls
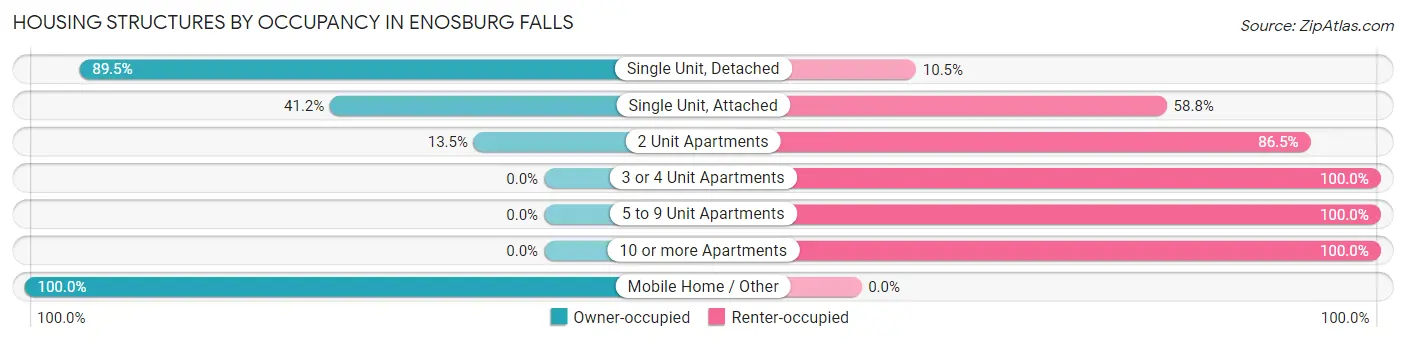
| Structure Type | Owner-occupied | Renter-occupied |
| Single Unit, Detached | 323 (89.5%) | 38 (10.5%) |
| Single Unit, Attached | 7 (41.2%) | 10 (58.8%) |
| 2 Unit Apartments | 5 (13.5%) | 32 (86.5%) |
| 3 or 4 Unit Apartments | 0 (0.0%) | 48 (100.0%) |
| 5 to 9 Unit Apartments | 0 (0.0%) | 3 (100.0%) |
| 10 or more Apartments | 0 (0.0%) | 41 (100.0%) |
| Mobile Home / Other | 58 (100.0%) | 0 (0.0%) |
| Total | 393 (69.6%) | 172 (30.4%) |
Housing Structures by Number of Rooms in Enosburg Falls
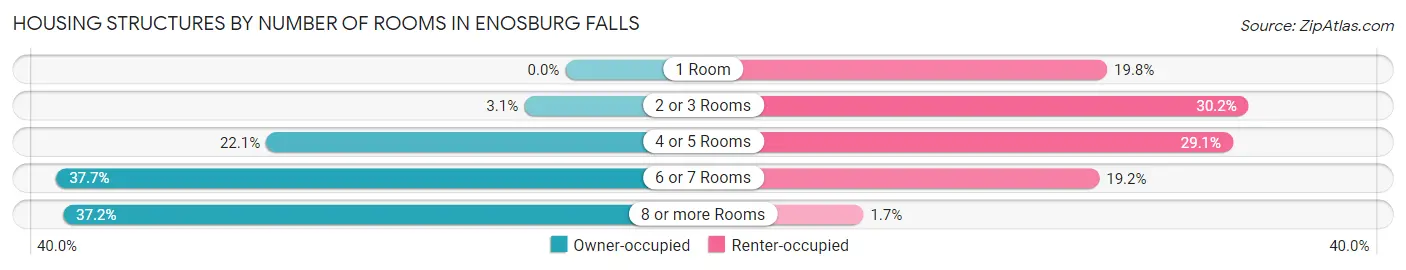
| Number of Rooms | Owner-occupied | Renter-occupied |
| 1 Room | 0 (0.0%) | 34 (19.8%) |
| 2 or 3 Rooms | 12 (3.0%) | 52 (30.2%) |
| 4 or 5 Rooms | 87 (22.1%) | 50 (29.1%) |
| 6 or 7 Rooms | 148 (37.7%) | 33 (19.2%) |
| 8 or more Rooms | 146 (37.1%) | 3 (1.7%) |
| Total | 393 (100.0%) | 172 (100.0%) |
Housing Structure by Heating Type in Enosburg Falls
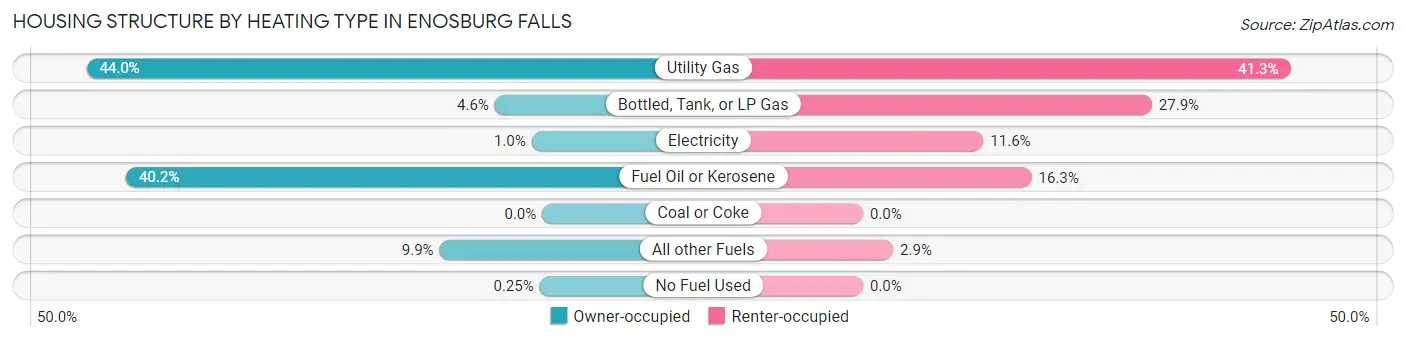
| Heating Type | Owner-occupied | Renter-occupied |
| Utility Gas | 173 (44.0%) | 71 (41.3%) |
| Bottled, Tank, or LP Gas | 18 (4.6%) | 48 (27.9%) |
| Electricity | 4 (1.0%) | 20 (11.6%) |
| Fuel Oil or Kerosene | 158 (40.2%) | 28 (16.3%) |
| Coal or Coke | 0 (0.0%) | 0 (0.0%) |
| All other Fuels | 39 (9.9%) | 5 (2.9%) |
| No Fuel Used | 1 (0.3%) | 0 (0.0%) |
| Total | 393 (100.0%) | 172 (100.0%) |
Household Vehicle Usage in Enosburg Falls
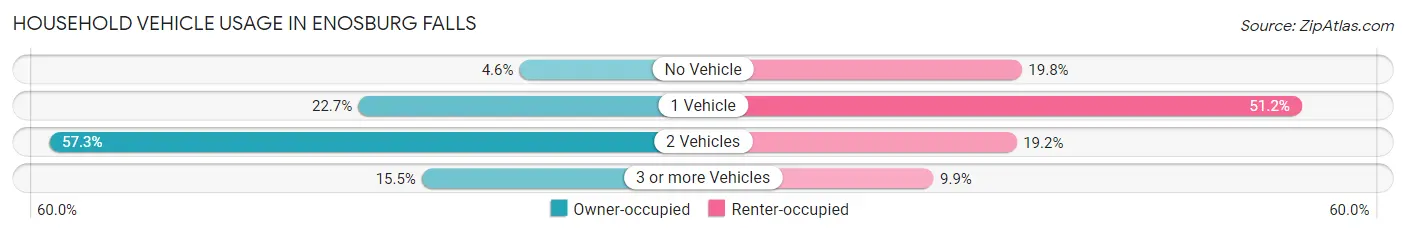
| Vehicles per Household | Owner-occupied | Renter-occupied |
| No Vehicle | 18 (4.6%) | 34 (19.8%) |
| 1 Vehicle | 89 (22.7%) | 88 (51.2%) |
| 2 Vehicles | 225 (57.3%) | 33 (19.2%) |
| 3 or more Vehicles | 61 (15.5%) | 17 (9.9%) |
| Total | 393 (100.0%) | 172 (100.0%) |
Real Estate & Mortgages in Enosburg Falls
Real Estate and Mortgage Overview in Enosburg Falls
| Characteristic | Without Mortgage | With Mortgage |
| Housing Units | 122 | 271 |
| Median Property Value | $175,000 | $191,400 |
| Median Household Income | $48,125 | $13 |
| Monthly Housing Costs | $708 | $0 |
| Real Estate Taxes | $2,625 | $7 |
Property Value by Mortgage Status in Enosburg Falls
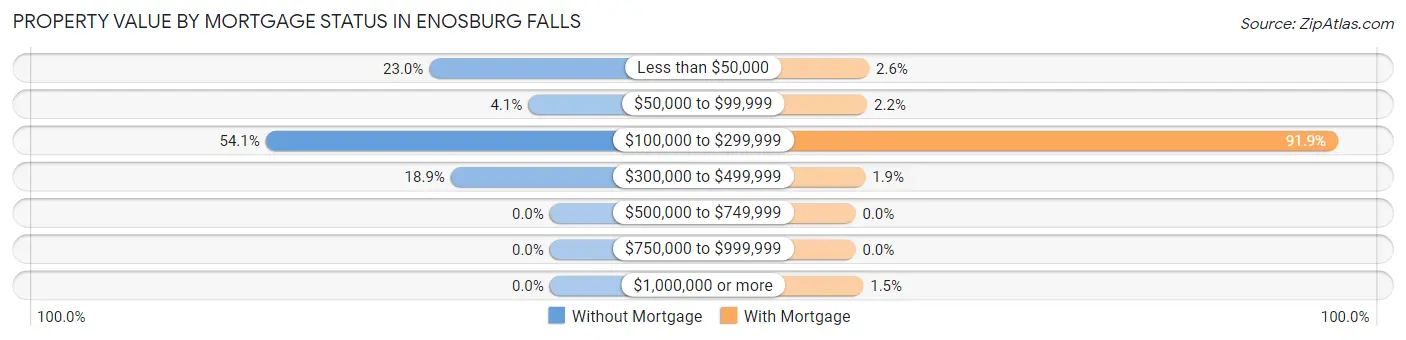
| Property Value | Without Mortgage | With Mortgage |
| Less than $50,000 | 28 (23.0%) | 7 (2.6%) |
| $50,000 to $99,999 | 5 (4.1%) | 6 (2.2%) |
| $100,000 to $299,999 | 66 (54.1%) | 249 (91.9%) |
| $300,000 to $499,999 | 23 (18.9%) | 5 (1.8%) |
| $500,000 to $749,999 | 0 (0.0%) | 0 (0.0%) |
| $750,000 to $999,999 | 0 (0.0%) | 0 (0.0%) |
| $1,000,000 or more | 0 (0.0%) | 4 (1.5%) |
| Total | 122 (100.0%) | 271 (100.0%) |
Household Income by Mortgage Status in Enosburg Falls
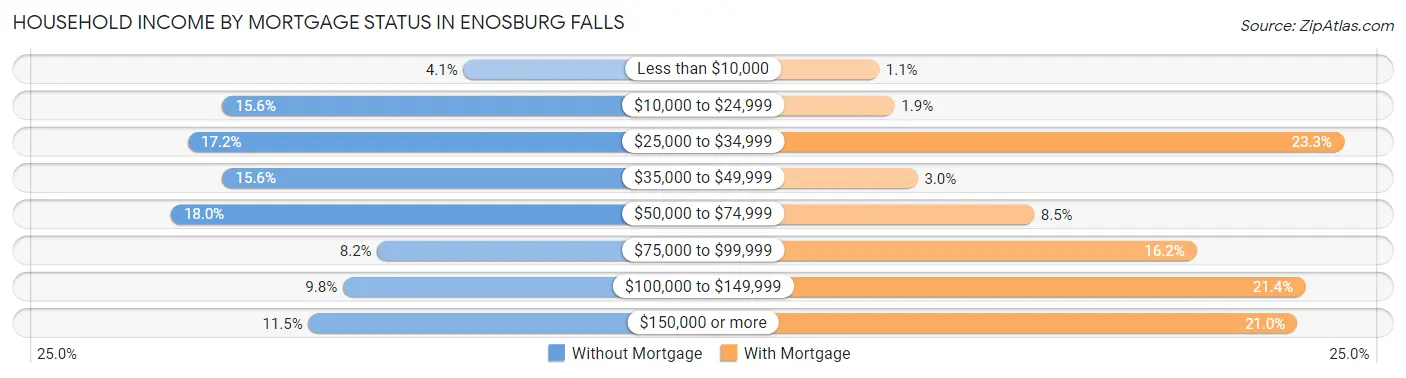
| Household Income | Without Mortgage | With Mortgage |
| Less than $10,000 | 5 (4.1%) | 3 (1.1%) |
| $10,000 to $24,999 | 19 (15.6%) | 5 (1.8%) |
| $25,000 to $34,999 | 21 (17.2%) | 63 (23.3%) |
| $35,000 to $49,999 | 19 (15.6%) | 8 (2.9%) |
| $50,000 to $74,999 | 22 (18.0%) | 23 (8.5%) |
| $75,000 to $99,999 | 10 (8.2%) | 44 (16.2%) |
| $100,000 to $149,999 | 12 (9.8%) | 58 (21.4%) |
| $150,000 or more | 14 (11.5%) | 57 (21.0%) |
| Total | 122 (100.0%) | 271 (100.0%) |
Property Value to Household Income Ratio in Enosburg Falls
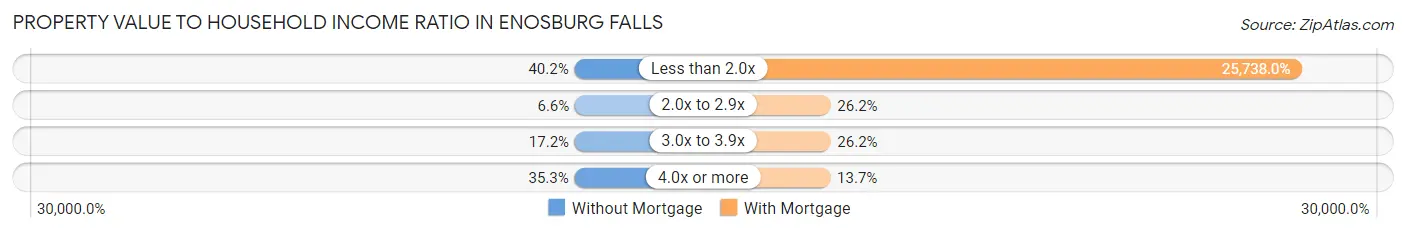
| Value-to-Income Ratio | Without Mortgage | With Mortgage |
| Less than 2.0x | 49 (40.2%) | 69,750 (25,738.0%) |
| 2.0x to 2.9x | 8 (6.6%) | 71 (26.2%) |
| 3.0x to 3.9x | 21 (17.2%) | 71 (26.2%) |
| 4.0x or more | 43 (35.2%) | 37 (13.7%) |
| Total | 122 (100.0%) | 271 (100.0%) |
Real Estate Taxes by Mortgage Status in Enosburg Falls
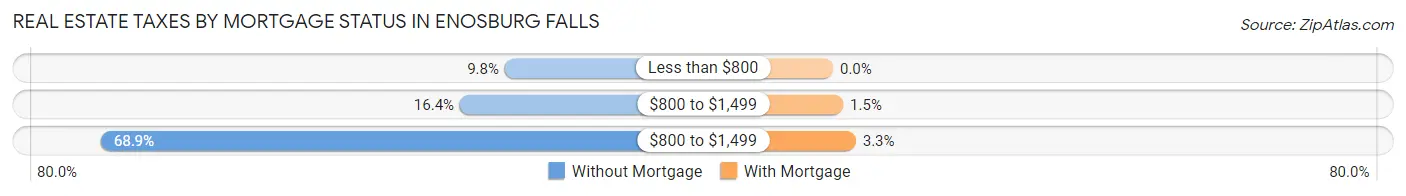
| Property Taxes | Without Mortgage | With Mortgage |
| Less than $800 | 12 (9.8%) | 0 (0.0%) |
| $800 to $1,499 | 20 (16.4%) | 4 (1.5%) |
| $800 to $1,499 | 84 (68.9%) | 9 (3.3%) |
| Total | 122 (100.0%) | 271 (100.0%) |
Health & Disability in Enosburg Falls
Health Insurance Coverage by Age in Enosburg Falls
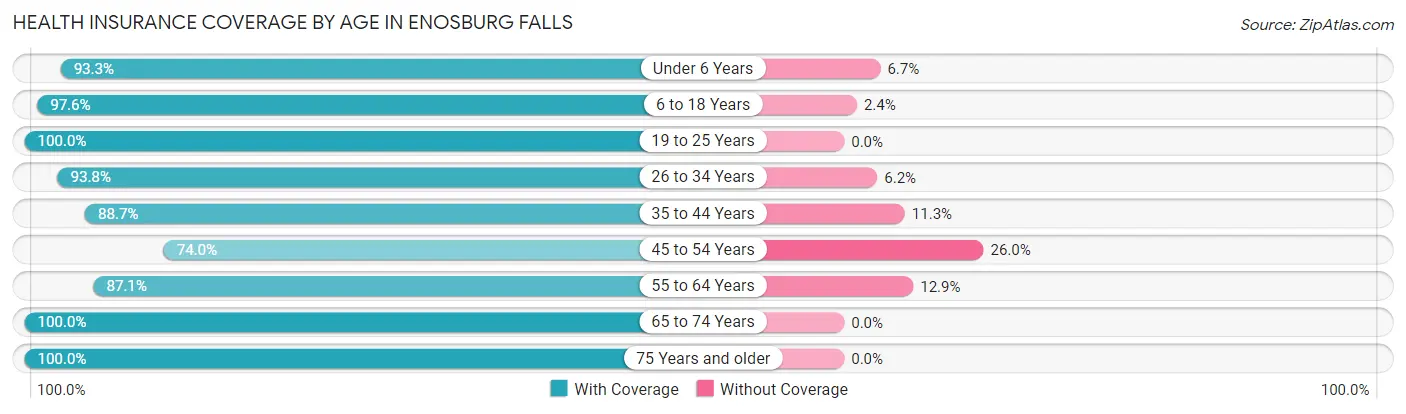
| Age Bracket | With Coverage | Without Coverage |
| Under 6 Years | 166 (93.3%) | 12 (6.7%) |
| 6 to 18 Years | 247 (97.6%) | 6 (2.4%) |
| 19 to 25 Years | 114 (100.0%) | 0 (0.0%) |
| 26 to 34 Years | 137 (93.8%) | 9 (6.2%) |
| 35 to 44 Years | 267 (88.7%) | 34 (11.3%) |
| 45 to 54 Years | 114 (74.0%) | 40 (26.0%) |
| 55 to 64 Years | 149 (87.1%) | 22 (12.9%) |
| 65 to 74 Years | 114 (100.0%) | 0 (0.0%) |
| 75 Years and older | 83 (100.0%) | 0 (0.0%) |
| Total | 1,391 (91.9%) | 123 (8.1%) |
Health Insurance Coverage by Citizenship Status in Enosburg Falls
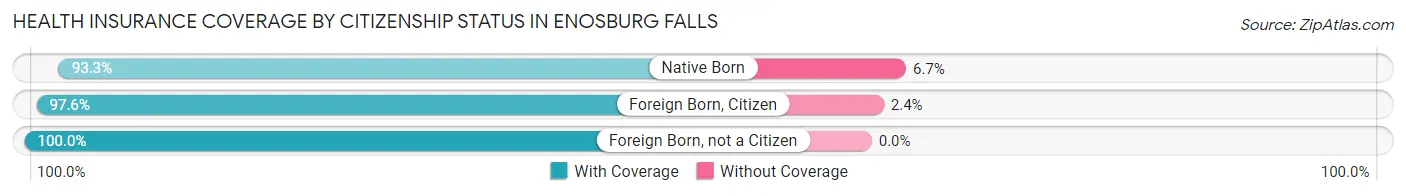
| Citizenship Status | With Coverage | Without Coverage |
| Native Born | 166 (93.3%) | 12 (6.7%) |
| Foreign Born, Citizen | 247 (97.6%) | 6 (2.4%) |
| Foreign Born, not a Citizen | 114 (100.0%) | 0 (0.0%) |
Health Insurance Coverage by Household Income in Enosburg Falls
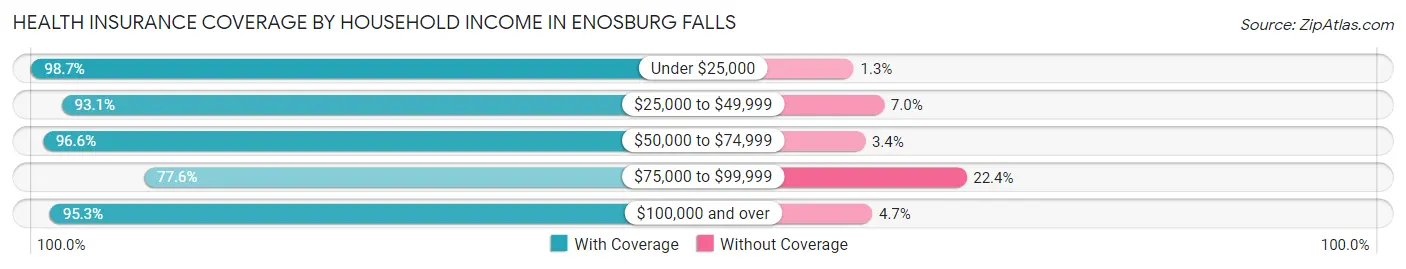
| Household Income | With Coverage | Without Coverage |
| Under $25,000 | 308 (98.7%) | 4 (1.3%) |
| $25,000 to $49,999 | 241 (93.0%) | 18 (7.0%) |
| $50,000 to $74,999 | 199 (96.6%) | 7 (3.4%) |
| $75,000 to $99,999 | 260 (77.6%) | 75 (22.4%) |
| $100,000 and over | 383 (95.3%) | 19 (4.7%) |
Public vs Private Health Insurance Coverage by Age in Enosburg Falls
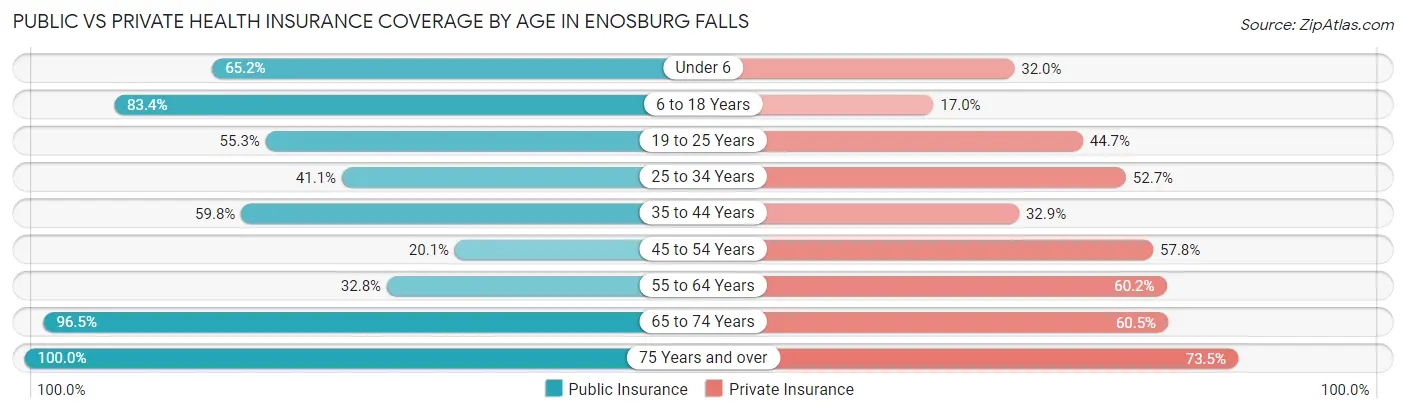
| Age Bracket | Public Insurance | Private Insurance |
| Under 6 | 116 (65.2%) | 57 (32.0%) |
| 6 to 18 Years | 211 (83.4%) | 43 (17.0%) |
| 19 to 25 Years | 63 (55.3%) | 51 (44.7%) |
| 25 to 34 Years | 60 (41.1%) | 77 (52.7%) |
| 35 to 44 Years | 180 (59.8%) | 99 (32.9%) |
| 45 to 54 Years | 31 (20.1%) | 89 (57.8%) |
| 55 to 64 Years | 56 (32.8%) | 103 (60.2%) |
| 65 to 74 Years | 110 (96.5%) | 69 (60.5%) |
| 75 Years and over | 83 (100.0%) | 61 (73.5%) |
| Total | 910 (60.1%) | 649 (42.9%) |
Disability Status by Sex by Age in Enosburg Falls
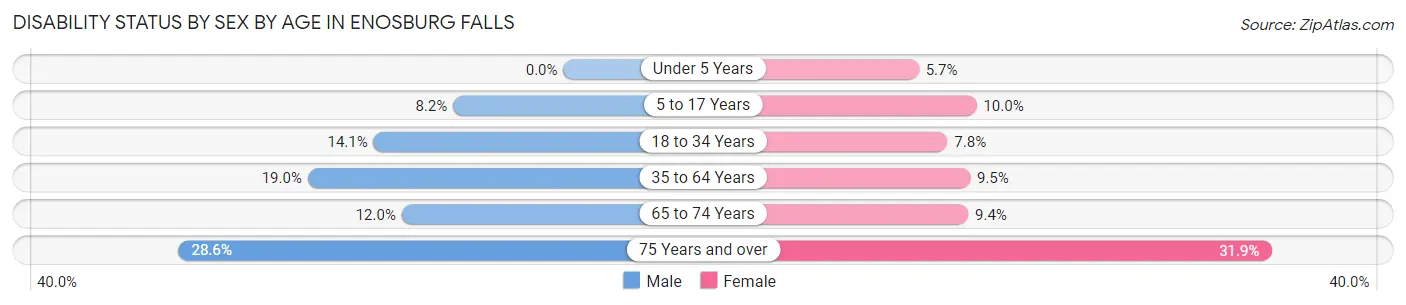
| Age Bracket | Male | Female |
| Under 5 Years | 0 (0.0%) | 4 (5.7%) |
| 5 to 17 Years | 14 (8.2%) | 8 (10.0%) |
| 18 to 34 Years | 21 (14.1%) | 12 (7.8%) |
| 35 to 64 Years | 63 (19.0%) | 28 (9.5%) |
| 65 to 74 Years | 6 (12.0%) | 6 (9.4%) |
| 75 Years and over | 4 (28.6%) | 22 (31.9%) |
Disability Class by Sex by Age in Enosburg Falls
Disability Class: Hearing Difficulty
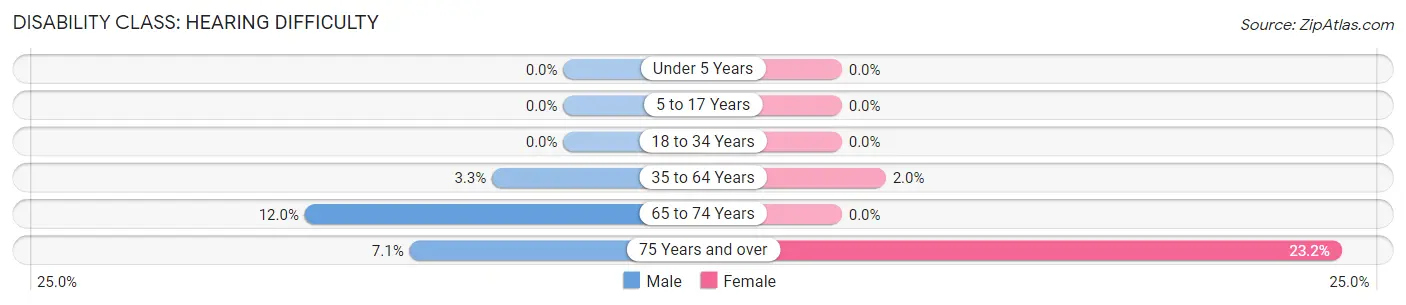
| Age Bracket | Male | Female |
| Under 5 Years | 0 (0.0%) | 0 (0.0%) |
| 5 to 17 Years | 0 (0.0%) | 0 (0.0%) |
| 18 to 34 Years | 0 (0.0%) | 0 (0.0%) |
| 35 to 64 Years | 11 (3.3%) | 6 (2.0%) |
| 65 to 74 Years | 6 (12.0%) | 0 (0.0%) |
| 75 Years and over | 1 (7.1%) | 16 (23.2%) |
Disability Class: Vision Difficulty
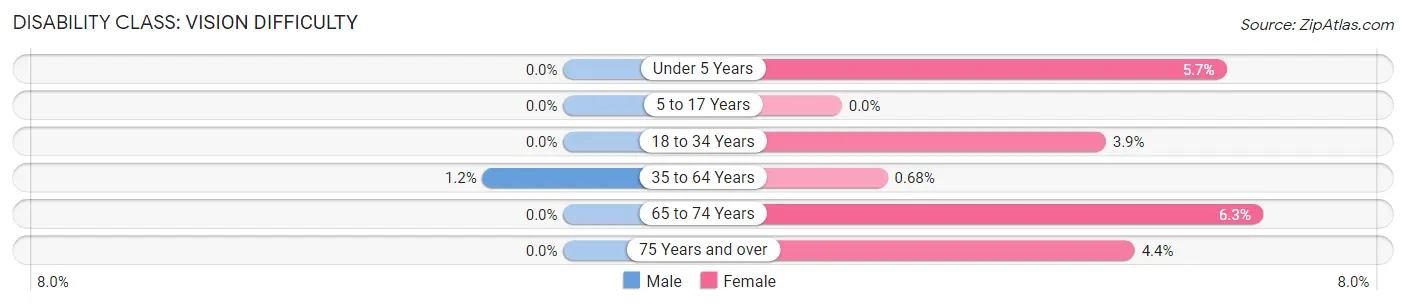
| Age Bracket | Male | Female |
| Under 5 Years | 0 (0.0%) | 4 (5.7%) |
| 5 to 17 Years | 0 (0.0%) | 0 (0.0%) |
| 18 to 34 Years | 0 (0.0%) | 6 (3.9%) |
| 35 to 64 Years | 4 (1.2%) | 2 (0.7%) |
| 65 to 74 Years | 0 (0.0%) | 4 (6.2%) |
| 75 Years and over | 0 (0.0%) | 3 (4.3%) |
Disability Class: Cognitive Difficulty
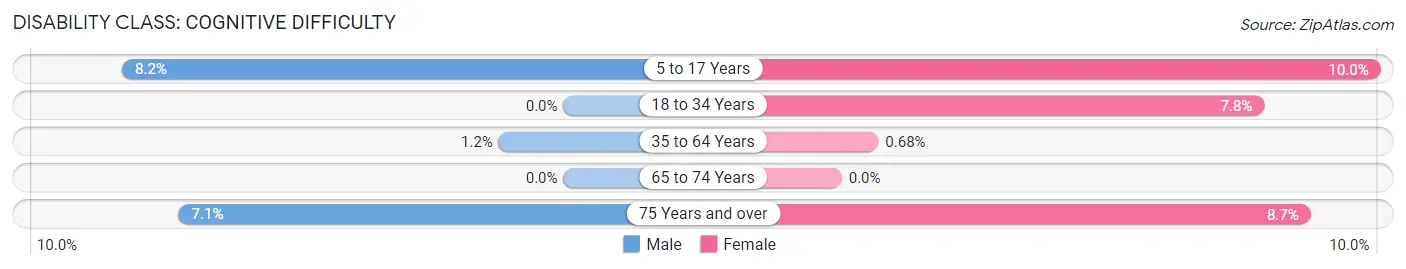
| Age Bracket | Male | Female |
| 5 to 17 Years | 14 (8.2%) | 8 (10.0%) |
| 18 to 34 Years | 0 (0.0%) | 12 (7.8%) |
| 35 to 64 Years | 4 (1.2%) | 2 (0.7%) |
| 65 to 74 Years | 0 (0.0%) | 0 (0.0%) |
| 75 Years and over | 1 (7.1%) | 6 (8.7%) |
Disability Class: Ambulatory Difficulty
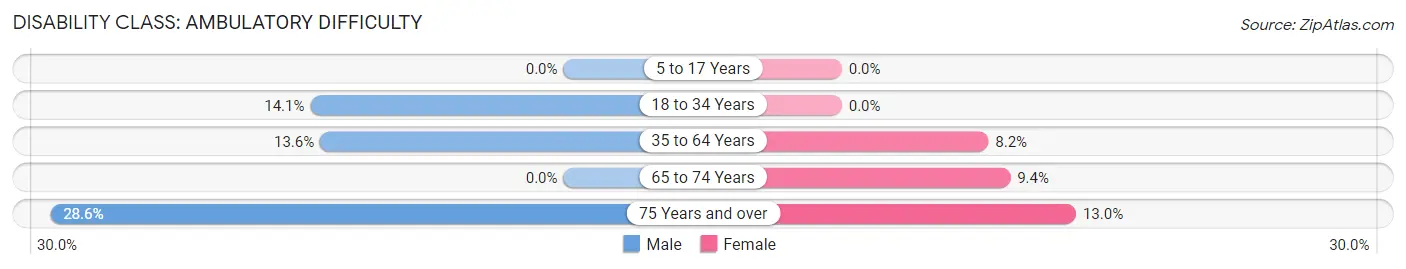
| Age Bracket | Male | Female |
| 5 to 17 Years | 0 (0.0%) | 0 (0.0%) |
| 18 to 34 Years | 21 (14.1%) | 0 (0.0%) |
| 35 to 64 Years | 45 (13.6%) | 24 (8.2%) |
| 65 to 74 Years | 0 (0.0%) | 6 (9.4%) |
| 75 Years and over | 4 (28.6%) | 9 (13.0%) |
Disability Class: Self-Care Difficulty
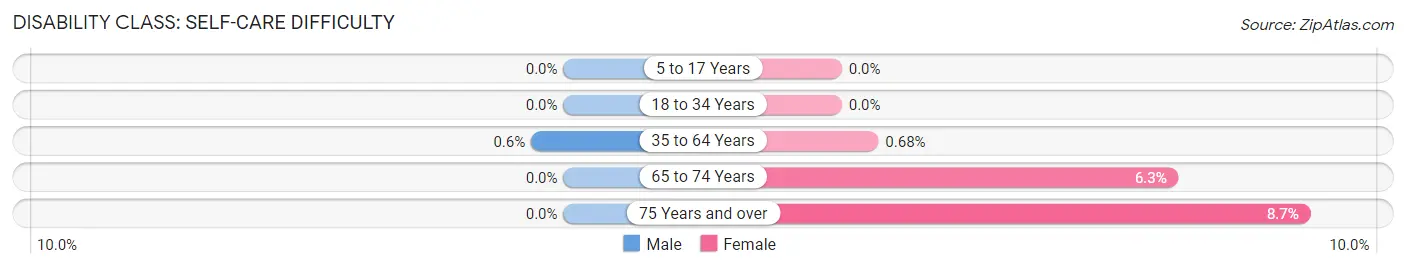
| Age Bracket | Male | Female |
| 5 to 17 Years | 0 (0.0%) | 0 (0.0%) |
| 18 to 34 Years | 0 (0.0%) | 0 (0.0%) |
| 35 to 64 Years | 2 (0.6%) | 2 (0.7%) |
| 65 to 74 Years | 0 (0.0%) | 4 (6.2%) |
| 75 Years and over | 0 (0.0%) | 6 (8.7%) |
Technology Access in Enosburg Falls
Computing Device Access in Enosburg Falls
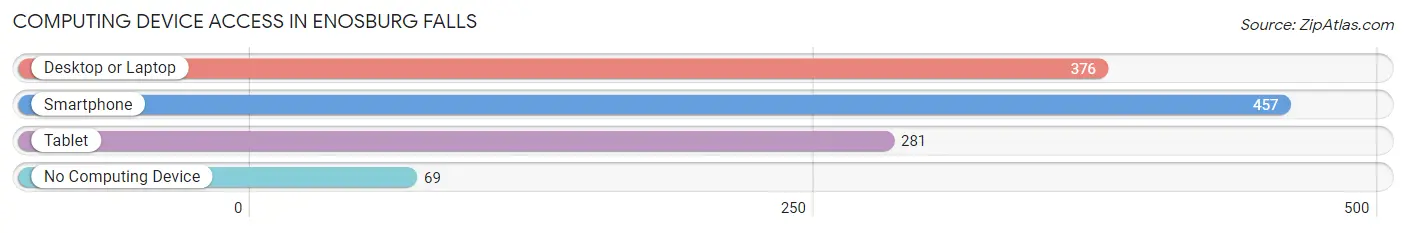
| Device Type | # Households | % Households |
| Desktop or Laptop | 376 | 66.5% |
| Smartphone | 457 | 80.9% |
| Tablet | 281 | 49.7% |
| No Computing Device | 69 | 12.2% |
| Total | 565 | 100.0% |
Internet Access in Enosburg Falls
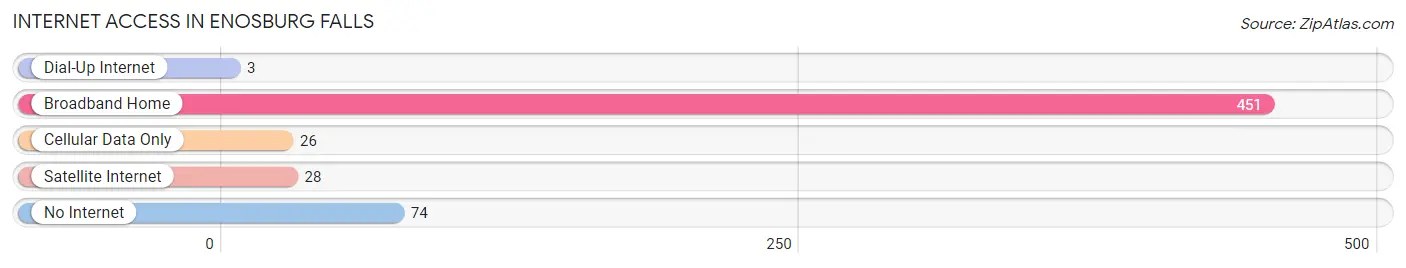
| Internet Type | # Households | % Households |
| Dial-Up Internet | 3 | 0.5% |
| Broadband Home | 451 | 79.8% |
| Cellular Data Only | 26 | 4.6% |
| Satellite Internet | 28 | 5.0% |
| No Internet | 74 | 13.1% |
| Total | 565 | 100.0% |
Enosburg Falls Summary
Enosburg Falls is a small town located in Franklin County, Vermont, United States. It is situated in the northern part of the state, near the Canadian border. The town was named after Enosburgh, the original name of the town, which was named after Enos Hitchcock, an early settler. As of the 2010 census, the town had a population of 2,085.
History
Enosburg Falls was first settled in 1790 by Enos Hitchcock, who was a Revolutionary War veteran. He was granted a land grant of 500 acres in the area. The town was originally known as Enosburgh, but the name was changed to Enosburg Falls in 1820.
The town was an important stop on the stagecoach route between Montreal and Burlington. It was also a major stop on the Central Vermont Railway, which ran through the town from 1849 to 1964.
The town was home to several mills, including a sawmill, gristmill, and a woolen mill. The woolen mill was the largest employer in the town for many years.
Geography
Enosburg Falls is located in northern Vermont, near the Canadian border. It is situated in the Missisquoi Valley, which is part of the Green Mountains. The town is bordered by the towns of Richford to the north, Berkshire to the east, Fairfax to the south, and Sheldon to the west.
The town is located at an elevation of 890 feet (271 m). The Missisquoi River runs through the town, and there are several small lakes and ponds in the area.
Economy
The economy of Enosburg Falls is largely based on agriculture and tourism. The town is home to several dairy farms, as well as a number of apple orchards. The town is also home to several small businesses, including a few restaurants, a grocery store, and a hardware store.
The town is also home to several tourist attractions, including the Enosburg Falls Historical Society Museum, the Enosburg Falls Opera House, and the Enosburg Falls Country Club.
Demographics
As of the 2010 census, the town had a population of 2,085. The racial makeup of the town was 97.3% White, 0.4% African American, 0.3% Native American, 0.3% Asian, 0.2% from other races, and 1.5% from two or more races. Hispanic or Latino of any race were 0.9% of the population.
The median income for a household in the town was $41,944, and the median income for a family was $50,000. The per capita income for the town was $20,945. About 8.3% of families and 10.2% of the population were below the poverty line, including 14.2% of those under age 18 and 8.2% of those age 65 or over.
Common Questions
What is the Total Population of Enosburg Falls?
Total Population of Enosburg Falls is 1,554.
What is the Total Male Population of Enosburg Falls?
Total Male Population of Enosburg Falls is 796.
What is the Total Female Population of Enosburg Falls?
Total Female Population of Enosburg Falls is 758.
What is the Ratio of Males per 100 Females in Enosburg Falls?
There are 105.01 Males per 100 Females in Enosburg Falls.
What is the Ratio of Females per 100 Males in Enosburg Falls?
There are 95.23 Females per 100 Males in Enosburg Falls.
What is the Median Population Age in Enosburg Falls?
Median Population Age in Enosburg Falls is 37.1 Years.
What is the Average Family Size in Enosburg Falls
Average Family Size in Enosburg Falls is 3.5 People.
What is the Average Household Size in Enosburg Falls
Average Household Size in Enosburg Falls is 2.7 People.
What is Per Capita Income in Enosburg Falls?
Per Capita income in Enosburg Falls is $22,928.
What is the Median Family Income in Enosburg Falls?
Median Family Income in Enosburg Falls is $58,000.
What is the Median Household income in Enosburg Falls?
Median Household Income in Enosburg Falls is $46,250.
What is Income or Wage Gap in Enosburg Falls?
Income or Wage Gap in Enosburg Falls is 34.7%.
Women in Enosburg Falls earn 65.3 cents for every dollar earned by a man.
What is Inequality or Gini Index in Enosburg Falls?
Inequality or Gini Index in Enosburg Falls is 0.43.
How Large is the Labor Force in Enosburg Falls?
There are 719 People in the Labor Forcein in Enosburg Falls.
What is the Percentage of People in the Labor Force in Enosburg Falls?
59.9% of People are in the Labor Force in Enosburg Falls.
What is the Unemployment Rate in Enosburg Falls?
Unemployment Rate in Enosburg Falls is 7.1%.