Swanton, VT
Swanton Map
Swanton Overview
2,428
TOTAL POPULATION
1,295
MALE POPULATION
1,133
FEMALE POPULATION
114.30
MALES / 100 FEMALES
87.49
FEMALES / 100 MALES
41.0
MEDIAN AGE
3.5
AVG FAMILY SIZE
2.9
AVG HOUSEHOLD SIZE
$28,560
PER CAPITA INCOME
$80,286
AVG FAMILY INCOME
$73,365
AVG HOUSEHOLD INCOME
37.7%
WAGE / INCOME GAP [ % ]
62.3¢/ $1
WAGE / INCOME GAP [ $ ]
0.33
INEQUALITY / GINI INDEX
1,159
LABOR FORCE [ PEOPLE ]
58.5%
PERCENT IN LABOR FORCE
8.2%
UNEMPLOYMENT RATE
Swanton Zip Codes
Swanton Area Codes
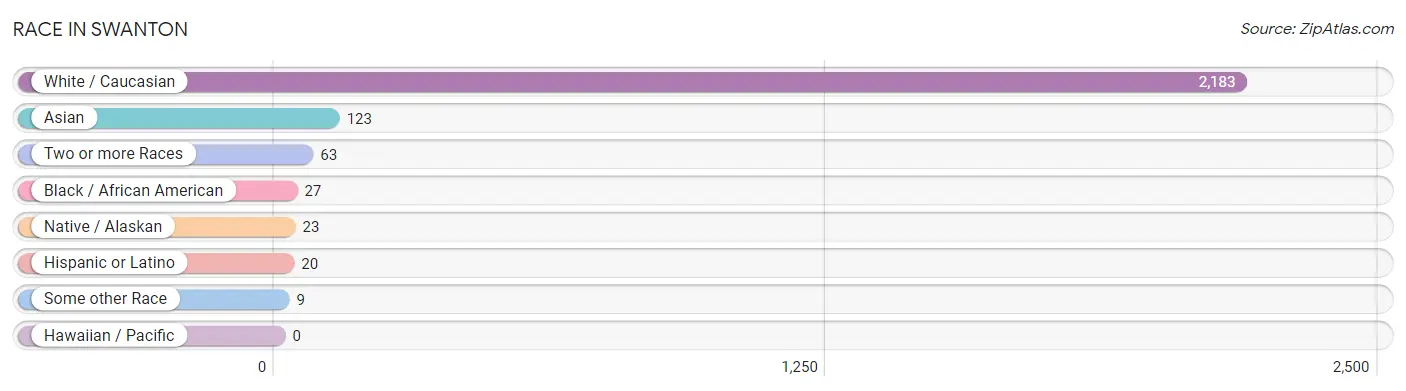
Race in Swanton
The most populous races in Swanton are White / Caucasian (2,183 | 89.9%), Asian (123 | 5.1%), and Two or more Races (63 | 2.6%).
| Race | # Population | % Population |
| Asian | 123 | 5.1% |
| Black / African American | 27 | 1.1% |
| Hawaiian / Pacific | 0 | 0.0% |
| Hispanic or Latino | 20 | 0.8% |
| Native / Alaskan | 23 | 0.9% |
| White / Caucasian | 2,183 | 89.9% |
| Two or more Races | 63 | 2.6% |
| Some other Race | 9 | 0.4% |
| Total | 2,428 | 100.0% |
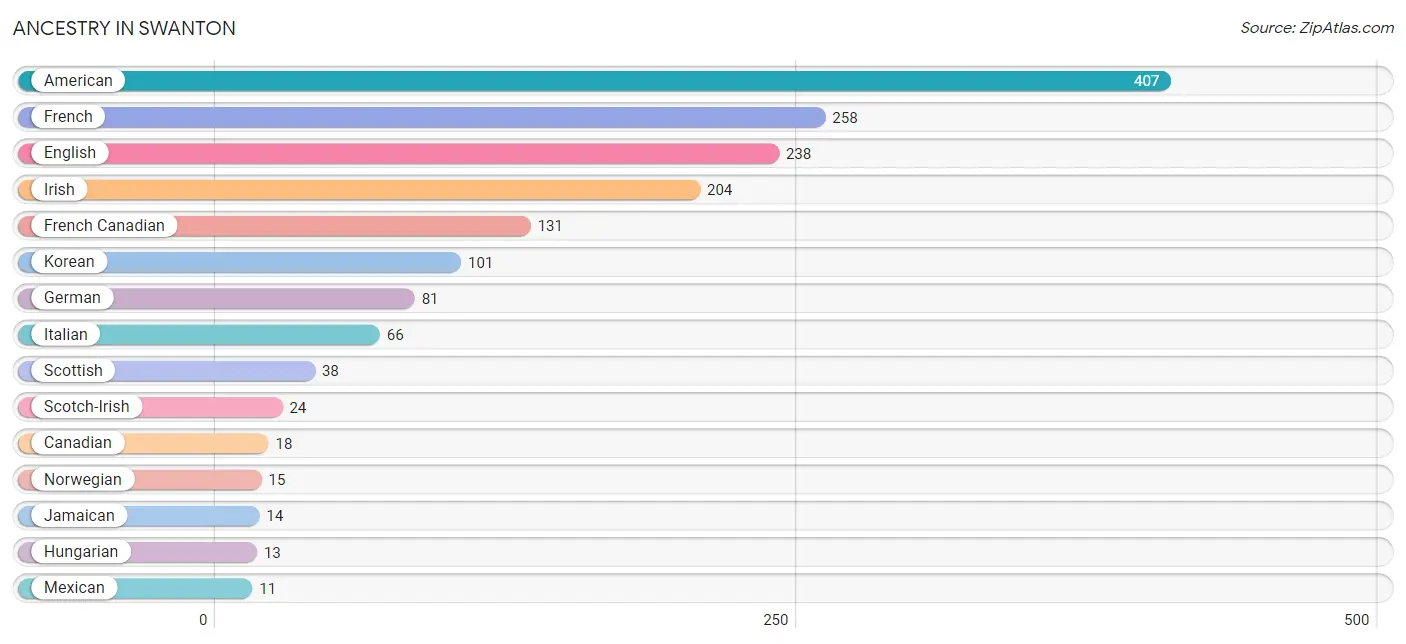
Ancestry in Swanton
The most populous ancestries reported in Swanton are American (407 | 16.8%), French (258 | 10.6%), English (238 | 9.8%), Irish (204 | 8.4%), and French Canadian (131 | 5.4%), together accounting for 51.0% of all Swanton residents.
| Ancestry | # Population | % Population |
| American | 407 | 16.8% |
| Austrian | 8 | 0.3% |
| British | 4 | 0.2% |
| Canadian | 18 | 0.7% |
| Cherokee | 3 | 0.1% |
| Danish | 6 | 0.3% |
| Dutch | 5 | 0.2% |
| English | 238 | 9.8% |
| French | 258 | 10.6% |
| French Canadian | 131 | 5.4% |
| German | 81 | 3.3% |
| Hungarian | 13 | 0.5% |
| Irish | 204 | 8.4% |
| Italian | 66 | 2.7% |
| Jamaican | 14 | 0.6% |
| Korean | 101 | 4.2% |
| Mexican | 11 | 0.4% |
| Norwegian | 15 | 0.6% |
| Polish | 4 | 0.2% |
| Portuguese | 6 | 0.3% |
| Scotch-Irish | 24 | 1.0% |
| Scottish | 38 | 1.6% |
| South American | 9 | 0.4% |
| Swedish | 10 | 0.4% |
| Thai | 8 | 0.3% |
| Venezuelan | 9 | 0.4% |
| Welsh | 8 | 0.3% | View All 27 Rows |
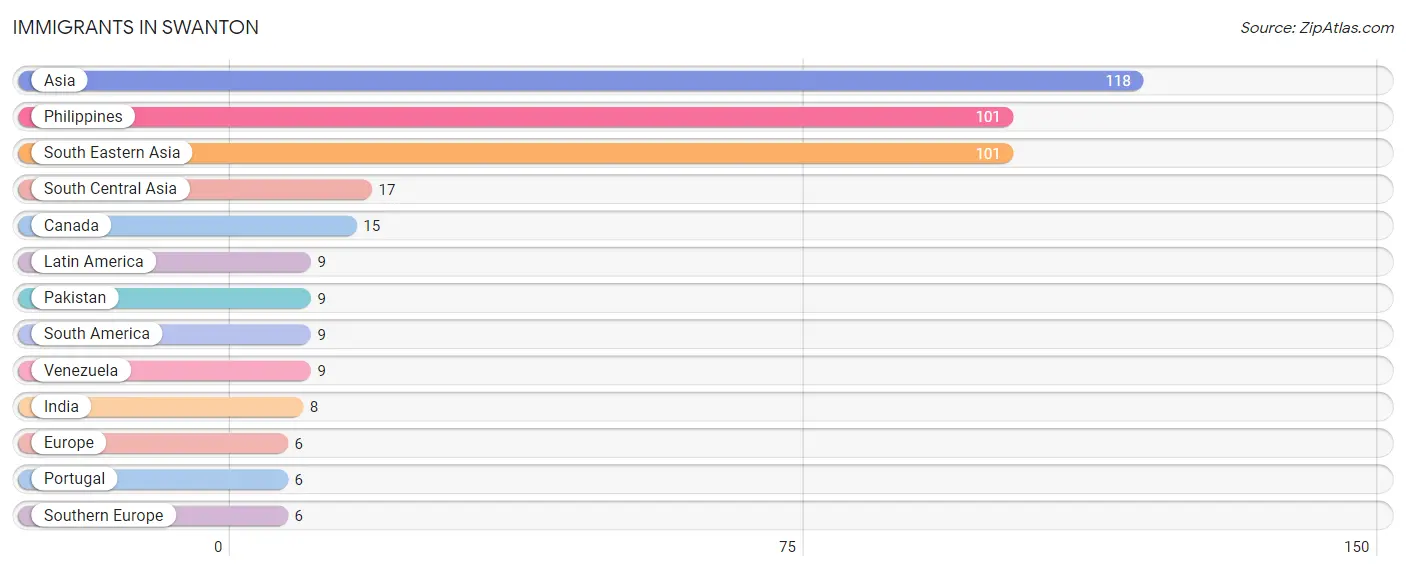
Immigrants in Swanton
The most numerous immigrant groups reported in Swanton came from Asia (118 | 4.9%), Philippines (101 | 4.2%), South Eastern Asia (101 | 4.2%), South Central Asia (17 | 0.7%), and Canada (15 | 0.6%), together accounting for 14.5% of all Swanton residents.
| Immigration Origin | # Population | % Population |
| Asia | 118 | 4.9% |
| Canada | 15 | 0.6% |
| Europe | 6 | 0.3% |
| India | 8 | 0.3% |
| Latin America | 9 | 0.4% |
| Pakistan | 9 | 0.4% |
| Philippines | 101 | 4.2% |
| Portugal | 6 | 0.3% |
| South America | 9 | 0.4% |
| South Central Asia | 17 | 0.7% |
| South Eastern Asia | 101 | 4.2% |
| Southern Europe | 6 | 0.3% |
| Venezuela | 9 | 0.4% | View All 13 Rows |
Sex and Age in Swanton
Sex and Age in Swanton
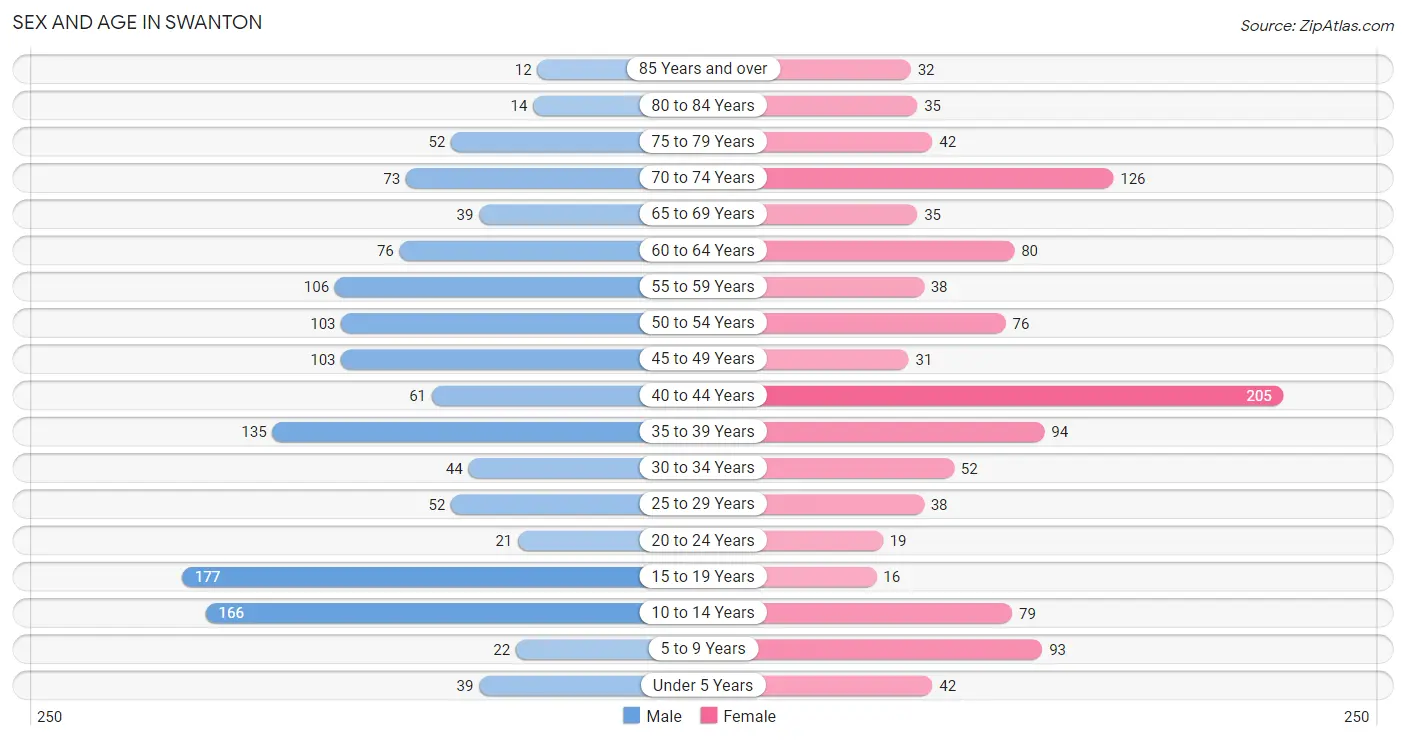
The most populous age groups in Swanton are 15 to 19 Years (177 | 13.7%) for men and 40 to 44 Years (205 | 18.1%) for women.
| Age Bracket | Male | Female |
| Under 5 Years | 39 (3.0%) | 42 (3.7%) |
| 5 to 9 Years | 22 (1.7%) | 93 (8.2%) |
| 10 to 14 Years | 166 (12.8%) | 79 (7.0%) |
| 15 to 19 Years | 177 (13.7%) | 16 (1.4%) |
| 20 to 24 Years | 21 (1.6%) | 19 (1.7%) |
| 25 to 29 Years | 52 (4.0%) | 38 (3.4%) |
| 30 to 34 Years | 44 (3.4%) | 52 (4.6%) |
| 35 to 39 Years | 135 (10.4%) | 94 (8.3%) |
| 40 to 44 Years | 61 (4.7%) | 205 (18.1%) |
| 45 to 49 Years | 103 (8.0%) | 31 (2.7%) |
| 50 to 54 Years | 103 (8.0%) | 76 (6.7%) |
| 55 to 59 Years | 106 (8.2%) | 38 (3.4%) |
| 60 to 64 Years | 76 (5.9%) | 80 (7.1%) |
| 65 to 69 Years | 39 (3.0%) | 35 (3.1%) |
| 70 to 74 Years | 73 (5.6%) | 126 (11.1%) |
| 75 to 79 Years | 52 (4.0%) | 42 (3.7%) |
| 80 to 84 Years | 14 (1.1%) | 35 (3.1%) |
| 85 Years and over | 12 (0.9%) | 32 (2.8%) |
| Total | 1,295 (100.0%) | 1,133 (100.0%) |
Families and Households in Swanton
Median Family Size in Swanton
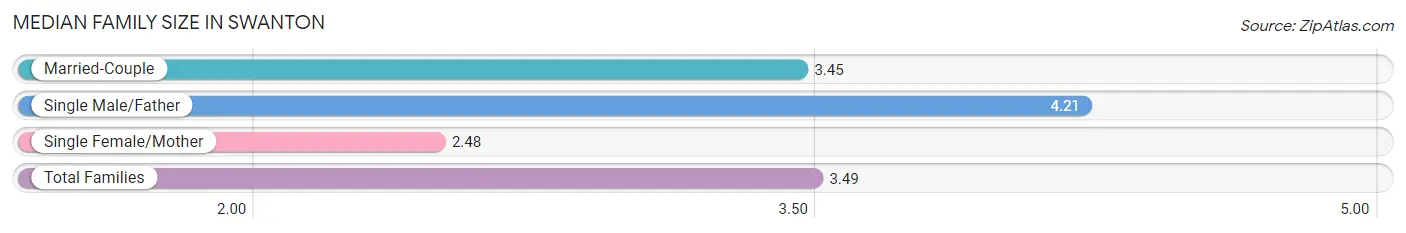
The median family size in Swanton is 3.49 persons per family, with single male/father families (84 | 14.7%) accounting for the largest median family size of 4.21 persons per family. On the other hand, single female/mother families (44 | 7.7%) represent the smallest median family size with 2.48 persons per family.
| Family Type | # Families | Family Size |
| Married-Couple | 443 (77.6%) | 3.45 |
| Single Male/Father | 84 (14.7%) | 4.21 |
| Single Female/Mother | 44 (7.7%) | 2.48 |
| Total Families | 571 (100.0%) | 3.49 |
Median Household Size in Swanton
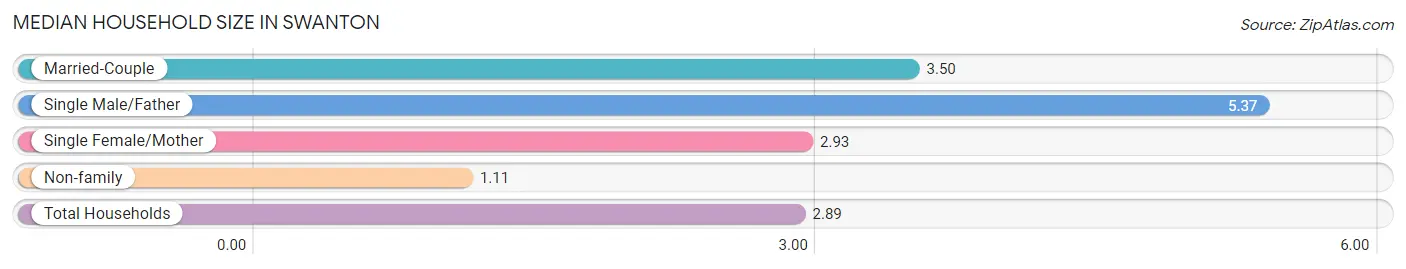
The median household size in Swanton is 2.89 persons per household, with single male/father households (84 | 10.0%) accounting for the largest median household size of 5.37 persons per household. non-family households (268 | 31.9%) represent the smallest median household size with 1.11 persons per household.
| Household Type | # Households | Household Size |
| Married-Couple | 443 (52.8%) | 3.50 |
| Single Male/Father | 84 (10.0%) | 5.37 |
| Single Female/Mother | 44 (5.2%) | 2.93 |
| Non-family | 268 (31.9%) | 1.11 |
| Total Households | 839 (100.0%) | 2.89 |
Household Size by Marriage Status in Swanton
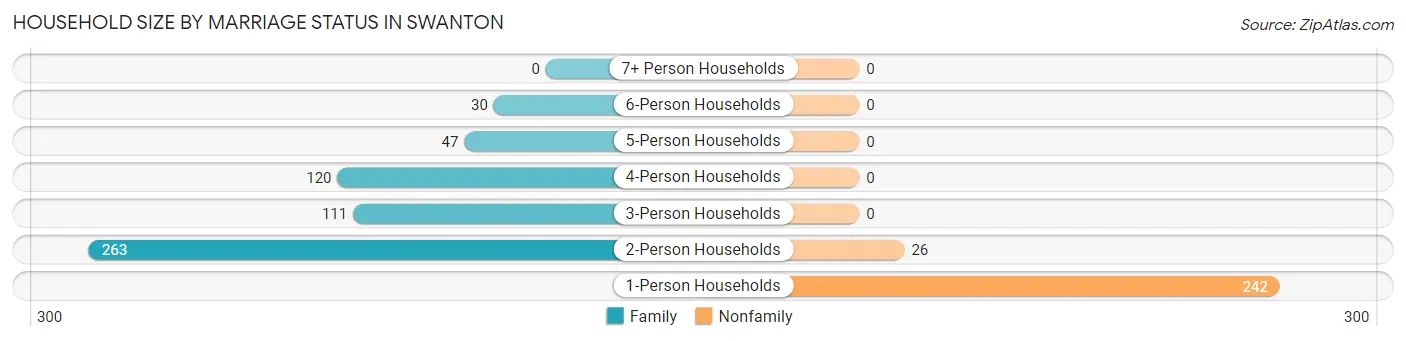
Out of a total of 839 households in Swanton, 571 (68.1%) are family households, while 268 (31.9%) are nonfamily households. The most numerous type of family households are 2-person households, comprising 263, and the most common type of nonfamily households are 1-person households, comprising 242.
| Household Size | Family Households | Nonfamily Households |
| 1-Person Households | - | 242 (28.8%) |
| 2-Person Households | 263 (31.4%) | 26 (3.1%) |
| 3-Person Households | 111 (13.2%) | 0 (0.0%) |
| 4-Person Households | 120 (14.3%) | 0 (0.0%) |
| 5-Person Households | 47 (5.6%) | 0 (0.0%) |
| 6-Person Households | 30 (3.6%) | 0 (0.0%) |
| 7+ Person Households | 0 (0.0%) | 0 (0.0%) |
| Total | 571 (68.1%) | 268 (31.9%) |
Female Fertility in Swanton
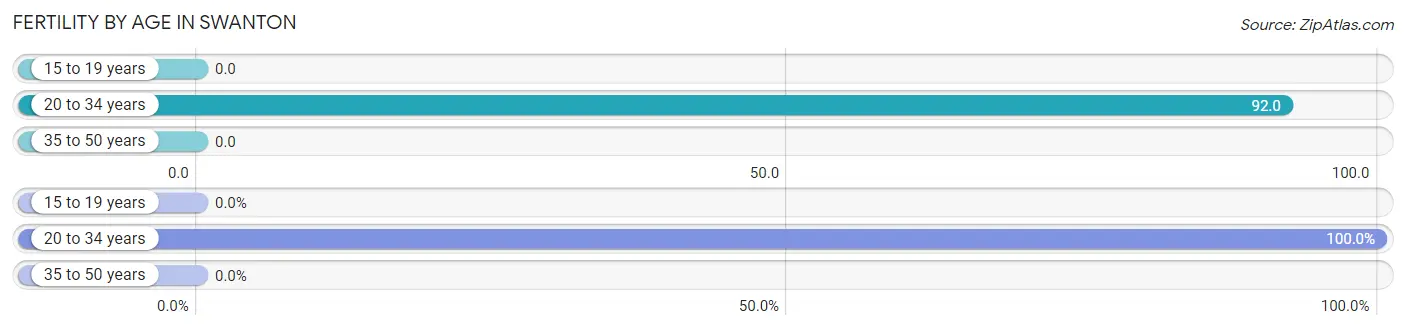
Fertility by Age in Swanton
Average fertility rate in Swanton is 20.0 births per 1,000 women. Women in the age bracket of 20 to 34 years have the highest fertility rate with 92.0 births per 1,000 women. Women in the age bracket of 20 to 34 years acount for 100.0% of all women with births.
| Age Bracket | Women with Births | Births / 1,000 Women |
| 15 to 19 years | 0 (0.0%) | 0.0 |
| 20 to 34 years | 10 (100.0%) | 92.0 |
| 35 to 50 years | 0 (0.0%) | 0.0 |
| Total | 10 (100.0%) | 20.0 |
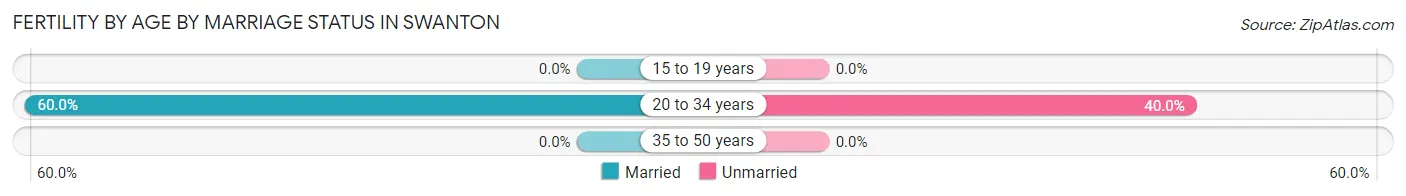
Fertility by Age by Marriage Status in Swanton
60.0% of women with births (10) in Swanton are married. The highest percentage of unmarried women with births falls into 20 to 34 years age bracket with 40.0% of them unmarried at the time of birth, while the lowest percentage of unmarried women with births belong to 20 to 34 years age bracket with 40.0% of them unmarried.
| Age Bracket | Married | Unmarried |
| 15 to 19 years | 0 (0.0%) | 0 (0.0%) |
| 20 to 34 years | 6 (60.0%) | 4 (40.0%) |
| 35 to 50 years | 0 (0.0%) | 0 (0.0%) |
| Total | 6 (60.0%) | 4 (40.0%) |
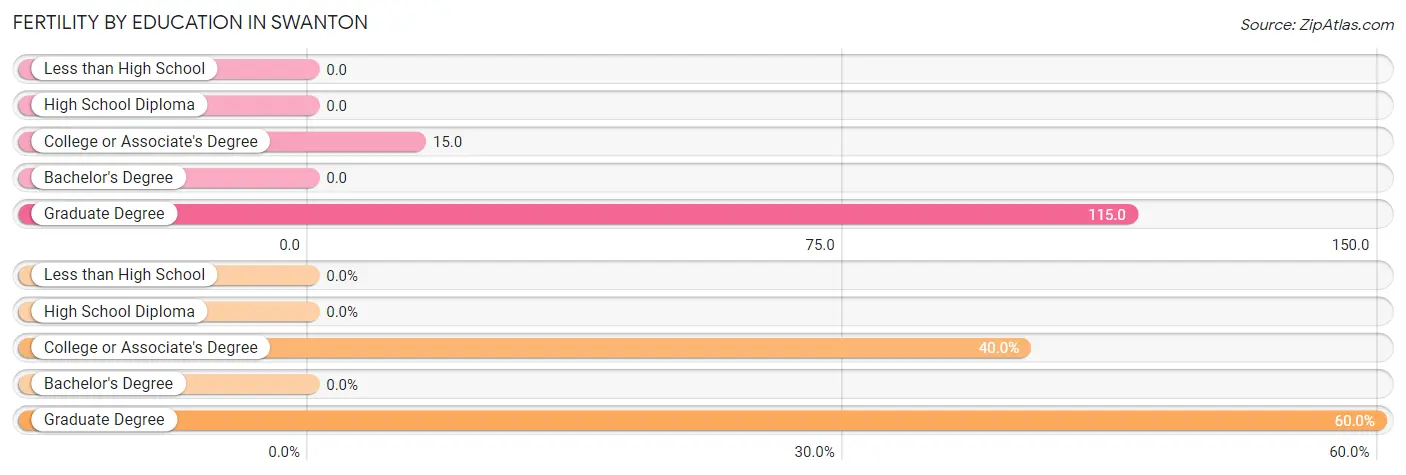
Fertility by Education in Swanton
| Educational Attainment | Women with Births | Births / 1,000 Women |
| Less than High School | 0 (0.0%) | 0.0 |
| High School Diploma | 0 (0.0%) | 0.0 |
| College or Associate's Degree | 4 (40.0%) | 15.0 |
| Bachelor's Degree | 0 (0.0%) | 0.0 |
| Graduate Degree | 6 (60.0%) | 115.0 |
| Total | 10 (100.0%) | 20.0 |
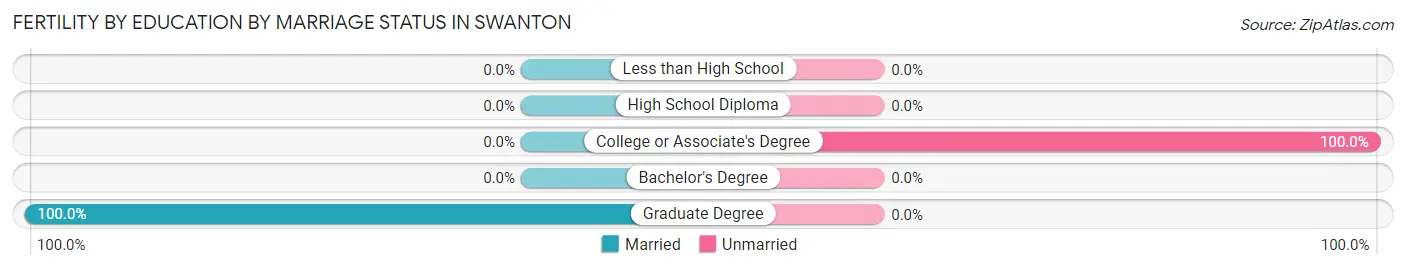
Fertility by Education by Marriage Status in Swanton
40.0% of women with births in Swanton are unmarried. Women with the educational attainment of graduate degree are most likely to be married with 100.0% of them married at childbirth, while women with the educational attainment of college or associate's degree are least likely to be married with 100.0% of them unmarried at childbirth.
| Educational Attainment | Married | Unmarried |
| Less than High School | 0 (0.0%) | 0 (0.0%) |
| High School Diploma | 0 (0.0%) | 0 (0.0%) |
| College or Associate's Degree | 0 (0.0%) | 4 (100.0%) |
| Bachelor's Degree | 0 (0.0%) | 0 (0.0%) |
| Graduate Degree | 6 (100.0%) | 0 (0.0%) |
| Total | 6 (60.0%) | 4 (40.0%) |
Income in Swanton
Income Overview in Swanton
Per Capita Income in Swanton is $28,560, while median incomes of families and households are $80,286 and $73,365 respectively.
| Characteristic | Number | Measure |
| Per Capita Income | 2,428 | $28,560 |
| Median Family Income | 571 | $80,286 |
| Mean Family Income | 571 | $81,594 |
| Median Household Income | 839 | $73,365 |
| Mean Household Income | 839 | $76,216 |
| Income Deficit | 571 | $0 |
| Wage / Income Gap (%) | 2,428 | 37.68% |
| Wage / Income Gap ($) | 2,428 | 62.32¢ per $1 |
| Gini / Inequality Index | 2,428 | 0.33 |
Earnings by Sex in Swanton
Average Earnings in Swanton are $38,574, $44,464 for men and $27,708 for women, a difference of 37.7%.
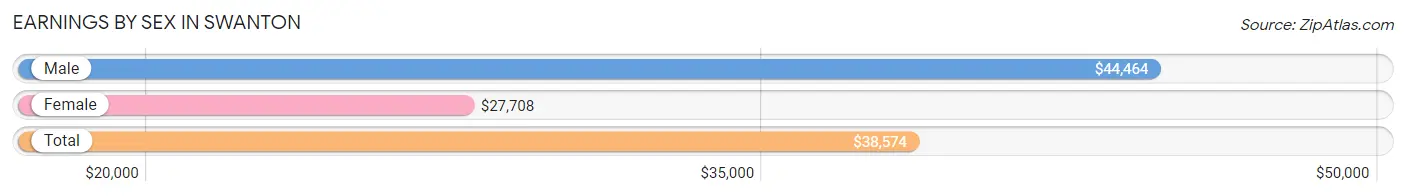
| Sex | Number | Average Earnings |
| Male | 679 (55.4%) | $44,464 |
| Female | 546 (44.6%) | $27,708 |
| Total | 1,225 (100.0%) | $38,574 |
Earnings by Sex by Income Bracket in Swanton
The most common earnings brackets in Swanton are $75,000 to $99,999 for men (112 | 16.5%) and $22,500 to $24,999 for women (105 | 19.2%).
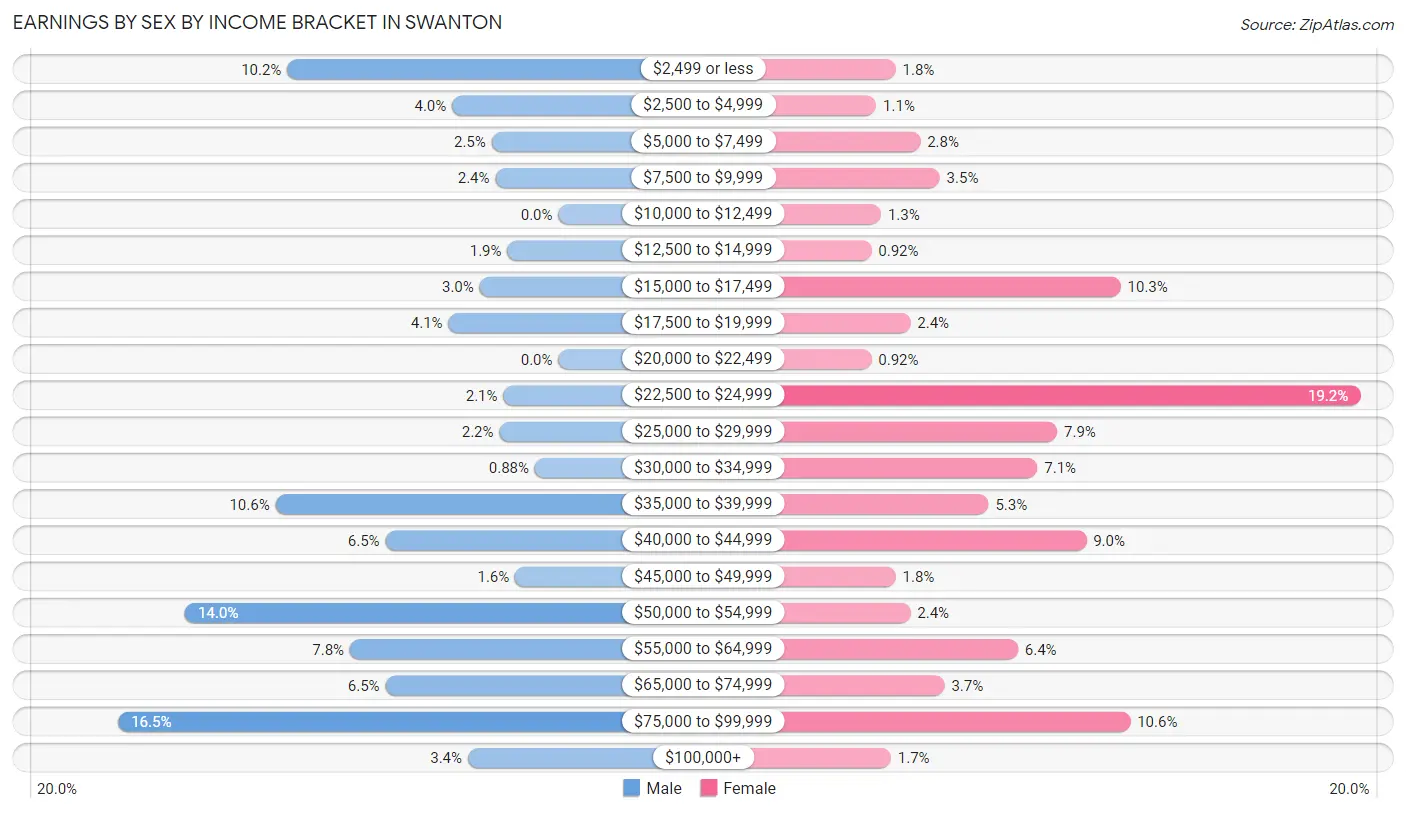
| Income | Male | Female |
| $2,499 or less | 69 (10.2%) | 10 (1.8%) |
| $2,500 to $4,999 | 27 (4.0%) | 6 (1.1%) |
| $5,000 to $7,499 | 17 (2.5%) | 15 (2.8%) |
| $7,500 to $9,999 | 16 (2.4%) | 19 (3.5%) |
| $10,000 to $12,499 | 0 (0.0%) | 7 (1.3%) |
| $12,500 to $14,999 | 13 (1.9%) | 5 (0.9%) |
| $15,000 to $17,499 | 20 (2.9%) | 56 (10.3%) |
| $17,500 to $19,999 | 28 (4.1%) | 13 (2.4%) |
| $20,000 to $22,499 | 0 (0.0%) | 5 (0.9%) |
| $22,500 to $24,999 | 14 (2.1%) | 105 (19.2%) |
| $25,000 to $29,999 | 15 (2.2%) | 43 (7.9%) |
| $30,000 to $34,999 | 6 (0.9%) | 39 (7.1%) |
| $35,000 to $39,999 | 72 (10.6%) | 29 (5.3%) |
| $40,000 to $44,999 | 44 (6.5%) | 49 (9.0%) |
| $45,000 to $49,999 | 11 (1.6%) | 10 (1.8%) |
| $50,000 to $54,999 | 95 (14.0%) | 13 (2.4%) |
| $55,000 to $64,999 | 53 (7.8%) | 35 (6.4%) |
| $65,000 to $74,999 | 44 (6.5%) | 20 (3.7%) |
| $75,000 to $99,999 | 112 (16.5%) | 58 (10.6%) |
| $100,000+ | 23 (3.4%) | 9 (1.7%) |
| Total | 679 (100.0%) | 546 (100.0%) |
Earnings by Sex by Educational Attainment in Swanton
Average earnings in Swanton are $52,742 for men and $27,446 for women, a difference of 48.0%. Men with an educational attainment of bachelor's degree enjoy the highest average annual earnings of $85,481, while those with less than high school education earn the least with $36,538. Women with an educational attainment of graduate degree earn the most with the average annual earnings of $78,343, while those with college or associate's degree education have the smallest earnings of $23,690.
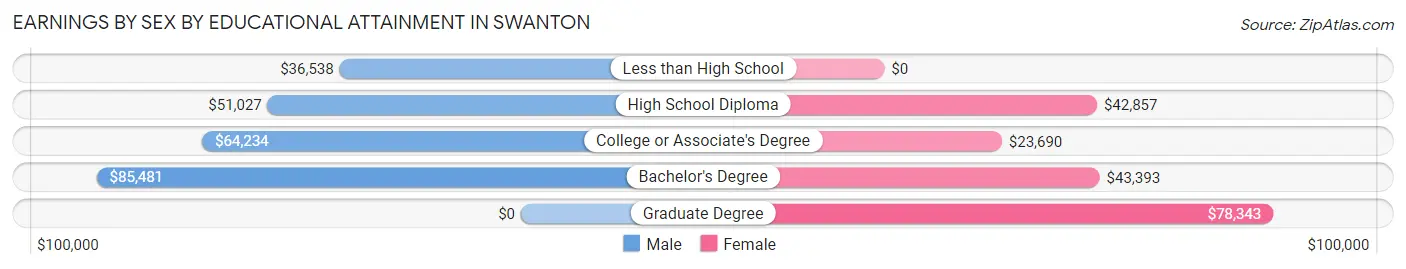
| Educational Attainment | Male Income | Female Income |
| Less than High School | $36,538 | $0 |
| High School Diploma | $51,027 | $42,857 |
| College or Associate's Degree | $64,234 | $23,690 |
| Bachelor's Degree | $85,481 | $43,393 |
| Graduate Degree | - | - |
| Total | $52,742 | $27,446 |
Family Income in Swanton
Family Income Brackets in Swanton
According to the Swanton family income data, there are 168 families falling into the $100,000 to $149,999 income range, which is the most common income bracket and makes up 29.4% of all families.
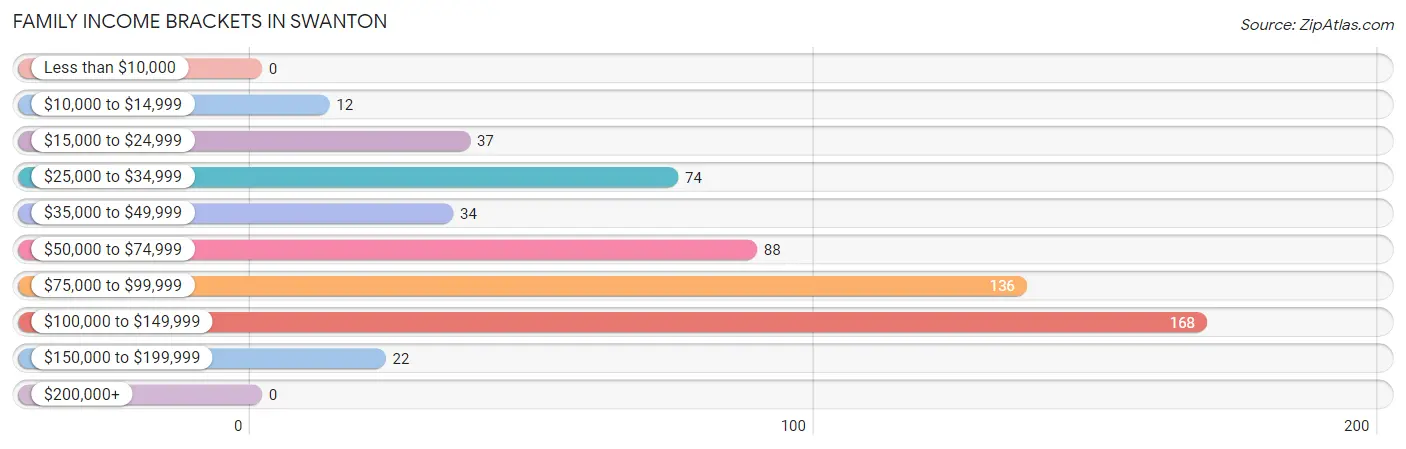
| Income Bracket | # Families | % Families |
| Less than $10,000 | 0 | 0.0% |
| $10,000 to $14,999 | 12 | 2.1% |
| $15,000 to $24,999 | 37 | 6.5% |
| $25,000 to $34,999 | 74 | 13.0% |
| $35,000 to $49,999 | 34 | 6.0% |
| $50,000 to $74,999 | 88 | 15.4% |
| $75,000 to $99,999 | 136 | 23.8% |
| $100,000 to $149,999 | 168 | 29.4% |
| $150,000 to $199,999 | 22 | 3.9% |
| $200,000+ | 0 | 0.0% |
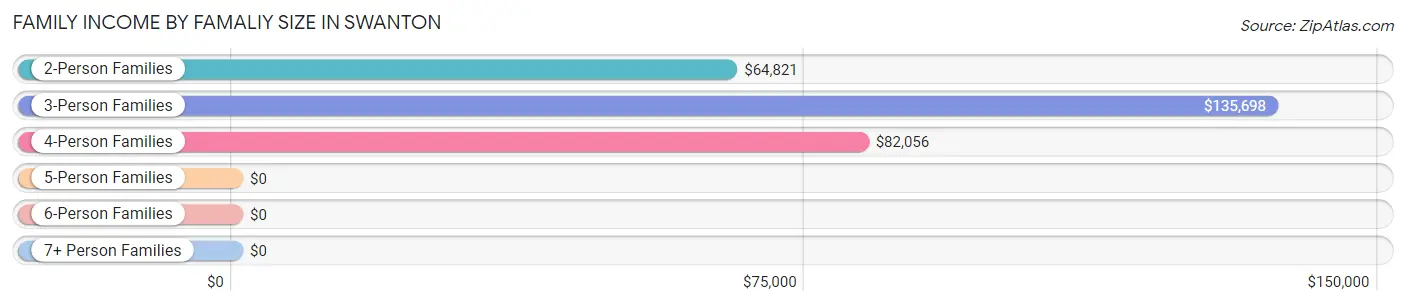
Family Income by Famaliy Size in Swanton
3-person families (108 | 18.9%) account for the highest median family income in Swanton with $135,698 per family, while 3-person families (108 | 18.9%) have the highest median income of $45,233 per family member.
| Income Bracket | # Families | Median Income |
| 2-Person Families | 301 (52.7%) | $64,821 |
| 3-Person Families | 108 (18.9%) | $135,698 |
| 4-Person Families | 109 (19.1%) | $82,056 |
| 5-Person Families | 46 (8.1%) | $0 |
| 6-Person Families | 7 (1.2%) | $0 |
| 7+ Person Families | 0 (0.0%) | $0 |
| Total | 571 (100.0%) | $80,286 |
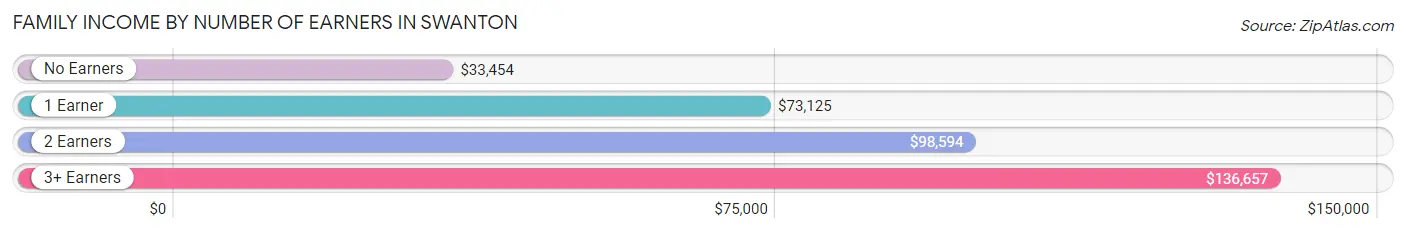
Family Income by Number of Earners in Swanton
The median family income in Swanton is $80,286, with families comprising 3+ earners (85) having the highest median family income of $136,657, while families with no earners (143) have the lowest median family income of $33,454, accounting for 14.9% and 25.0% of families, respectively.
| Number of Earners | # Families | Median Income |
| No Earners | 143 (25.0%) | $33,454 |
| 1 Earner | 166 (29.1%) | $73,125 |
| 2 Earners | 177 (31.0%) | $98,594 |
| 3+ Earners | 85 (14.9%) | $136,657 |
| Total | 571 (100.0%) | $80,286 |
Household Income in Swanton
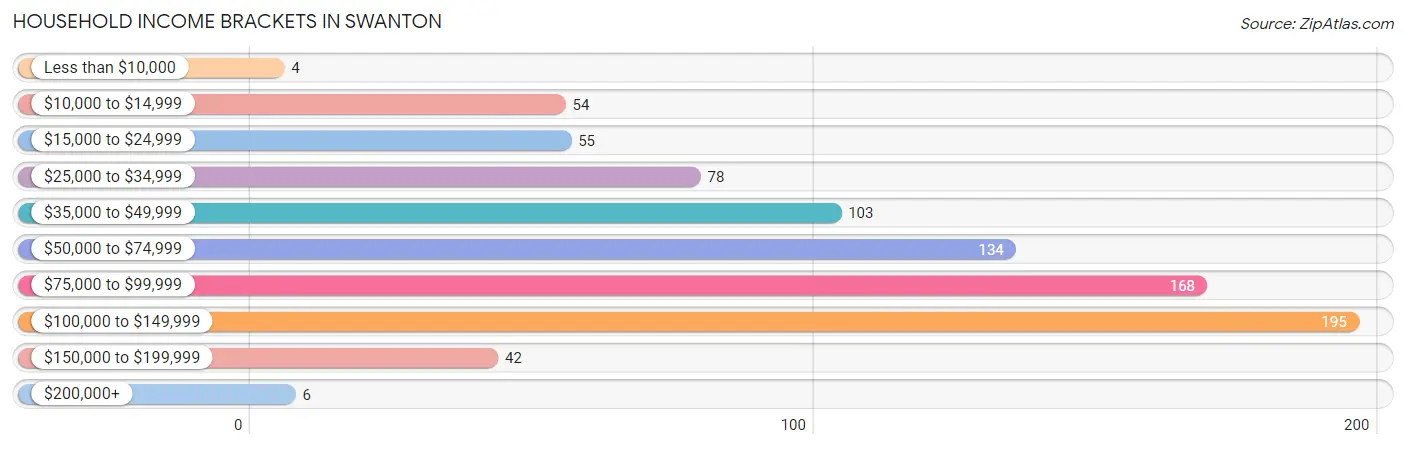
Household Income Brackets in Swanton
With 195 households falling in the category, the $100,000 to $149,999 income range is the most frequent in Swanton, accounting for 23.2% of all households. In contrast, only 4 households (0.5%) fall into the less than $10,000 income bracket, making it the least populous group.
| Income Bracket | # Households | % Households |
| Less than $10,000 | 4 | 0.5% |
| $10,000 to $14,999 | 54 | 6.4% |
| $15,000 to $24,999 | 55 | 6.6% |
| $25,000 to $34,999 | 78 | 9.3% |
| $35,000 to $49,999 | 103 | 12.3% |
| $50,000 to $74,999 | 134 | 16.0% |
| $75,000 to $99,999 | 168 | 20.0% |
| $100,000 to $149,999 | 195 | 23.2% |
| $150,000 to $199,999 | 42 | 5.0% |
| $200,000+ | 6 | 0.7% |
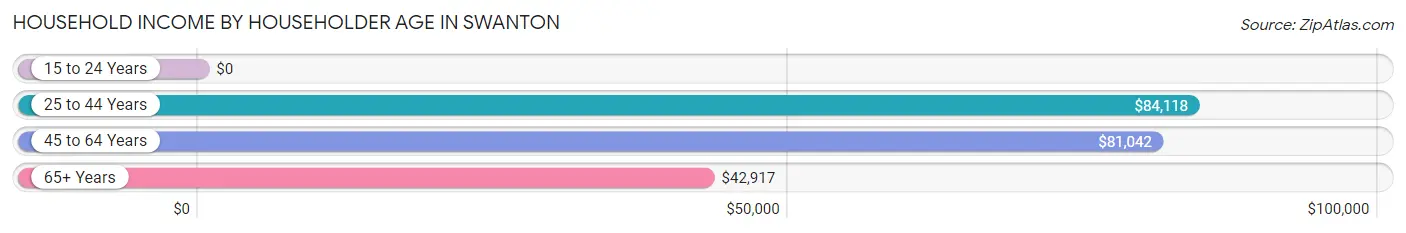
Household Income by Householder Age in Swanton
The median household income in Swanton is $73,365, with the highest median household income of $84,118 found in the 25 to 44 years age bracket for the primary householder. A total of 212 households (25.3%) fall into this category. Meanwhile, the 15 to 24 years age bracket for the primary householder has the lowest median household income of $0, with 8 households (0.9%) in this group.
| Income Bracket | # Households | Median Income |
| 15 to 24 Years | 8 (0.9%) | $0 |
| 25 to 44 Years | 212 (25.3%) | $84,118 |
| 45 to 64 Years | 326 (38.9%) | $81,042 |
| 65+ Years | 293 (34.9%) | $42,917 |
| Total | 839 (100.0%) | $73,365 |
Poverty in Swanton
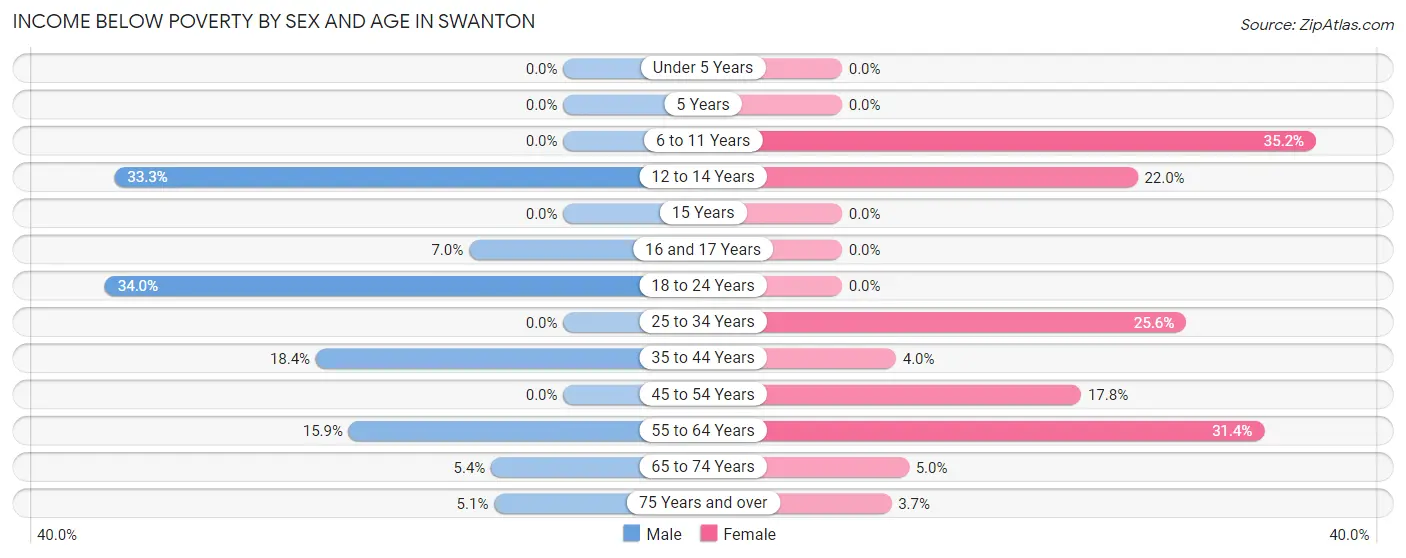
Income Below Poverty by Sex and Age in Swanton
With 9.3% poverty level for males and 13.8% for females among the residents of Swanton, 18 to 24 year old males and 6 to 11 year old females are the most vulnerable to poverty, with 32 males (34.0%) and 44 females (35.2%) in their respective age groups living below the poverty level.
| Age Bracket | Male | Female |
| Under 5 Years | 0 (0.0%) | 0 (0.0%) |
| 5 Years | 0 (0.0%) | 0 (0.0%) |
| 6 to 11 Years | 0 (0.0%) | 44 (35.2%) |
| 12 to 14 Years | 6 (33.3%) | 9 (22.0%) |
| 15 Years | 0 (0.0%) | 0 (0.0%) |
| 16 and 17 Years | 7 (7.0%) | 0 (0.0%) |
| 18 to 24 Years | 32 (34.0%) | 0 (0.0%) |
| 25 to 34 Years | 0 (0.0%) | 23 (25.6%) |
| 35 to 44 Years | 36 (18.4%) | 12 (4.0%) |
| 45 to 54 Years | 0 (0.0%) | 19 (17.8%) |
| 55 to 64 Years | 29 (15.9%) | 37 (31.4%) |
| 65 to 74 Years | 6 (5.4%) | 8 (5.0%) |
| 75 Years and over | 4 (5.1%) | 4 (3.7%) |
| Total | 120 (9.3%) | 156 (13.8%) |
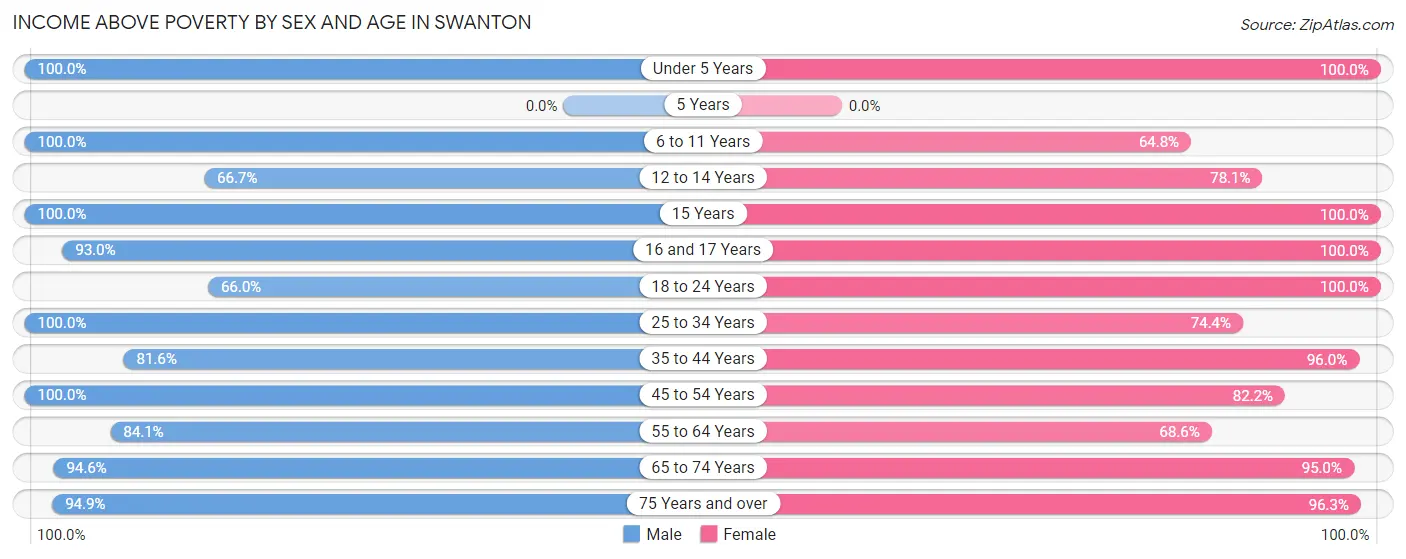
Income Above Poverty by Sex and Age in Swanton
According to the poverty statistics in Swanton, males aged under 5 years and females aged under 5 years are the age groups that are most secure financially, with 100.0% of males and 100.0% of females in these age groups living above the poverty line.
| Age Bracket | Male | Female |
| Under 5 Years | 33 (100.0%) | 42 (100.0%) |
| 5 Years | 0 (0.0%) | 0 (0.0%) |
| 6 to 11 Years | 170 (100.0%) | 81 (64.8%) |
| 12 to 14 Years | 12 (66.7%) | 32 (78.0%) |
| 15 Years | 4 (100.0%) | 2 (100.0%) |
| 16 and 17 Years | 93 (93.0%) | 14 (100.0%) |
| 18 to 24 Years | 62 (66.0%) | 19 (100.0%) |
| 25 to 34 Years | 96 (100.0%) | 67 (74.4%) |
| 35 to 44 Years | 160 (81.6%) | 287 (96.0%) |
| 45 to 54 Years | 206 (100.0%) | 88 (82.2%) |
| 55 to 64 Years | 153 (84.1%) | 81 (68.6%) |
| 65 to 74 Years | 106 (94.6%) | 153 (95.0%) |
| 75 Years and over | 74 (94.9%) | 105 (96.3%) |
| Total | 1,169 (90.7%) | 971 (86.2%) |
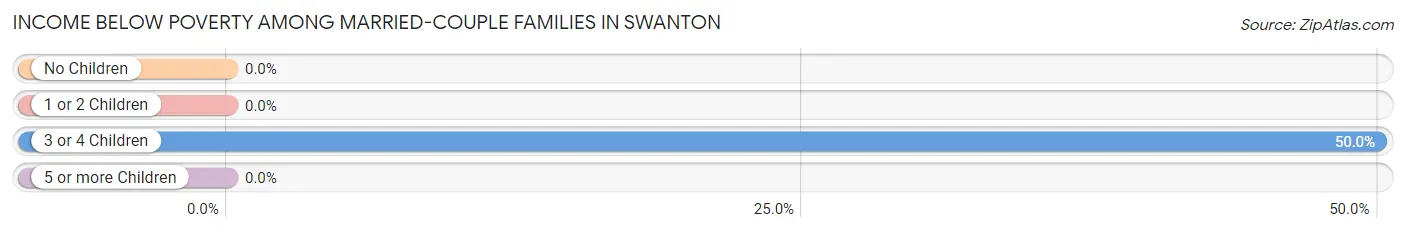
Income Below Poverty Among Married-Couple Families in Swanton
The poverty statistics for married-couple families in Swanton show that 2.9% or 13 of the total 443 families live below the poverty line. Families with 3 or 4 children have the highest poverty rate of 50.0%, comprising of 13 families. On the other hand, families with no children have the lowest poverty rate of 0.0%, which includes 0 families.
| Children | Above Poverty | Below Poverty |
| No Children | 282 (100.0%) | 0 (0.0%) |
| 1 or 2 Children | 135 (100.0%) | 0 (0.0%) |
| 3 or 4 Children | 13 (50.0%) | 13 (50.0%) |
| 5 or more Children | 0 (0.0%) | 0 (0.0%) |
| Total | 430 (97.1%) | 13 (2.9%) |
Income Below Poverty Among Single-Parent Households in Swanton
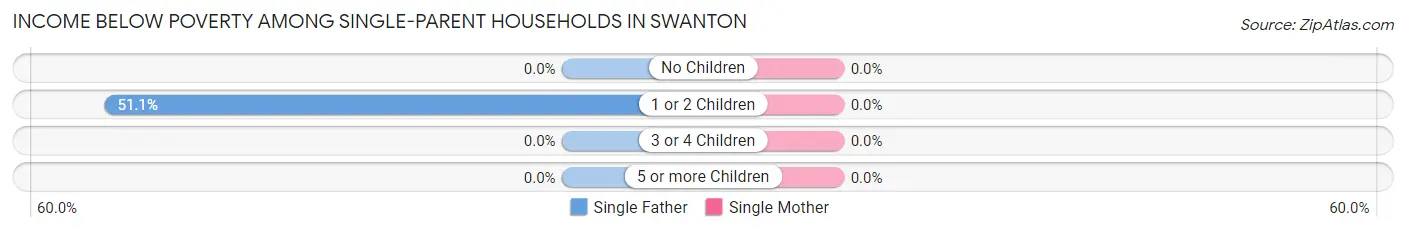
| Children | Single Father | Single Mother |
| No Children | 0 (0.0%) | 0 (0.0%) |
| 1 or 2 Children | 24 (51.1%) | 0 (0.0%) |
| 3 or 4 Children | 0 (0.0%) | 0 (0.0%) |
| 5 or more Children | 0 (0.0%) | 0 (0.0%) |
| Total | 24 (28.6%) | 0 (0.0%) |
Income Below Poverty Among Married-Couple vs Single-Parent Households in Swanton
The poverty data for Swanton shows that 13 of the married-couple family households (2.9%) and 24 of the single-parent households (18.8%) are living below the poverty level. Within the married-couple family households, those with 3 or 4 children have the highest poverty rate, with 13 households (50.0%) falling below the poverty line. Among the single-parent households, those with 1 or 2 children have the highest poverty rate, with 24 household (32.0%) living below poverty.
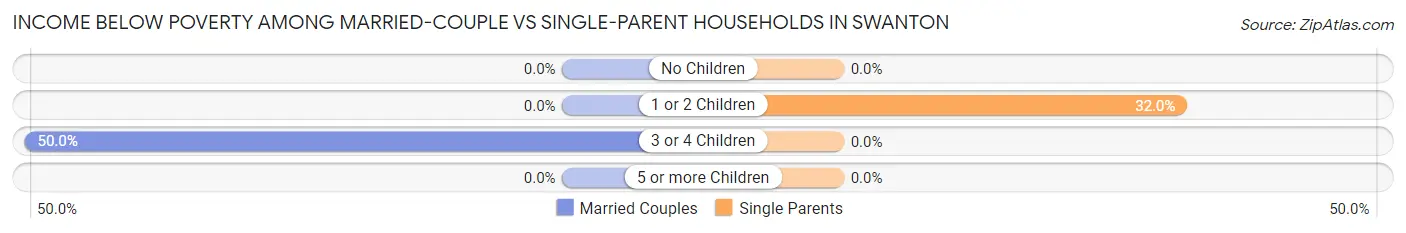
| Children | Married-Couple Families | Single-Parent Households |
| No Children | 0 (0.0%) | 0 (0.0%) |
| 1 or 2 Children | 0 (0.0%) | 24 (32.0%) |
| 3 or 4 Children | 13 (50.0%) | 0 (0.0%) |
| 5 or more Children | 0 (0.0%) | 0 (0.0%) |
| Total | 13 (2.9%) | 24 (18.8%) |
Employment Characteristics in Swanton
Employment by Class of Employer in Swanton
Among the 1,042 employed individuals in Swanton, private company employees (659 | 63.2%), local government employees (124 | 11.9%), and not-for-profit organizations (113 | 10.8%) make up the most common classes of employment.
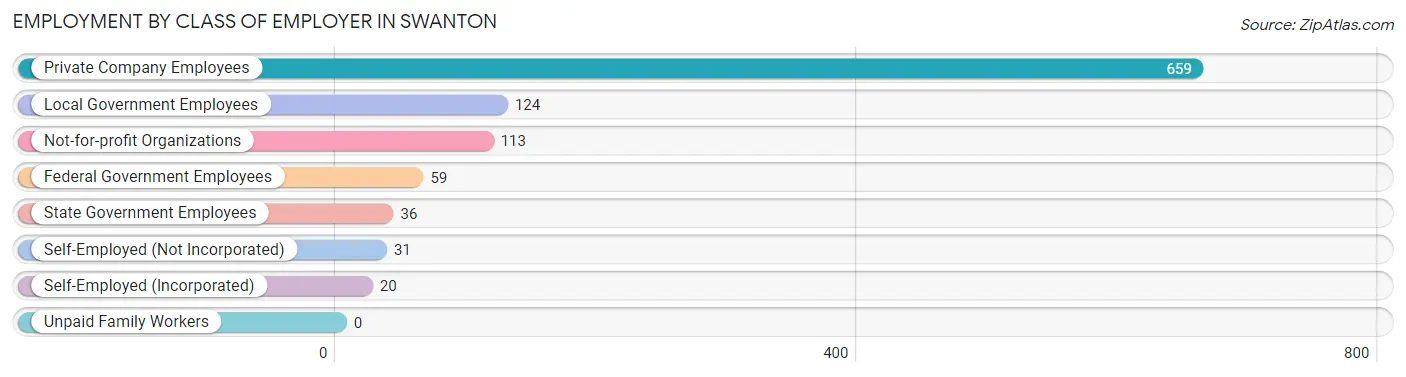
| Employer Class | # Employees | % Employees |
| Private Company Employees | 659 | 63.2% |
| Self-Employed (Incorporated) | 20 | 1.9% |
| Self-Employed (Not Incorporated) | 31 | 3.0% |
| Not-for-profit Organizations | 113 | 10.8% |
| Local Government Employees | 124 | 11.9% |
| State Government Employees | 36 | 3.5% |
| Federal Government Employees | 59 | 5.7% |
| Unpaid Family Workers | 0 | 0.0% |
| Total | 1,042 | 100.0% |
Employment Status by Age in Swanton
According to the labor force statistics for Swanton, out of the total population over 16 years of age (1,981), 58.5% or 1,159 individuals are in the labor force, with 8.2% or 95 of them unemployed. The age group with the highest labor force participation rate is 20 to 24 years, with 100.0% or 40 individuals in the labor force. Within the labor force, the 16 to 19 years age range has the highest percentage of unemployed individuals, with 59.7% or 37 of them being unemployed.
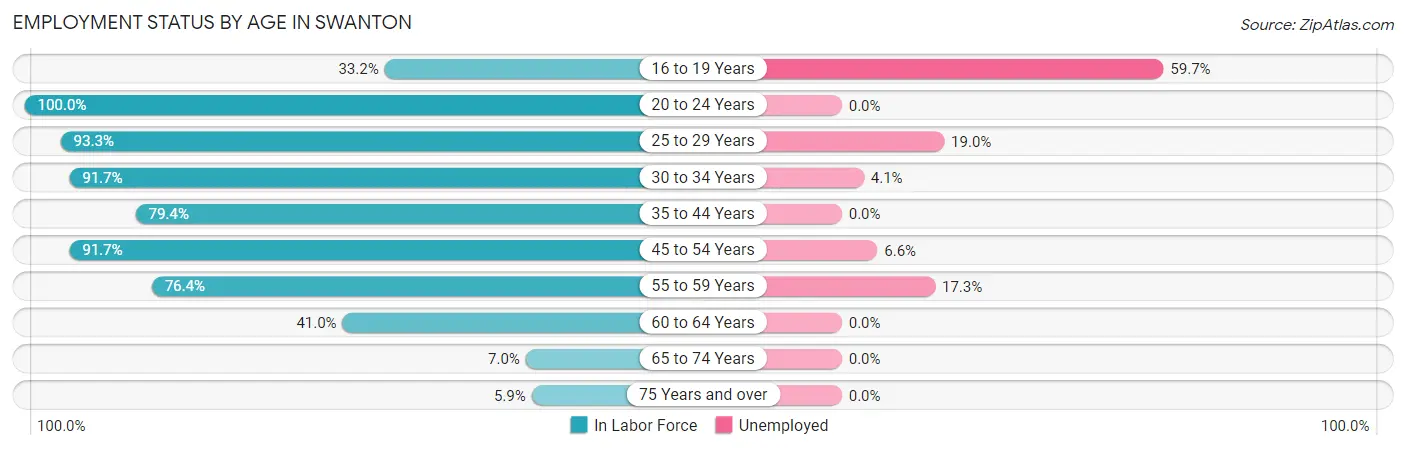
| Age Bracket | In Labor Force | Unemployed |
| 16 to 19 Years | 62 (33.2%) | 37 (59.7%) |
| 20 to 24 Years | 40 (100.0%) | 0 (0.0%) |
| 25 to 29 Years | 84 (93.3%) | 16 (19.0%) |
| 30 to 34 Years | 88 (91.7%) | 4 (4.1%) |
| 35 to 44 Years | 393 (79.4%) | 0 (0.0%) |
| 45 to 54 Years | 287 (91.7%) | 19 (6.6%) |
| 55 to 59 Years | 110 (76.4%) | 19 (17.3%) |
| 60 to 64 Years | 64 (41.0%) | 0 (0.0%) |
| 65 to 74 Years | 19 (7.0%) | 0 (0.0%) |
| 75 Years and over | 11 (5.9%) | 0 (0.0%) |
| Total | 1,159 (58.5%) | 95 (8.2%) |
Employment Status by Educational Attainment in Swanton
According to labor force statistics for Swanton, 79.3% of individuals (1,026) out of the total population between 25 and 64 years of age (1,294) are in the labor force, with 5.6% or 57 of them being unemployed. The group with the highest labor force participation rate are those with the educational attainment of bachelor's degree or higher, with 91.9% or 147 individuals in the labor force. Within the labor force, individuals with less than high school education have the highest percentage of unemployment, with 39.0% or 32 of them being unemployed.
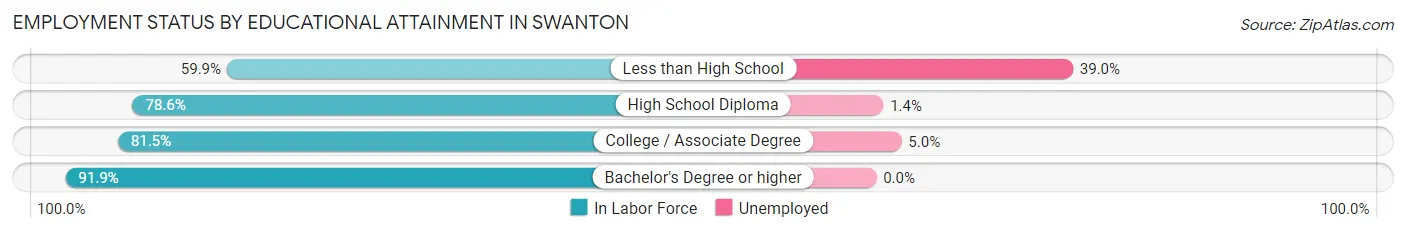
| Educational Attainment | In Labor Force | Unemployed |
| Less than High School | 82 (59.9%) | 53 (39.0%) |
| High School Diploma | 418 (78.6%) | 7 (1.4%) |
| College / Associate Degree | 379 (81.5%) | 23 (5.0%) |
| Bachelor's Degree or higher | 147 (91.9%) | 0 (0.0%) |
| Total | 1,026 (79.3%) | 72 (5.6%) |
Employment Occupations by Sex in Swanton
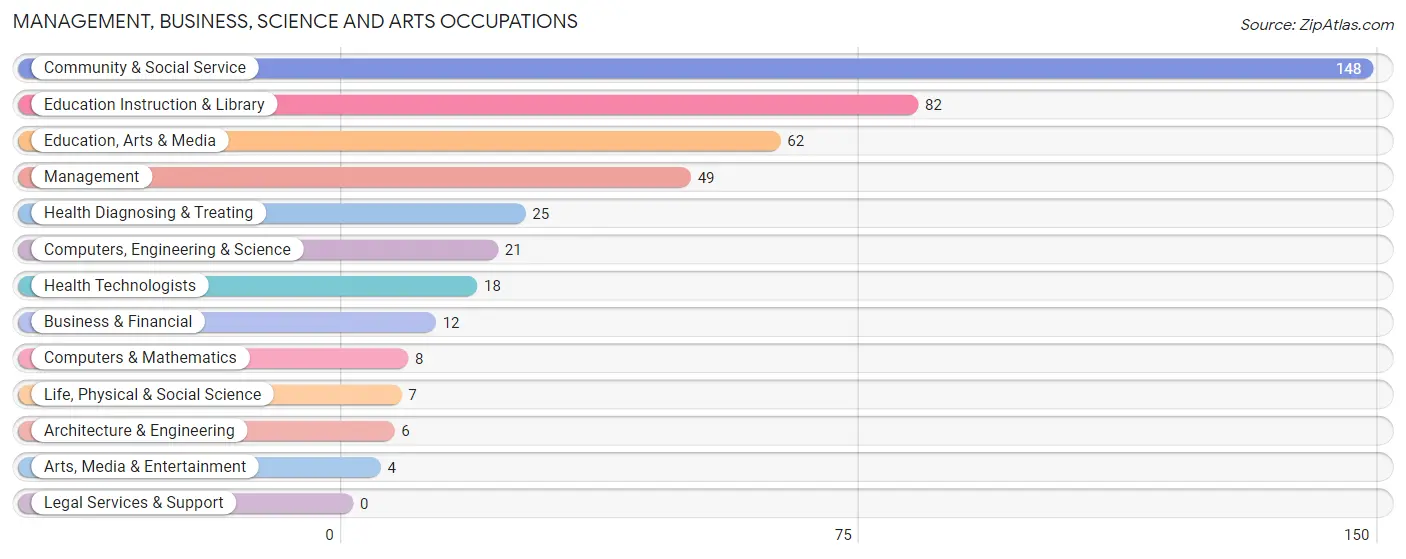
Management, Business, Science and Arts Occupations
The most common Management, Business, Science and Arts occupations in Swanton are Community & Social Service (148 | 14.1%), Education Instruction & Library (82 | 7.8%), Education, Arts & Media (62 | 5.9%), Management (49 | 4.7%), and Health Diagnosing & Treating (25 | 2.4%).
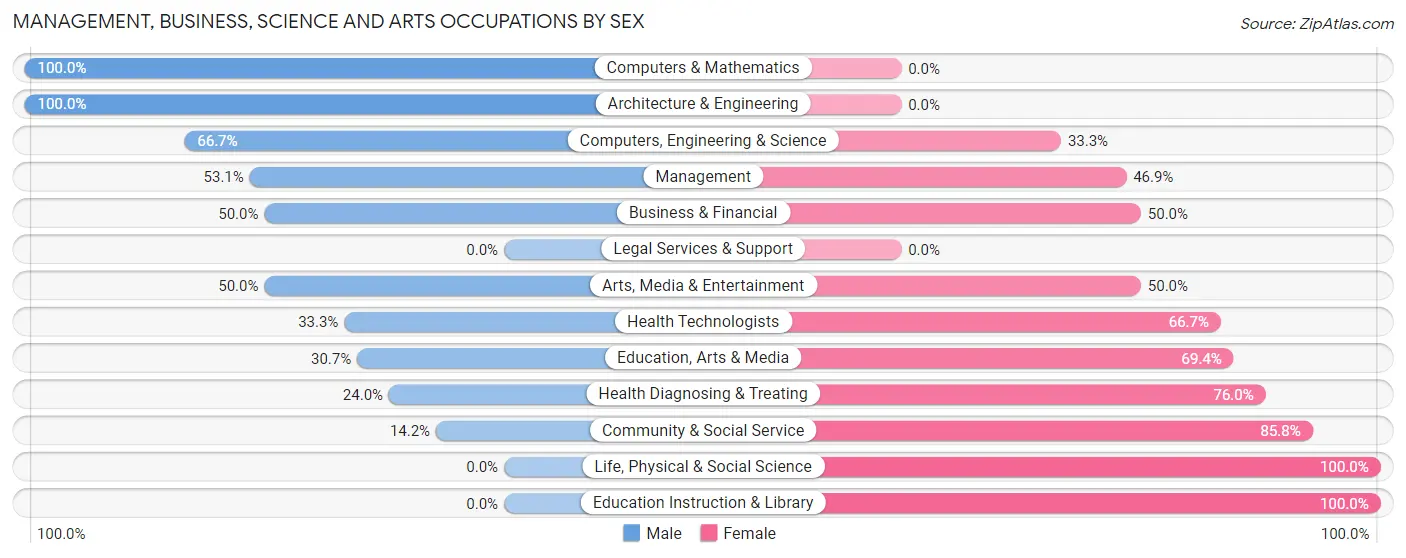
Management, Business, Science and Arts Occupations by Sex
Within the Management, Business, Science and Arts occupations in Swanton, the most male-oriented occupations are Computers & Mathematics (100.0%), Architecture & Engineering (100.0%), and Computers, Engineering & Science (66.7%), while the most female-oriented occupations are Life, Physical & Social Science (100.0%), Education Instruction & Library (100.0%), and Community & Social Service (85.8%).
| Occupation | Male | Female |
| Management | 26 (53.1%) | 23 (46.9%) |
| Business & Financial | 6 (50.0%) | 6 (50.0%) |
| Computers, Engineering & Science | 14 (66.7%) | 7 (33.3%) |
| Computers & Mathematics | 8 (100.0%) | 0 (0.0%) |
| Architecture & Engineering | 6 (100.0%) | 0 (0.0%) |
| Life, Physical & Social Science | 0 (0.0%) | 7 (100.0%) |
| Community & Social Service | 21 (14.2%) | 127 (85.8%) |
| Education, Arts & Media | 19 (30.6%) | 43 (69.4%) |
| Legal Services & Support | 0 (0.0%) | 0 (0.0%) |
| Education Instruction & Library | 0 (0.0%) | 82 (100.0%) |
| Arts, Media & Entertainment | 2 (50.0%) | 2 (50.0%) |
| Health Diagnosing & Treating | 6 (24.0%) | 19 (76.0%) |
| Health Technologists | 6 (33.3%) | 12 (66.7%) |
| Total (Category) | 73 (28.6%) | 182 (71.4%) |
| Total (Overall) | 558 (53.2%) | 490 (46.8%) |
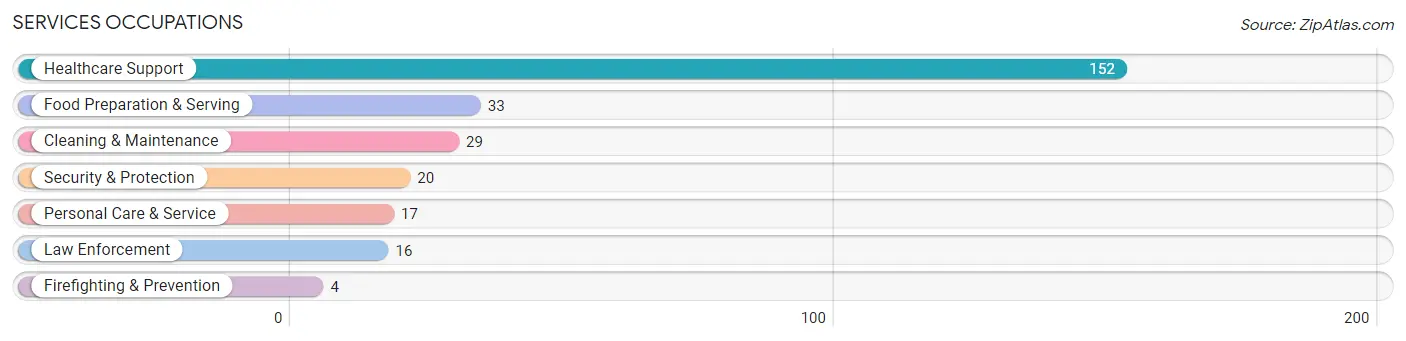
Services Occupations
The most common Services occupations in Swanton are Healthcare Support (152 | 14.5%), Food Preparation & Serving (33 | 3.2%), Cleaning & Maintenance (29 | 2.8%), Security & Protection (20 | 1.9%), and Personal Care & Service (17 | 1.6%).
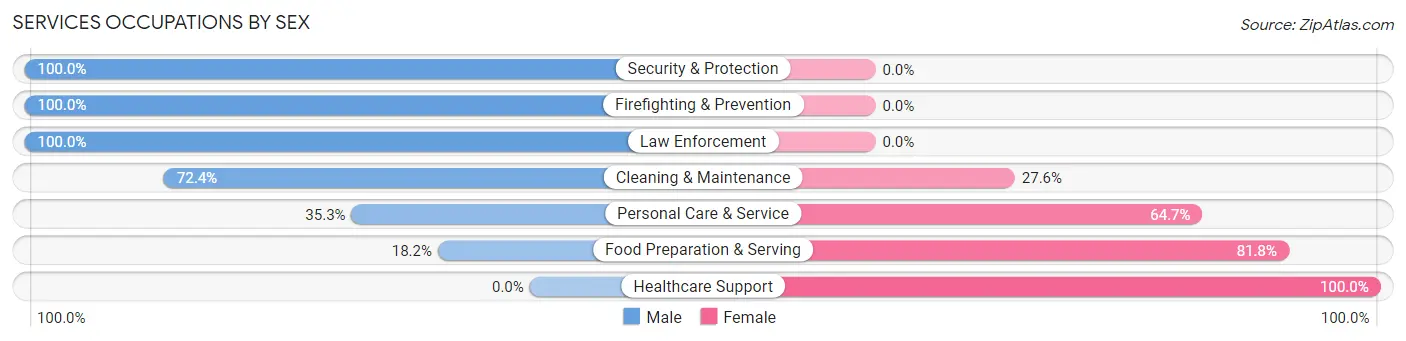
Services Occupations by Sex
Within the Services occupations in Swanton, the most male-oriented occupations are Security & Protection (100.0%), Firefighting & Prevention (100.0%), and Law Enforcement (100.0%), while the most female-oriented occupations are Healthcare Support (100.0%), Food Preparation & Serving (81.8%), and Personal Care & Service (64.7%).
| Occupation | Male | Female |
| Healthcare Support | 0 (0.0%) | 152 (100.0%) |
| Security & Protection | 20 (100.0%) | 0 (0.0%) |
| Firefighting & Prevention | 4 (100.0%) | 0 (0.0%) |
| Law Enforcement | 16 (100.0%) | 0 (0.0%) |
| Food Preparation & Serving | 6 (18.2%) | 27 (81.8%) |
| Cleaning & Maintenance | 21 (72.4%) | 8 (27.6%) |
| Personal Care & Service | 6 (35.3%) | 11 (64.7%) |
| Total (Category) | 53 (21.1%) | 198 (78.9%) |
| Total (Overall) | 558 (53.2%) | 490 (46.8%) |
Sales and Office Occupations
The most common Sales and Office occupations in Swanton are Office & Administration (85 | 8.1%), and Sales & Related (73 | 7.0%).
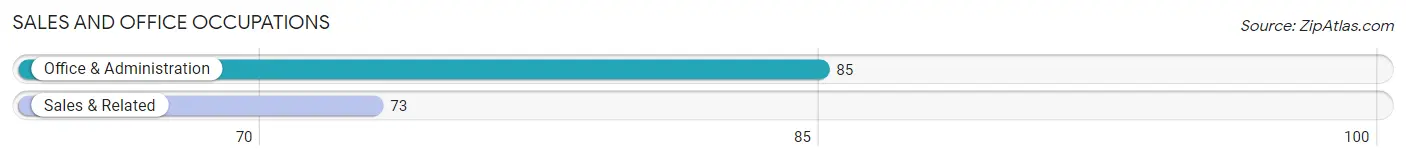
Sales and Office Occupations by Sex
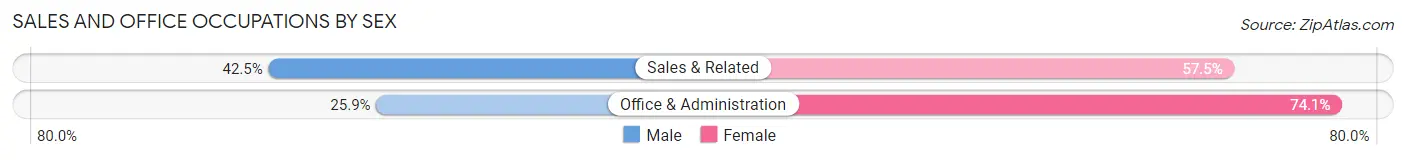
| Occupation | Male | Female |
| Sales & Related | 31 (42.5%) | 42 (57.5%) |
| Office & Administration | 22 (25.9%) | 63 (74.1%) |
| Total (Category) | 53 (33.5%) | 105 (66.5%) |
| Total (Overall) | 558 (53.2%) | 490 (46.8%) |
Natural Resources, Construction and Maintenance Occupations
The most common Natural Resources, Construction and Maintenance occupations in Swanton are Construction & Extraction (142 | 13.6%), and Installation, Maintenance & Repair (36 | 3.4%).
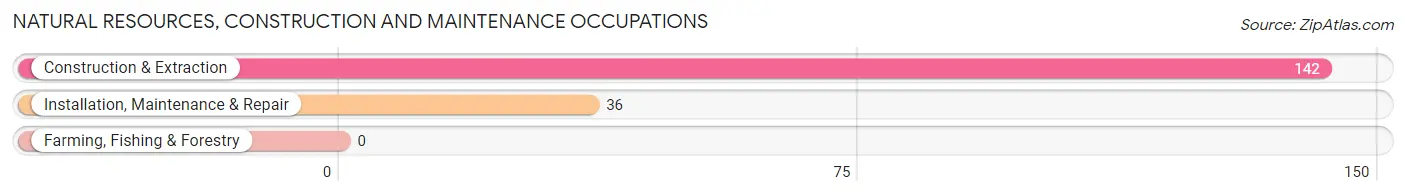
Natural Resources, Construction and Maintenance Occupations by Sex
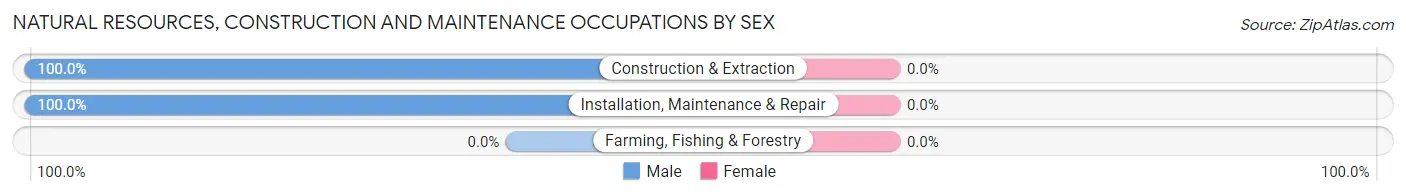
| Occupation | Male | Female |
| Farming, Fishing & Forestry | 0 (0.0%) | 0 (0.0%) |
| Construction & Extraction | 142 (100.0%) | 0 (0.0%) |
| Installation, Maintenance & Repair | 36 (100.0%) | 0 (0.0%) |
| Total (Category) | 178 (100.0%) | 0 (0.0%) |
| Total (Overall) | 558 (53.2%) | 490 (46.8%) |
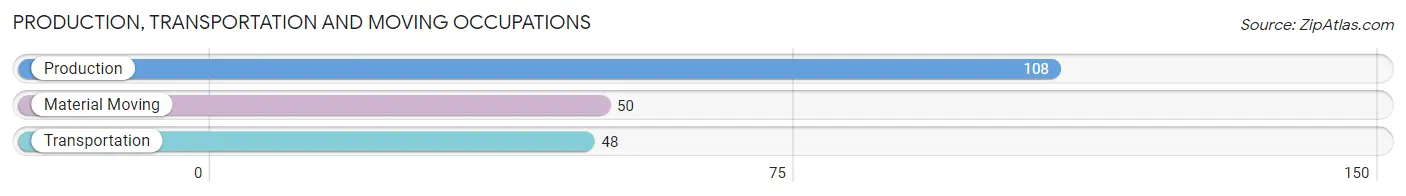
Production, Transportation and Moving Occupations
The most common Production, Transportation and Moving occupations in Swanton are Production (108 | 10.3%), Material Moving (50 | 4.8%), and Transportation (48 | 4.6%).
Production, Transportation and Moving Occupations by Sex
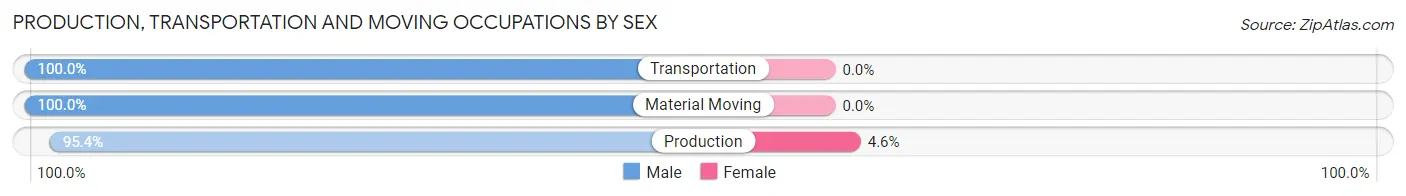
| Occupation | Male | Female |
| Production | 103 (95.4%) | 5 (4.6%) |
| Transportation | 48 (100.0%) | 0 (0.0%) |
| Material Moving | 50 (100.0%) | 0 (0.0%) |
| Total (Category) | 201 (97.6%) | 5 (2.4%) |
| Total (Overall) | 558 (53.2%) | 490 (46.8%) |
Employment Industries by Sex in Swanton
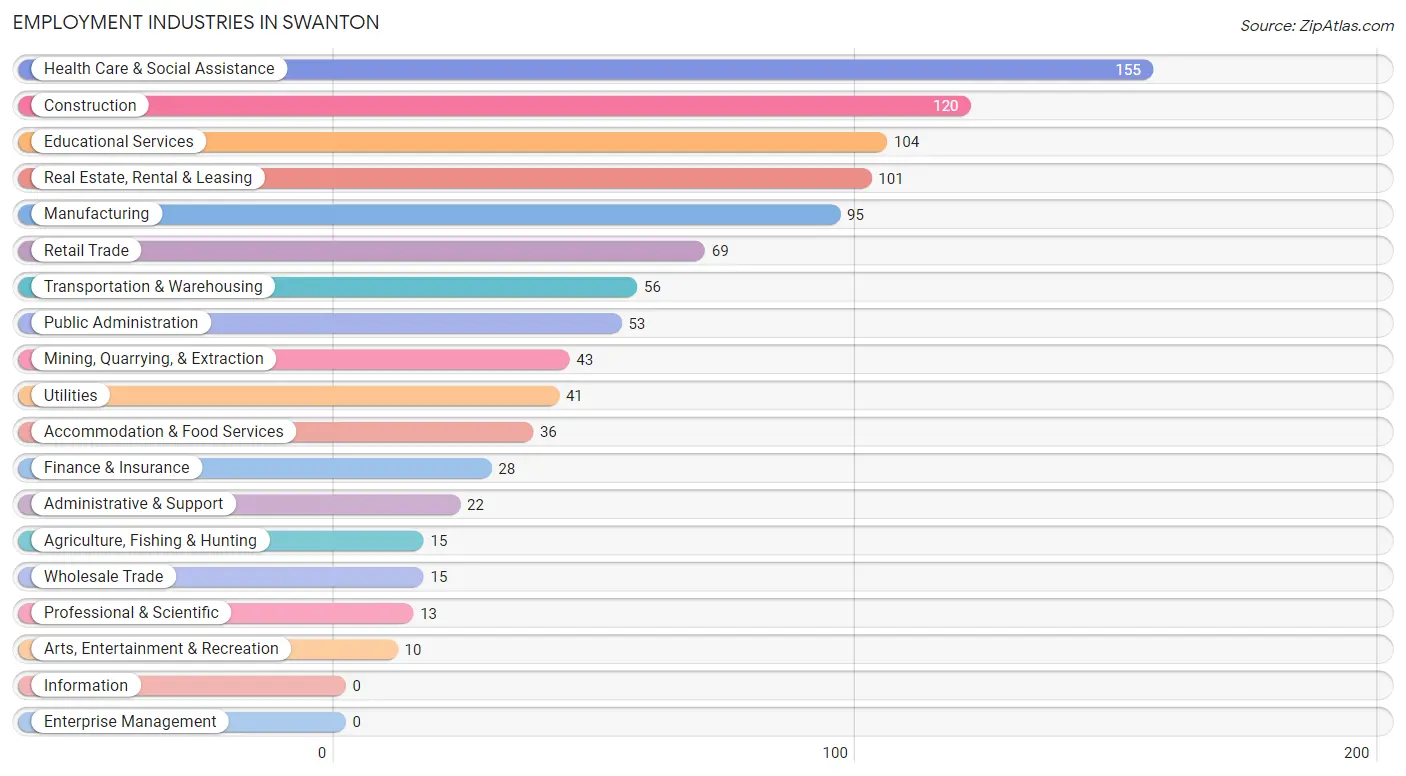
Employment Industries in Swanton
The major employment industries in Swanton include Health Care & Social Assistance (155 | 14.8%), Construction (120 | 11.5%), Educational Services (104 | 9.9%), Real Estate, Rental & Leasing (101 | 9.6%), and Manufacturing (95 | 9.1%).
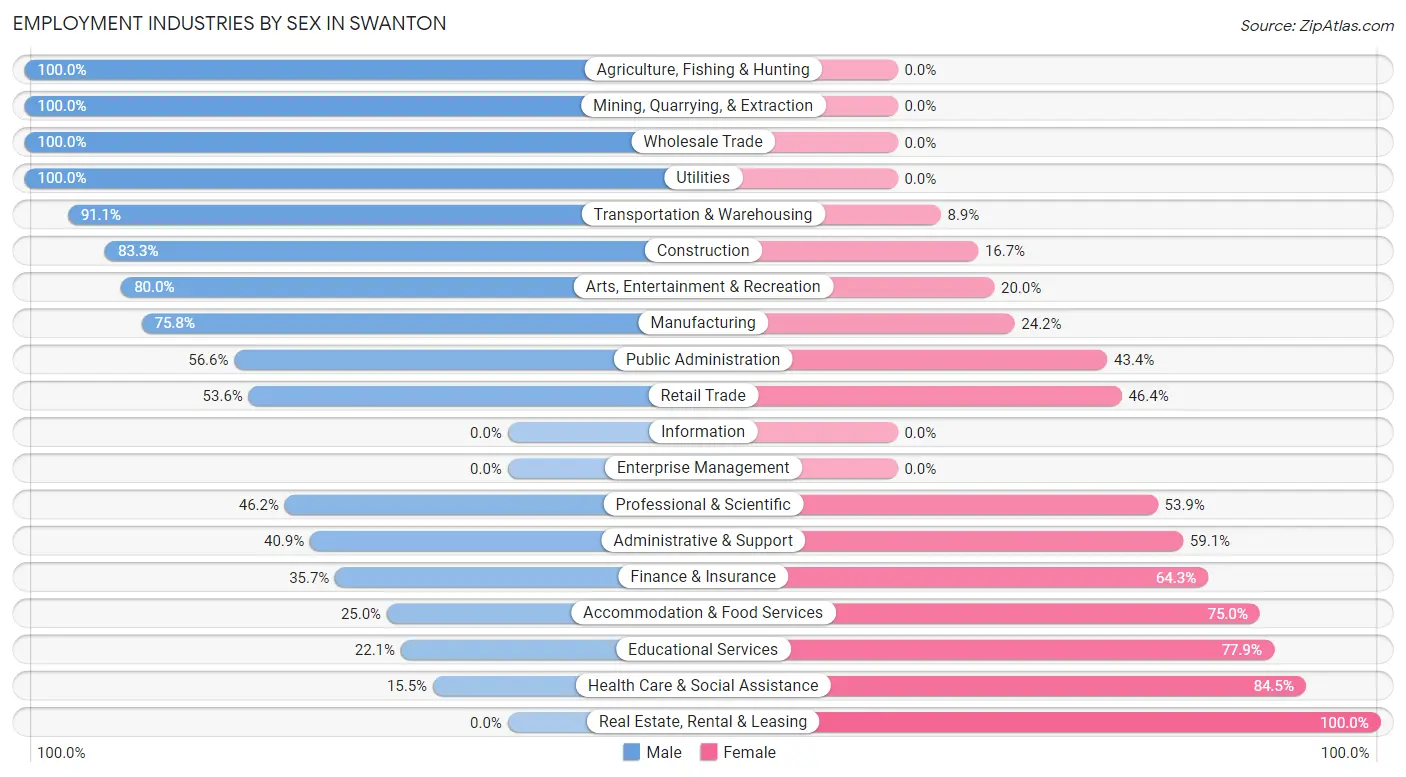
Employment Industries by Sex in Swanton
The Swanton industries that see more men than women are Agriculture, Fishing & Hunting (100.0%), Mining, Quarrying, & Extraction (100.0%), and Wholesale Trade (100.0%), whereas the industries that tend to have a higher number of women are Real Estate, Rental & Leasing (100.0%), Health Care & Social Assistance (84.5%), and Educational Services (77.9%).
| Industry | Male | Female |
| Agriculture, Fishing & Hunting | 15 (100.0%) | 0 (0.0%) |
| Mining, Quarrying, & Extraction | 43 (100.0%) | 0 (0.0%) |
| Construction | 100 (83.3%) | 20 (16.7%) |
| Manufacturing | 72 (75.8%) | 23 (24.2%) |
| Wholesale Trade | 15 (100.0%) | 0 (0.0%) |
| Retail Trade | 37 (53.6%) | 32 (46.4%) |
| Transportation & Warehousing | 51 (91.1%) | 5 (8.9%) |
| Utilities | 41 (100.0%) | 0 (0.0%) |
| Information | 0 (0.0%) | 0 (0.0%) |
| Finance & Insurance | 10 (35.7%) | 18 (64.3%) |
| Real Estate, Rental & Leasing | 0 (0.0%) | 101 (100.0%) |
| Professional & Scientific | 6 (46.2%) | 7 (53.8%) |
| Enterprise Management | 0 (0.0%) | 0 (0.0%) |
| Administrative & Support | 9 (40.9%) | 13 (59.1%) |
| Educational Services | 23 (22.1%) | 81 (77.9%) |
| Health Care & Social Assistance | 24 (15.5%) | 131 (84.5%) |
| Arts, Entertainment & Recreation | 8 (80.0%) | 2 (20.0%) |
| Accommodation & Food Services | 9 (25.0%) | 27 (75.0%) |
| Public Administration | 30 (56.6%) | 23 (43.4%) |
| Total | 558 (53.2%) | 490 (46.8%) |
Education in Swanton
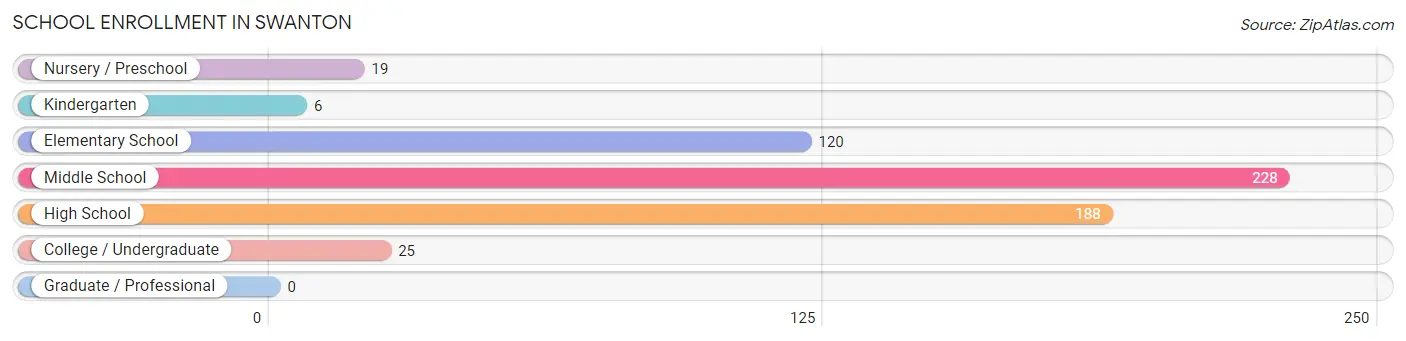
School Enrollment in Swanton
The most common levels of schooling among the 586 students in Swanton are middle school (228 | 38.9%), high school (188 | 32.1%), and elementary school (120 | 20.5%).
| School Level | # Students | % Students |
| Nursery / Preschool | 19 | 3.2% |
| Kindergarten | 6 | 1.0% |
| Elementary School | 120 | 20.5% |
| Middle School | 228 | 38.9% |
| High School | 188 | 32.1% |
| College / Undergraduate | 25 | 4.3% |
| Graduate / Professional | 0 | 0.0% |
| Total | 586 | 100.0% |
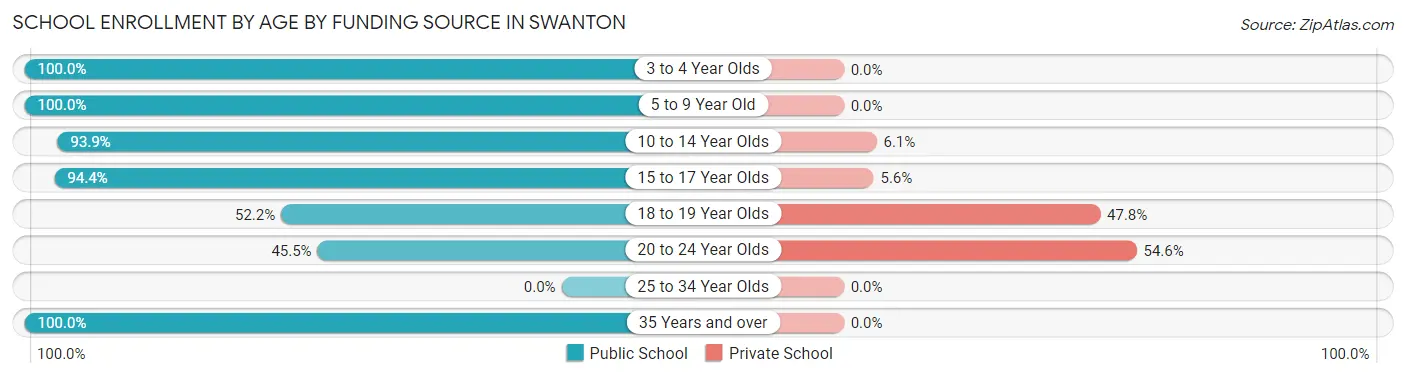
School Enrollment by Age by Funding Source in Swanton
Out of a total of 586 students who are enrolled in schools in Swanton, 59 (10.1%) attend a private institution, while the remaining 527 (89.9%) are enrolled in public schools. The age group of 20 to 24 year olds has the highest likelihood of being enrolled in private schools, with 6 (54.5% in the age bracket) enrolled. Conversely, the age group of 3 to 4 year olds has the lowest likelihood of being enrolled in a private school, with 19 (100.0% in the age bracket) attending a public institution.
| Age Bracket | Public School | Private School |
| 3 to 4 Year Olds | 19 (100.0%) | 0 (0.0%) |
| 5 to 9 Year Old | 115 (100.0%) | 0 (0.0%) |
| 10 to 14 Year Olds | 230 (93.9%) | 15 (6.1%) |
| 15 to 17 Year Olds | 102 (94.4%) | 6 (5.6%) |
| 18 to 19 Year Olds | 35 (52.2%) | 32 (47.8%) |
| 20 to 24 Year Olds | 5 (45.5%) | 6 (54.5%) |
| 25 to 34 Year Olds | 0 (0.0%) | 0 (0.0%) |
| 35 Years and over | 21 (100.0%) | 0 (0.0%) |
| Total | 527 (89.9%) | 59 (10.1%) |
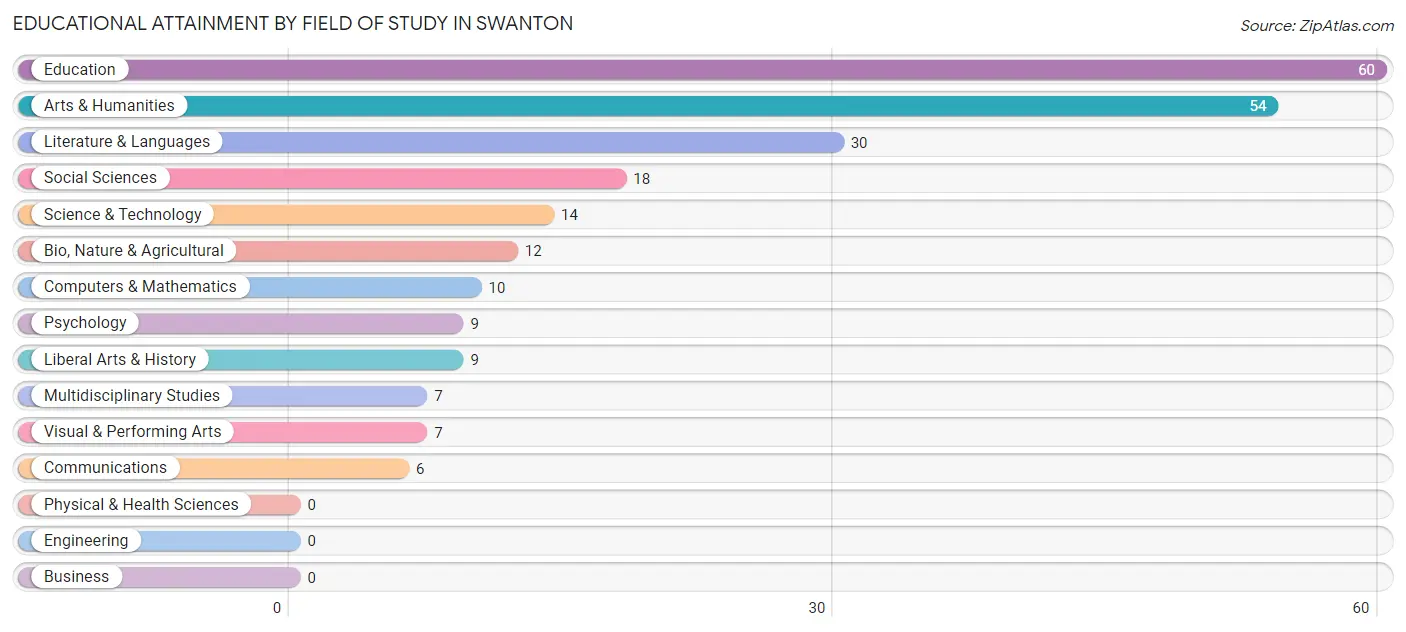
Educational Attainment by Field of Study in Swanton
Education (60 | 25.4%), arts & humanities (54 | 22.9%), literature & languages (30 | 12.7%), social sciences (18 | 7.6%), and science & technology (14 | 5.9%) are the most common fields of study among 236 individuals in Swanton who have obtained a bachelor's degree or higher.
| Field of Study | # Graduates | % Graduates |
| Computers & Mathematics | 10 | 4.2% |
| Bio, Nature & Agricultural | 12 | 5.1% |
| Physical & Health Sciences | 0 | 0.0% |
| Psychology | 9 | 3.8% |
| Social Sciences | 18 | 7.6% |
| Engineering | 0 | 0.0% |
| Multidisciplinary Studies | 7 | 3.0% |
| Science & Technology | 14 | 5.9% |
| Business | 0 | 0.0% |
| Education | 60 | 25.4% |
| Literature & Languages | 30 | 12.7% |
| Liberal Arts & History | 9 | 3.8% |
| Visual & Performing Arts | 7 | 3.0% |
| Communications | 6 | 2.5% |
| Arts & Humanities | 54 | 22.9% |
| Total | 236 | 100.0% |
Transportation & Commute in Swanton
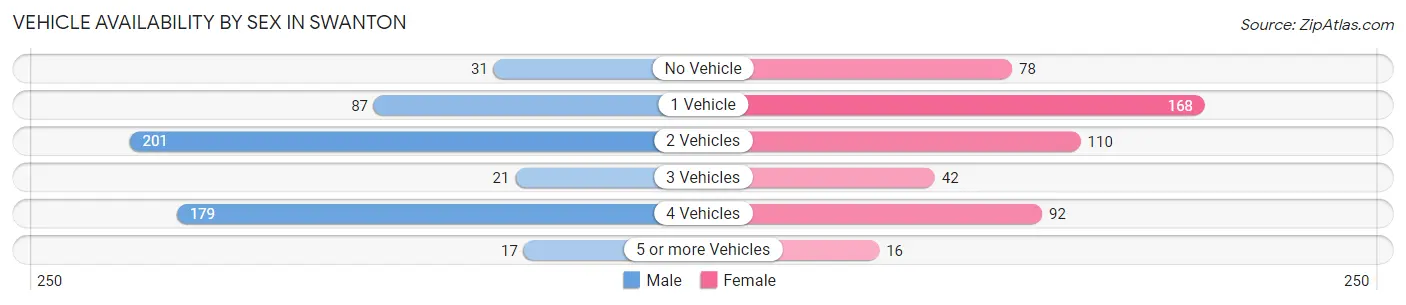
Vehicle Availability by Sex in Swanton
The most prevalent vehicle ownership categories in Swanton are males with 2 vehicles (201, accounting for 37.5%) and females with 2 vehicles (110, making up 39.7%).
| Vehicles Available | Male | Female |
| No Vehicle | 31 (5.8%) | 78 (15.4%) |
| 1 Vehicle | 87 (16.2%) | 168 (33.2%) |
| 2 Vehicles | 201 (37.5%) | 110 (21.7%) |
| 3 Vehicles | 21 (3.9%) | 42 (8.3%) |
| 4 Vehicles | 179 (33.4%) | 92 (18.2%) |
| 5 or more Vehicles | 17 (3.2%) | 16 (3.2%) |
| Total | 536 (100.0%) | 506 (100.0%) |
Commute Time in Swanton
The most frequently occuring commute durations in Swanton are 5 to 9 minutes (192 commuters, 19.6%), 15 to 19 minutes (186 commuters, 19.0%), and 45 to 59 minutes (146 commuters, 14.9%).
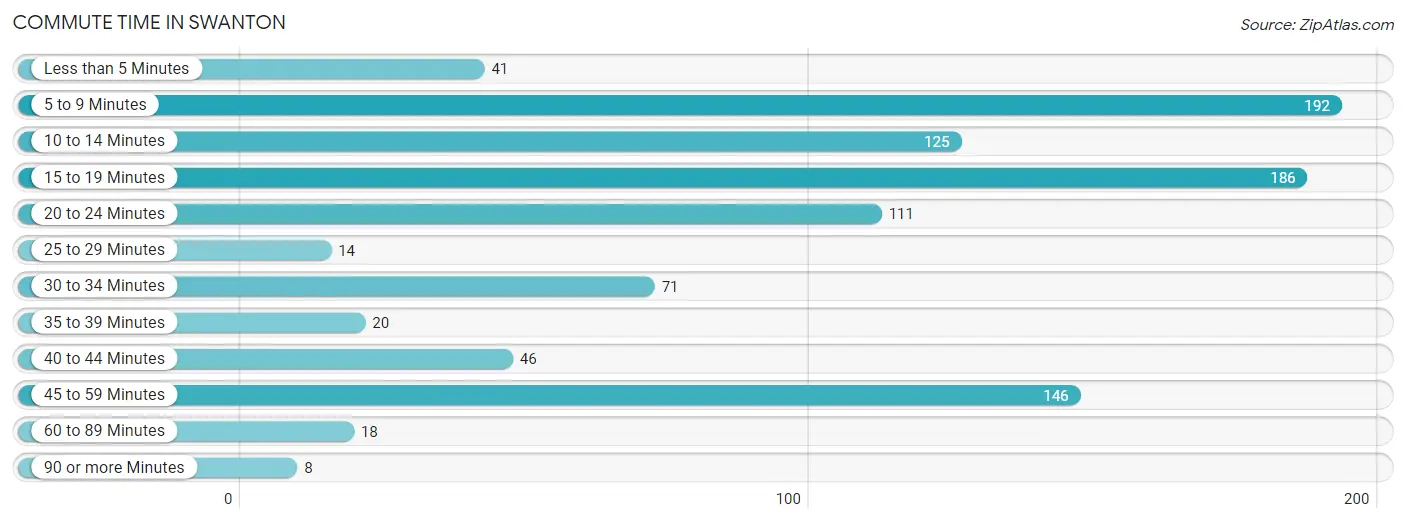
| Commute Time | # Commuters | % Commuters |
| Less than 5 Minutes | 41 | 4.2% |
| 5 to 9 Minutes | 192 | 19.6% |
| 10 to 14 Minutes | 125 | 12.8% |
| 15 to 19 Minutes | 186 | 19.0% |
| 20 to 24 Minutes | 111 | 11.4% |
| 25 to 29 Minutes | 14 | 1.4% |
| 30 to 34 Minutes | 71 | 7.3% |
| 35 to 39 Minutes | 20 | 2.0% |
| 40 to 44 Minutes | 46 | 4.7% |
| 45 to 59 Minutes | 146 | 14.9% |
| 60 to 89 Minutes | 18 | 1.8% |
| 90 or more Minutes | 8 | 0.8% |
Commute Time by Sex in Swanton
The most common commute times in Swanton are 5 to 9 minutes (108 commuters, 20.9%) for males and 15 to 19 minutes (128 commuters, 27.8%) for females.
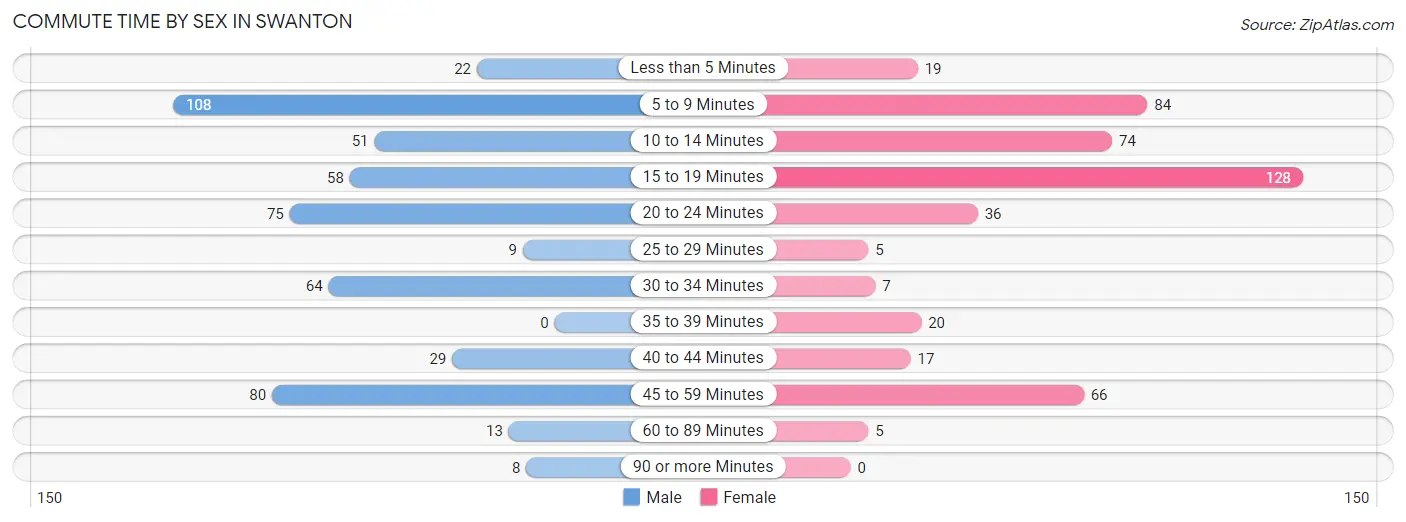
| Commute Time | Male | Female |
| Less than 5 Minutes | 22 (4.3%) | 19 (4.1%) |
| 5 to 9 Minutes | 108 (20.9%) | 84 (18.2%) |
| 10 to 14 Minutes | 51 (9.9%) | 74 (16.1%) |
| 15 to 19 Minutes | 58 (11.2%) | 128 (27.8%) |
| 20 to 24 Minutes | 75 (14.5%) | 36 (7.8%) |
| 25 to 29 Minutes | 9 (1.7%) | 5 (1.1%) |
| 30 to 34 Minutes | 64 (12.4%) | 7 (1.5%) |
| 35 to 39 Minutes | 0 (0.0%) | 20 (4.3%) |
| 40 to 44 Minutes | 29 (5.6%) | 17 (3.7%) |
| 45 to 59 Minutes | 80 (15.5%) | 66 (14.3%) |
| 60 to 89 Minutes | 13 (2.5%) | 5 (1.1%) |
| 90 or more Minutes | 8 (1.5%) | 0 (0.0%) |
Time of Departure to Work by Sex in Swanton
The most frequent times of departure to work in Swanton are 7:00 AM to 7:29 AM (82, 15.9%) for males and 4:00 PM to 11:59 PM (110, 23.9%) for females.
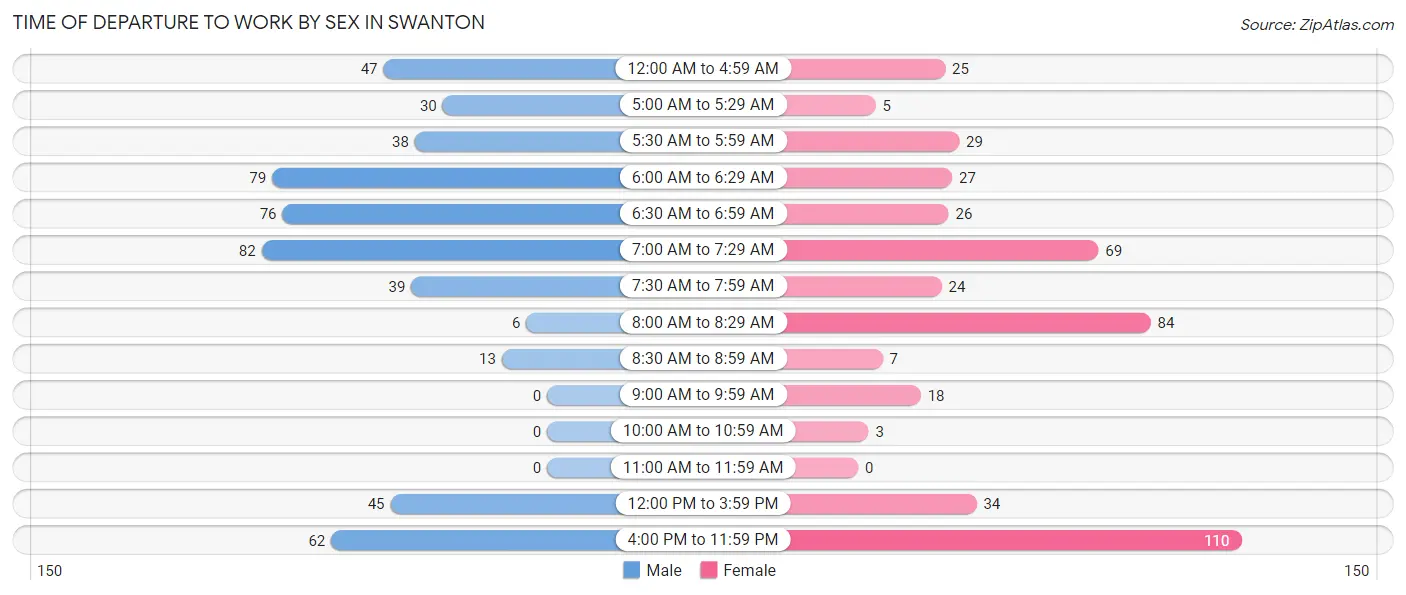
| Time of Departure | Male | Female |
| 12:00 AM to 4:59 AM | 47 (9.1%) | 25 (5.4%) |
| 5:00 AM to 5:29 AM | 30 (5.8%) | 5 (1.1%) |
| 5:30 AM to 5:59 AM | 38 (7.3%) | 29 (6.3%) |
| 6:00 AM to 6:29 AM | 79 (15.3%) | 27 (5.9%) |
| 6:30 AM to 6:59 AM | 76 (14.7%) | 26 (5.6%) |
| 7:00 AM to 7:29 AM | 82 (15.9%) | 69 (15.0%) |
| 7:30 AM to 7:59 AM | 39 (7.5%) | 24 (5.2%) |
| 8:00 AM to 8:29 AM | 6 (1.2%) | 84 (18.2%) |
| 8:30 AM to 8:59 AM | 13 (2.5%) | 7 (1.5%) |
| 9:00 AM to 9:59 AM | 0 (0.0%) | 18 (3.9%) |
| 10:00 AM to 10:59 AM | 0 (0.0%) | 3 (0.6%) |
| 11:00 AM to 11:59 AM | 0 (0.0%) | 0 (0.0%) |
| 12:00 PM to 3:59 PM | 45 (8.7%) | 34 (7.4%) |
| 4:00 PM to 11:59 PM | 62 (12.0%) | 110 (23.9%) |
| Total | 517 (100.0%) | 461 (100.0%) |
Housing Occupancy in Swanton
Occupancy by Ownership in Swanton
Of the total 839 dwellings in Swanton, owner-occupied units account for 659 (78.5%), while renter-occupied units make up 180 (21.4%).
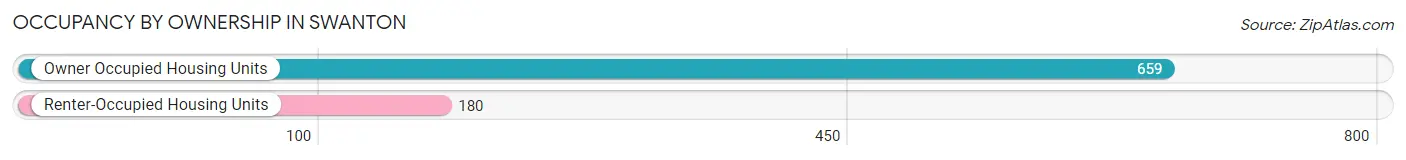
| Occupancy | # Housing Units | % Housing Units |
| Owner Occupied Housing Units | 659 | 78.5% |
| Renter-Occupied Housing Units | 180 | 21.4% |
| Total Occupied Housing Units | 839 | 100.0% |
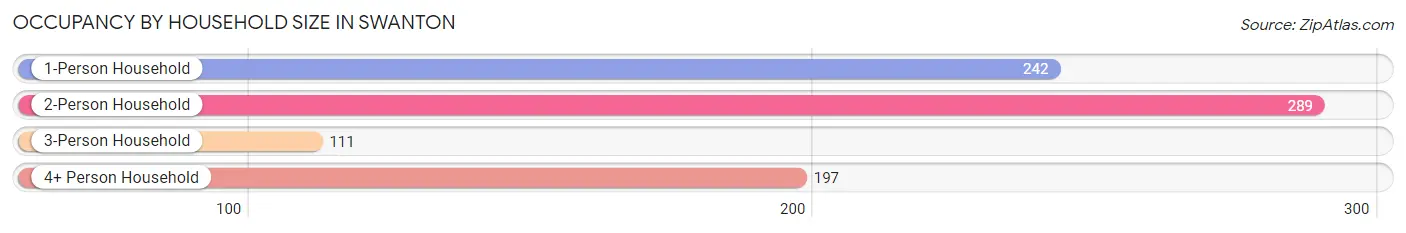
Occupancy by Household Size in Swanton
| Household Size | # Housing Units | % Housing Units |
| 1-Person Household | 242 | 28.8% |
| 2-Person Household | 289 | 34.4% |
| 3-Person Household | 111 | 13.2% |
| 4+ Person Household | 197 | 23.5% |
| Total Housing Units | 839 | 100.0% |
Occupancy by Ownership by Household Size in Swanton
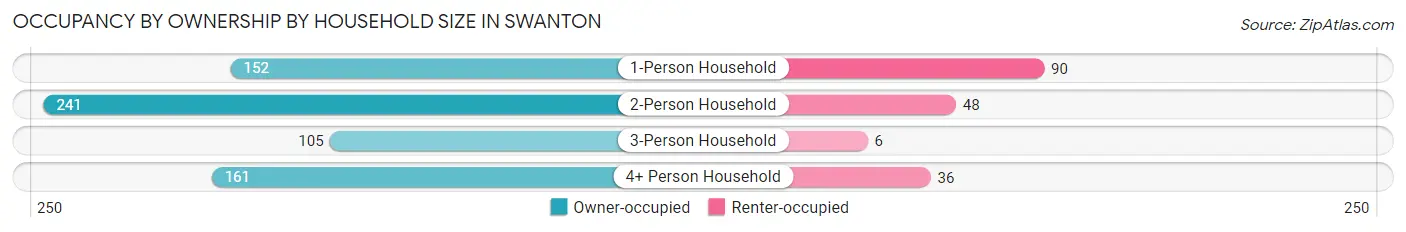
| Household Size | Owner-occupied | Renter-occupied |
| 1-Person Household | 152 (62.8%) | 90 (37.2%) |
| 2-Person Household | 241 (83.4%) | 48 (16.6%) |
| 3-Person Household | 105 (94.6%) | 6 (5.4%) |
| 4+ Person Household | 161 (81.7%) | 36 (18.3%) |
| Total Housing Units | 659 (78.5%) | 180 (21.4%) |
Occupancy by Educational Attainment in Swanton
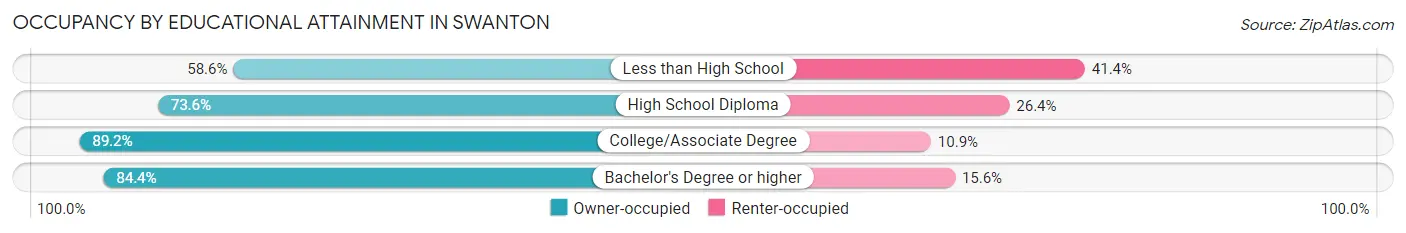
| Household Size | Owner-occupied | Renter-occupied |
| Less than High School | 34 (58.6%) | 24 (41.4%) |
| High School Diploma | 301 (73.6%) | 108 (26.4%) |
| College/Associate Degree | 189 (89.1%) | 23 (10.8%) |
| Bachelor's Degree or higher | 135 (84.4%) | 25 (15.6%) |
Occupancy by Age of Householder in Swanton
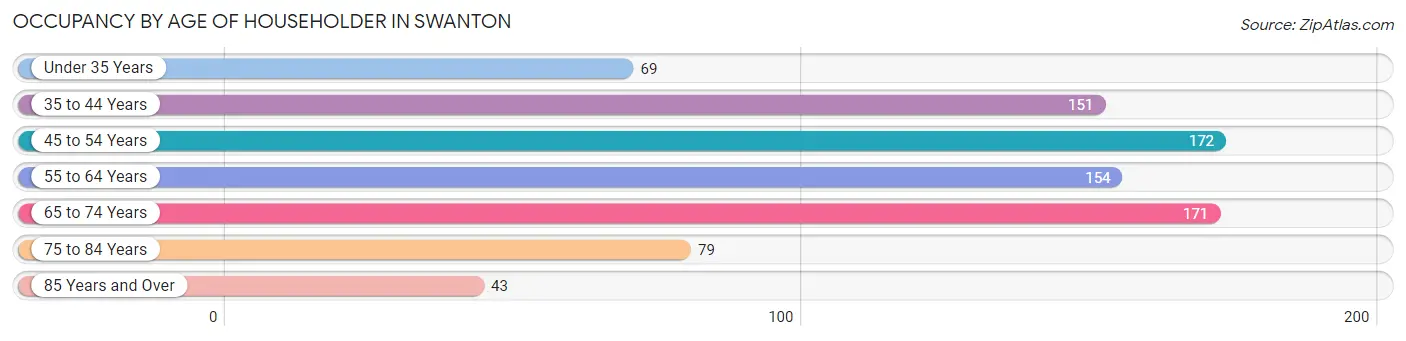
| Age Bracket | # Households | % Households |
| Under 35 Years | 69 | 8.2% |
| 35 to 44 Years | 151 | 18.0% |
| 45 to 54 Years | 172 | 20.5% |
| 55 to 64 Years | 154 | 18.4% |
| 65 to 74 Years | 171 | 20.4% |
| 75 to 84 Years | 79 | 9.4% |
| 85 Years and Over | 43 | 5.1% |
| Total | 839 | 100.0% |
Housing Finances in Swanton
Median Income by Occupancy in Swanton
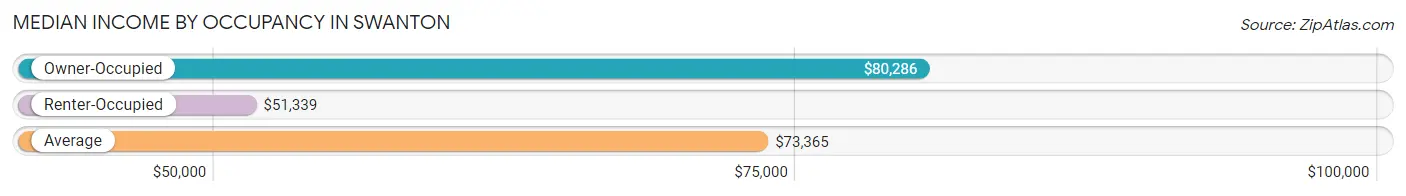
| Occupancy Type | # Households | Median Income |
| Owner-Occupied | 659 (78.5%) | $80,286 |
| Renter-Occupied | 180 (21.4%) | $51,339 |
| Average | 839 (100.0%) | $73,365 |
Occupancy by Householder Income Bracket in Swanton
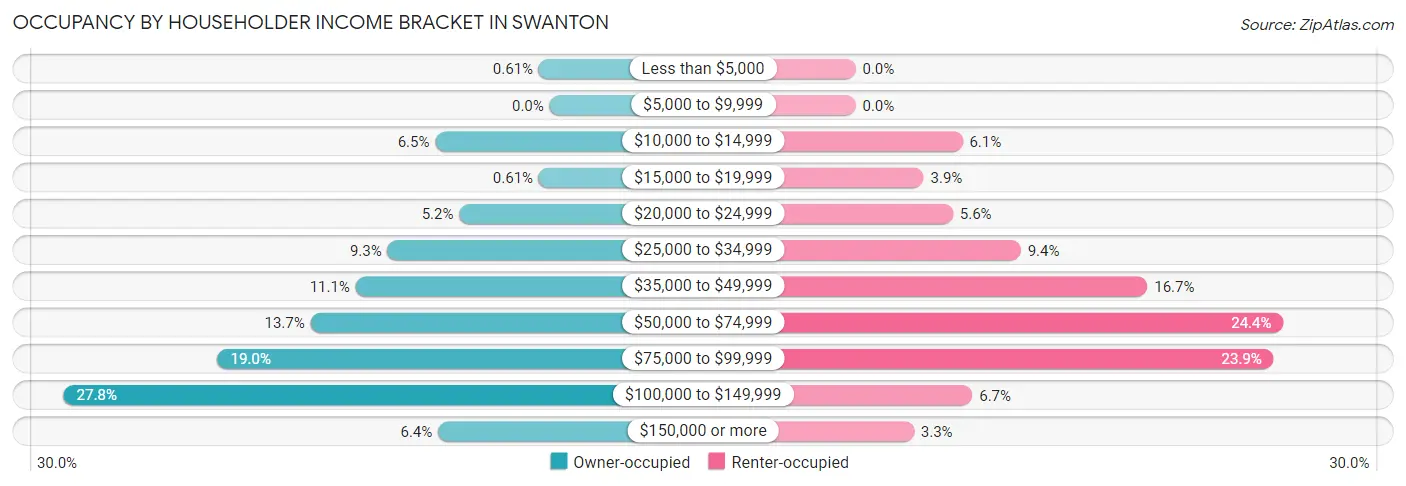
| Income Bracket | Owner-occupied | Renter-occupied |
| Less than $5,000 | 4 (0.6%) | 0 (0.0%) |
| $5,000 to $9,999 | 0 (0.0%) | 0 (0.0%) |
| $10,000 to $14,999 | 43 (6.5%) | 11 (6.1%) |
| $15,000 to $19,999 | 4 (0.6%) | 7 (3.9%) |
| $20,000 to $24,999 | 34 (5.2%) | 10 (5.6%) |
| $25,000 to $34,999 | 61 (9.3%) | 17 (9.4%) |
| $35,000 to $49,999 | 73 (11.1%) | 30 (16.7%) |
| $50,000 to $74,999 | 90 (13.7%) | 44 (24.4%) |
| $75,000 to $99,999 | 125 (19.0%) | 43 (23.9%) |
| $100,000 to $149,999 | 183 (27.8%) | 12 (6.7%) |
| $150,000 or more | 42 (6.4%) | 6 (3.3%) |
| Total | 659 (100.0%) | 180 (100.0%) |
Monthly Housing Cost Tiers in Swanton
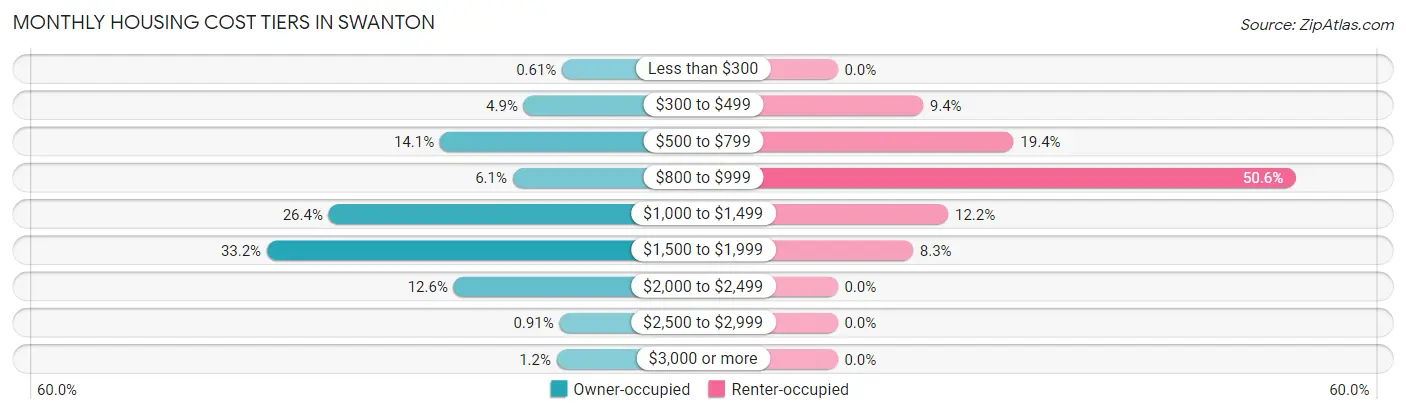
| Monthly Cost | Owner-occupied | Renter-occupied |
| Less than $300 | 4 (0.6%) | 0 (0.0%) |
| $300 to $499 | 32 (4.9%) | 17 (9.4%) |
| $500 to $799 | 93 (14.1%) | 35 (19.4%) |
| $800 to $999 | 40 (6.1%) | 91 (50.6%) |
| $1,000 to $1,499 | 174 (26.4%) | 22 (12.2%) |
| $1,500 to $1,999 | 219 (33.2%) | 15 (8.3%) |
| $2,000 to $2,499 | 83 (12.6%) | 0 (0.0%) |
| $2,500 to $2,999 | 6 (0.9%) | 0 (0.0%) |
| $3,000 or more | 8 (1.2%) | 0 (0.0%) |
| Total | 659 (100.0%) | 180 (100.0%) |
Physical Housing Characteristics in Swanton
Housing Structures in Swanton
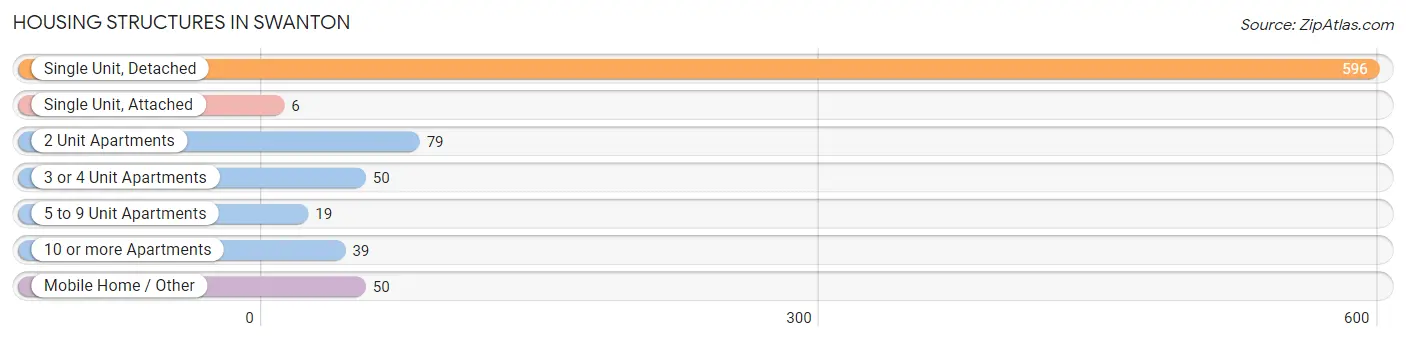
| Structure Type | # Housing Units | % Housing Units |
| Single Unit, Detached | 596 | 71.0% |
| Single Unit, Attached | 6 | 0.7% |
| 2 Unit Apartments | 79 | 9.4% |
| 3 or 4 Unit Apartments | 50 | 6.0% |
| 5 to 9 Unit Apartments | 19 | 2.3% |
| 10 or more Apartments | 39 | 4.6% |
| Mobile Home / Other | 50 | 6.0% |
| Total | 839 | 100.0% |
Housing Structures by Occupancy in Swanton
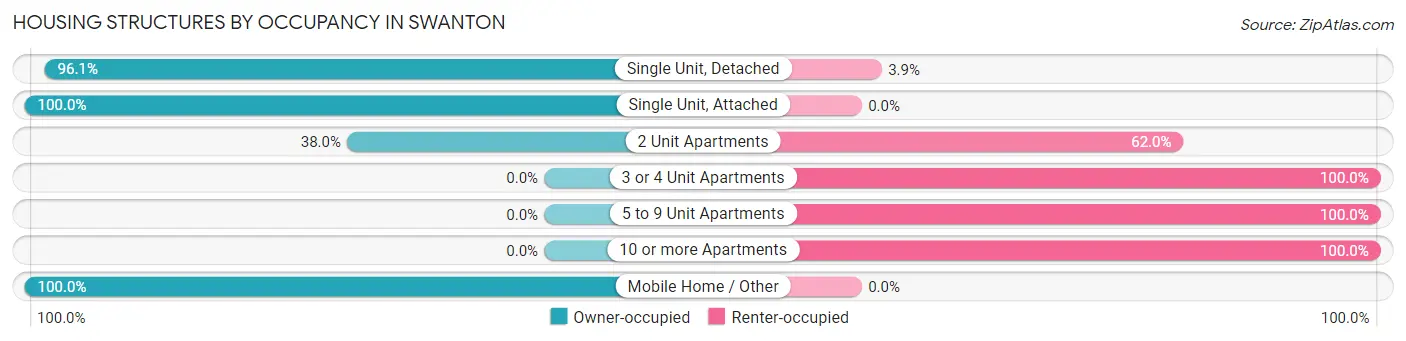
| Structure Type | Owner-occupied | Renter-occupied |
| Single Unit, Detached | 573 (96.1%) | 23 (3.9%) |
| Single Unit, Attached | 6 (100.0%) | 0 (0.0%) |
| 2 Unit Apartments | 30 (38.0%) | 49 (62.0%) |
| 3 or 4 Unit Apartments | 0 (0.0%) | 50 (100.0%) |
| 5 to 9 Unit Apartments | 0 (0.0%) | 19 (100.0%) |
| 10 or more Apartments | 0 (0.0%) | 39 (100.0%) |
| Mobile Home / Other | 50 (100.0%) | 0 (0.0%) |
| Total | 659 (78.5%) | 180 (21.4%) |
Housing Structures by Number of Rooms in Swanton
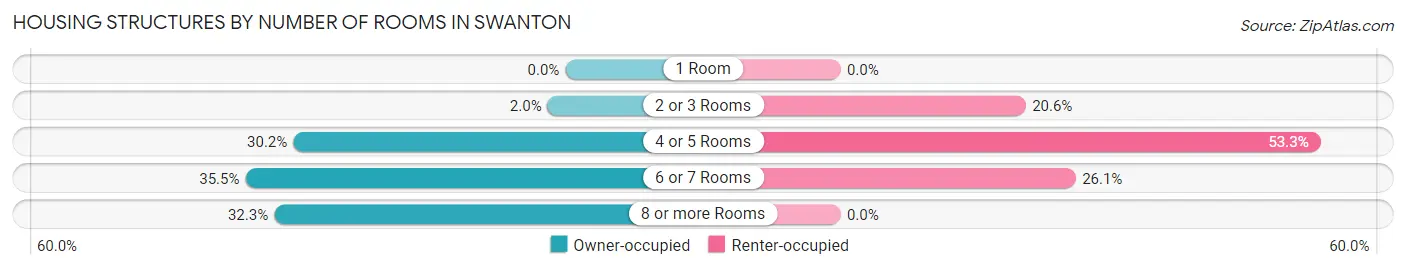
| Number of Rooms | Owner-occupied | Renter-occupied |
| 1 Room | 0 (0.0%) | 0 (0.0%) |
| 2 or 3 Rooms | 13 (2.0%) | 37 (20.6%) |
| 4 or 5 Rooms | 199 (30.2%) | 96 (53.3%) |
| 6 or 7 Rooms | 234 (35.5%) | 47 (26.1%) |
| 8 or more Rooms | 213 (32.3%) | 0 (0.0%) |
| Total | 659 (100.0%) | 180 (100.0%) |
Housing Structure by Heating Type in Swanton
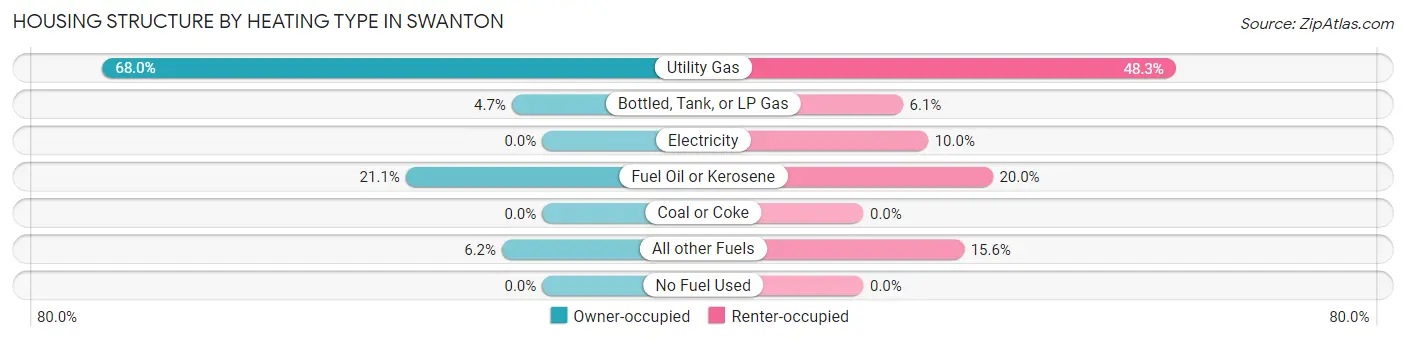
| Heating Type | Owner-occupied | Renter-occupied |
| Utility Gas | 448 (68.0%) | 87 (48.3%) |
| Bottled, Tank, or LP Gas | 31 (4.7%) | 11 (6.1%) |
| Electricity | 0 (0.0%) | 18 (10.0%) |
| Fuel Oil or Kerosene | 139 (21.1%) | 36 (20.0%) |
| Coal or Coke | 0 (0.0%) | 0 (0.0%) |
| All other Fuels | 41 (6.2%) | 28 (15.6%) |
| No Fuel Used | 0 (0.0%) | 0 (0.0%) |
| Total | 659 (100.0%) | 180 (100.0%) |
Household Vehicle Usage in Swanton
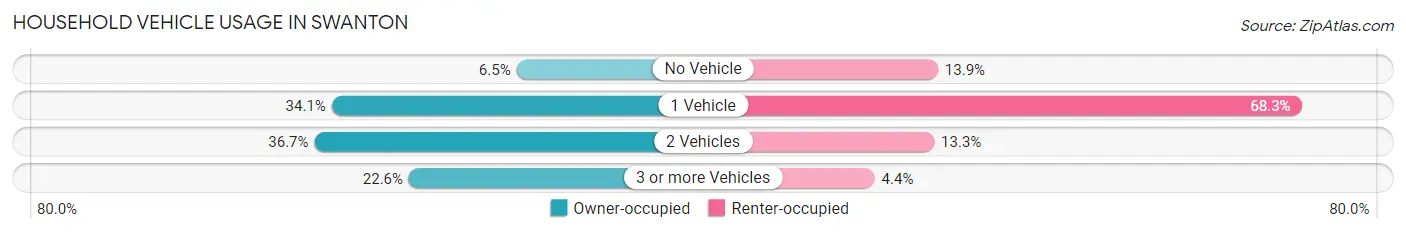
| Vehicles per Household | Owner-occupied | Renter-occupied |
| No Vehicle | 43 (6.5%) | 25 (13.9%) |
| 1 Vehicle | 225 (34.1%) | 123 (68.3%) |
| 2 Vehicles | 242 (36.7%) | 24 (13.3%) |
| 3 or more Vehicles | 149 (22.6%) | 8 (4.4%) |
| Total | 659 (100.0%) | 180 (100.0%) |
Real Estate & Mortgages in Swanton
Real Estate and Mortgage Overview in Swanton
| Characteristic | Without Mortgage | With Mortgage |
| Housing Units | 185 | 474 |
| Median Property Value | $205,900 | $193,500 |
| Median Household Income | $47,625 | $34 |
| Monthly Housing Costs | $674 | $8 |
| Real Estate Taxes | $4,174 | $11 |
Property Value by Mortgage Status in Swanton
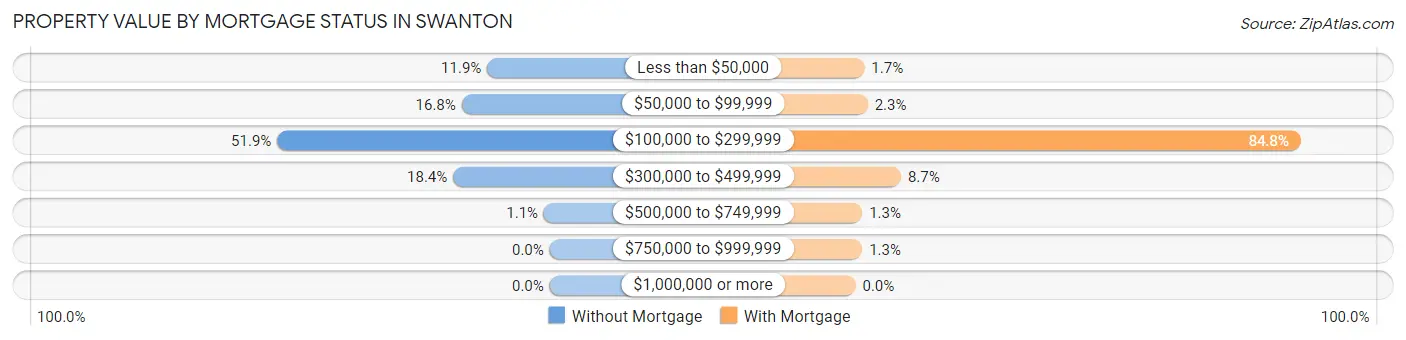
| Property Value | Without Mortgage | With Mortgage |
| Less than $50,000 | 22 (11.9%) | 8 (1.7%) |
| $50,000 to $99,999 | 31 (16.8%) | 11 (2.3%) |
| $100,000 to $299,999 | 96 (51.9%) | 402 (84.8%) |
| $300,000 to $499,999 | 34 (18.4%) | 41 (8.6%) |
| $500,000 to $749,999 | 2 (1.1%) | 6 (1.3%) |
| $750,000 to $999,999 | 0 (0.0%) | 6 (1.3%) |
| $1,000,000 or more | 0 (0.0%) | 0 (0.0%) |
| Total | 185 (100.0%) | 474 (100.0%) |
Household Income by Mortgage Status in Swanton
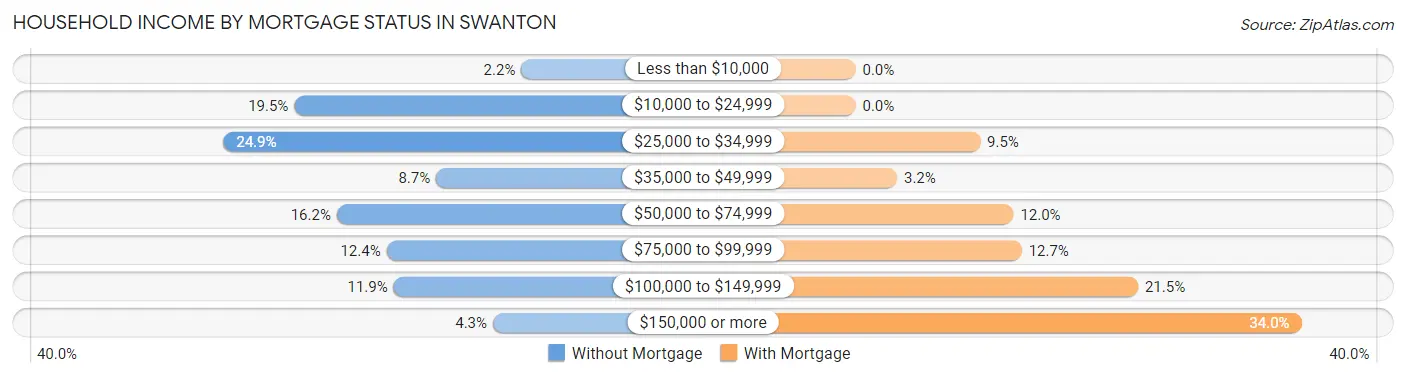
| Household Income | Without Mortgage | With Mortgage |
| Less than $10,000 | 4 (2.2%) | 0 (0.0%) |
| $10,000 to $24,999 | 36 (19.5%) | 0 (0.0%) |
| $25,000 to $34,999 | 46 (24.9%) | 45 (9.5%) |
| $35,000 to $49,999 | 16 (8.6%) | 15 (3.2%) |
| $50,000 to $74,999 | 30 (16.2%) | 57 (12.0%) |
| $75,000 to $99,999 | 23 (12.4%) | 60 (12.7%) |
| $100,000 to $149,999 | 22 (11.9%) | 102 (21.5%) |
| $150,000 or more | 8 (4.3%) | 161 (34.0%) |
| Total | 185 (100.0%) | 474 (100.0%) |
Property Value to Household Income Ratio in Swanton
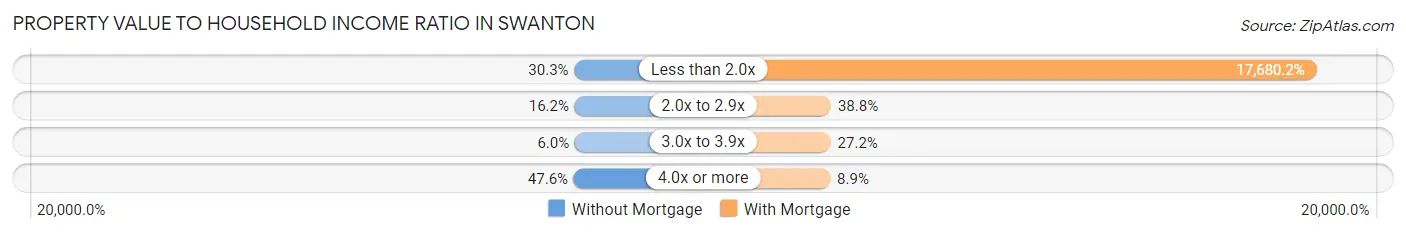
| Value-to-Income Ratio | Without Mortgage | With Mortgage |
| Less than 2.0x | 56 (30.3%) | 83,804 (17,680.2%) |
| 2.0x to 2.9x | 30 (16.2%) | 184 (38.8%) |
| 3.0x to 3.9x | 11 (5.9%) | 129 (27.2%) |
| 4.0x or more | 88 (47.6%) | 42 (8.9%) |
| Total | 185 (100.0%) | 474 (100.0%) |
Real Estate Taxes by Mortgage Status in Swanton
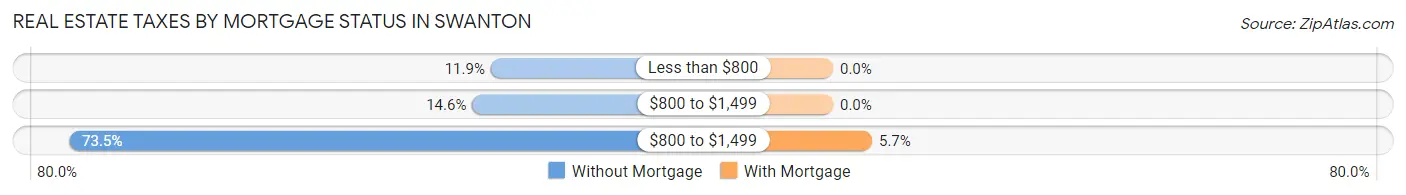
| Property Taxes | Without Mortgage | With Mortgage |
| Less than $800 | 22 (11.9%) | 0 (0.0%) |
| $800 to $1,499 | 27 (14.6%) | 0 (0.0%) |
| $800 to $1,499 | 136 (73.5%) | 27 (5.7%) |
| Total | 185 (100.0%) | 474 (100.0%) |
Health & Disability in Swanton
Health Insurance Coverage by Age in Swanton
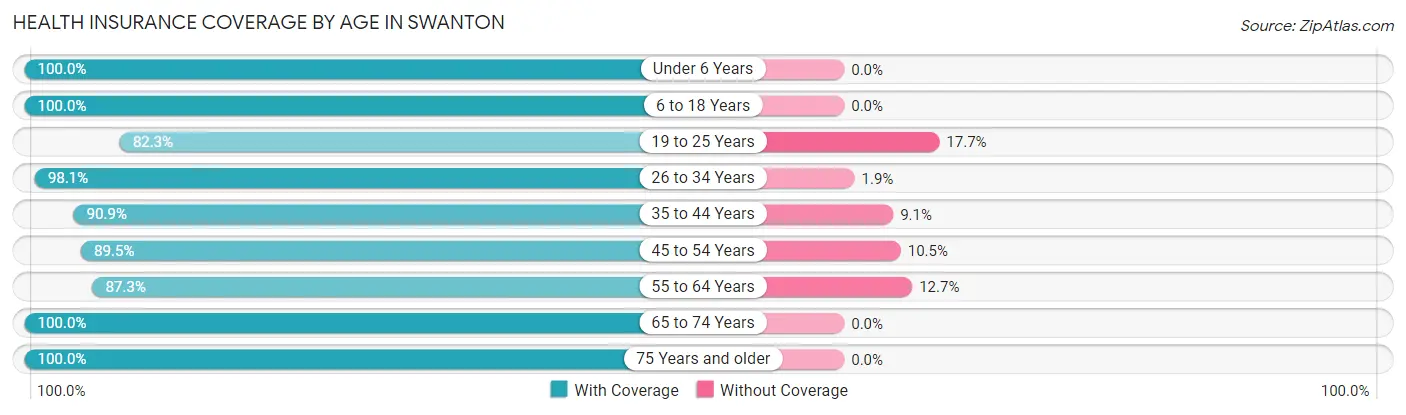
| Age Bracket | With Coverage | Without Coverage |
| Under 6 Years | 81 (100.0%) | 0 (0.0%) |
| 6 to 18 Years | 547 (100.0%) | 0 (0.0%) |
| 19 to 25 Years | 51 (82.3%) | 11 (17.7%) |
| 26 to 34 Years | 153 (98.1%) | 3 (1.9%) |
| 35 to 44 Years | 448 (90.9%) | 45 (9.1%) |
| 45 to 54 Years | 280 (89.5%) | 33 (10.5%) |
| 55 to 64 Years | 262 (87.3%) | 38 (12.7%) |
| 65 to 74 Years | 273 (100.0%) | 0 (0.0%) |
| 75 Years and older | 187 (100.0%) | 0 (0.0%) |
| Total | 2,282 (94.6%) | 130 (5.4%) |
Health Insurance Coverage by Citizenship Status in Swanton
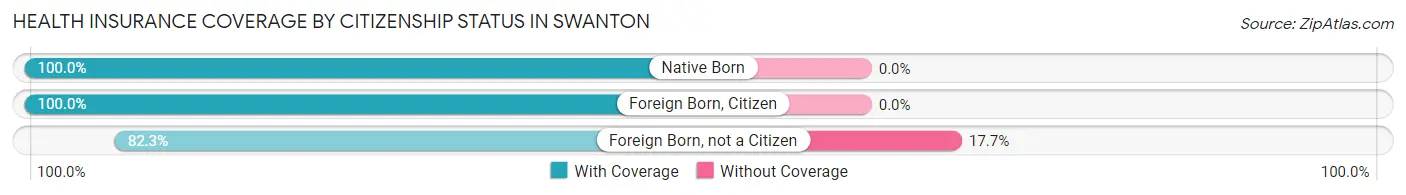
| Citizenship Status | With Coverage | Without Coverage |
| Native Born | 81 (100.0%) | 0 (0.0%) |
| Foreign Born, Citizen | 547 (100.0%) | 0 (0.0%) |
| Foreign Born, not a Citizen | 51 (82.3%) | 11 (17.7%) |
Health Insurance Coverage by Household Income in Swanton
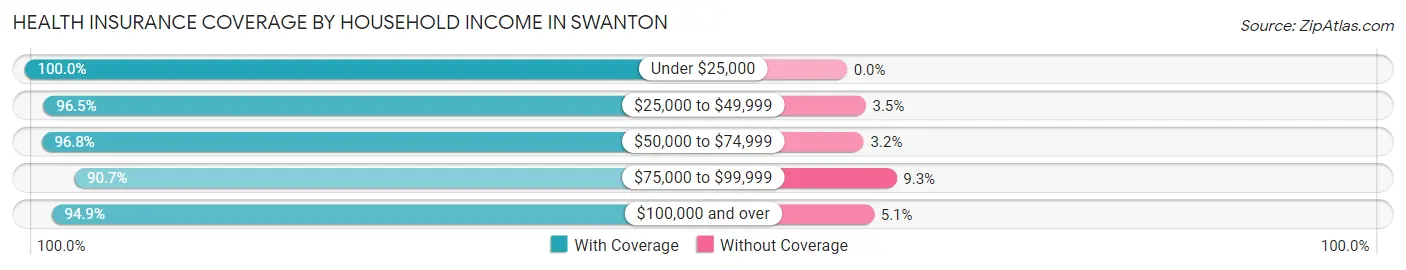
| Household Income | With Coverage | Without Coverage |
| Under $25,000 | 190 (100.0%) | 0 (0.0%) |
| $25,000 to $49,999 | 385 (96.5%) | 14 (3.5%) |
| $50,000 to $74,999 | 245 (96.8%) | 8 (3.2%) |
| $75,000 to $99,999 | 616 (90.7%) | 63 (9.3%) |
| $100,000 and over | 845 (94.9%) | 45 (5.1%) |
Public vs Private Health Insurance Coverage by Age in Swanton
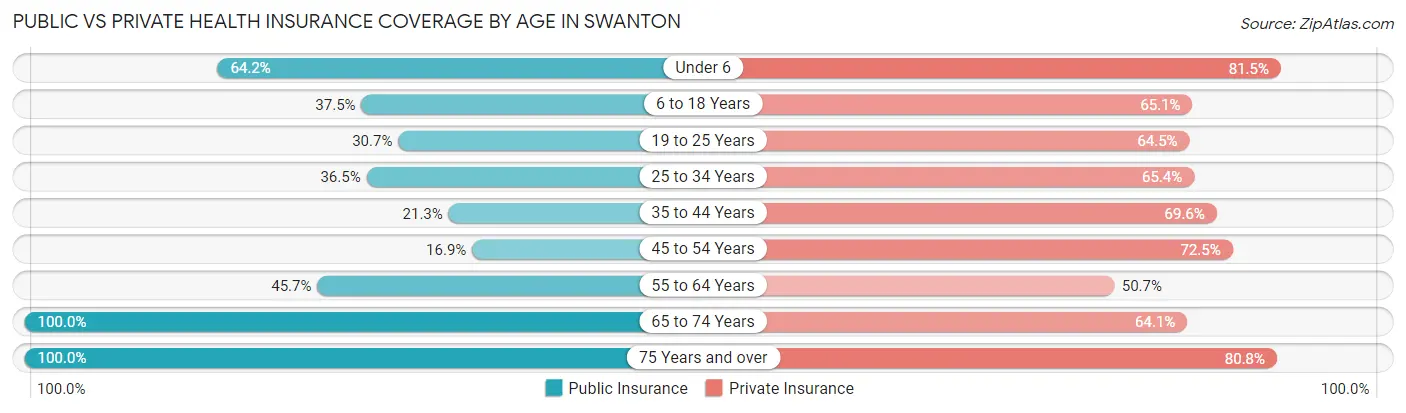
| Age Bracket | Public Insurance | Private Insurance |
| Under 6 | 52 (64.2%) | 66 (81.5%) |
| 6 to 18 Years | 205 (37.5%) | 356 (65.1%) |
| 19 to 25 Years | 19 (30.6%) | 40 (64.5%) |
| 25 to 34 Years | 57 (36.5%) | 102 (65.4%) |
| 35 to 44 Years | 105 (21.3%) | 343 (69.6%) |
| 45 to 54 Years | 53 (16.9%) | 227 (72.5%) |
| 55 to 64 Years | 137 (45.7%) | 152 (50.7%) |
| 65 to 74 Years | 273 (100.0%) | 175 (64.1%) |
| 75 Years and over | 187 (100.0%) | 151 (80.7%) |
| Total | 1,088 (45.1%) | 1,612 (66.8%) |
Disability Status by Sex by Age in Swanton
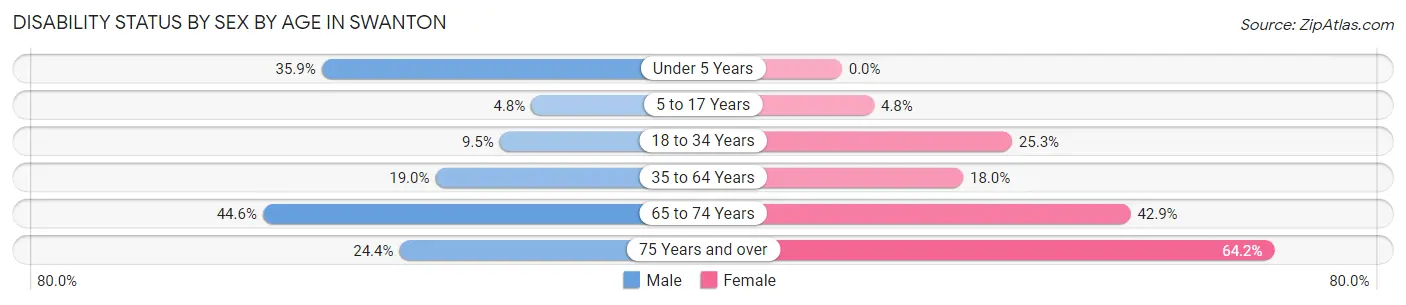
| Age Bracket | Male | Female |
| Under 5 Years | 14 (35.9%) | 0 (0.0%) |
| 5 to 17 Years | 14 (4.8%) | 9 (4.8%) |
| 18 to 34 Years | 18 (9.5%) | 24 (25.3%) |
| 35 to 64 Years | 111 (19.0%) | 94 (18.0%) |
| 65 to 74 Years | 50 (44.6%) | 69 (42.9%) |
| 75 Years and over | 19 (24.4%) | 70 (64.2%) |
Disability Class by Sex by Age in Swanton
Disability Class: Hearing Difficulty
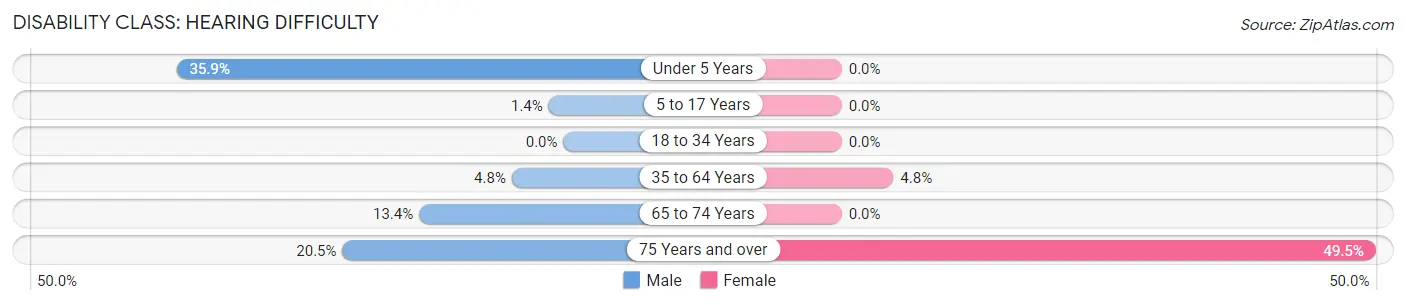
| Age Bracket | Male | Female |
| Under 5 Years | 14 (35.9%) | 0 (0.0%) |
| 5 to 17 Years | 4 (1.4%) | 0 (0.0%) |
| 18 to 34 Years | 0 (0.0%) | 0 (0.0%) |
| 35 to 64 Years | 28 (4.8%) | 25 (4.8%) |
| 65 to 74 Years | 15 (13.4%) | 0 (0.0%) |
| 75 Years and over | 16 (20.5%) | 54 (49.5%) |
Disability Class: Vision Difficulty
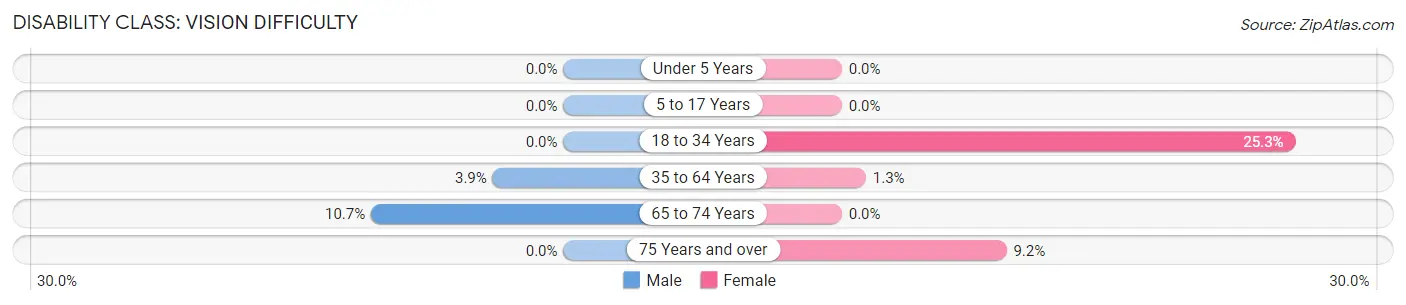
| Age Bracket | Male | Female |
| Under 5 Years | 0 (0.0%) | 0 (0.0%) |
| 5 to 17 Years | 0 (0.0%) | 0 (0.0%) |
| 18 to 34 Years | 0 (0.0%) | 24 (25.3%) |
| 35 to 64 Years | 23 (3.9%) | 7 (1.3%) |
| 65 to 74 Years | 12 (10.7%) | 0 (0.0%) |
| 75 Years and over | 0 (0.0%) | 10 (9.2%) |
Disability Class: Cognitive Difficulty
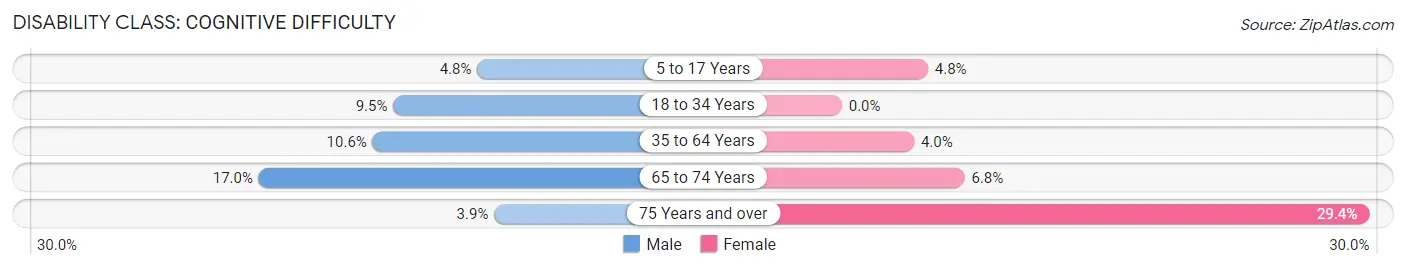
| Age Bracket | Male | Female |
| 5 to 17 Years | 14 (4.8%) | 9 (4.8%) |
| 18 to 34 Years | 18 (9.5%) | 0 (0.0%) |
| 35 to 64 Years | 62 (10.6%) | 21 (4.0%) |
| 65 to 74 Years | 19 (17.0%) | 11 (6.8%) |
| 75 Years and over | 3 (3.8%) | 32 (29.4%) |
Disability Class: Ambulatory Difficulty
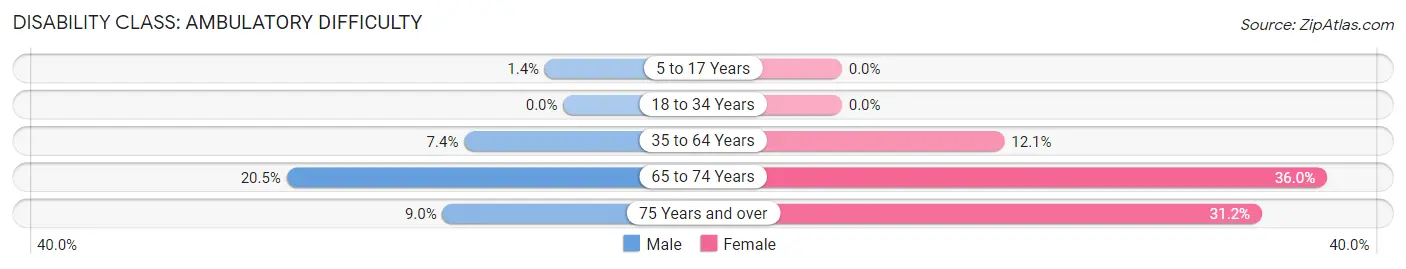
| Age Bracket | Male | Female |
| 5 to 17 Years | 4 (1.4%) | 0 (0.0%) |
| 18 to 34 Years | 0 (0.0%) | 0 (0.0%) |
| 35 to 64 Years | 43 (7.4%) | 63 (12.1%) |
| 65 to 74 Years | 23 (20.5%) | 58 (36.0%) |
| 75 Years and over | 7 (9.0%) | 34 (31.2%) |
Disability Class: Self-Care Difficulty
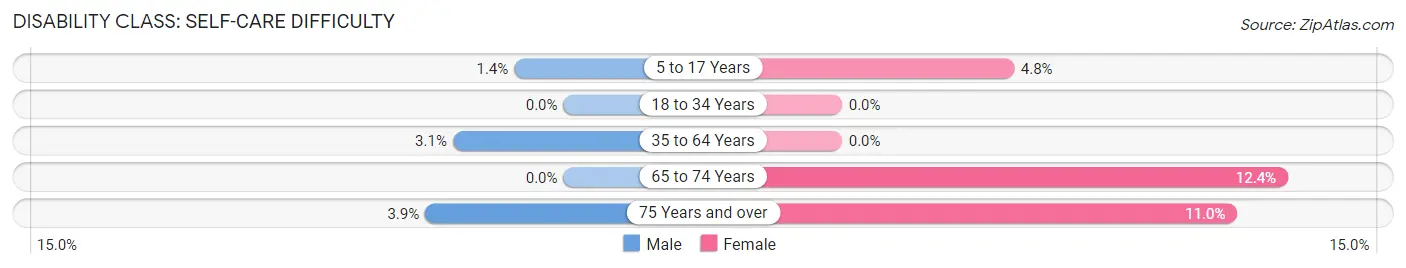
| Age Bracket | Male | Female |
| 5 to 17 Years | 4 (1.4%) | 9 (4.8%) |
| 18 to 34 Years | 0 (0.0%) | 0 (0.0%) |
| 35 to 64 Years | 18 (3.1%) | 0 (0.0%) |
| 65 to 74 Years | 0 (0.0%) | 20 (12.4%) |
| 75 Years and over | 3 (3.8%) | 12 (11.0%) |
Technology Access in Swanton
Computing Device Access in Swanton
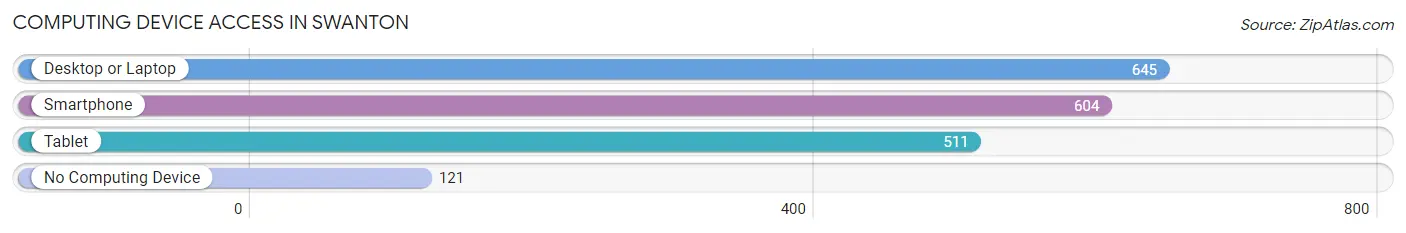
| Device Type | # Households | % Households |
| Desktop or Laptop | 645 | 76.9% |
| Smartphone | 604 | 72.0% |
| Tablet | 511 | 60.9% |
| No Computing Device | 121 | 14.4% |
| Total | 839 | 100.0% |
Internet Access in Swanton
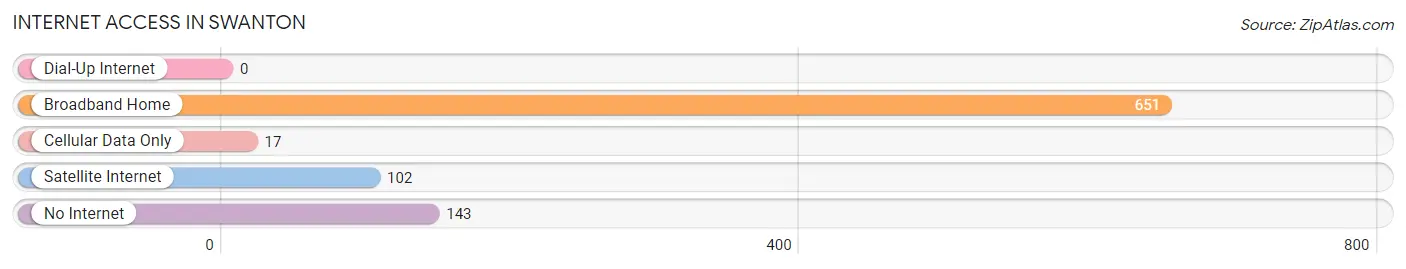
| Internet Type | # Households | % Households |
| Dial-Up Internet | 0 | 0.0% |
| Broadband Home | 651 | 77.6% |
| Cellular Data Only | 17 | 2.0% |
| Satellite Internet | 102 | 12.2% |
| No Internet | 143 | 17.0% |
| Total | 839 | 100.0% |
Swanton Summary
Swanton is a town located in Franklin County, Vermont, United States. The population was 5,902 at the 2010 census. It is the largest town in Franklin County and is located on the western shore of Lake Champlain.
History
Swanton was first settled in 1783 by a group of settlers from Connecticut. The town was named after Colonel Benjamin Swanton, a Revolutionary War veteran who was granted the land by the state of Vermont. The town was officially incorporated in 1798.
In the early 19th century, Swanton was a thriving agricultural community. The town was home to several mills, including a sawmill, gristmill, and a woolen mill. The town also had a thriving lumber industry, with several sawmills located along the Missisquoi River.
In the late 19th century, Swanton began to experience a period of industrialization. The town was home to several factories, including a paper mill, a shoe factory, and a brickyard. The town also had a thriving tourism industry, with several hotels and resorts located along the lake.
Geography
Swanton is located in the northwest corner of Franklin County, on the western shore of Lake Champlain. The town is bordered to the north by the town of Highgate, to the east by the town of St. Albans, to the south by the town of Georgia, and to the west by the town of Alburgh.
The Missisquoi River flows through the town, and the town is home to several lakes, including Lake Champlain, Lake Carmi, and Lake Iroquois. The town is located in the Green Mountains, and is home to several mountains, including Mount Mansfield, the highest peak in Vermont.
Economy
Swanton is a rural town with a diverse economy. The town is home to several small businesses, including restaurants, retail stores, and service providers. The town is also home to several manufacturing companies, including a paper mill, a shoe factory, and a brickyard.
The town is also home to several tourist attractions, including the Missisquoi National Wildlife Refuge, the Lake Champlain Maritime Museum, and the Swanton Historical Society. The town is also home to several recreational activities, including fishing, boating, and hiking.
Demographics
As of the 2010 census, there were 5,902 people, 2,521 households, and 1,619 families residing in the town. The population density was 97.3 people per square mile (37.6/km2). There were 2,817 housing units at an average density of 46.7 per square mile (18.0/km2). The racial makeup of the town was 97.2% White, 0.5% African American, 0.3% Native American, 0.4% Asian, 0.1% Pacific Islander, 0.3% from other races, and 1.2% from two or more races. Hispanic or Latino of any race were 1.2% of the population.
There were 2,521 households, out of which 28.2% had children under the age of 18 living with them, 49.2% were married couples living together, 11.2% had a female householder with no husband present, and 34.7% were non-families. 28.7% of all households were made up of individuals, and 12.2% had someone living alone who was 65 years of age or older. The average household size was 2.35 and the average family size was 2.86.
In the town, the population was spread out, with 23.2% under the age of 18, 7.2% from 18 to 24, 28.2% from 25 to 44, 25.2% from 45 to 64, and 16.2% who were 65 years of age or older. The median age was 40 years. For every 100 females, there were 94.2 males. For every 100 females age 18 and over, there were 91.2 males.
The median income for a household in the town was $41,944, and the median income for a family was $50,938. Males had a median income of $36,944 versus $25,938 for females. The per capita income for the town was $20,938. About 6.2% of families and 8.7% of the population were below the poverty line, including 10.2% of those under age 18 and 8.2% of those age 65 or over.
Common Questions
What is the Total Population of Swanton?
Total Population of Swanton is 2,428.
What is the Total Male Population of Swanton?
Total Male Population of Swanton is 1,295.
What is the Total Female Population of Swanton?
Total Female Population of Swanton is 1,133.
What is the Ratio of Males per 100 Females in Swanton?
There are 114.30 Males per 100 Females in Swanton.
What is the Ratio of Females per 100 Males in Swanton?
There are 87.49 Females per 100 Males in Swanton.
What is the Median Population Age in Swanton?
Median Population Age in Swanton is 41.0 Years.
What is the Average Family Size in Swanton
Average Family Size in Swanton is 3.5 People.
What is the Average Household Size in Swanton
Average Household Size in Swanton is 2.9 People.
What is Per Capita Income in Swanton?
Per Capita income in Swanton is $28,560.
What is the Median Family Income in Swanton?
Median Family Income in Swanton is $80,286.
What is the Median Household income in Swanton?
Median Household Income in Swanton is $73,365.
What is Income or Wage Gap in Swanton?
Income or Wage Gap in Swanton is 37.7%.
Women in Swanton earn 62.3 cents for every dollar earned by a man.
What is Inequality or Gini Index in Swanton?
Inequality or Gini Index in Swanton is 0.33.
How Large is the Labor Force in Swanton?
There are 1,159 People in the Labor Forcein in Swanton.
What is the Percentage of People in the Labor Force in Swanton?
58.5% of People are in the Labor Force in Swanton.
What is the Unemployment Rate in Swanton?
Unemployment Rate in Swanton is 8.2%.