Randolph, VT
Randolph Map
Randolph Overview
2,010
TOTAL POPULATION
1,041
MALE POPULATION
969
FEMALE POPULATION
107.43
MALES / 100 FEMALES
93.08
FEMALES / 100 MALES
49.4
MEDIAN AGE
2.7
AVG FAMILY SIZE
2.0
AVG HOUSEHOLD SIZE
$31,940
PER CAPITA INCOME
$72,331
AVG FAMILY INCOME
$58,333
AVG HOUSEHOLD INCOME
13.3%
WAGE / INCOME GAP [ % ]
86.7¢/ $1
WAGE / INCOME GAP [ $ ]
0.37
INEQUALITY / GINI INDEX
1,197
LABOR FORCE [ PEOPLE ]
66.0%
PERCENT IN LABOR FORCE
7.7%
UNEMPLOYMENT RATE
Randolph Zip Codes
Randolph Area Codes
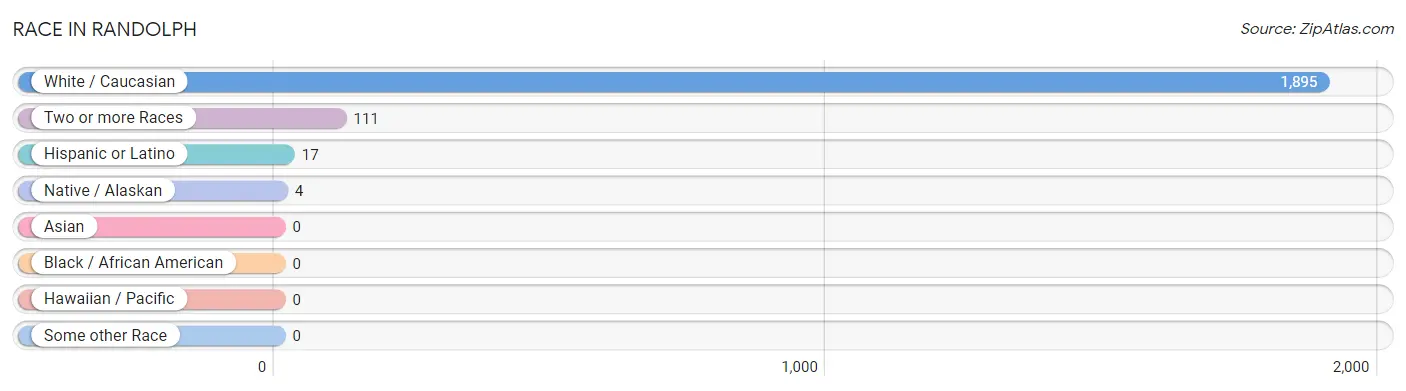
Race in Randolph
The most populous races in Randolph are White / Caucasian (1,895 | 94.3%), Two or more Races (111 | 5.5%), and Hispanic or Latino (17 | 0.9%).
| Race | # Population | % Population |
| Asian | 0 | 0.0% |
| Black / African American | 0 | 0.0% |
| Hawaiian / Pacific | 0 | 0.0% |
| Hispanic or Latino | 17 | 0.9% |
| Native / Alaskan | 4 | 0.2% |
| White / Caucasian | 1,895 | 94.3% |
| Two or more Races | 111 | 5.5% |
| Some other Race | 0 | 0.0% |
| Total | 2,010 | 100.0% |
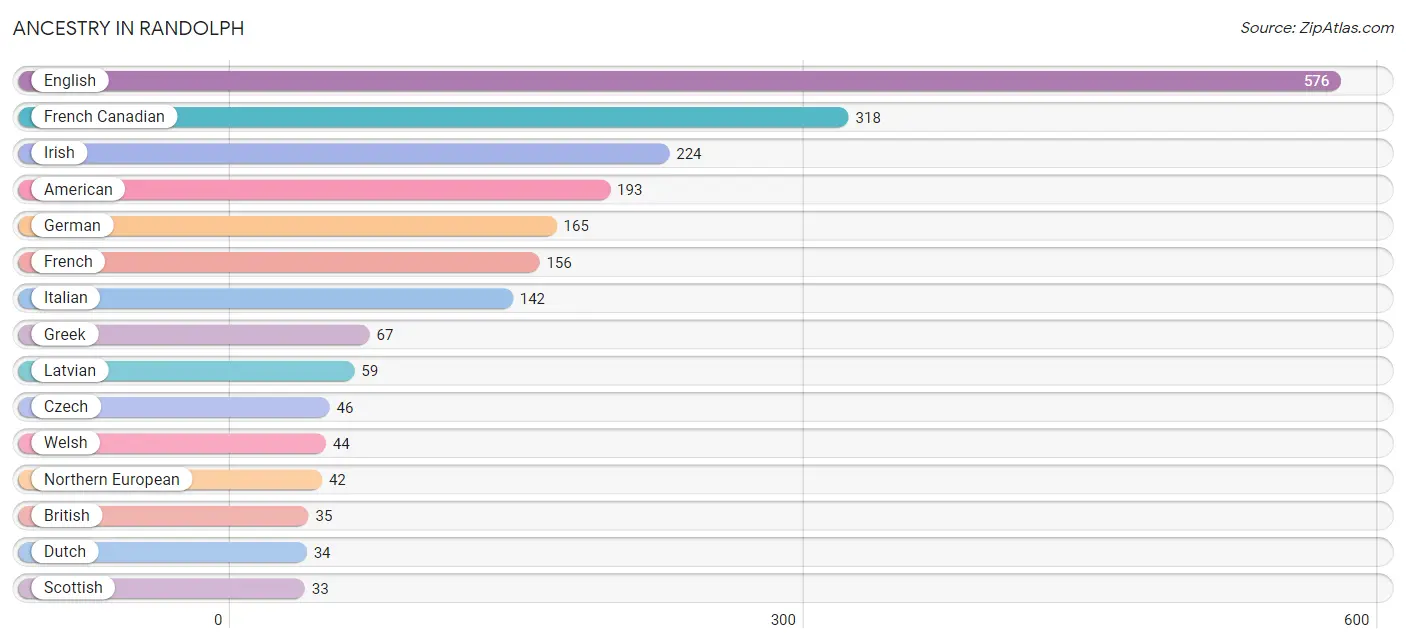
Ancestry in Randolph
The most populous ancestries reported in Randolph are English (576 | 28.7%), French Canadian (318 | 15.8%), Irish (224 | 11.1%), American (193 | 9.6%), and German (165 | 8.2%), together accounting for 73.4% of all Randolph residents.
| Ancestry | # Population | % Population |
| American | 193 | 9.6% |
| Austrian | 28 | 1.4% |
| British | 35 | 1.7% |
| Czech | 46 | 2.3% |
| Dutch | 34 | 1.7% |
| English | 576 | 28.7% |
| European | 15 | 0.7% |
| French | 156 | 7.8% |
| French Canadian | 318 | 15.8% |
| German | 165 | 8.2% |
| Greek | 67 | 3.3% |
| Irish | 224 | 11.1% |
| Italian | 142 | 7.1% |
| Latvian | 59 | 2.9% |
| Mexican | 4 | 0.2% |
| Northern European | 42 | 2.1% |
| Polish | 26 | 1.3% |
| Puerto Rican | 13 | 0.6% |
| Russian | 12 | 0.6% |
| Scotch-Irish | 10 | 0.5% |
| Scottish | 33 | 1.6% |
| Swedish | 22 | 1.1% |
| Swiss | 10 | 0.5% |
| Welsh | 44 | 2.2% | View All 24 Rows |
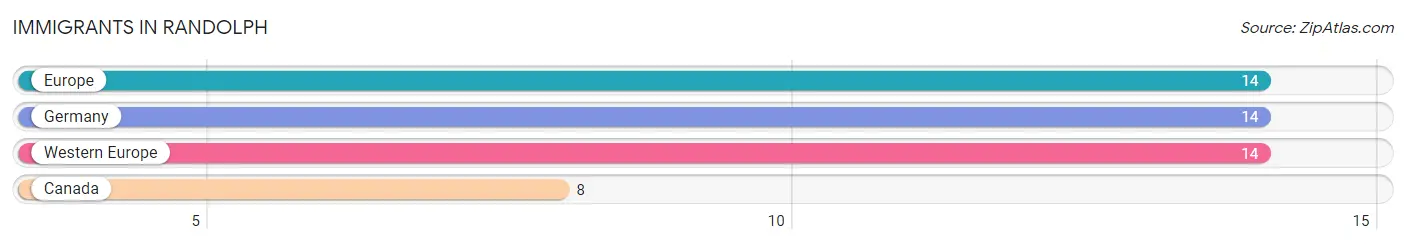
Immigrants in Randolph
The most numerous immigrant groups reported in Randolph came from Europe (14 | 0.7%), Germany (14 | 0.7%), Western Europe (14 | 0.7%), and Canada (8 | 0.4%), together accounting for 2.5% of all Randolph residents.
| Immigration Origin | # Population | % Population |
| Canada | 8 | 0.4% |
| Europe | 14 | 0.7% |
| Germany | 14 | 0.7% |
| Western Europe | 14 | 0.7% | View All 4 Rows |
Sex and Age in Randolph
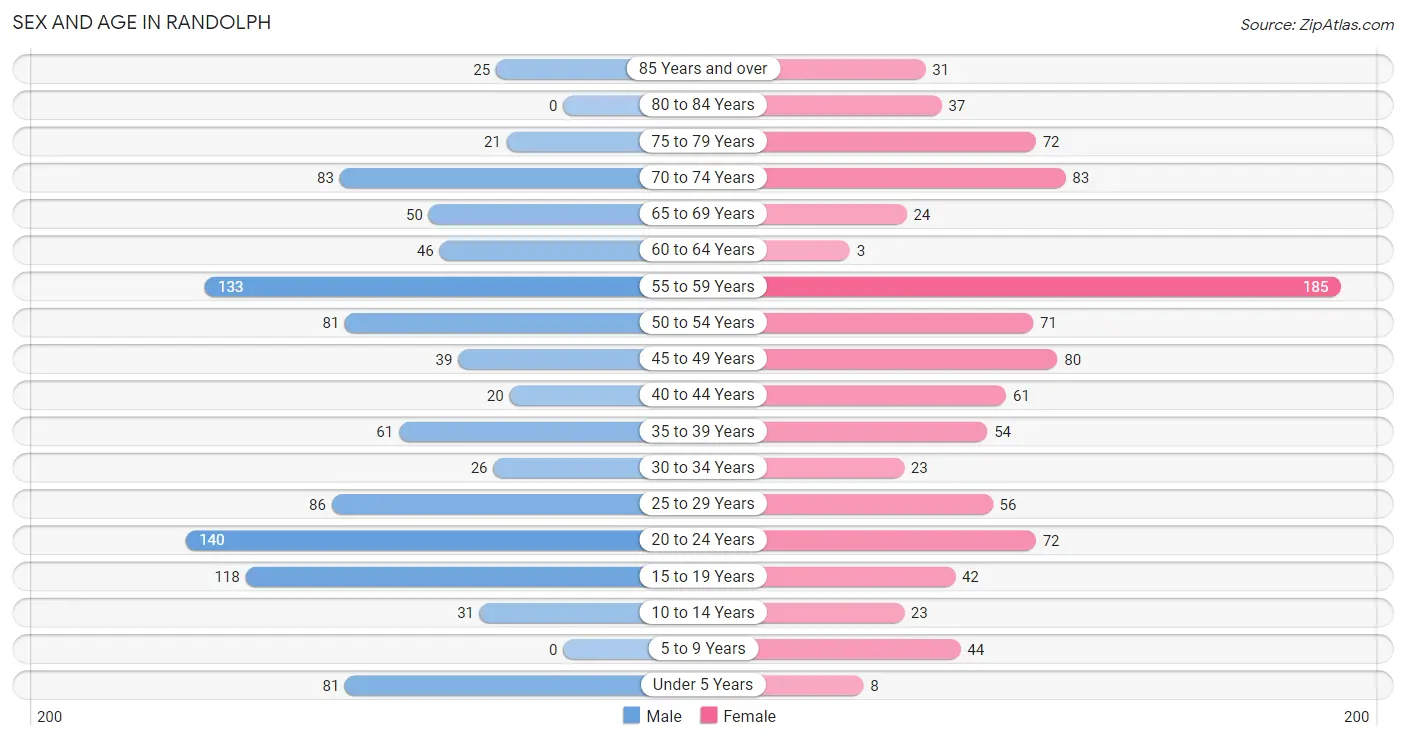
Sex and Age in Randolph
The most populous age groups in Randolph are 20 to 24 Years (140 | 13.5%) for men and 55 to 59 Years (185 | 19.1%) for women.
| Age Bracket | Male | Female |
| Under 5 Years | 81 (7.8%) | 8 (0.8%) |
| 5 to 9 Years | 0 (0.0%) | 44 (4.5%) |
| 10 to 14 Years | 31 (3.0%) | 23 (2.4%) |
| 15 to 19 Years | 118 (11.3%) | 42 (4.3%) |
| 20 to 24 Years | 140 (13.5%) | 72 (7.4%) |
| 25 to 29 Years | 86 (8.3%) | 56 (5.8%) |
| 30 to 34 Years | 26 (2.5%) | 23 (2.4%) |
| 35 to 39 Years | 61 (5.9%) | 54 (5.6%) |
| 40 to 44 Years | 20 (1.9%) | 61 (6.3%) |
| 45 to 49 Years | 39 (3.7%) | 80 (8.3%) |
| 50 to 54 Years | 81 (7.8%) | 71 (7.3%) |
| 55 to 59 Years | 133 (12.8%) | 185 (19.1%) |
| 60 to 64 Years | 46 (4.4%) | 3 (0.3%) |
| 65 to 69 Years | 50 (4.8%) | 24 (2.5%) |
| 70 to 74 Years | 83 (8.0%) | 83 (8.6%) |
| 75 to 79 Years | 21 (2.0%) | 72 (7.4%) |
| 80 to 84 Years | 0 (0.0%) | 37 (3.8%) |
| 85 Years and over | 25 (2.4%) | 31 (3.2%) |
| Total | 1,041 (100.0%) | 969 (100.0%) |
Families and Households in Randolph
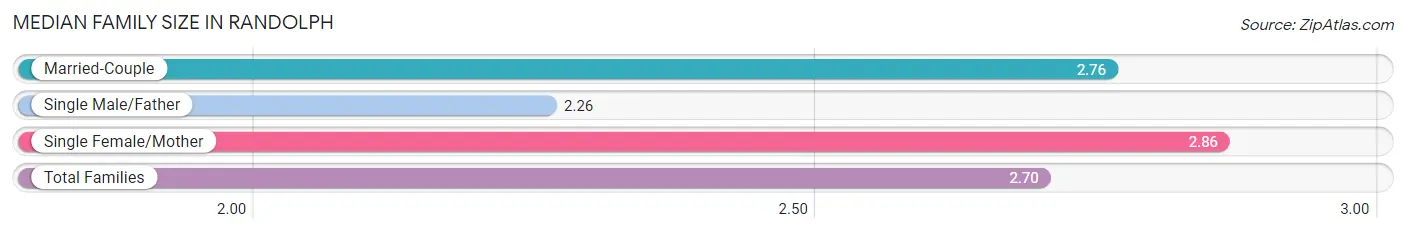
Median Family Size in Randolph
The median family size in Randolph is 2.70 persons per family, with single female/mother families (91 | 16.4%) accounting for the largest median family size of 2.86 persons per family. On the other hand, single male/father families (90 | 16.3%) represent the smallest median family size with 2.26 persons per family.
| Family Type | # Families | Family Size |
| Married-Couple | 373 (67.3%) | 2.76 |
| Single Male/Father | 90 (16.3%) | 2.26 |
| Single Female/Mother | 91 (16.4%) | 2.86 |
| Total Families | 554 (100.0%) | 2.70 |
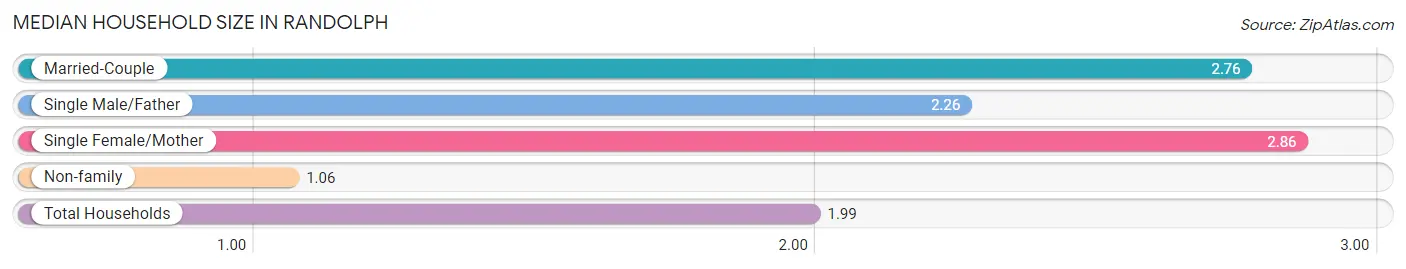
Median Household Size in Randolph
The median household size in Randolph is 1.99 persons per household, with single female/mother households (91 | 9.3%) accounting for the largest median household size of 2.86 persons per household. non-family households (420 | 43.1%) represent the smallest median household size with 1.06 persons per household.
| Household Type | # Households | Household Size |
| Married-Couple | 373 (38.3%) | 2.76 |
| Single Male/Father | 90 (9.2%) | 2.26 |
| Single Female/Mother | 91 (9.3%) | 2.86 |
| Non-family | 420 (43.1%) | 1.06 |
| Total Households | 974 (100.0%) | 1.99 |
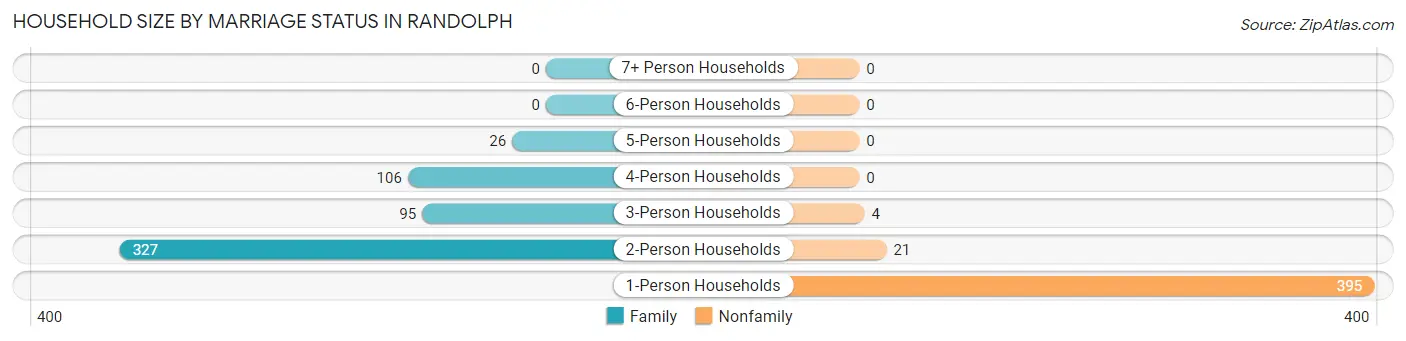
Household Size by Marriage Status in Randolph
Out of a total of 974 households in Randolph, 554 (56.9%) are family households, while 420 (43.1%) are nonfamily households. The most numerous type of family households are 2-person households, comprising 327, and the most common type of nonfamily households are 1-person households, comprising 395.
| Household Size | Family Households | Nonfamily Households |
| 1-Person Households | - | 395 (40.6%) |
| 2-Person Households | 327 (33.6%) | 21 (2.2%) |
| 3-Person Households | 95 (9.8%) | 4 (0.4%) |
| 4-Person Households | 106 (10.9%) | 0 (0.0%) |
| 5-Person Households | 26 (2.7%) | 0 (0.0%) |
| 6-Person Households | 0 (0.0%) | 0 (0.0%) |
| 7+ Person Households | 0 (0.0%) | 0 (0.0%) |
| Total | 554 (56.9%) | 420 (43.1%) |
Female Fertility in Randolph
Fertility by Age in Randolph
Average fertility rate in Randolph is 40.0 births per 1,000 women. Women in the age bracket of 20 to 34 years have the highest fertility rate with 66.0 births per 1,000 women. Women in the age bracket of 20 to 34 years acount for 58.8% of all women with births.
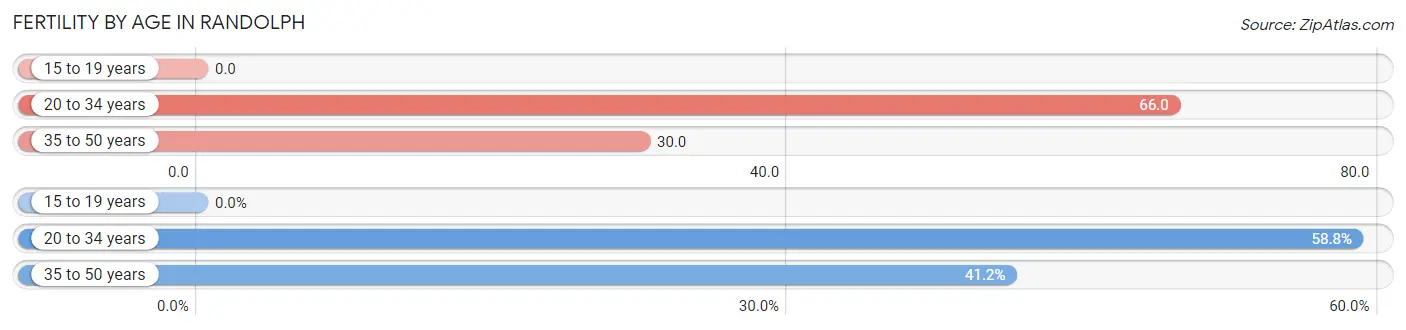
| Age Bracket | Women with Births | Births / 1,000 Women |
| 15 to 19 years | 0 (0.0%) | 0.0 |
| 20 to 34 years | 10 (58.8%) | 66.0 |
| 35 to 50 years | 7 (41.2%) | 30.0 |
| Total | 17 (100.0%) | 40.0 |
Fertility by Age by Marriage Status in Randolph
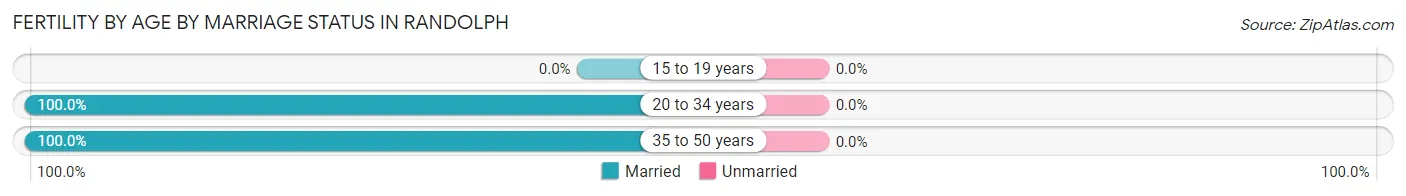
| Age Bracket | Married | Unmarried |
| 15 to 19 years | 0 (0.0%) | 0 (0.0%) |
| 20 to 34 years | 10 (100.0%) | 0 (0.0%) |
| 35 to 50 years | 7 (100.0%) | 0 (0.0%) |
| Total | 17 (100.0%) | 0 (0.0%) |
Fertility by Education in Randolph
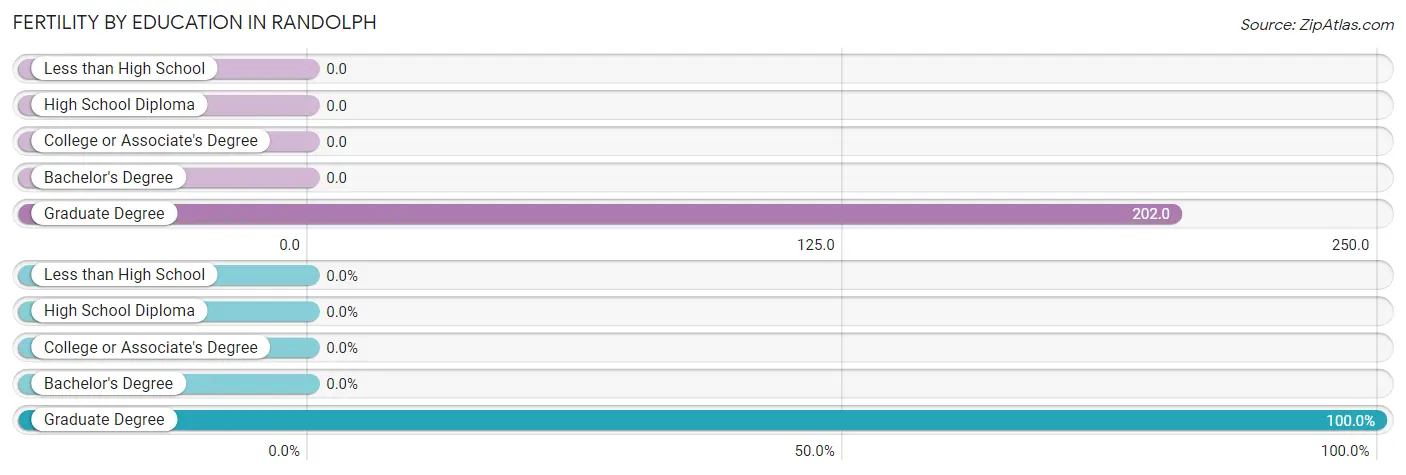
| Educational Attainment | Women with Births | Births / 1,000 Women |
| Less than High School | 0 (0.0%) | 0.0 |
| High School Diploma | 0 (0.0%) | 0.0 |
| College or Associate's Degree | 0 (0.0%) | 0.0 |
| Bachelor's Degree | 0 (0.0%) | 0.0 |
| Graduate Degree | 17 (100.0%) | 202.0 |
| Total | 17 (100.0%) | 40.0 |
Fertility by Education by Marriage Status in Randolph
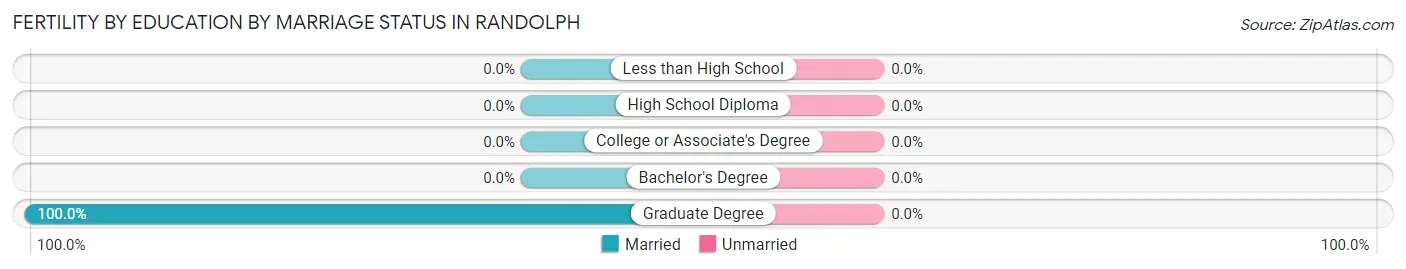
| Educational Attainment | Married | Unmarried |
| Less than High School | 0 (0.0%) | 0 (0.0%) |
| High School Diploma | 0 (0.0%) | 0 (0.0%) |
| College or Associate's Degree | 0 (0.0%) | 0 (0.0%) |
| Bachelor's Degree | 0 (0.0%) | 0 (0.0%) |
| Graduate Degree | 17 (100.0%) | 0 (0.0%) |
| Total | 17 (100.0%) | 0 (0.0%) |
Income in Randolph
Income Overview in Randolph
Per Capita Income in Randolph is $31,940, while median incomes of families and households are $72,331 and $58,333 respectively.
| Characteristic | Number | Measure |
| Per Capita Income | 2,010 | $31,940 |
| Median Family Income | 554 | $72,331 |
| Mean Family Income | 554 | $86,397 |
| Median Household Income | 974 | $58,333 |
| Mean Household Income | 974 | $66,550 |
| Income Deficit | 554 | $0 |
| Wage / Income Gap (%) | 2,010 | 13.33% |
| Wage / Income Gap ($) | 2,010 | 86.67¢ per $1 |
| Gini / Inequality Index | 2,010 | 0.37 |
Earnings by Sex in Randolph
Average Earnings in Randolph are $32,216, $34,770 for men and $30,136 for women, a difference of 13.3%.
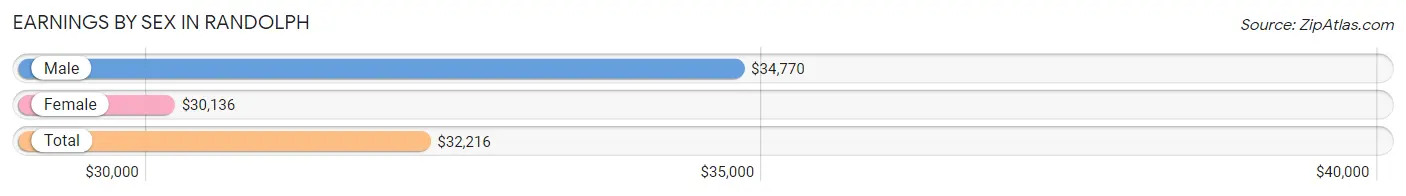
| Sex | Number | Average Earnings |
| Male | 597 (46.8%) | $34,770 |
| Female | 678 (53.2%) | $30,136 |
| Total | 1,275 (100.0%) | $32,216 |
Earnings by Sex by Income Bracket in Randolph
The most common earnings brackets in Randolph are $10,000 to $12,499 for men (113 | 18.9%) and $12,500 to $14,999 for women (103 | 15.2%).
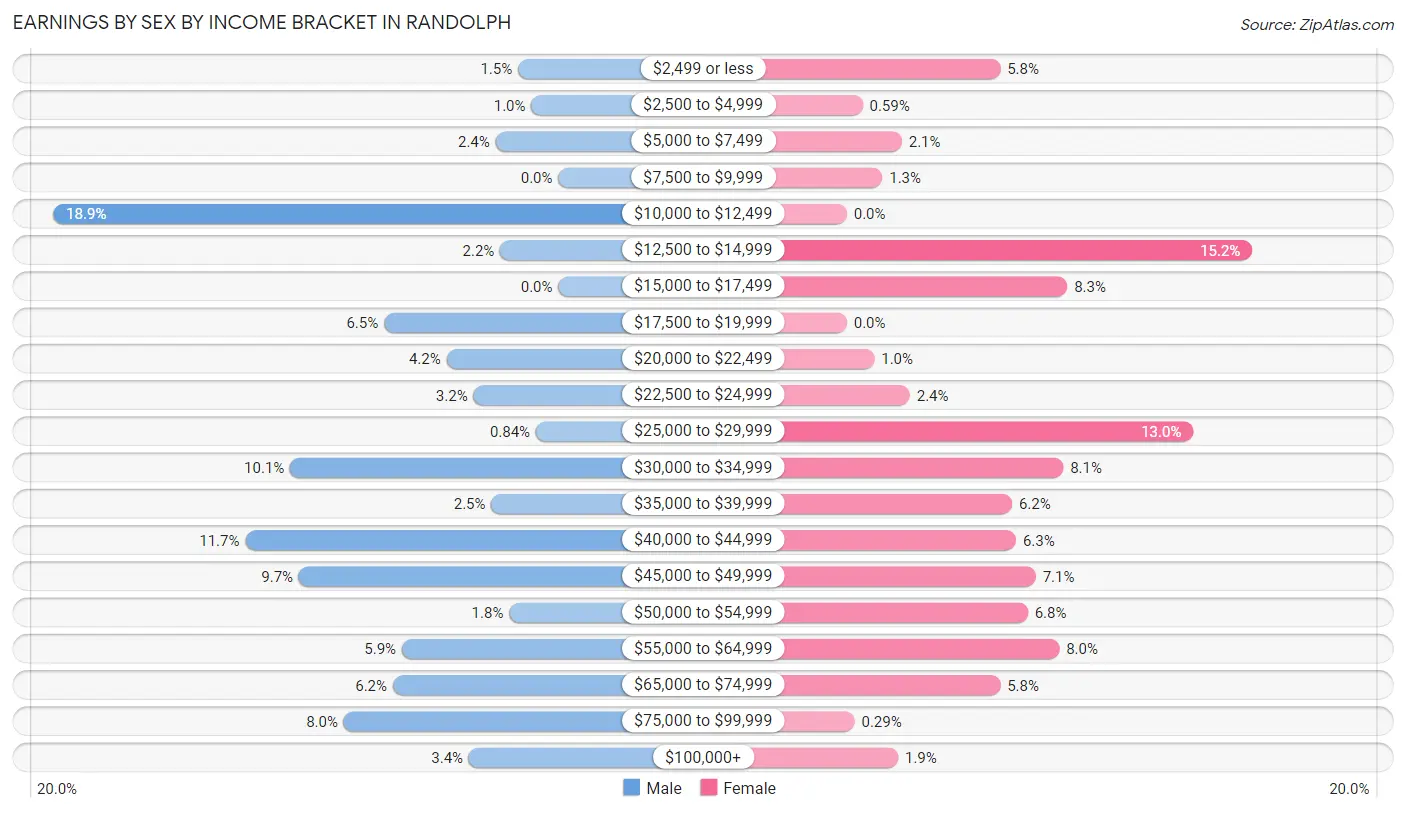
| Income | Male | Female |
| $2,499 or less | 9 (1.5%) | 39 (5.8%) |
| $2,500 to $4,999 | 6 (1.0%) | 4 (0.6%) |
| $5,000 to $7,499 | 14 (2.4%) | 14 (2.1%) |
| $7,500 to $9,999 | 0 (0.0%) | 9 (1.3%) |
| $10,000 to $12,499 | 113 (18.9%) | 0 (0.0%) |
| $12,500 to $14,999 | 13 (2.2%) | 103 (15.2%) |
| $15,000 to $17,499 | 0 (0.0%) | 56 (8.3%) |
| $17,500 to $19,999 | 39 (6.5%) | 0 (0.0%) |
| $20,000 to $22,499 | 25 (4.2%) | 7 (1.0%) |
| $22,500 to $24,999 | 19 (3.2%) | 16 (2.4%) |
| $25,000 to $29,999 | 5 (0.8%) | 88 (13.0%) |
| $30,000 to $34,999 | 60 (10.1%) | 55 (8.1%) |
| $35,000 to $39,999 | 15 (2.5%) | 42 (6.2%) |
| $40,000 to $44,999 | 70 (11.7%) | 43 (6.3%) |
| $45,000 to $49,999 | 58 (9.7%) | 48 (7.1%) |
| $50,000 to $54,999 | 11 (1.8%) | 46 (6.8%) |
| $55,000 to $64,999 | 35 (5.9%) | 54 (8.0%) |
| $65,000 to $74,999 | 37 (6.2%) | 39 (5.8%) |
| $75,000 to $99,999 | 48 (8.0%) | 2 (0.3%) |
| $100,000+ | 20 (3.4%) | 13 (1.9%) |
| Total | 597 (100.0%) | 678 (100.0%) |
Earnings by Sex by Educational Attainment in Randolph
Average earnings in Randolph are $43,643 for men and $36,250 for women, a difference of 16.9%. Men with an educational attainment of graduate degree enjoy the highest average annual earnings of $90,521, while those with high school diploma education earn the least with $43,517. Women with an educational attainment of bachelor's degree earn the most with the average annual earnings of $58,229, while those with high school diploma education have the smallest earnings of $17,235.
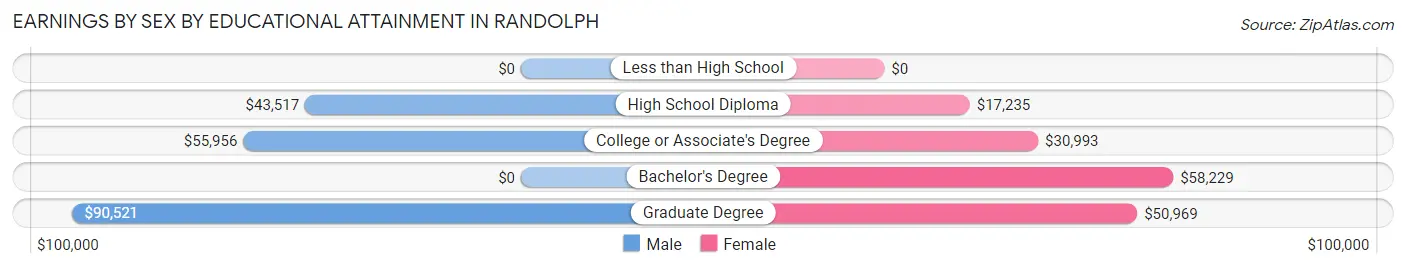
| Educational Attainment | Male Income | Female Income |
| Less than High School | - | - |
| High School Diploma | $43,517 | $17,235 |
| College or Associate's Degree | $55,956 | $30,993 |
| Bachelor's Degree | - | - |
| Graduate Degree | $90,521 | $50,969 |
| Total | $43,643 | $36,250 |
Family Income in Randolph
Family Income Brackets in Randolph
According to the Randolph family income data, there are 174 families falling into the $50,000 to $74,999 income range, which is the most common income bracket and makes up 31.4% of all families.
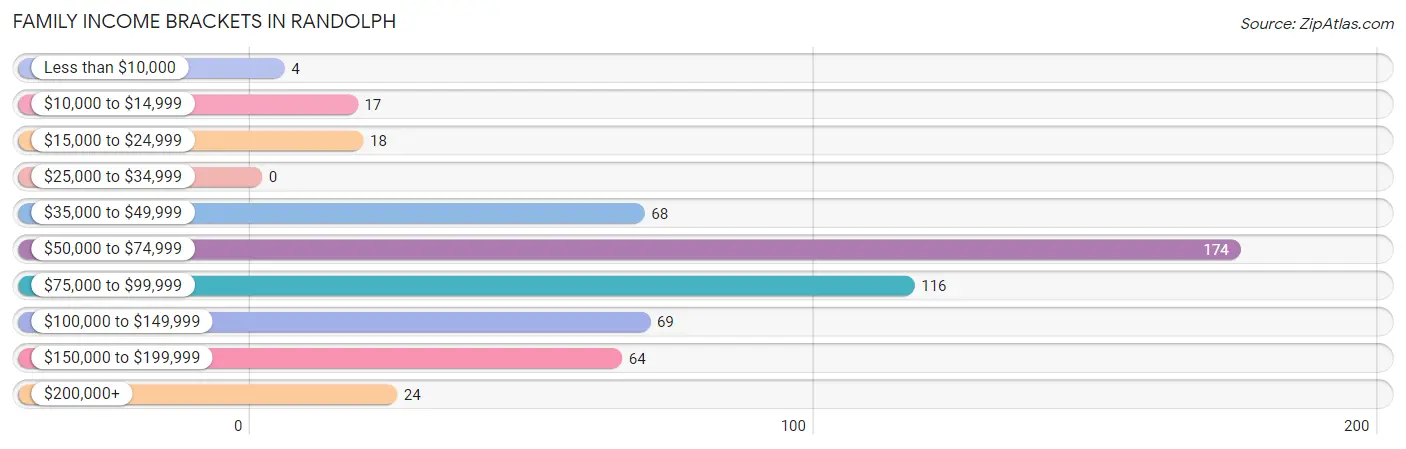
| Income Bracket | # Families | % Families |
| Less than $10,000 | 4 | 0.7% |
| $10,000 to $14,999 | 17 | 3.1% |
| $15,000 to $24,999 | 18 | 3.2% |
| $25,000 to $34,999 | 0 | 0.0% |
| $35,000 to $49,999 | 68 | 12.3% |
| $50,000 to $74,999 | 174 | 31.4% |
| $75,000 to $99,999 | 116 | 20.9% |
| $100,000 to $149,999 | 69 | 12.5% |
| $150,000 to $199,999 | 64 | 11.6% |
| $200,000+ | 24 | 4.3% |
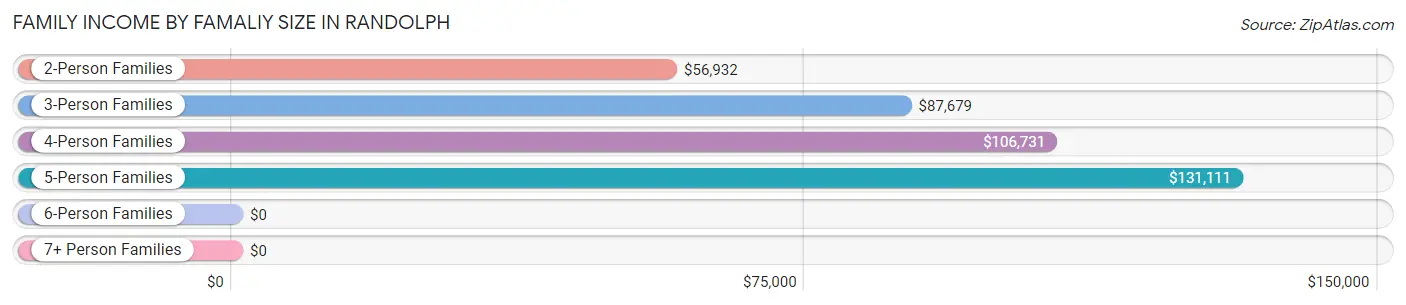
Family Income by Famaliy Size in Randolph
5-person families (26 | 4.7%) account for the highest median family income in Randolph with $131,111 per family, while 3-person families (95 | 17.2%) have the highest median income of $29,226 per family member.
| Income Bracket | # Families | Median Income |
| 2-Person Families | 327 (59.0%) | $56,932 |
| 3-Person Families | 95 (17.2%) | $87,679 |
| 4-Person Families | 106 (19.1%) | $106,731 |
| 5-Person Families | 26 (4.7%) | $131,111 |
| 6-Person Families | 0 (0.0%) | $0 |
| 7+ Person Families | 0 (0.0%) | $0 |
| Total | 554 (100.0%) | $72,331 |
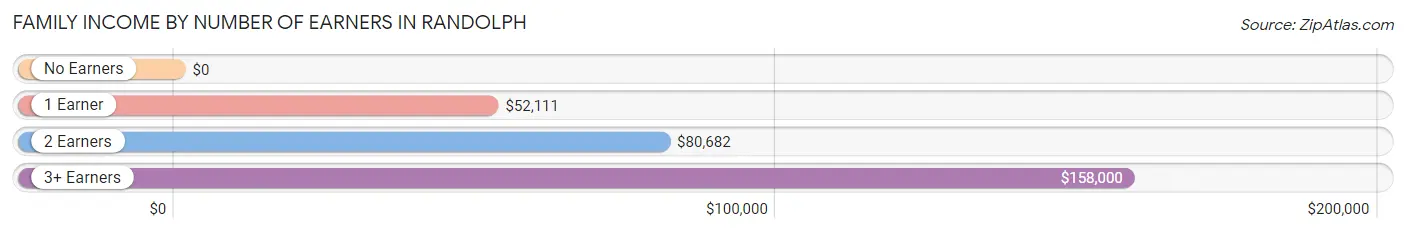
Family Income by Number of Earners in Randolph
| Number of Earners | # Families | Median Income |
| No Earners | 27 (4.9%) | $0 |
| 1 Earner | 147 (26.5%) | $52,111 |
| 2 Earners | 252 (45.5%) | $80,682 |
| 3+ Earners | 128 (23.1%) | $158,000 |
| Total | 554 (100.0%) | $72,331 |
Household Income in Randolph
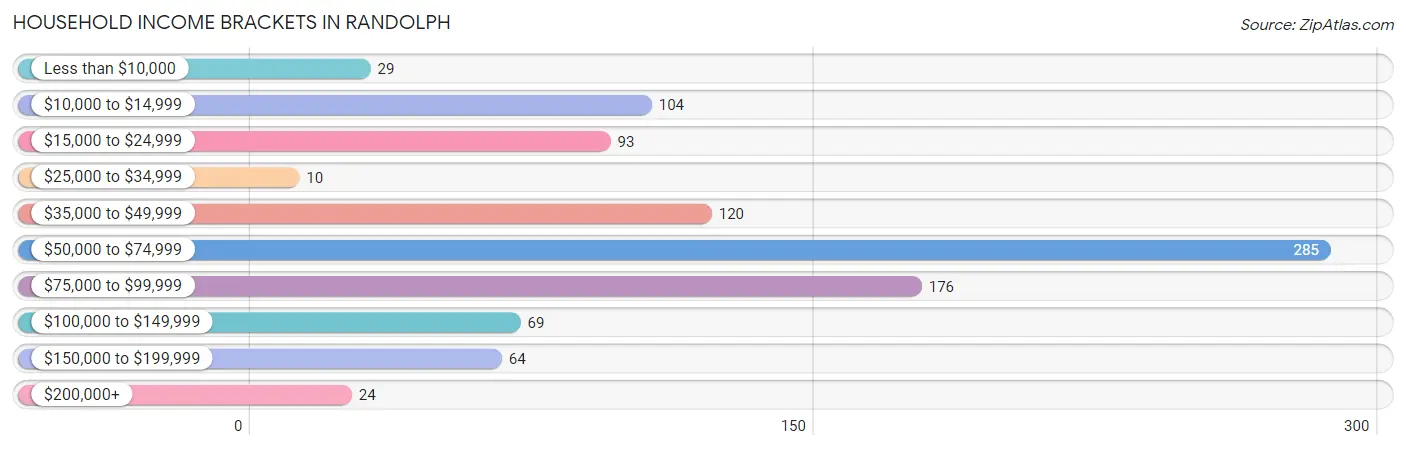
Household Income Brackets in Randolph
With 285 households falling in the category, the $50,000 to $74,999 income range is the most frequent in Randolph, accounting for 29.3% of all households. In contrast, only 10 households (1.0%) fall into the $25,000 to $34,999 income bracket, making it the least populous group.
| Income Bracket | # Households | % Households |
| Less than $10,000 | 29 | 3.0% |
| $10,000 to $14,999 | 104 | 10.7% |
| $15,000 to $24,999 | 93 | 9.5% |
| $25,000 to $34,999 | 10 | 1.0% |
| $35,000 to $49,999 | 120 | 12.3% |
| $50,000 to $74,999 | 285 | 29.3% |
| $75,000 to $99,999 | 176 | 18.1% |
| $100,000 to $149,999 | 69 | 7.1% |
| $150,000 to $199,999 | 64 | 6.6% |
| $200,000+ | 24 | 2.5% |
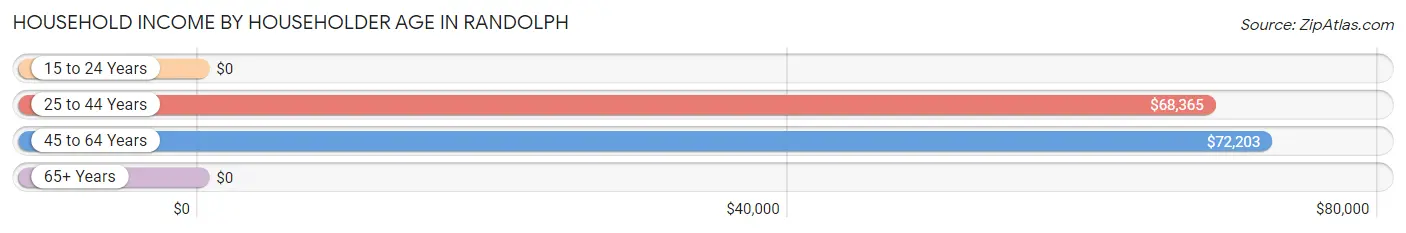
Household Income by Householder Age in Randolph
The median household income in Randolph is $58,333, with the highest median household income of $72,203 found in the 45 to 64 years age bracket for the primary householder. A total of 404 households (41.5%) fall into this category. Meanwhile, the 15 to 24 years age bracket for the primary householder has the lowest median household income of $0, with 40 households (4.1%) in this group.
| Income Bracket | # Households | Median Income |
| 15 to 24 Years | 40 (4.1%) | $0 |
| 25 to 44 Years | 234 (24.0%) | $68,365 |
| 45 to 64 Years | 404 (41.5%) | $72,203 |
| 65+ Years | 296 (30.4%) | $0 |
| Total | 974 (100.0%) | $58,333 |
Poverty in Randolph
Income Below Poverty by Sex and Age in Randolph
With 5.7% poverty level for males and 17.5% for females among the residents of Randolph, 75 year old and over males and 5 year old females are the most vulnerable to poverty, with 10 males (24.4%) and 12 females (100.0%) in their respective age groups living below the poverty level.
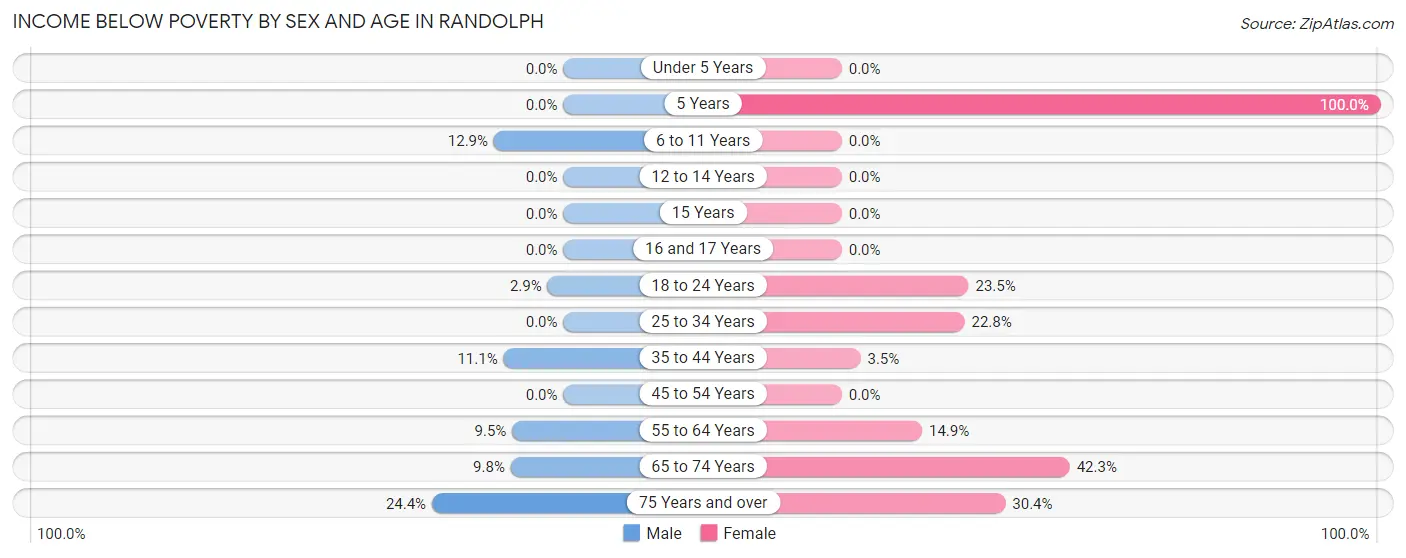
| Age Bracket | Male | Female |
| Under 5 Years | 0 (0.0%) | 0 (0.0%) |
| 5 Years | 0 (0.0%) | 12 (100.0%) |
| 6 to 11 Years | 4 (12.9%) | 0 (0.0%) |
| 12 to 14 Years | 0 (0.0%) | 0 (0.0%) |
| 15 Years | 0 (0.0%) | 0 (0.0%) |
| 16 and 17 Years | 0 (0.0%) | 0 (0.0%) |
| 18 to 24 Years | 6 (2.9%) | 24 (23.5%) |
| 25 to 34 Years | 0 (0.0%) | 18 (22.8%) |
| 35 to 44 Years | 9 (11.1%) | 4 (3.5%) |
| 45 to 54 Years | 0 (0.0%) | 0 (0.0%) |
| 55 to 64 Years | 17 (9.5%) | 28 (14.9%) |
| 65 to 74 Years | 13 (9.8%) | 44 (42.3%) |
| 75 Years and over | 10 (24.4%) | 34 (30.4%) |
| Total | 59 (5.7%) | 164 (17.5%) |
Income Above Poverty by Sex and Age in Randolph
According to the poverty statistics in Randolph, males aged under 5 years and females aged under 5 years are the age groups that are most secure financially, with 100.0% of males and 100.0% of females in these age groups living above the poverty line.
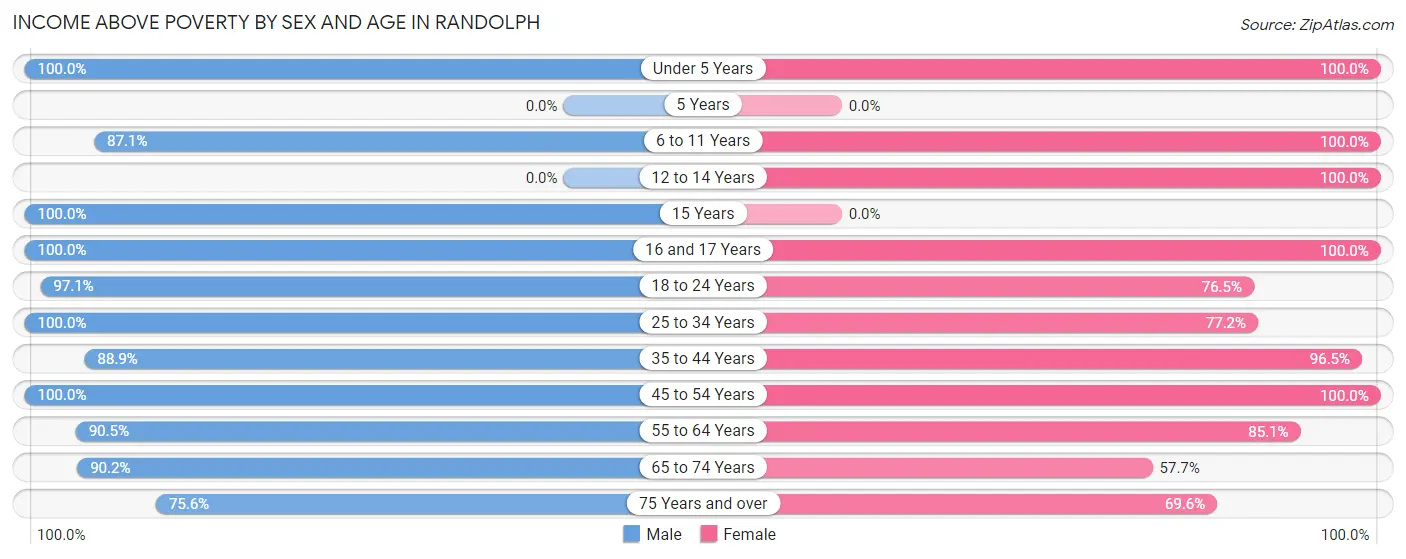
| Age Bracket | Male | Female |
| Under 5 Years | 81 (100.0%) | 8 (100.0%) |
| 5 Years | 0 (0.0%) | 0 (0.0%) |
| 6 to 11 Years | 27 (87.1%) | 32 (100.0%) |
| 12 to 14 Years | 0 (0.0%) | 23 (100.0%) |
| 15 Years | 9 (100.0%) | 0 (0.0%) |
| 16 and 17 Years | 45 (100.0%) | 12 (100.0%) |
| 18 to 24 Years | 198 (97.1%) | 78 (76.5%) |
| 25 to 34 Years | 112 (100.0%) | 61 (77.2%) |
| 35 to 44 Years | 72 (88.9%) | 111 (96.5%) |
| 45 to 54 Years | 120 (100.0%) | 151 (100.0%) |
| 55 to 64 Years | 162 (90.5%) | 160 (85.1%) |
| 65 to 74 Years | 120 (90.2%) | 60 (57.7%) |
| 75 Years and over | 31 (75.6%) | 78 (69.6%) |
| Total | 977 (94.3%) | 774 (82.5%) |
Income Below Poverty Among Married-Couple Families in Randolph
The poverty statistics for married-couple families in Randolph show that 4.6% or 17 of the total 373 families live below the poverty line. Families with no children have the highest poverty rate of 5.9%, comprising of 17 families. On the other hand, families with 1 or 2 children have the lowest poverty rate of 0.0%, which includes 0 families.
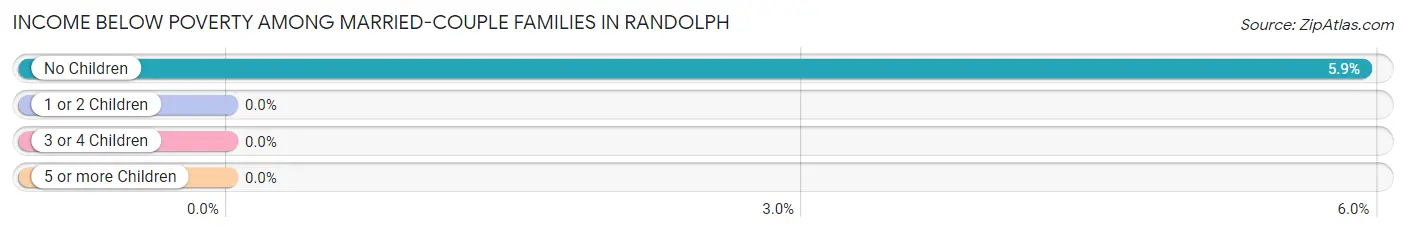
| Children | Above Poverty | Below Poverty |
| No Children | 270 (94.1%) | 17 (5.9%) |
| 1 or 2 Children | 60 (100.0%) | 0 (0.0%) |
| 3 or 4 Children | 26 (100.0%) | 0 (0.0%) |
| 5 or more Children | 0 (0.0%) | 0 (0.0%) |
| Total | 356 (95.4%) | 17 (4.6%) |
Income Below Poverty Among Single-Parent Households in Randolph
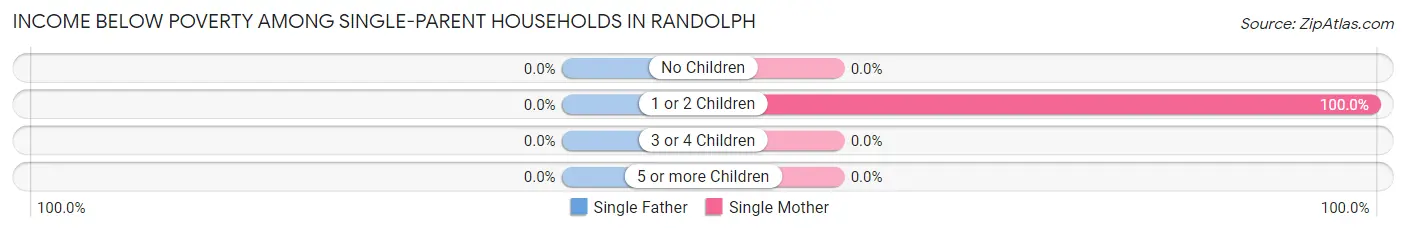
| Children | Single Father | Single Mother |
| No Children | 0 (0.0%) | 0 (0.0%) |
| 1 or 2 Children | 0 (0.0%) | 22 (100.0%) |
| 3 or 4 Children | 0 (0.0%) | 0 (0.0%) |
| 5 or more Children | 0 (0.0%) | 0 (0.0%) |
| Total | 0 (0.0%) | 22 (24.2%) |
Income Below Poverty Among Married-Couple vs Single-Parent Households in Randolph
The poverty data for Randolph shows that 17 of the married-couple family households (4.6%) and 22 of the single-parent households (12.1%) are living below the poverty level. Within the married-couple family households, those with no children have the highest poverty rate, with 17 households (5.9%) falling below the poverty line. Among the single-parent households, those with 1 or 2 children have the highest poverty rate, with 22 household (34.9%) living below poverty.
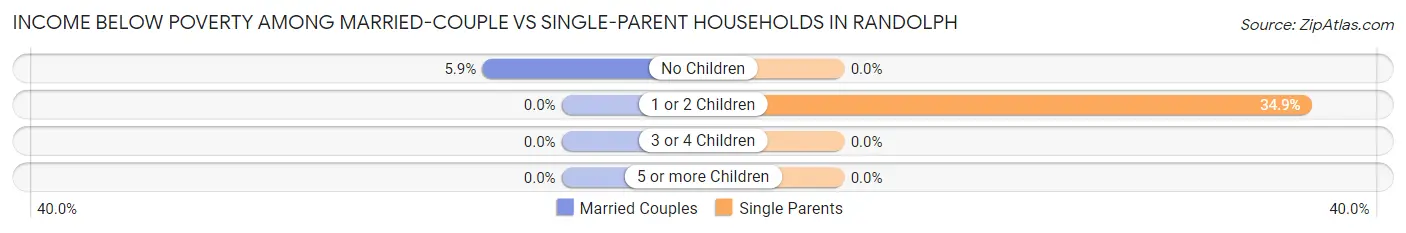
| Children | Married-Couple Families | Single-Parent Households |
| No Children | 17 (5.9%) | 0 (0.0%) |
| 1 or 2 Children | 0 (0.0%) | 22 (34.9%) |
| 3 or 4 Children | 0 (0.0%) | 0 (0.0%) |
| 5 or more Children | 0 (0.0%) | 0 (0.0%) |
| Total | 17 (4.6%) | 22 (12.1%) |
Employment Characteristics in Randolph
Employment by Class of Employer in Randolph
Among the 1,077 employed individuals in Randolph, private company employees (513 | 47.6%), not-for-profit organizations (230 | 21.4%), and local government employees (118 | 11.0%) make up the most common classes of employment.
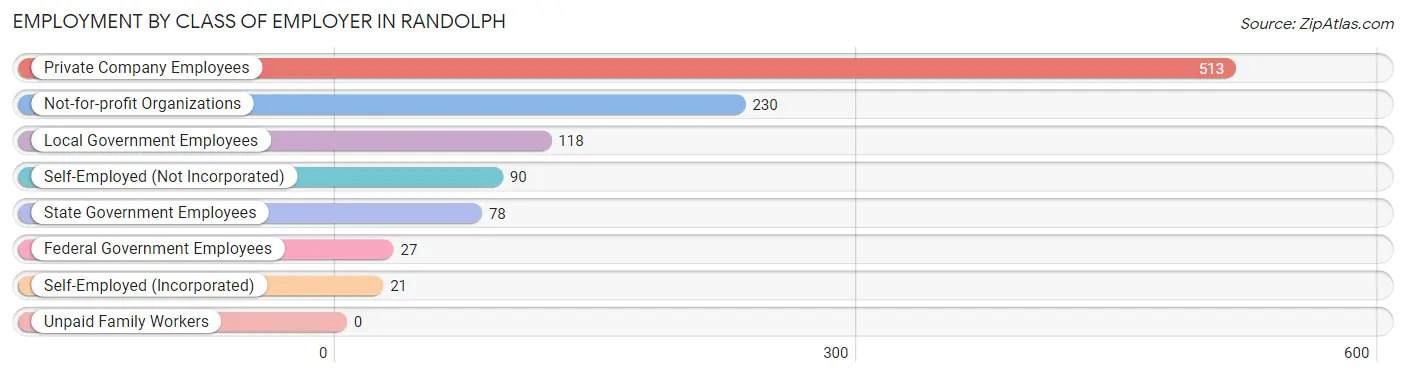
| Employer Class | # Employees | % Employees |
| Private Company Employees | 513 | 47.6% |
| Self-Employed (Incorporated) | 21 | 1.9% |
| Self-Employed (Not Incorporated) | 90 | 8.4% |
| Not-for-profit Organizations | 230 | 21.4% |
| Local Government Employees | 118 | 11.0% |
| State Government Employees | 78 | 7.2% |
| Federal Government Employees | 27 | 2.5% |
| Unpaid Family Workers | 0 | 0.0% |
| Total | 1,077 | 100.0% |
Employment Status by Age in Randolph
According to the labor force statistics for Randolph, out of the total population over 16 years of age (1,814), 66.0% or 1,197 individuals are in the labor force, with 7.7% or 92 of them unemployed. The age group with the highest labor force participation rate is 30 to 34 years, with 100.0% or 49 individuals in the labor force. Within the labor force, the 16 to 19 years age range has the highest percentage of unemployed individuals, with 56.4% or 53 of them being unemployed.
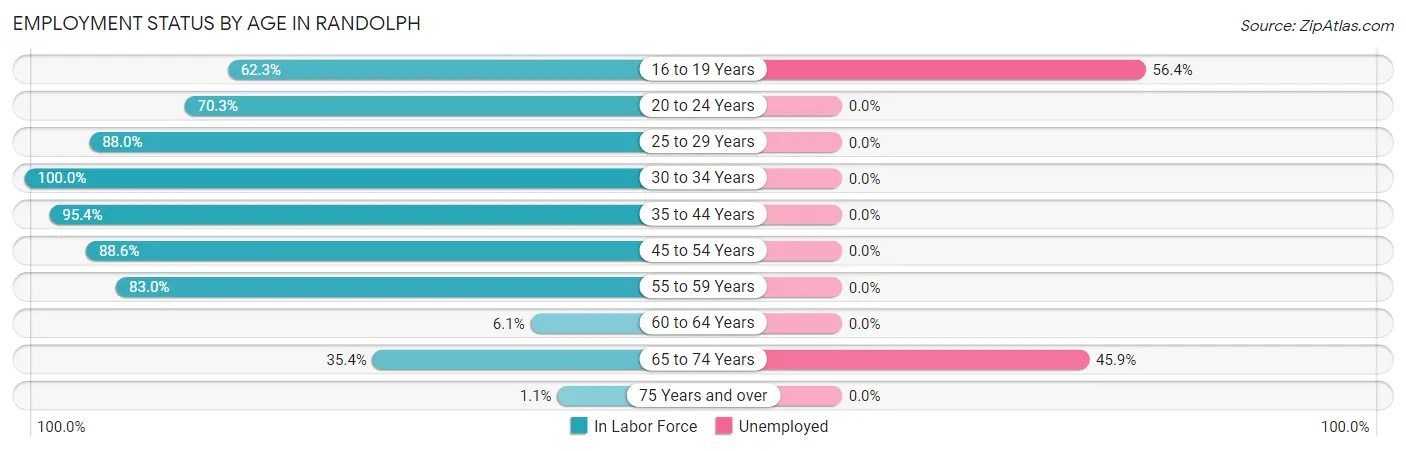
| Age Bracket | In Labor Force | Unemployed |
| 16 to 19 Years | 94 (62.3%) | 53 (56.4%) |
| 20 to 24 Years | 149 (70.3%) | 0 (0.0%) |
| 25 to 29 Years | 125 (88.0%) | 0 (0.0%) |
| 30 to 34 Years | 49 (100.0%) | 0 (0.0%) |
| 35 to 44 Years | 187 (95.4%) | 0 (0.0%) |
| 45 to 54 Years | 240 (88.6%) | 0 (0.0%) |
| 55 to 59 Years | 264 (83.0%) | 0 (0.0%) |
| 60 to 64 Years | 3 (6.1%) | 0 (0.0%) |
| 65 to 74 Years | 85 (35.4%) | 39 (45.9%) |
| 75 Years and over | 2 (1.1%) | 0 (0.0%) |
| Total | 1,197 (66.0%) | 92 (7.7%) |
Employment Status by Educational Attainment in Randolph
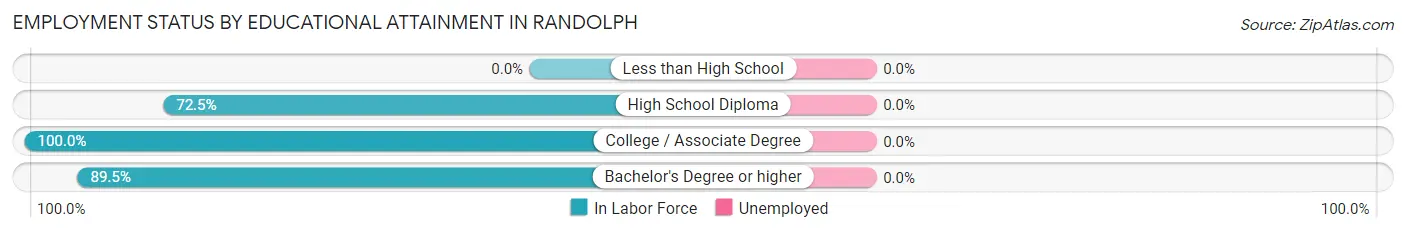
| Educational Attainment | In Labor Force | Unemployed |
| Less than High School | 0 (0.0%) | 0 (0.0%) |
| High School Diploma | 269 (72.5%) | 0 (0.0%) |
| College / Associate Degree | 240 (100.0%) | 0 (0.0%) |
| Bachelor's Degree or higher | 359 (89.5%) | 0 (0.0%) |
| Total | 868 (84.7%) | 0 (0.0%) |
Employment Occupations by Sex in Randolph
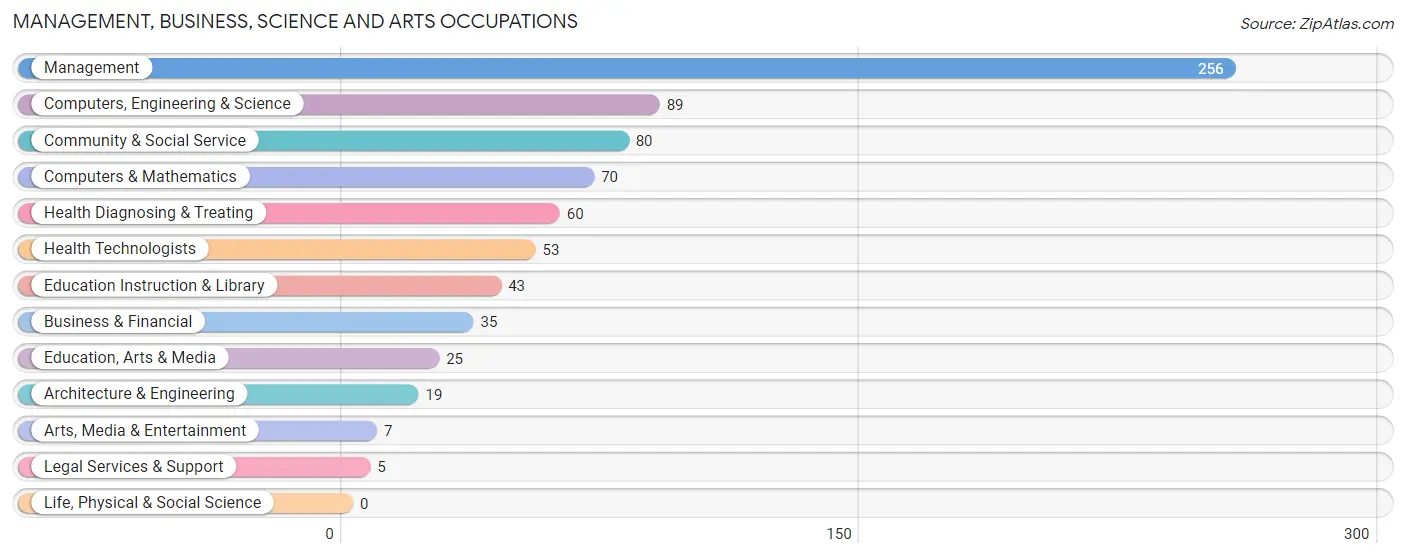
Management, Business, Science and Arts Occupations
The most common Management, Business, Science and Arts occupations in Randolph are Management (256 | 23.2%), Computers, Engineering & Science (89 | 8.1%), Community & Social Service (80 | 7.2%), Computers & Mathematics (70 | 6.3%), and Health Diagnosing & Treating (60 | 5.4%).
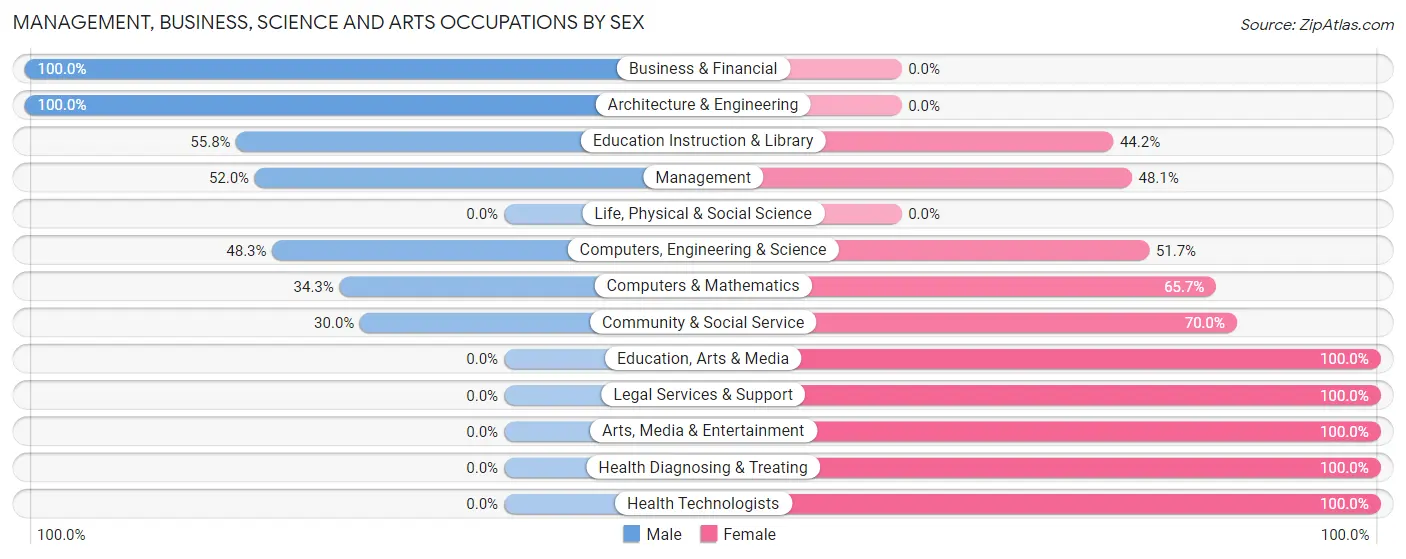
Management, Business, Science and Arts Occupations by Sex
Within the Management, Business, Science and Arts occupations in Randolph, the most male-oriented occupations are Business & Financial (100.0%), Architecture & Engineering (100.0%), and Education Instruction & Library (55.8%), while the most female-oriented occupations are Education, Arts & Media (100.0%), Legal Services & Support (100.0%), and Arts, Media & Entertainment (100.0%).
| Occupation | Male | Female |
| Management | 133 (51.9%) | 123 (48.0%) |
| Business & Financial | 35 (100.0%) | 0 (0.0%) |
| Computers, Engineering & Science | 43 (48.3%) | 46 (51.7%) |
| Computers & Mathematics | 24 (34.3%) | 46 (65.7%) |
| Architecture & Engineering | 19 (100.0%) | 0 (0.0%) |
| Life, Physical & Social Science | 0 (0.0%) | 0 (0.0%) |
| Community & Social Service | 24 (30.0%) | 56 (70.0%) |
| Education, Arts & Media | 0 (0.0%) | 25 (100.0%) |
| Legal Services & Support | 0 (0.0%) | 5 (100.0%) |
| Education Instruction & Library | 24 (55.8%) | 19 (44.2%) |
| Arts, Media & Entertainment | 0 (0.0%) | 7 (100.0%) |
| Health Diagnosing & Treating | 0 (0.0%) | 60 (100.0%) |
| Health Technologists | 0 (0.0%) | 53 (100.0%) |
| Total (Category) | 235 (45.2%) | 285 (54.8%) |
| Total (Overall) | 471 (42.6%) | 635 (57.4%) |
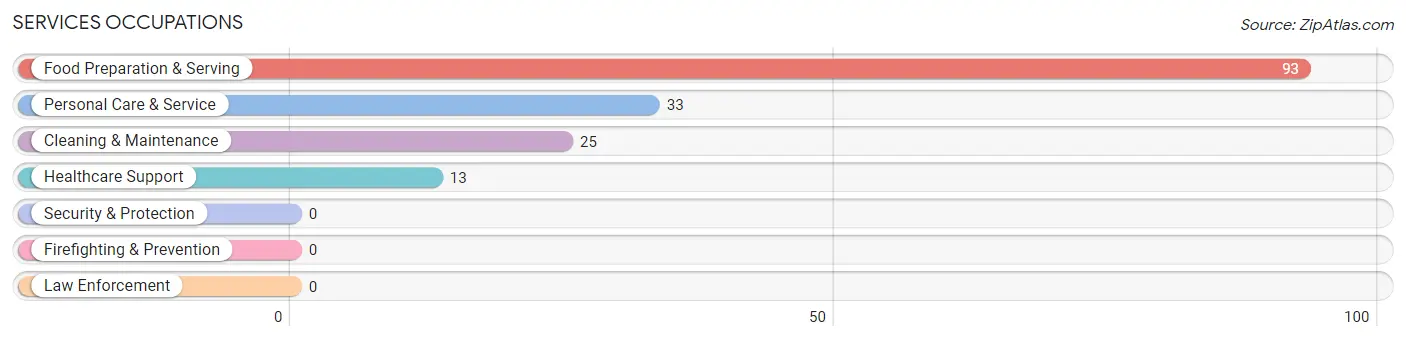
Services Occupations
The most common Services occupations in Randolph are Food Preparation & Serving (93 | 8.4%), Personal Care & Service (33 | 3.0%), Cleaning & Maintenance (25 | 2.3%), and Healthcare Support (13 | 1.2%).
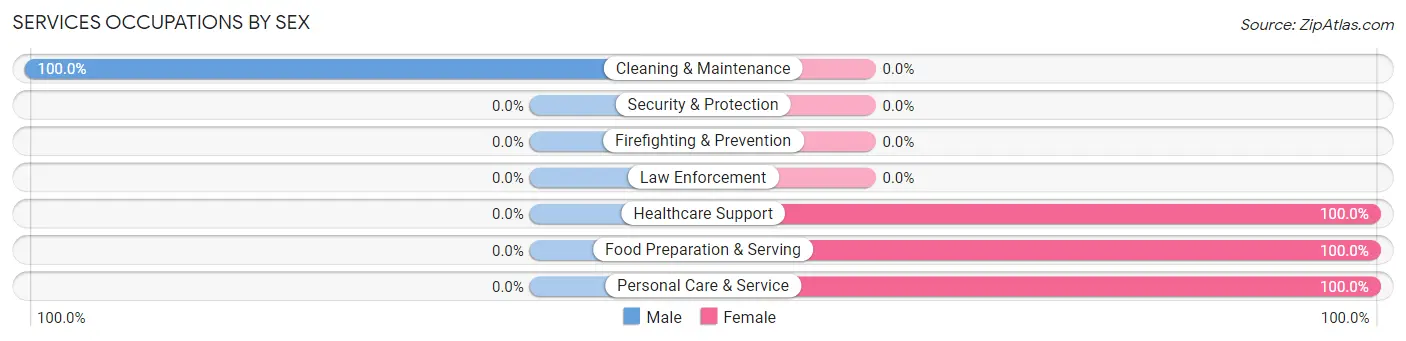
Services Occupations by Sex
| Occupation | Male | Female |
| Healthcare Support | 0 (0.0%) | 13 (100.0%) |
| Security & Protection | 0 (0.0%) | 0 (0.0%) |
| Firefighting & Prevention | 0 (0.0%) | 0 (0.0%) |
| Law Enforcement | 0 (0.0%) | 0 (0.0%) |
| Food Preparation & Serving | 0 (0.0%) | 93 (100.0%) |
| Cleaning & Maintenance | 25 (100.0%) | 0 (0.0%) |
| Personal Care & Service | 0 (0.0%) | 33 (100.0%) |
| Total (Category) | 25 (15.2%) | 139 (84.8%) |
| Total (Overall) | 471 (42.6%) | 635 (57.4%) |
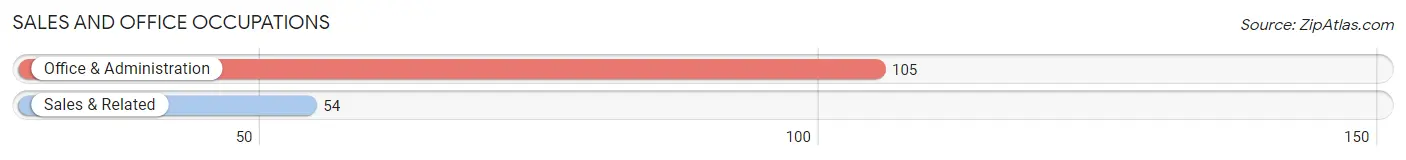
Sales and Office Occupations
The most common Sales and Office occupations in Randolph are Office & Administration (105 | 9.5%), and Sales & Related (54 | 4.9%).
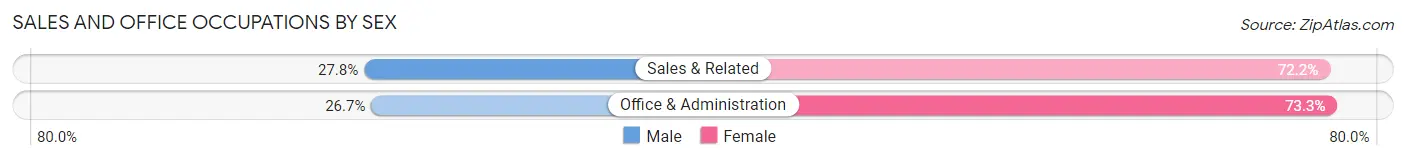
Sales and Office Occupations by Sex
| Occupation | Male | Female |
| Sales & Related | 15 (27.8%) | 39 (72.2%) |
| Office & Administration | 28 (26.7%) | 77 (73.3%) |
| Total (Category) | 43 (27.0%) | 116 (73.0%) |
| Total (Overall) | 471 (42.6%) | 635 (57.4%) |
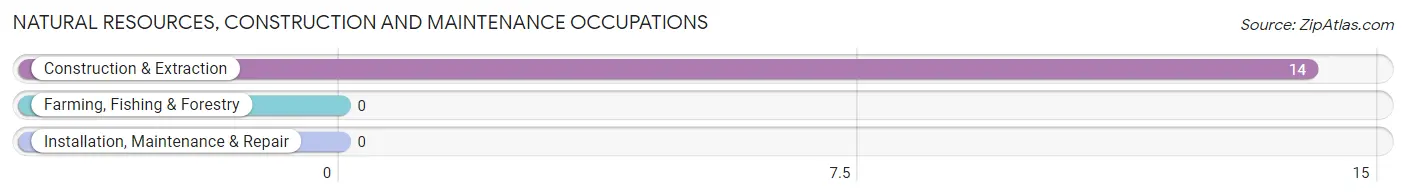
Natural Resources, Construction and Maintenance Occupations
The most common Natural Resources, Construction and Maintenance occupations in Randolph are , and Construction & Extraction (14 | 1.3%).
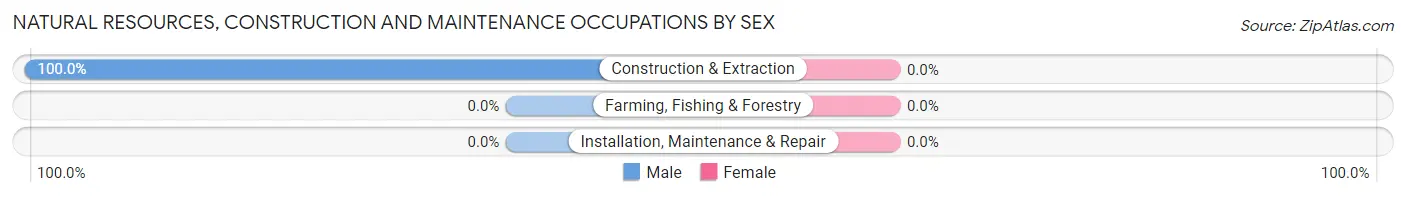
Natural Resources, Construction and Maintenance Occupations by Sex
| Occupation | Male | Female |
| Farming, Fishing & Forestry | 0 (0.0%) | 0 (0.0%) |
| Construction & Extraction | 14 (100.0%) | 0 (0.0%) |
| Installation, Maintenance & Repair | 0 (0.0%) | 0 (0.0%) |
| Total (Category) | 14 (100.0%) | 0 (0.0%) |
| Total (Overall) | 471 (42.6%) | 635 (57.4%) |
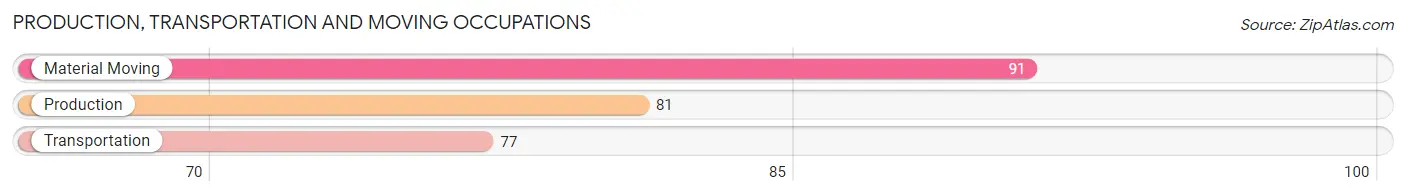
Production, Transportation and Moving Occupations
The most common Production, Transportation and Moving occupations in Randolph are Material Moving (91 | 8.2%), Production (81 | 7.3%), and Transportation (77 | 7.0%).
Production, Transportation and Moving Occupations by Sex
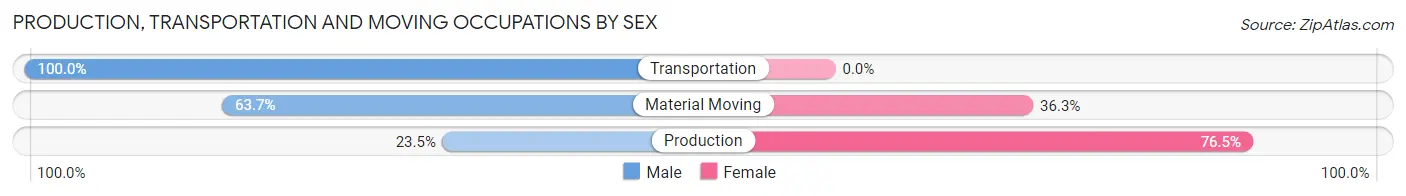
| Occupation | Male | Female |
| Production | 19 (23.5%) | 62 (76.5%) |
| Transportation | 77 (100.0%) | 0 (0.0%) |
| Material Moving | 58 (63.7%) | 33 (36.3%) |
| Total (Category) | 154 (61.9%) | 95 (38.2%) |
| Total (Overall) | 471 (42.6%) | 635 (57.4%) |
Employment Industries by Sex in Randolph
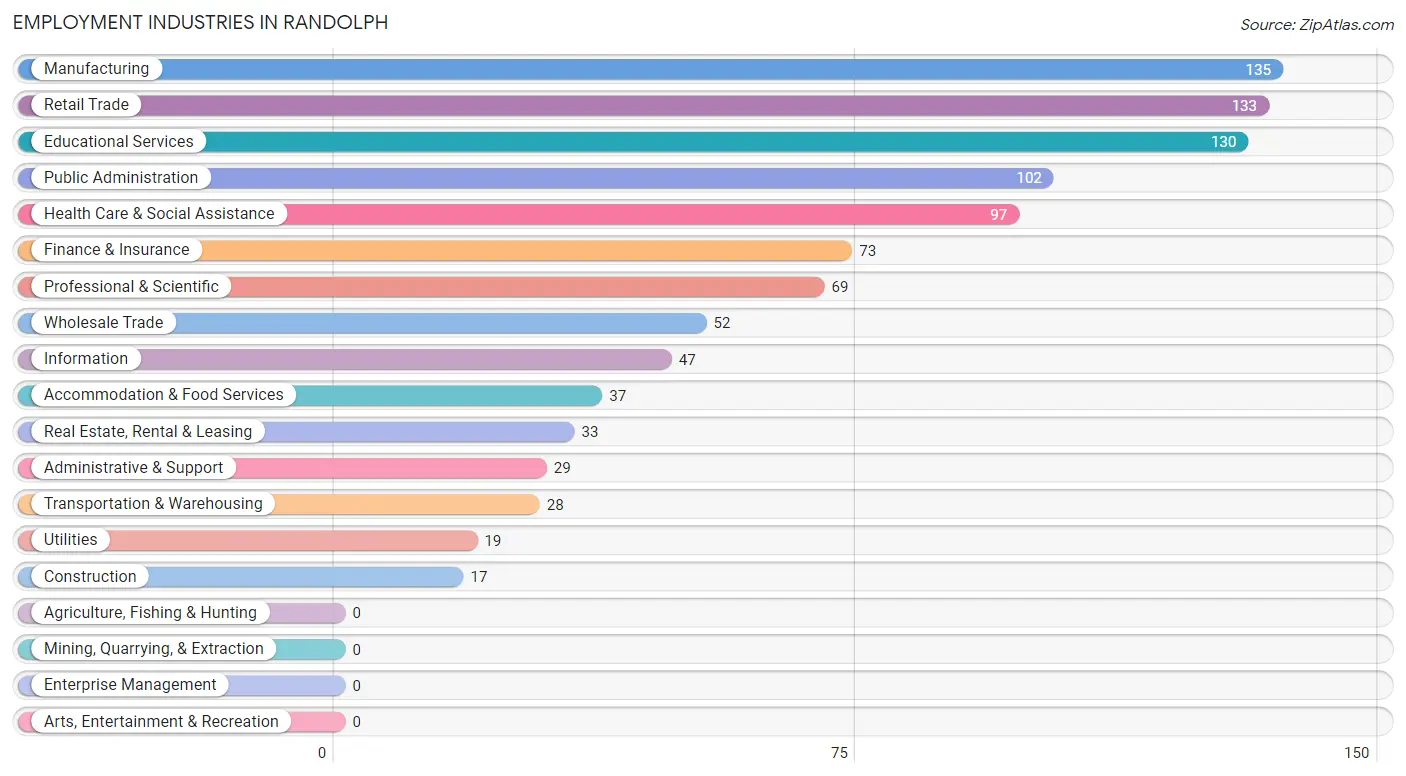
Employment Industries in Randolph
The major employment industries in Randolph include Manufacturing (135 | 12.2%), Retail Trade (133 | 12.0%), Educational Services (130 | 11.7%), Public Administration (102 | 9.2%), and Health Care & Social Assistance (97 | 8.8%).
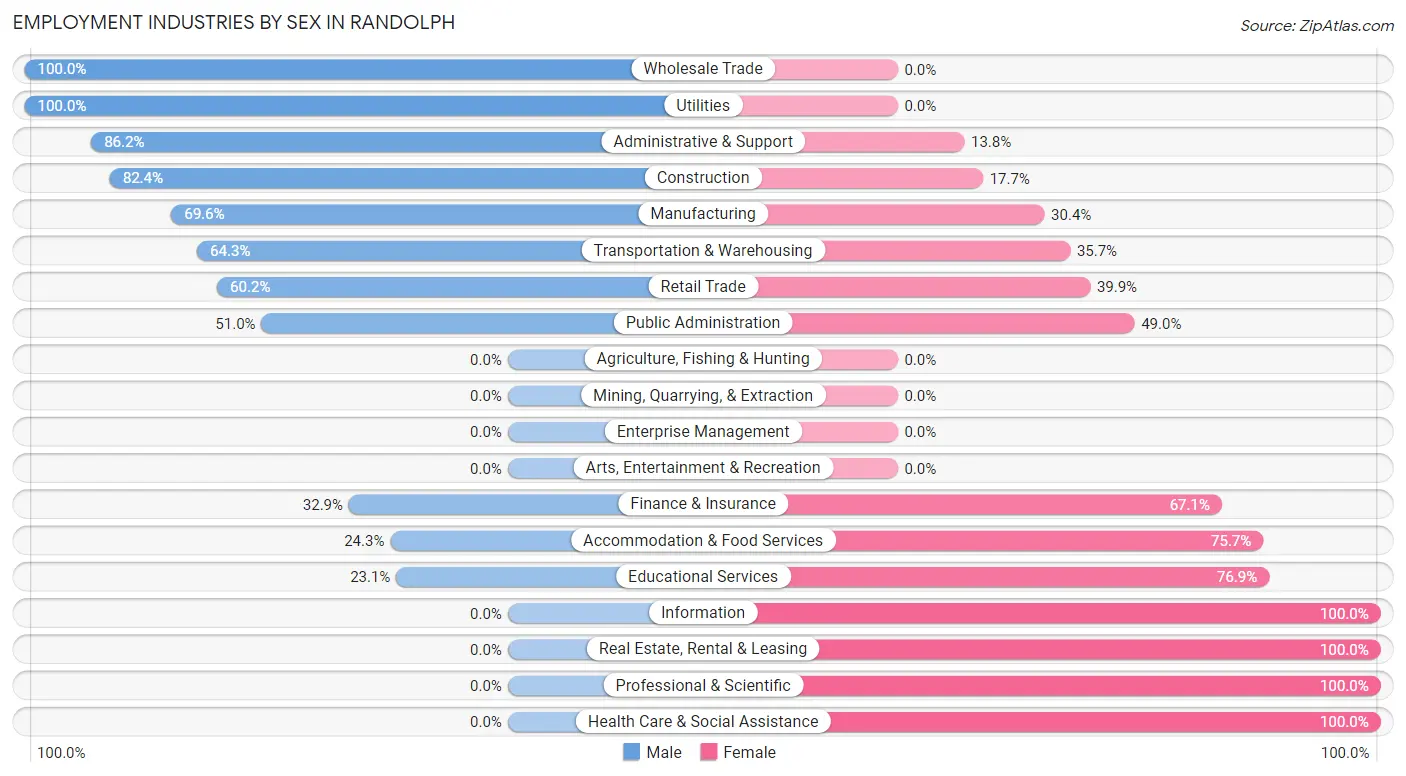
Employment Industries by Sex in Randolph
The Randolph industries that see more men than women are Wholesale Trade (100.0%), Utilities (100.0%), and Administrative & Support (86.2%), whereas the industries that tend to have a higher number of women are Information (100.0%), Real Estate, Rental & Leasing (100.0%), and Professional & Scientific (100.0%).
| Industry | Male | Female |
| Agriculture, Fishing & Hunting | 0 (0.0%) | 0 (0.0%) |
| Mining, Quarrying, & Extraction | 0 (0.0%) | 0 (0.0%) |
| Construction | 14 (82.4%) | 3 (17.6%) |
| Manufacturing | 94 (69.6%) | 41 (30.4%) |
| Wholesale Trade | 52 (100.0%) | 0 (0.0%) |
| Retail Trade | 80 (60.2%) | 53 (39.9%) |
| Transportation & Warehousing | 18 (64.3%) | 10 (35.7%) |
| Utilities | 19 (100.0%) | 0 (0.0%) |
| Information | 0 (0.0%) | 47 (100.0%) |
| Finance & Insurance | 24 (32.9%) | 49 (67.1%) |
| Real Estate, Rental & Leasing | 0 (0.0%) | 33 (100.0%) |
| Professional & Scientific | 0 (0.0%) | 69 (100.0%) |
| Enterprise Management | 0 (0.0%) | 0 (0.0%) |
| Administrative & Support | 25 (86.2%) | 4 (13.8%) |
| Educational Services | 30 (23.1%) | 100 (76.9%) |
| Health Care & Social Assistance | 0 (0.0%) | 97 (100.0%) |
| Arts, Entertainment & Recreation | 0 (0.0%) | 0 (0.0%) |
| Accommodation & Food Services | 9 (24.3%) | 28 (75.7%) |
| Public Administration | 52 (51.0%) | 50 (49.0%) |
| Total | 471 (42.6%) | 635 (57.4%) |
Education in Randolph
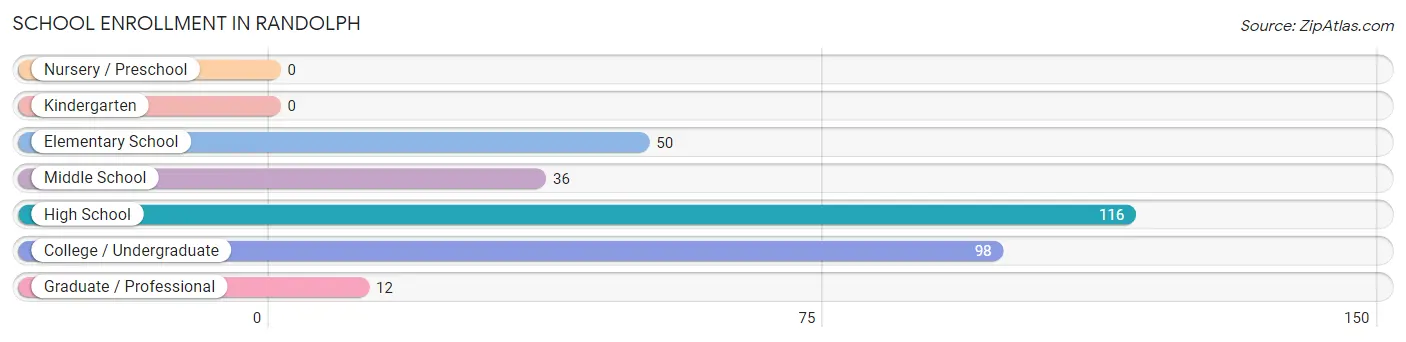
School Enrollment in Randolph
The most common levels of schooling among the 312 students in Randolph are high school (116 | 37.2%), college / undergraduate (98 | 31.4%), and elementary school (50 | 16.0%).
| School Level | # Students | % Students |
| Nursery / Preschool | 0 | 0.0% |
| Kindergarten | 0 | 0.0% |
| Elementary School | 50 | 16.0% |
| Middle School | 36 | 11.5% |
| High School | 116 | 37.2% |
| College / Undergraduate | 98 | 31.4% |
| Graduate / Professional | 12 | 3.8% |
| Total | 312 | 100.0% |
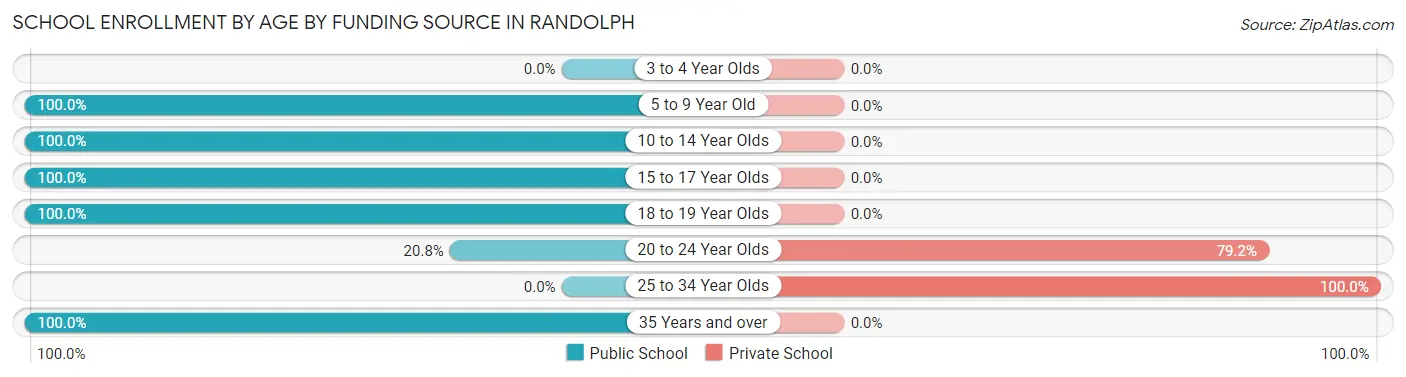
School Enrollment by Age by Funding Source in Randolph
Out of a total of 312 students who are enrolled in schools in Randolph, 61 (19.6%) attend a private institution, while the remaining 251 (80.4%) are enrolled in public schools. The age group of 25 to 34 year olds has the highest likelihood of being enrolled in private schools, with 4 (100.0% in the age bracket) enrolled. Conversely, the age group of 5 to 9 year old has the lowest likelihood of being enrolled in a private school, with 32 (100.0% in the age bracket) attending a public institution.
| Age Bracket | Public School | Private School |
| 3 to 4 Year Olds | 0 (0.0%) | 0 (0.0%) |
| 5 to 9 Year Old | 32 (100.0%) | 0 (0.0%) |
| 10 to 14 Year Olds | 54 (100.0%) | 0 (0.0%) |
| 15 to 17 Year Olds | 66 (100.0%) | 0 (0.0%) |
| 18 to 19 Year Olds | 77 (100.0%) | 0 (0.0%) |
| 20 to 24 Year Olds | 15 (20.8%) | 57 (79.2%) |
| 25 to 34 Year Olds | 0 (0.0%) | 4 (100.0%) |
| 35 Years and over | 7 (100.0%) | 0 (0.0%) |
| Total | 251 (80.4%) | 61 (19.6%) |
Educational Attainment by Field of Study in Randolph
Social sciences (131 | 19.3%), computers & mathematics (79 | 11.7%), education (62 | 9.1%), liberal arts & history (62 | 9.1%), and visual & performing arts (54 | 8.0%) are the most common fields of study among 678 individuals in Randolph who have obtained a bachelor's degree or higher.
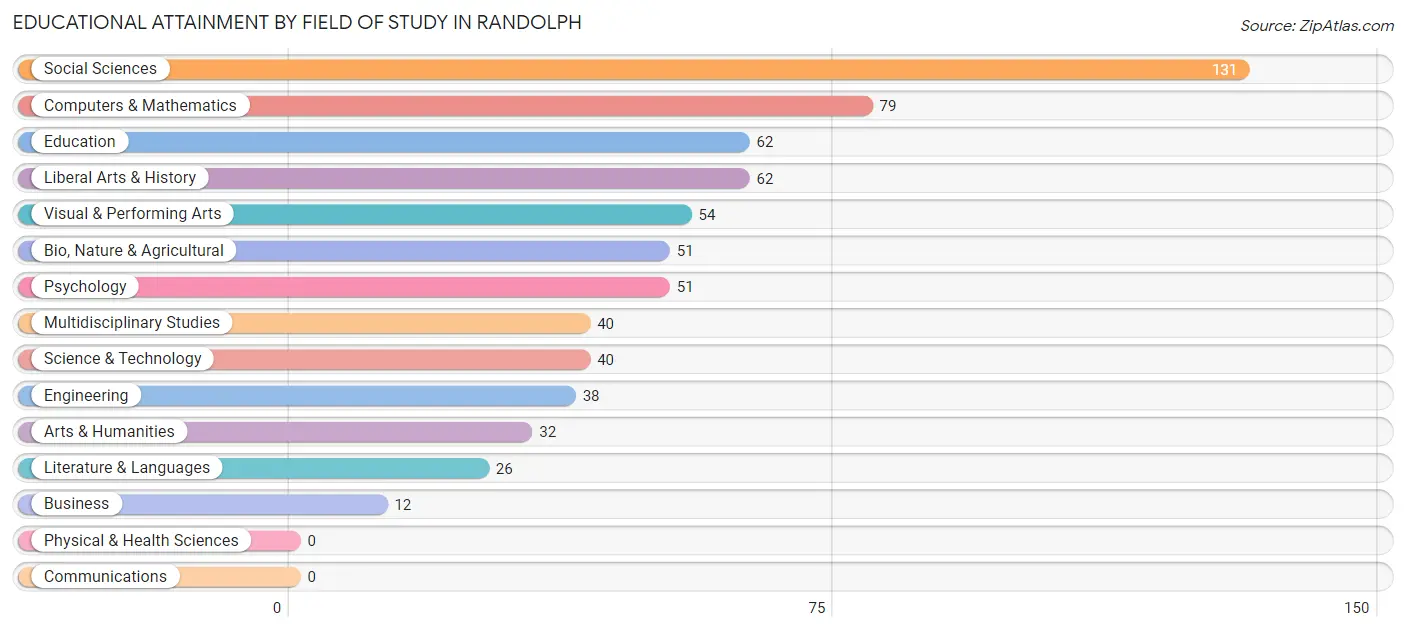
| Field of Study | # Graduates | % Graduates |
| Computers & Mathematics | 79 | 11.7% |
| Bio, Nature & Agricultural | 51 | 7.5% |
| Physical & Health Sciences | 0 | 0.0% |
| Psychology | 51 | 7.5% |
| Social Sciences | 131 | 19.3% |
| Engineering | 38 | 5.6% |
| Multidisciplinary Studies | 40 | 5.9% |
| Science & Technology | 40 | 5.9% |
| Business | 12 | 1.8% |
| Education | 62 | 9.1% |
| Literature & Languages | 26 | 3.8% |
| Liberal Arts & History | 62 | 9.1% |
| Visual & Performing Arts | 54 | 8.0% |
| Communications | 0 | 0.0% |
| Arts & Humanities | 32 | 4.7% |
| Total | 678 | 100.0% |
Transportation & Commute in Randolph
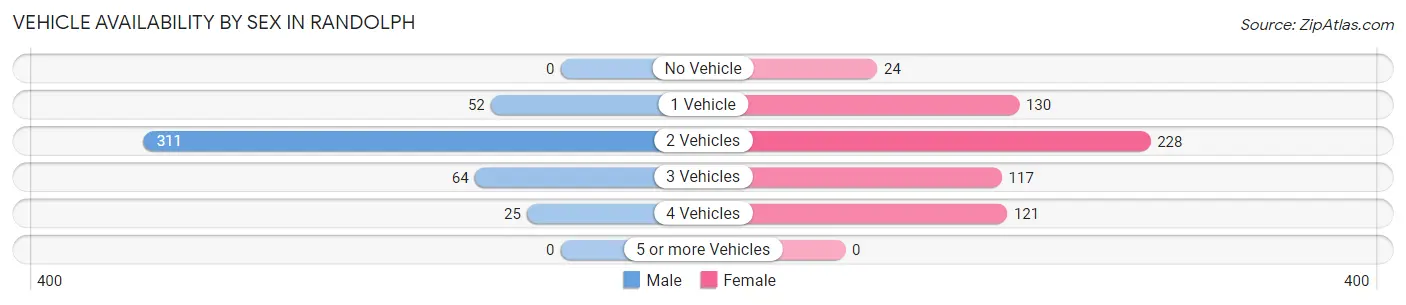
Vehicle Availability by Sex in Randolph
The most prevalent vehicle ownership categories in Randolph are males with 2 vehicles (311, accounting for 68.8%) and females with 2 vehicles (228, making up 50.2%).
| Vehicles Available | Male | Female |
| No Vehicle | 0 (0.0%) | 24 (3.9%) |
| 1 Vehicle | 52 (11.5%) | 130 (21.0%) |
| 2 Vehicles | 311 (68.8%) | 228 (36.8%) |
| 3 Vehicles | 64 (14.2%) | 117 (18.9%) |
| 4 Vehicles | 25 (5.5%) | 121 (19.5%) |
| 5 or more Vehicles | 0 (0.0%) | 0 (0.0%) |
| Total | 452 (100.0%) | 620 (100.0%) |
Commute Time in Randolph
The most frequently occuring commute durations in Randolph are 20 to 24 minutes (183 commuters, 21.4%), 30 to 34 minutes (163 commuters, 19.1%), and 5 to 9 minutes (158 commuters, 18.5%).
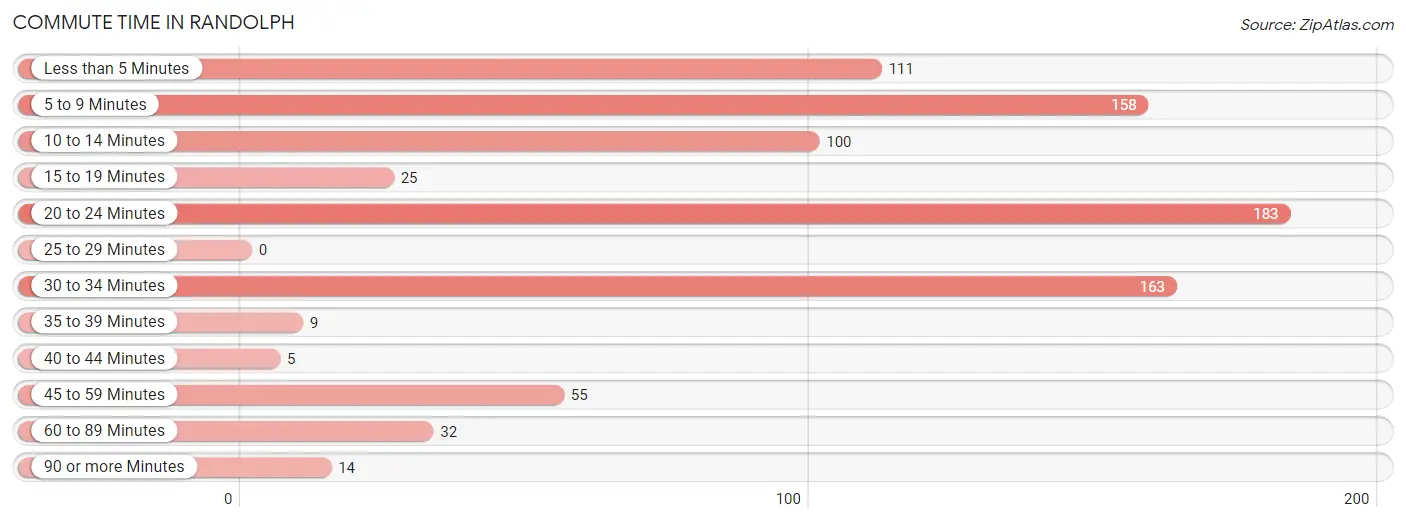
| Commute Time | # Commuters | % Commuters |
| Less than 5 Minutes | 111 | 13.0% |
| 5 to 9 Minutes | 158 | 18.5% |
| 10 to 14 Minutes | 100 | 11.7% |
| 15 to 19 Minutes | 25 | 2.9% |
| 20 to 24 Minutes | 183 | 21.4% |
| 25 to 29 Minutes | 0 | 0.0% |
| 30 to 34 Minutes | 163 | 19.1% |
| 35 to 39 Minutes | 9 | 1.1% |
| 40 to 44 Minutes | 5 | 0.6% |
| 45 to 59 Minutes | 55 | 6.4% |
| 60 to 89 Minutes | 32 | 3.7% |
| 90 or more Minutes | 14 | 1.6% |
Commute Time by Sex in Randolph
The most common commute times in Randolph are 20 to 24 minutes (117 commuters, 34.9%) for males and 5 to 9 minutes (117 commuters, 22.5%) for females.
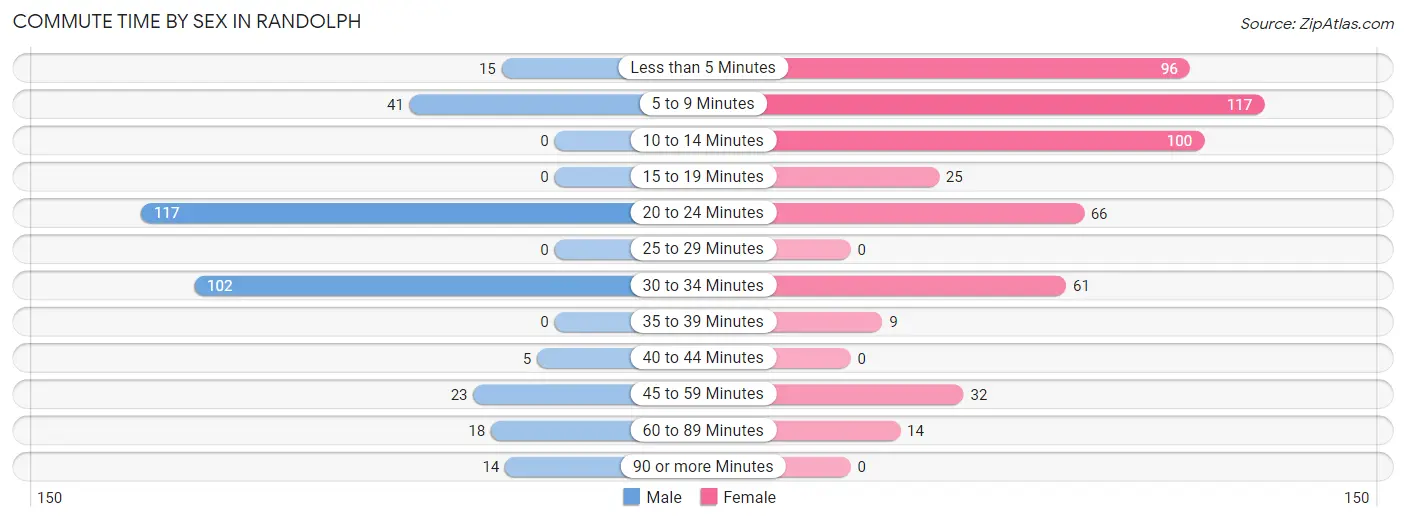
| Commute Time | Male | Female |
| Less than 5 Minutes | 15 (4.5%) | 96 (18.5%) |
| 5 to 9 Minutes | 41 (12.2%) | 117 (22.5%) |
| 10 to 14 Minutes | 0 (0.0%) | 100 (19.2%) |
| 15 to 19 Minutes | 0 (0.0%) | 25 (4.8%) |
| 20 to 24 Minutes | 117 (34.9%) | 66 (12.7%) |
| 25 to 29 Minutes | 0 (0.0%) | 0 (0.0%) |
| 30 to 34 Minutes | 102 (30.4%) | 61 (11.7%) |
| 35 to 39 Minutes | 0 (0.0%) | 9 (1.7%) |
| 40 to 44 Minutes | 5 (1.5%) | 0 (0.0%) |
| 45 to 59 Minutes | 23 (6.9%) | 32 (6.1%) |
| 60 to 89 Minutes | 18 (5.4%) | 14 (2.7%) |
| 90 or more Minutes | 14 (4.2%) | 0 (0.0%) |
Time of Departure to Work by Sex in Randolph
The most frequent times of departure to work in Randolph are 7:00 AM to 7:29 AM (108, 32.2%) for males and 6:30 AM to 6:59 AM (188, 36.1%) for females.
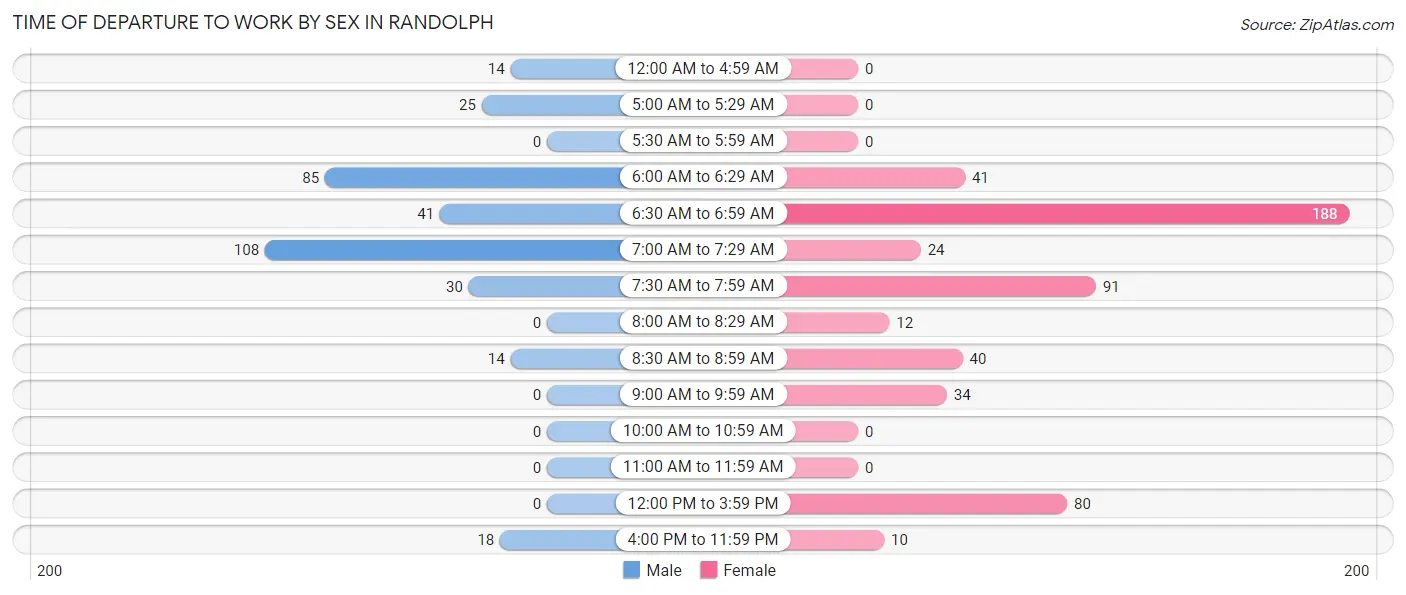
| Time of Departure | Male | Female |
| 12:00 AM to 4:59 AM | 14 (4.2%) | 0 (0.0%) |
| 5:00 AM to 5:29 AM | 25 (7.5%) | 0 (0.0%) |
| 5:30 AM to 5:59 AM | 0 (0.0%) | 0 (0.0%) |
| 6:00 AM to 6:29 AM | 85 (25.4%) | 41 (7.9%) |
| 6:30 AM to 6:59 AM | 41 (12.2%) | 188 (36.1%) |
| 7:00 AM to 7:29 AM | 108 (32.2%) | 24 (4.6%) |
| 7:30 AM to 7:59 AM | 30 (9.0%) | 91 (17.5%) |
| 8:00 AM to 8:29 AM | 0 (0.0%) | 12 (2.3%) |
| 8:30 AM to 8:59 AM | 14 (4.2%) | 40 (7.7%) |
| 9:00 AM to 9:59 AM | 0 (0.0%) | 34 (6.5%) |
| 10:00 AM to 10:59 AM | 0 (0.0%) | 0 (0.0%) |
| 11:00 AM to 11:59 AM | 0 (0.0%) | 0 (0.0%) |
| 12:00 PM to 3:59 PM | 0 (0.0%) | 80 (15.4%) |
| 4:00 PM to 11:59 PM | 18 (5.4%) | 10 (1.9%) |
| Total | 335 (100.0%) | 520 (100.0%) |
Housing Occupancy in Randolph
Occupancy by Ownership in Randolph
Of the total 974 dwellings in Randolph, owner-occupied units account for 505 (51.8%), while renter-occupied units make up 469 (48.1%).
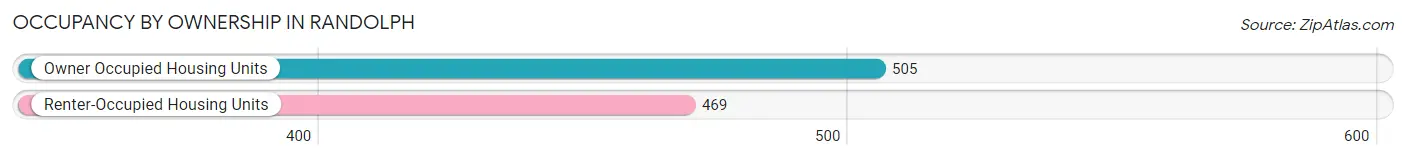
| Occupancy | # Housing Units | % Housing Units |
| Owner Occupied Housing Units | 505 | 51.8% |
| Renter-Occupied Housing Units | 469 | 48.1% |
| Total Occupied Housing Units | 974 | 100.0% |
Occupancy by Household Size in Randolph
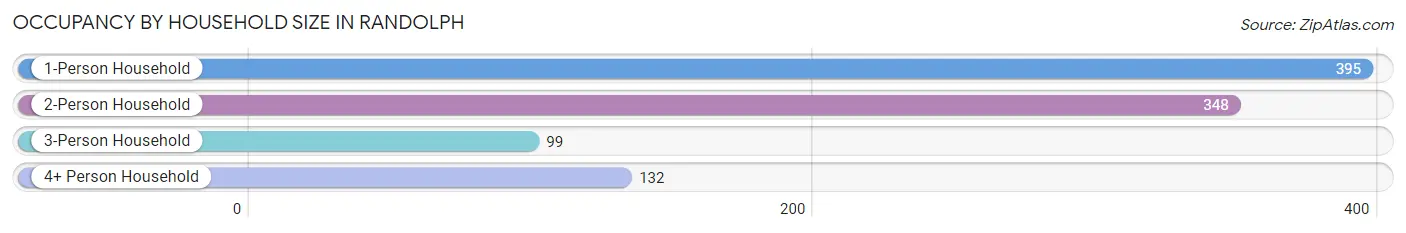
| Household Size | # Housing Units | % Housing Units |
| 1-Person Household | 395 | 40.6% |
| 2-Person Household | 348 | 35.7% |
| 3-Person Household | 99 | 10.2% |
| 4+ Person Household | 132 | 13.6% |
| Total Housing Units | 974 | 100.0% |
Occupancy by Ownership by Household Size in Randolph
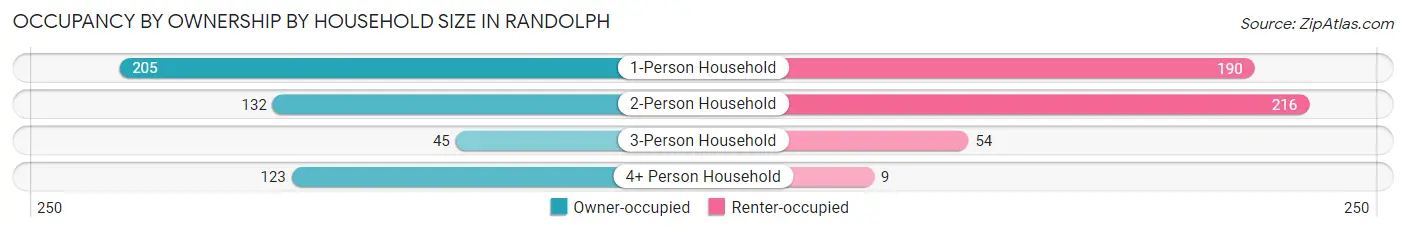
| Household Size | Owner-occupied | Renter-occupied |
| 1-Person Household | 205 (51.9%) | 190 (48.1%) |
| 2-Person Household | 132 (37.9%) | 216 (62.1%) |
| 3-Person Household | 45 (45.5%) | 54 (54.5%) |
| 4+ Person Household | 123 (93.2%) | 9 (6.8%) |
| Total Housing Units | 505 (51.8%) | 469 (48.1%) |
Occupancy by Educational Attainment in Randolph
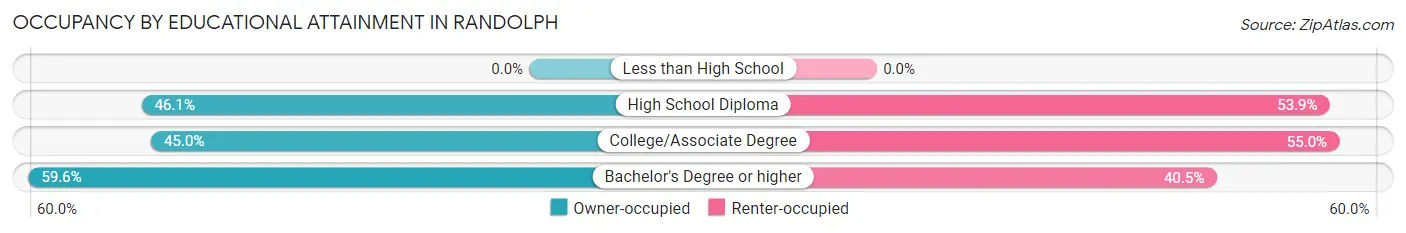
| Household Size | Owner-occupied | Renter-occupied |
| Less than High School | 0 (0.0%) | 0 (0.0%) |
| High School Diploma | 118 (46.1%) | 138 (53.9%) |
| College/Associate Degree | 125 (45.0%) | 153 (55.0%) |
| Bachelor's Degree or higher | 262 (59.6%) | 178 (40.5%) |
Occupancy by Age of Householder in Randolph
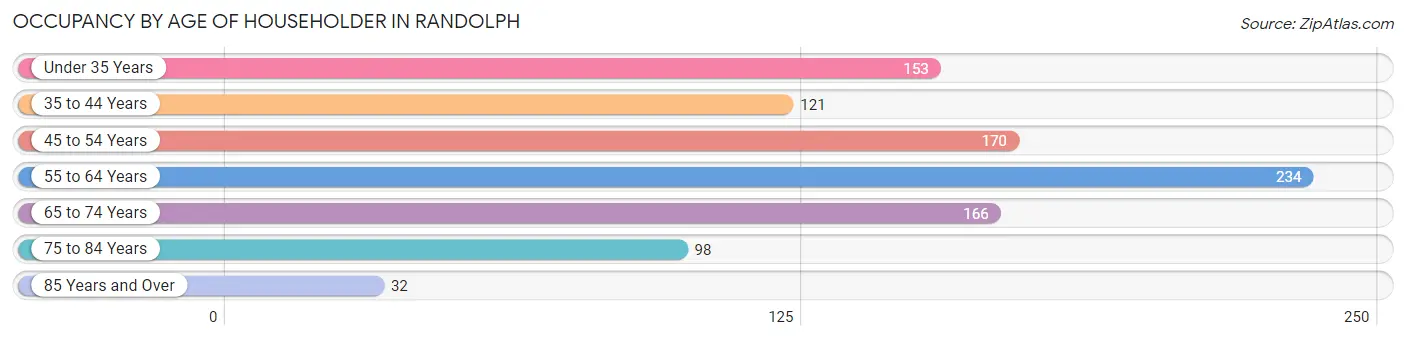
| Age Bracket | # Households | % Households |
| Under 35 Years | 153 | 15.7% |
| 35 to 44 Years | 121 | 12.4% |
| 45 to 54 Years | 170 | 17.4% |
| 55 to 64 Years | 234 | 24.0% |
| 65 to 74 Years | 166 | 17.0% |
| 75 to 84 Years | 98 | 10.1% |
| 85 Years and Over | 32 | 3.3% |
| Total | 974 | 100.0% |
Housing Finances in Randolph
Median Income by Occupancy in Randolph
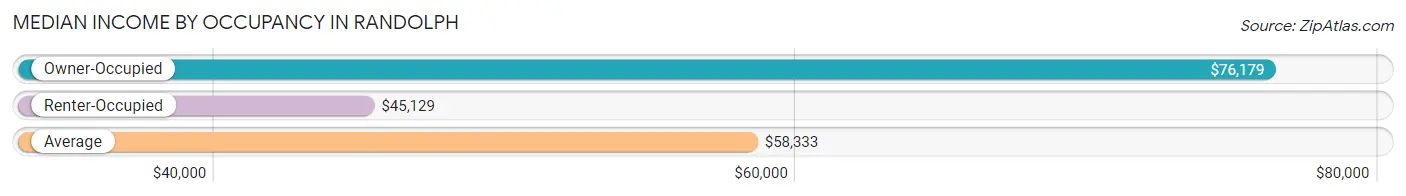
| Occupancy Type | # Households | Median Income |
| Owner-Occupied | 505 (51.8%) | $76,179 |
| Renter-Occupied | 469 (48.1%) | $45,129 |
| Average | 974 (100.0%) | $58,333 |
Occupancy by Householder Income Bracket in Randolph
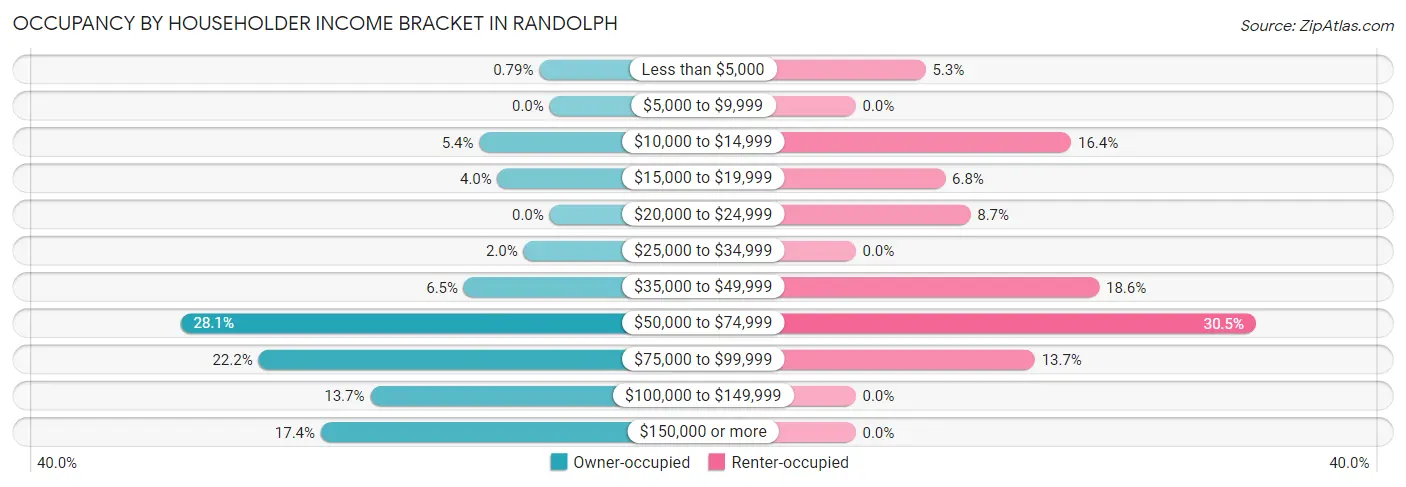
| Income Bracket | Owner-occupied | Renter-occupied |
| Less than $5,000 | 4 (0.8%) | 25 (5.3%) |
| $5,000 to $9,999 | 0 (0.0%) | 0 (0.0%) |
| $10,000 to $14,999 | 27 (5.3%) | 77 (16.4%) |
| $15,000 to $19,999 | 20 (4.0%) | 32 (6.8%) |
| $20,000 to $24,999 | 0 (0.0%) | 41 (8.7%) |
| $25,000 to $34,999 | 10 (2.0%) | 0 (0.0%) |
| $35,000 to $49,999 | 33 (6.5%) | 87 (18.5%) |
| $50,000 to $74,999 | 142 (28.1%) | 143 (30.5%) |
| $75,000 to $99,999 | 112 (22.2%) | 64 (13.7%) |
| $100,000 to $149,999 | 69 (13.7%) | 0 (0.0%) |
| $150,000 or more | 88 (17.4%) | 0 (0.0%) |
| Total | 505 (100.0%) | 469 (100.0%) |
Monthly Housing Cost Tiers in Randolph
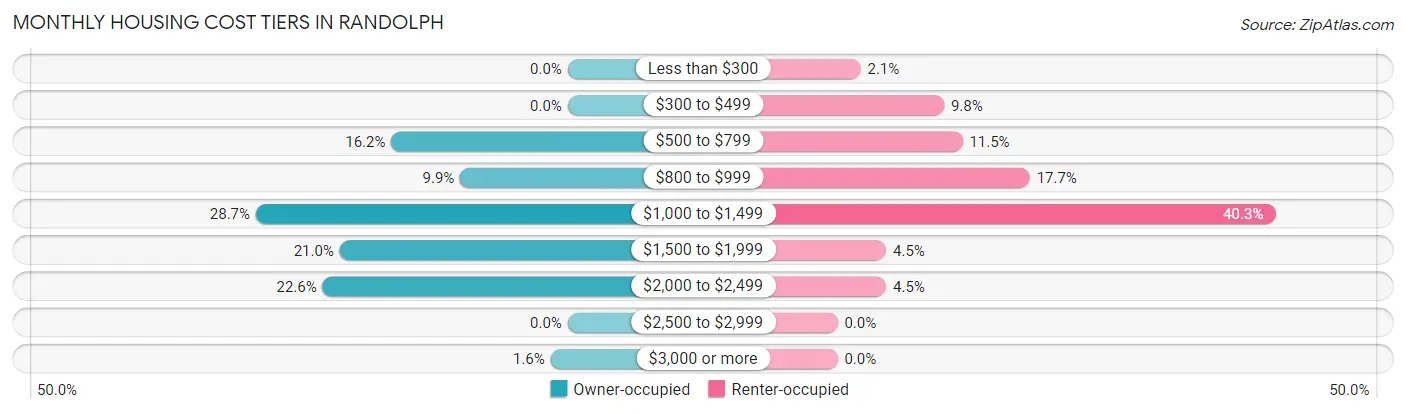
| Monthly Cost | Owner-occupied | Renter-occupied |
| Less than $300 | 0 (0.0%) | 10 (2.1%) |
| $300 to $499 | 0 (0.0%) | 46 (9.8%) |
| $500 to $799 | 82 (16.2%) | 54 (11.5%) |
| $800 to $999 | 50 (9.9%) | 83 (17.7%) |
| $1,000 to $1,499 | 145 (28.7%) | 189 (40.3%) |
| $1,500 to $1,999 | 106 (21.0%) | 21 (4.5%) |
| $2,000 to $2,499 | 114 (22.6%) | 21 (4.5%) |
| $2,500 to $2,999 | 0 (0.0%) | 0 (0.0%) |
| $3,000 or more | 8 (1.6%) | 0 (0.0%) |
| Total | 505 (100.0%) | 469 (100.0%) |
Physical Housing Characteristics in Randolph
Housing Structures in Randolph
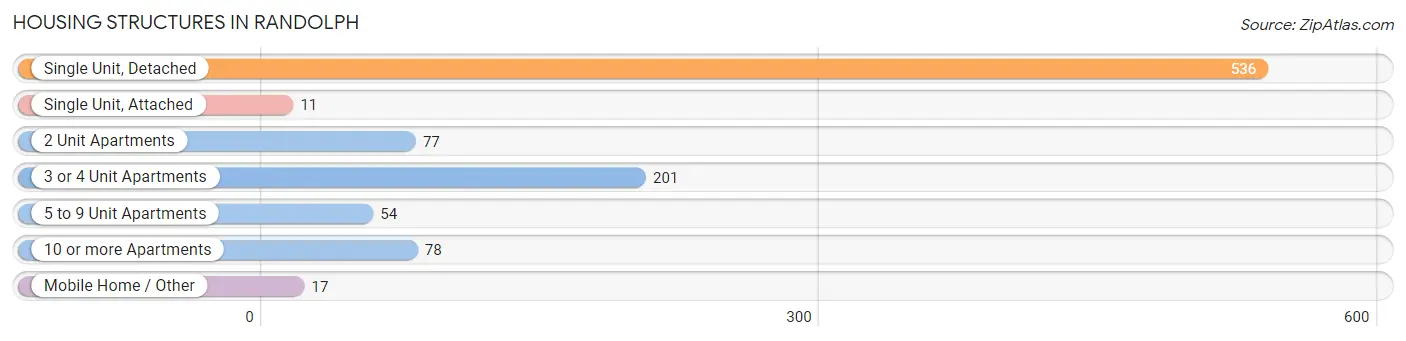
| Structure Type | # Housing Units | % Housing Units |
| Single Unit, Detached | 536 | 55.0% |
| Single Unit, Attached | 11 | 1.1% |
| 2 Unit Apartments | 77 | 7.9% |
| 3 or 4 Unit Apartments | 201 | 20.6% |
| 5 to 9 Unit Apartments | 54 | 5.5% |
| 10 or more Apartments | 78 | 8.0% |
| Mobile Home / Other | 17 | 1.8% |
| Total | 974 | 100.0% |
Housing Structures by Occupancy in Randolph
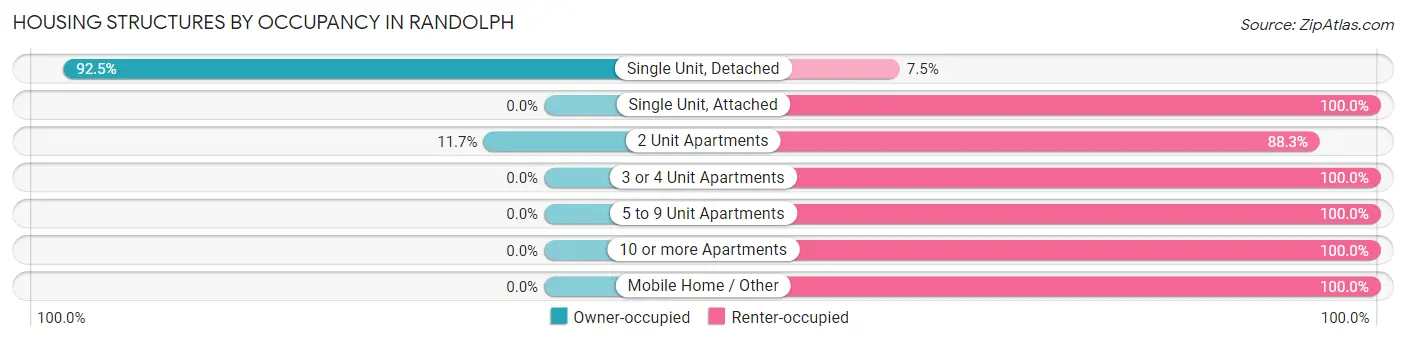
| Structure Type | Owner-occupied | Renter-occupied |
| Single Unit, Detached | 496 (92.5%) | 40 (7.5%) |
| Single Unit, Attached | 0 (0.0%) | 11 (100.0%) |
| 2 Unit Apartments | 9 (11.7%) | 68 (88.3%) |
| 3 or 4 Unit Apartments | 0 (0.0%) | 201 (100.0%) |
| 5 to 9 Unit Apartments | 0 (0.0%) | 54 (100.0%) |
| 10 or more Apartments | 0 (0.0%) | 78 (100.0%) |
| Mobile Home / Other | 0 (0.0%) | 17 (100.0%) |
| Total | 505 (51.8%) | 469 (48.1%) |
Housing Structures by Number of Rooms in Randolph
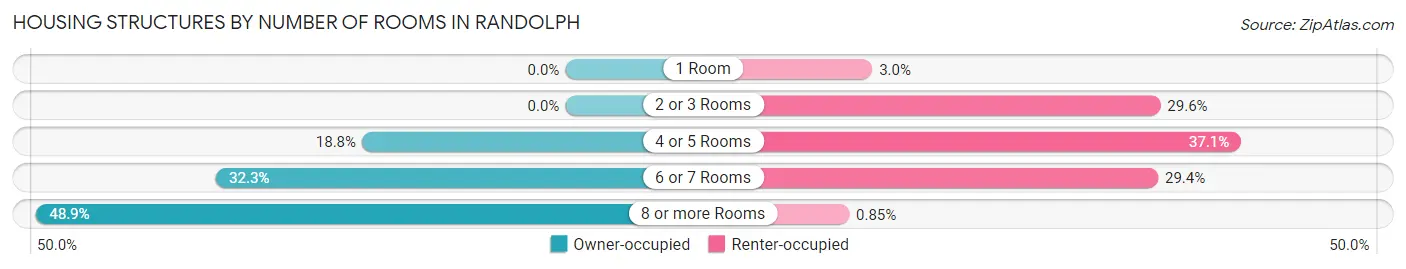
| Number of Rooms | Owner-occupied | Renter-occupied |
| 1 Room | 0 (0.0%) | 14 (3.0%) |
| 2 or 3 Rooms | 0 (0.0%) | 139 (29.6%) |
| 4 or 5 Rooms | 95 (18.8%) | 174 (37.1%) |
| 6 or 7 Rooms | 163 (32.3%) | 138 (29.4%) |
| 8 or more Rooms | 247 (48.9%) | 4 (0.9%) |
| Total | 505 (100.0%) | 469 (100.0%) |
Housing Structure by Heating Type in Randolph
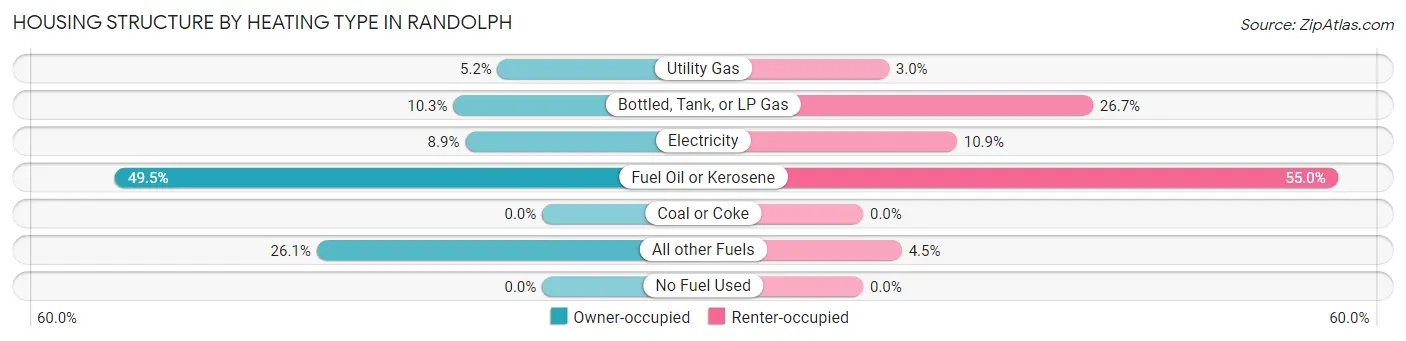
| Heating Type | Owner-occupied | Renter-occupied |
| Utility Gas | 26 (5.1%) | 14 (3.0%) |
| Bottled, Tank, or LP Gas | 52 (10.3%) | 125 (26.7%) |
| Electricity | 45 (8.9%) | 51 (10.9%) |
| Fuel Oil or Kerosene | 250 (49.5%) | 258 (55.0%) |
| Coal or Coke | 0 (0.0%) | 0 (0.0%) |
| All other Fuels | 132 (26.1%) | 21 (4.5%) |
| No Fuel Used | 0 (0.0%) | 0 (0.0%) |
| Total | 505 (100.0%) | 469 (100.0%) |
Household Vehicle Usage in Randolph
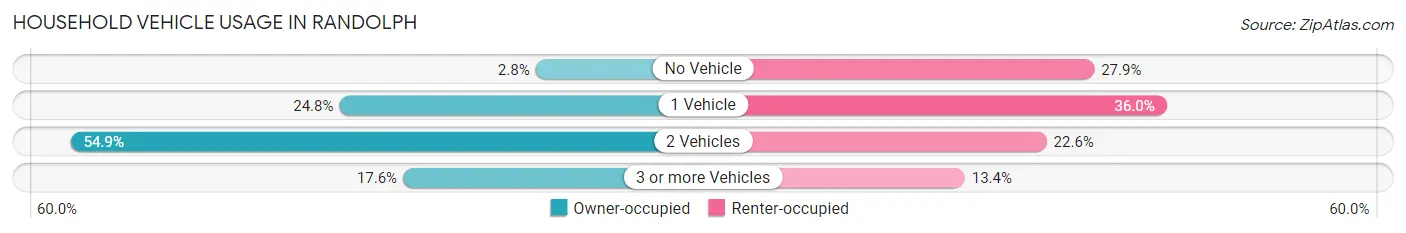
| Vehicles per Household | Owner-occupied | Renter-occupied |
| No Vehicle | 14 (2.8%) | 131 (27.9%) |
| 1 Vehicle | 125 (24.7%) | 169 (36.0%) |
| 2 Vehicles | 277 (54.8%) | 106 (22.6%) |
| 3 or more Vehicles | 89 (17.6%) | 63 (13.4%) |
| Total | 505 (100.0%) | 469 (100.0%) |
Real Estate & Mortgages in Randolph
Real Estate and Mortgage Overview in Randolph
| Characteristic | Without Mortgage | With Mortgage |
| Housing Units | 141 | 364 |
| Median Property Value | $321,000 | $198,600 |
| Median Household Income | $49,375 | $58 |
| Monthly Housing Costs | $835 | $8 |
| Real Estate Taxes | $5,583 | $0 |
Property Value by Mortgage Status in Randolph
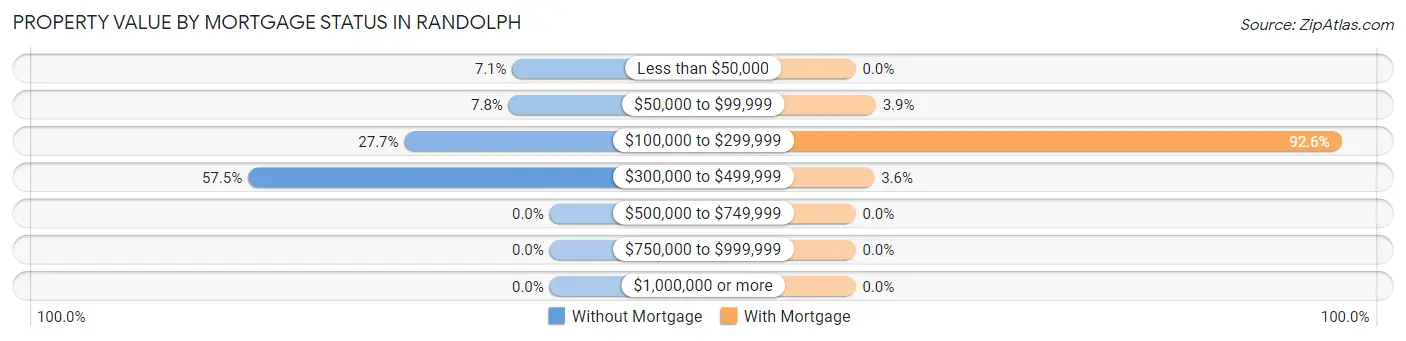
| Property Value | Without Mortgage | With Mortgage |
| Less than $50,000 | 10 (7.1%) | 0 (0.0%) |
| $50,000 to $99,999 | 11 (7.8%) | 14 (3.8%) |
| $100,000 to $299,999 | 39 (27.7%) | 337 (92.6%) |
| $300,000 to $499,999 | 81 (57.5%) | 13 (3.6%) |
| $500,000 to $749,999 | 0 (0.0%) | 0 (0.0%) |
| $750,000 to $999,999 | 0 (0.0%) | 0 (0.0%) |
| $1,000,000 or more | 0 (0.0%) | 0 (0.0%) |
| Total | 141 (100.0%) | 364 (100.0%) |
Household Income by Mortgage Status in Randolph
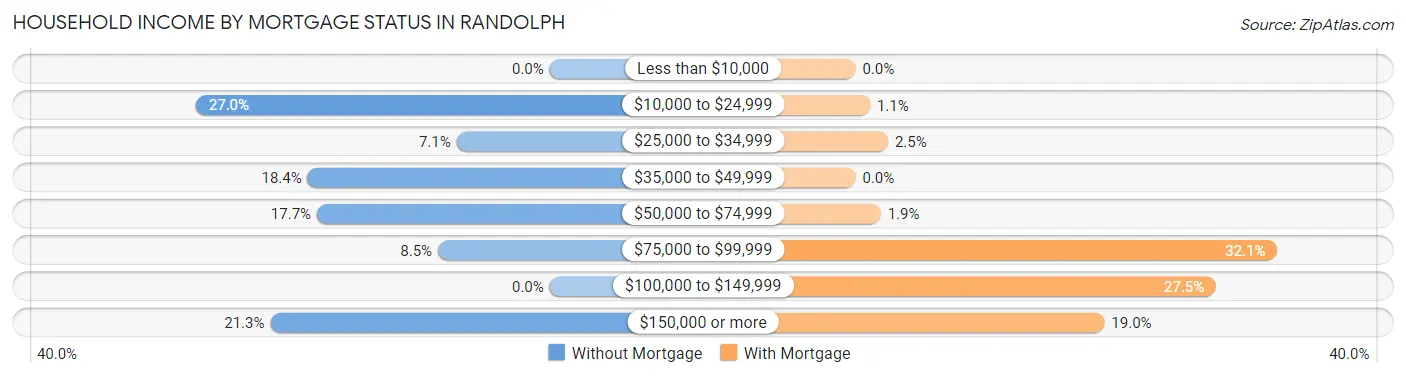
| Household Income | Without Mortgage | With Mortgage |
| Less than $10,000 | 0 (0.0%) | 0 (0.0%) |
| $10,000 to $24,999 | 38 (27.0%) | 4 (1.1%) |
| $25,000 to $34,999 | 10 (7.1%) | 9 (2.5%) |
| $35,000 to $49,999 | 26 (18.4%) | 0 (0.0%) |
| $50,000 to $74,999 | 25 (17.7%) | 7 (1.9%) |
| $75,000 to $99,999 | 12 (8.5%) | 117 (32.1%) |
| $100,000 to $149,999 | 0 (0.0%) | 100 (27.5%) |
| $150,000 or more | 30 (21.3%) | 69 (19.0%) |
| Total | 141 (100.0%) | 364 (100.0%) |
Property Value to Household Income Ratio in Randolph
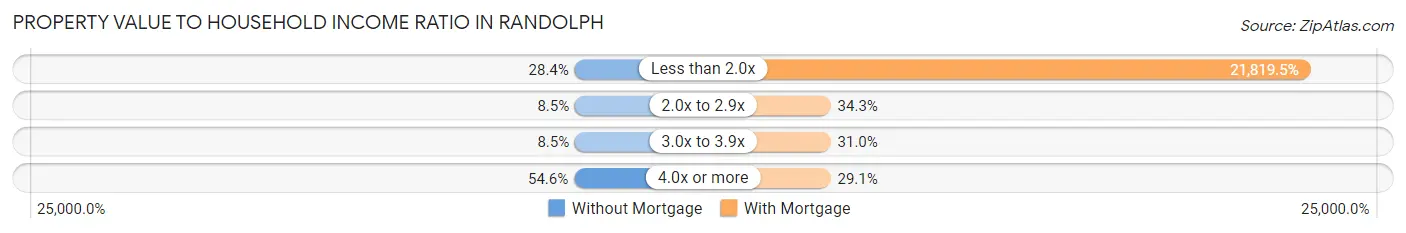
| Value-to-Income Ratio | Without Mortgage | With Mortgage |
| Less than 2.0x | 40 (28.4%) | 79,423 (21,819.5%) |
| 2.0x to 2.9x | 12 (8.5%) | 125 (34.3%) |
| 3.0x to 3.9x | 12 (8.5%) | 113 (31.0%) |
| 4.0x or more | 77 (54.6%) | 106 (29.1%) |
| Total | 141 (100.0%) | 364 (100.0%) |
Real Estate Taxes by Mortgage Status in Randolph
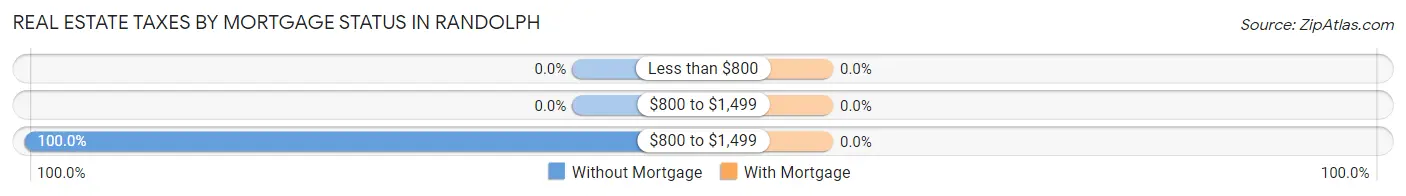
| Property Taxes | Without Mortgage | With Mortgage |
| Less than $800 | 0 (0.0%) | 0 (0.0%) |
| $800 to $1,499 | 0 (0.0%) | 0 (0.0%) |
| $800 to $1,499 | 141 (100.0%) | 0 (0.0%) |
| Total | 141 (100.0%) | 364 (100.0%) |
Health & Disability in Randolph
Health Insurance Coverage by Age in Randolph
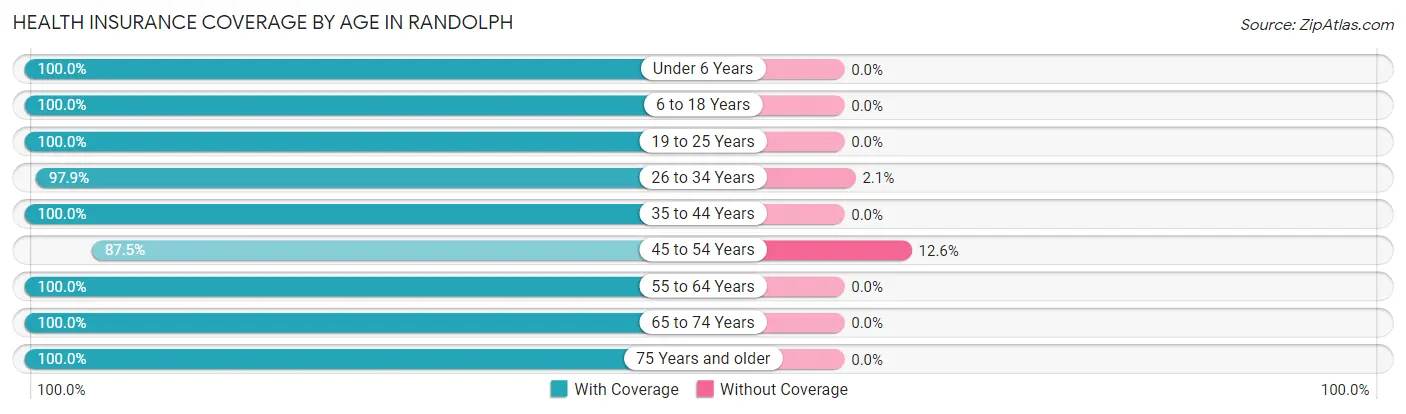
| Age Bracket | With Coverage | Without Coverage |
| Under 6 Years | 101 (100.0%) | 0 (0.0%) |
| 6 to 18 Years | 202 (100.0%) | 0 (0.0%) |
| 19 to 25 Years | 256 (100.0%) | 0 (0.0%) |
| 26 to 34 Years | 187 (97.9%) | 4 (2.1%) |
| 35 to 44 Years | 196 (100.0%) | 0 (0.0%) |
| 45 to 54 Years | 237 (87.5%) | 34 (12.6%) |
| 55 to 64 Years | 367 (100.0%) | 0 (0.0%) |
| 65 to 74 Years | 237 (100.0%) | 0 (0.0%) |
| 75 Years and older | 153 (100.0%) | 0 (0.0%) |
| Total | 1,936 (98.1%) | 38 (1.9%) |
Health Insurance Coverage by Citizenship Status in Randolph
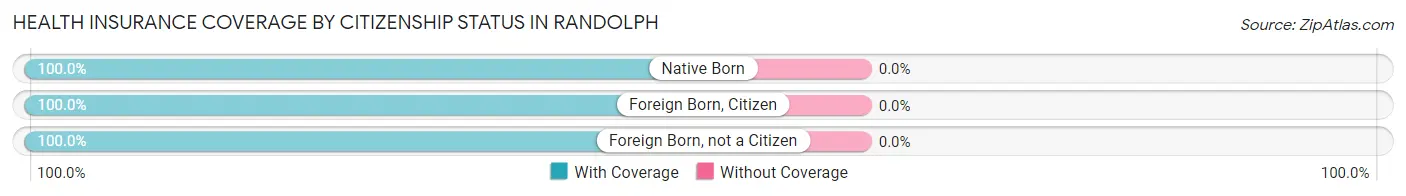
| Citizenship Status | With Coverage | Without Coverage |
| Native Born | 101 (100.0%) | 0 (0.0%) |
| Foreign Born, Citizen | 202 (100.0%) | 0 (0.0%) |
| Foreign Born, not a Citizen | 256 (100.0%) | 0 (0.0%) |
Health Insurance Coverage by Household Income in Randolph
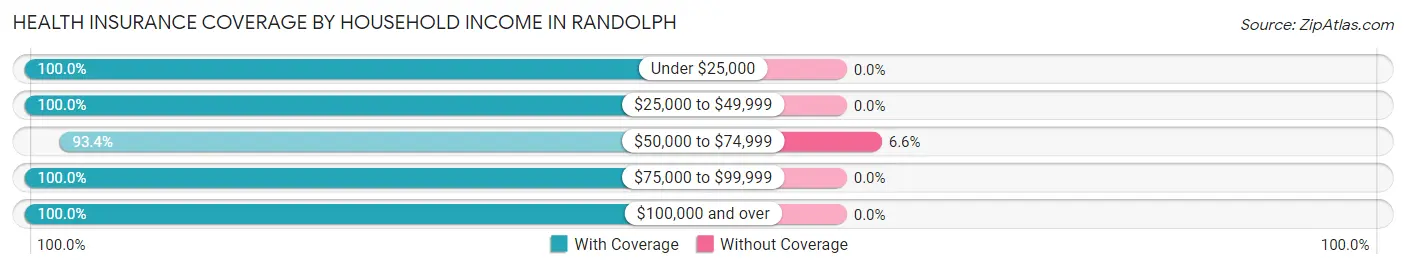
| Household Income | With Coverage | Without Coverage |
| Under $25,000 | 262 (100.0%) | 0 (0.0%) |
| $25,000 to $49,999 | 230 (100.0%) | 0 (0.0%) |
| $50,000 to $74,999 | 541 (93.4%) | 38 (6.6%) |
| $75,000 to $99,999 | 381 (100.0%) | 0 (0.0%) |
| $100,000 and over | 489 (100.0%) | 0 (0.0%) |
Public vs Private Health Insurance Coverage by Age in Randolph
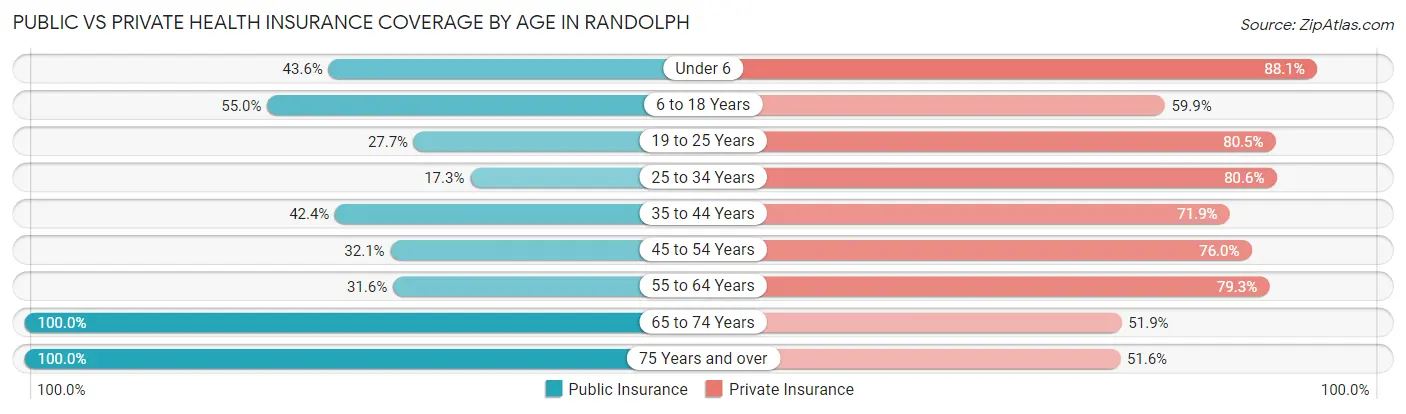
| Age Bracket | Public Insurance | Private Insurance |
| Under 6 | 44 (43.6%) | 89 (88.1%) |
| 6 to 18 Years | 111 (54.9%) | 121 (59.9%) |
| 19 to 25 Years | 71 (27.7%) | 206 (80.5%) |
| 25 to 34 Years | 33 (17.3%) | 154 (80.6%) |
| 35 to 44 Years | 83 (42.3%) | 141 (71.9%) |
| 45 to 54 Years | 87 (32.1%) | 206 (76.0%) |
| 55 to 64 Years | 116 (31.6%) | 291 (79.3%) |
| 65 to 74 Years | 237 (100.0%) | 123 (51.9%) |
| 75 Years and over | 153 (100.0%) | 79 (51.6%) |
| Total | 935 (47.4%) | 1,410 (71.4%) |
Disability Status by Sex by Age in Randolph
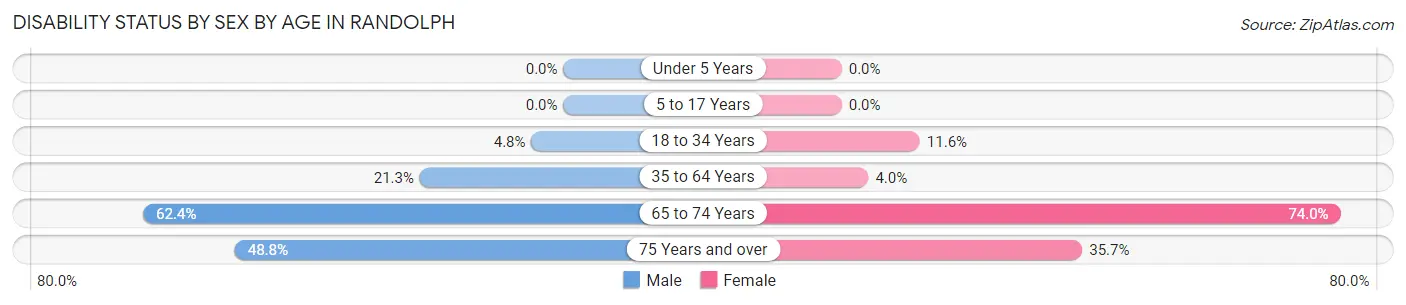
| Age Bracket | Male | Female |
| Under 5 Years | 0 (0.0%) | 0 (0.0%) |
| 5 to 17 Years | 0 (0.0%) | 0 (0.0%) |
| 18 to 34 Years | 15 (4.8%) | 21 (11.6%) |
| 35 to 64 Years | 81 (21.3%) | 18 (4.0%) |
| 65 to 74 Years | 83 (62.4%) | 77 (74.0%) |
| 75 Years and over | 20 (48.8%) | 40 (35.7%) |
Disability Class by Sex by Age in Randolph
Disability Class: Hearing Difficulty
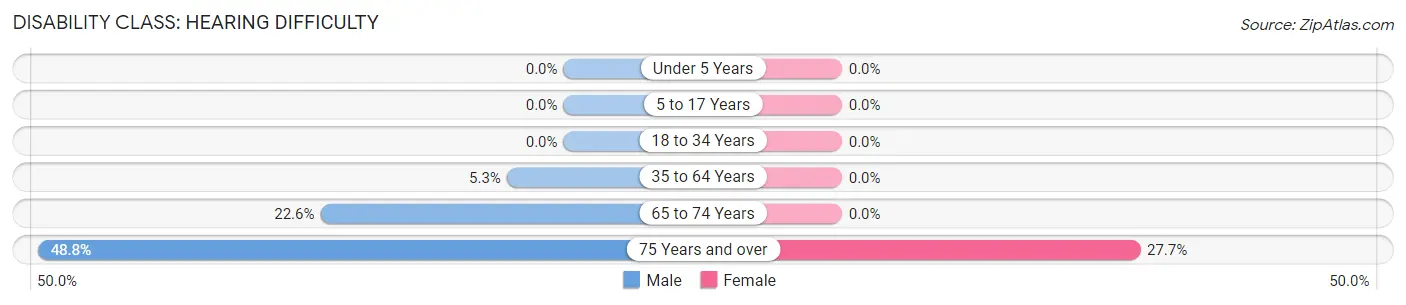
| Age Bracket | Male | Female |
| Under 5 Years | 0 (0.0%) | 0 (0.0%) |
| 5 to 17 Years | 0 (0.0%) | 0 (0.0%) |
| 18 to 34 Years | 0 (0.0%) | 0 (0.0%) |
| 35 to 64 Years | 20 (5.3%) | 0 (0.0%) |
| 65 to 74 Years | 30 (22.6%) | 0 (0.0%) |
| 75 Years and over | 20 (48.8%) | 31 (27.7%) |
Disability Class: Vision Difficulty
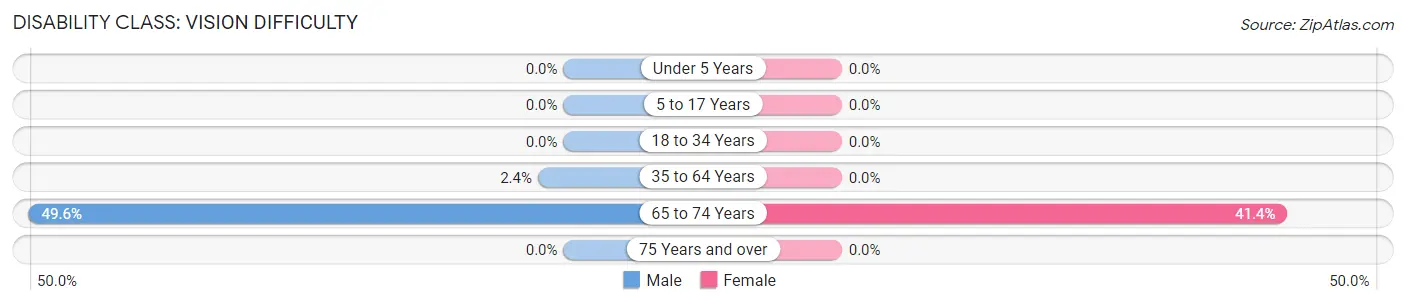
| Age Bracket | Male | Female |
| Under 5 Years | 0 (0.0%) | 0 (0.0%) |
| 5 to 17 Years | 0 (0.0%) | 0 (0.0%) |
| 18 to 34 Years | 0 (0.0%) | 0 (0.0%) |
| 35 to 64 Years | 9 (2.4%) | 0 (0.0%) |
| 65 to 74 Years | 66 (49.6%) | 43 (41.3%) |
| 75 Years and over | 0 (0.0%) | 0 (0.0%) |
Disability Class: Cognitive Difficulty
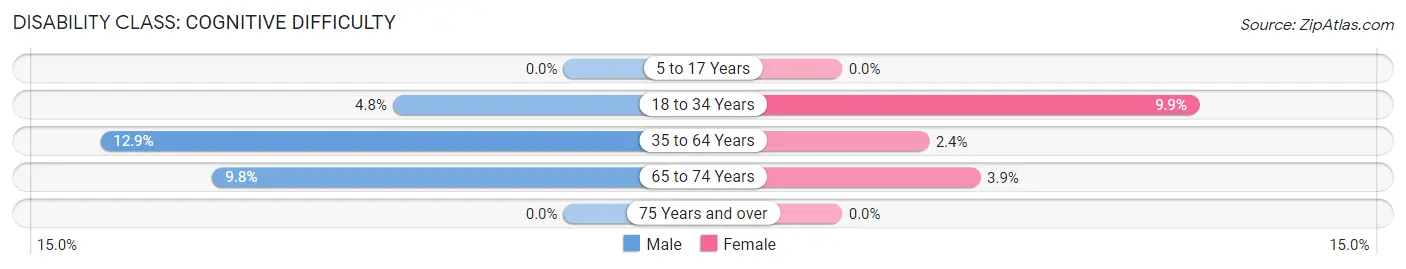
| Age Bracket | Male | Female |
| 5 to 17 Years | 0 (0.0%) | 0 (0.0%) |
| 18 to 34 Years | 15 (4.8%) | 18 (9.9%) |
| 35 to 64 Years | 49 (12.9%) | 11 (2.4%) |
| 65 to 74 Years | 13 (9.8%) | 4 (3.8%) |
| 75 Years and over | 0 (0.0%) | 0 (0.0%) |
Disability Class: Ambulatory Difficulty
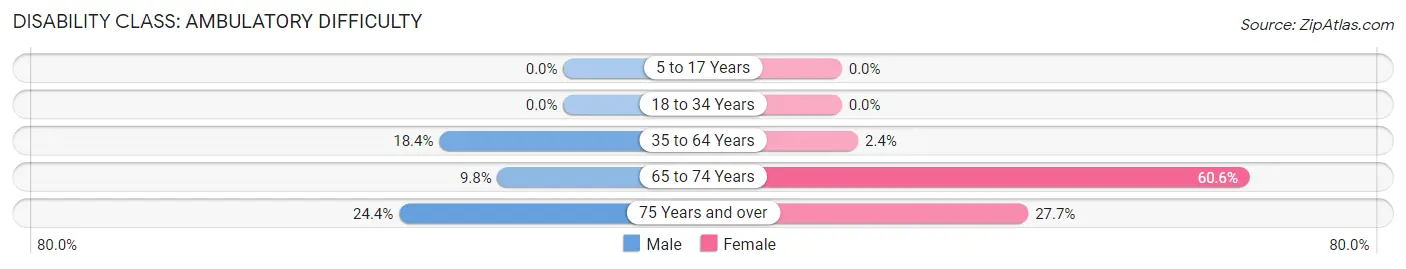
| Age Bracket | Male | Female |
| 5 to 17 Years | 0 (0.0%) | 0 (0.0%) |
| 18 to 34 Years | 0 (0.0%) | 0 (0.0%) |
| 35 to 64 Years | 70 (18.4%) | 11 (2.4%) |
| 65 to 74 Years | 13 (9.8%) | 63 (60.6%) |
| 75 Years and over | 10 (24.4%) | 31 (27.7%) |
Disability Class: Self-Care Difficulty
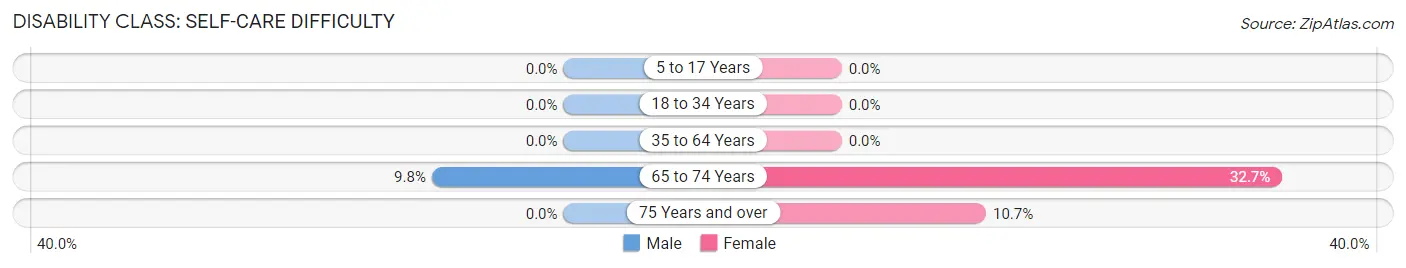
| Age Bracket | Male | Female |
| 5 to 17 Years | 0 (0.0%) | 0 (0.0%) |
| 18 to 34 Years | 0 (0.0%) | 0 (0.0%) |
| 35 to 64 Years | 0 (0.0%) | 0 (0.0%) |
| 65 to 74 Years | 13 (9.8%) | 34 (32.7%) |
| 75 Years and over | 0 (0.0%) | 12 (10.7%) |
Technology Access in Randolph
Computing Device Access in Randolph
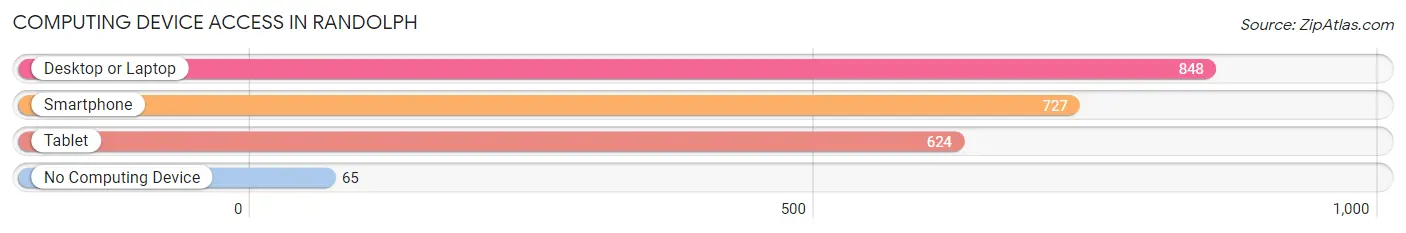
| Device Type | # Households | % Households |
| Desktop or Laptop | 848 | 87.1% |
| Smartphone | 727 | 74.6% |
| Tablet | 624 | 64.1% |
| No Computing Device | 65 | 6.7% |
| Total | 974 | 100.0% |
Internet Access in Randolph
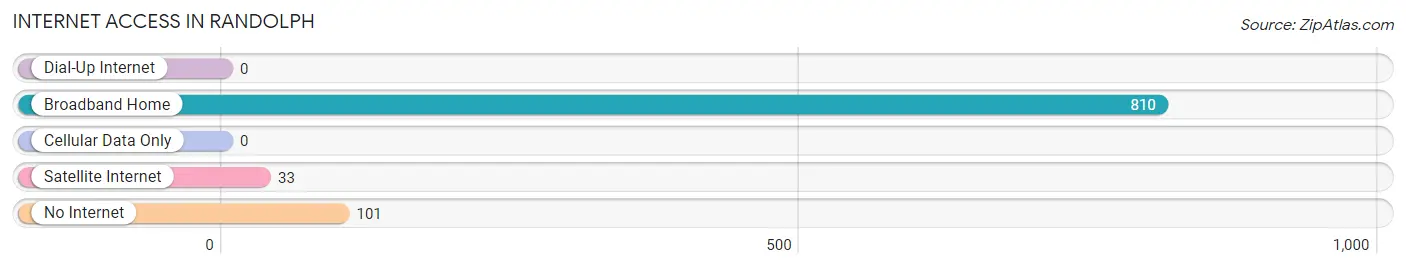
| Internet Type | # Households | % Households |
| Dial-Up Internet | 0 | 0.0% |
| Broadband Home | 810 | 83.2% |
| Cellular Data Only | 0 | 0.0% |
| Satellite Internet | 33 | 3.4% |
| No Internet | 101 | 10.4% |
| Total | 974 | 100.0% |
Randolph Summary
Randolph, Vermont is a small town located in the heart of the Green Mountains in central Vermont. It is the county seat of Orange County and is home to a population of approximately 5,000 people. The town was founded in 1781 and has a rich history of farming, logging, and manufacturing.
Geography
Randolph is located in the center of Orange County, Vermont, and is bordered by the towns of Bethel, Brookfield, Braintree, and Granville. The town is situated in the Green Mountains, and is surrounded by rolling hills and forests. The White River runs through the town, and there are several small lakes and ponds in the area. The highest point in Randolph is the summit of Mount Hunger, which stands at 2,890 feet.
Economy
Randolph has a diverse economy, with a mix of agriculture, manufacturing, and tourism. Agriculture is the main industry in the area, with dairy farming being the most common type of farming. There are also several small farms that produce vegetables, fruits, and other crops. Manufacturing is also an important part of the local economy, with several small factories producing a variety of products. Tourism is also an important part of the local economy, with many visitors coming to the area to enjoy the natural beauty of the Green Mountains.
Demographics
As of the 2010 census, the population of Randolph was 5,037. The racial makeup of the town was 95.3% White, 0.7% African American, 0.3% Native American, 0.7% Asian, 0.1% Pacific Islander, 0.7% from other races, and 2.0% from two or more races. Hispanic or Latino of any race were 1.7% of the population. The median income for a household in the town was $41,944, and the median income for a family was $50,917.
Conclusion
Randolph, Vermont is a small town with a rich history and a diverse economy. Agriculture, manufacturing, and tourism are all important parts of the local economy, and the town is home to a population of approximately 5,000 people. The town is surrounded by the beauty of the Green Mountains, and is a popular destination for visitors looking to enjoy the natural beauty of the area.
Common Questions
What is the Total Population of Randolph?
Total Population of Randolph is 2,010.
What is the Total Male Population of Randolph?
Total Male Population of Randolph is 1,041.
What is the Total Female Population of Randolph?
Total Female Population of Randolph is 969.
What is the Ratio of Males per 100 Females in Randolph?
There are 107.43 Males per 100 Females in Randolph.
What is the Ratio of Females per 100 Males in Randolph?
There are 93.08 Females per 100 Males in Randolph.
What is the Median Population Age in Randolph?
Median Population Age in Randolph is 49.4 Years.
What is the Average Family Size in Randolph
Average Family Size in Randolph is 2.7 People.
What is the Average Household Size in Randolph
Average Household Size in Randolph is 2.0 People.
What is Per Capita Income in Randolph?
Per Capita income in Randolph is $31,940.
What is the Median Family Income in Randolph?
Median Family Income in Randolph is $72,331.
What is the Median Household income in Randolph?
Median Household Income in Randolph is $58,333.
What is Income or Wage Gap in Randolph?
Income or Wage Gap in Randolph is 13.3%.
Women in Randolph earn 86.7 cents for every dollar earned by a man.
What is Inequality or Gini Index in Randolph?
Inequality or Gini Index in Randolph is 0.37.
How Large is the Labor Force in Randolph?
There are 1,197 People in the Labor Forcein in Randolph.
What is the Percentage of People in the Labor Force in Randolph?
66.0% of People are in the Labor Force in Randolph.
What is the Unemployment Rate in Randolph?
Unemployment Rate in Randolph is 7.7%.