Waterbury, VT
Waterbury Map
Waterbury Overview
1,686
TOTAL POPULATION
822
MALE POPULATION
864
FEMALE POPULATION
95.14
MALES / 100 FEMALES
105.11
FEMALES / 100 MALES
40.9
MEDIAN AGE
3.2
AVG FAMILY SIZE
1.9
AVG HOUSEHOLD SIZE
$37,116
PER CAPITA INCOME
$92,188
AVG FAMILY INCOME
$55,655
AVG HOUSEHOLD INCOME
7.1%
WAGE / INCOME GAP [ % ]
92.9¢/ $1
WAGE / INCOME GAP [ $ ]
0.44
INEQUALITY / GINI INDEX
883
LABOR FORCE [ PEOPLE ]
64.2%
PERCENT IN LABOR FORCE
2.5%
UNEMPLOYMENT RATE
Waterbury Zip Codes
Waterbury Area Codes
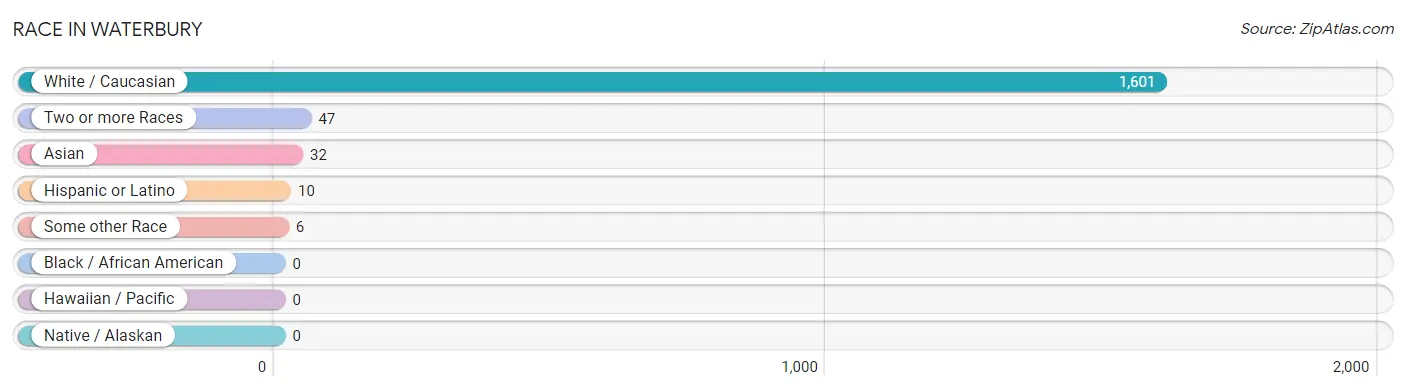
Race in Waterbury
The most populous races in Waterbury are White / Caucasian (1,601 | 95.0%), Two or more Races (47 | 2.8%), and Asian (32 | 1.9%).
| Race | # Population | % Population |
| Asian | 32 | 1.9% |
| Black / African American | 0 | 0.0% |
| Hawaiian / Pacific | 0 | 0.0% |
| Hispanic or Latino | 10 | 0.6% |
| Native / Alaskan | 0 | 0.0% |
| White / Caucasian | 1,601 | 95.0% |
| Two or more Races | 47 | 2.8% |
| Some other Race | 6 | 0.4% |
| Total | 1,686 | 100.0% |
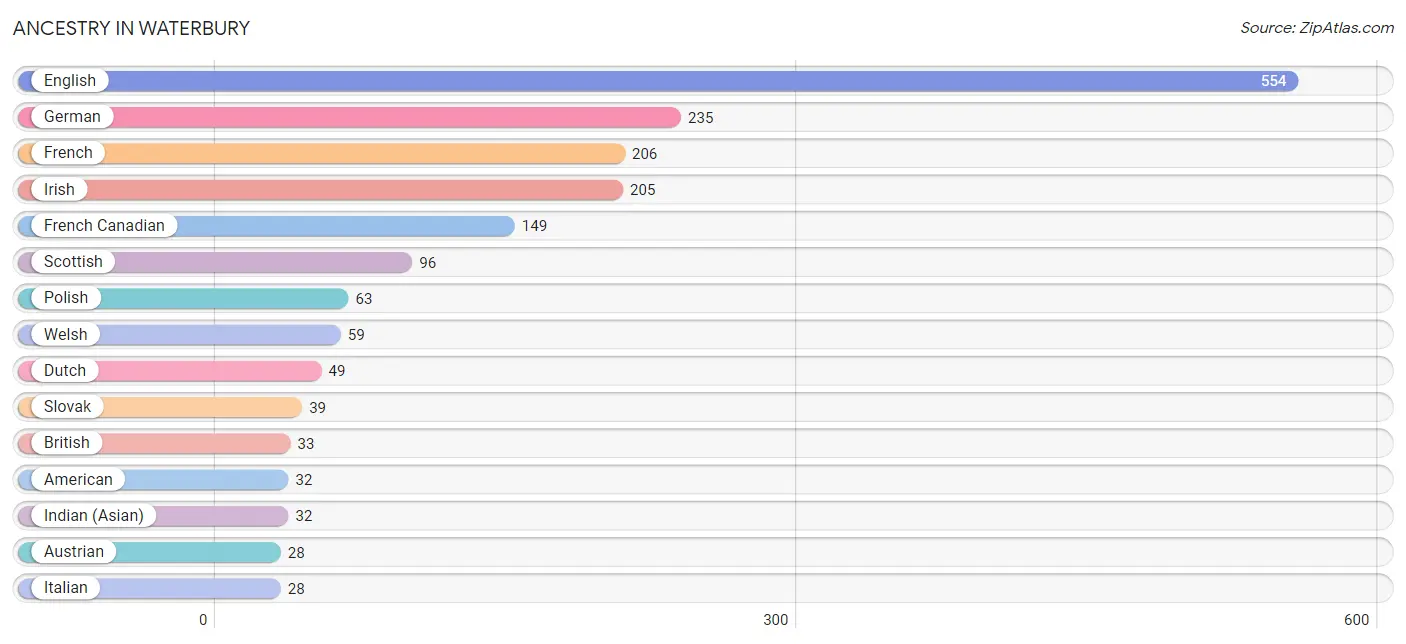
Ancestry in Waterbury
The most populous ancestries reported in Waterbury are English (554 | 32.9%), German (235 | 13.9%), French (206 | 12.2%), Irish (205 | 12.2%), and French Canadian (149 | 8.8%), together accounting for 80.0% of all Waterbury residents.
| Ancestry | # Population | % Population |
| American | 32 | 1.9% |
| Austrian | 28 | 1.7% |
| British | 33 | 2.0% |
| Colombian | 5 | 0.3% |
| Danish | 7 | 0.4% |
| Dutch | 49 | 2.9% |
| English | 554 | 32.9% |
| European | 6 | 0.4% |
| French | 206 | 12.2% |
| French Canadian | 149 | 8.8% |
| German | 235 | 13.9% |
| Greek | 1 | 0.1% |
| Indian (Asian) | 32 | 1.9% |
| Irish | 205 | 12.2% |
| Italian | 28 | 1.7% |
| Mexican | 4 | 0.2% |
| Norwegian | 20 | 1.2% |
| Polish | 63 | 3.7% |
| Puerto Rican | 1 | 0.1% |
| Russian | 26 | 1.5% |
| Scotch-Irish | 13 | 0.8% |
| Scottish | 96 | 5.7% |
| Slovak | 39 | 2.3% |
| South American | 5 | 0.3% |
| Swedish | 12 | 0.7% |
| Welsh | 59 | 3.5% | View All 26 Rows |
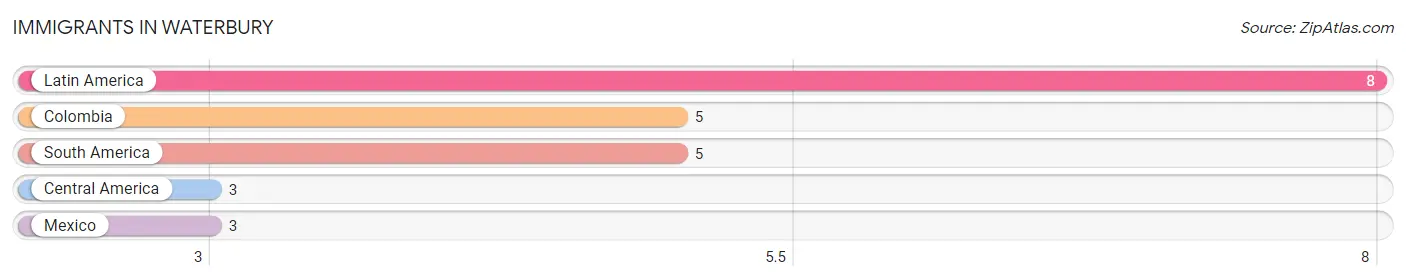
Immigrants in Waterbury
The most numerous immigrant groups reported in Waterbury came from Latin America (8 | 0.5%), Colombia (5 | 0.3%), South America (5 | 0.3%), Central America (3 | 0.2%), and Mexico (3 | 0.2%), together accounting for 1.4% of all Waterbury residents.
| Immigration Origin | # Population | % Population |
| Central America | 3 | 0.2% |
| Colombia | 5 | 0.3% |
| Latin America | 8 | 0.5% |
| Mexico | 3 | 0.2% |
| South America | 5 | 0.3% | View All 5 Rows |
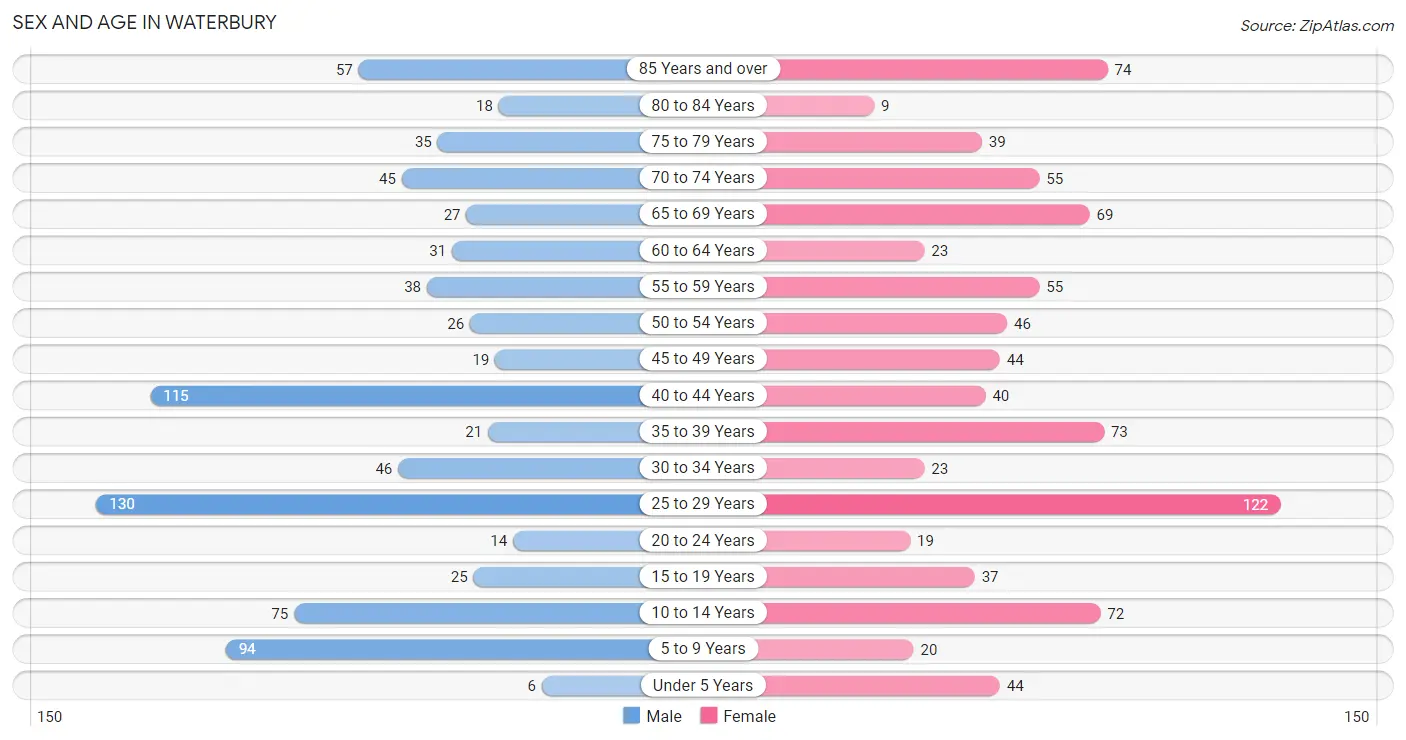
Sex and Age in Waterbury
Sex and Age in Waterbury
The most populous age groups in Waterbury are 25 to 29 Years (130 | 15.8%) for men and 25 to 29 Years (122 | 14.1%) for women.
| Age Bracket | Male | Female |
| Under 5 Years | 6 (0.7%) | 44 (5.1%) |
| 5 to 9 Years | 94 (11.4%) | 20 (2.3%) |
| 10 to 14 Years | 75 (9.1%) | 72 (8.3%) |
| 15 to 19 Years | 25 (3.0%) | 37 (4.3%) |
| 20 to 24 Years | 14 (1.7%) | 19 (2.2%) |
| 25 to 29 Years | 130 (15.8%) | 122 (14.1%) |
| 30 to 34 Years | 46 (5.6%) | 23 (2.7%) |
| 35 to 39 Years | 21 (2.5%) | 73 (8.5%) |
| 40 to 44 Years | 115 (14.0%) | 40 (4.6%) |
| 45 to 49 Years | 19 (2.3%) | 44 (5.1%) |
| 50 to 54 Years | 26 (3.2%) | 46 (5.3%) |
| 55 to 59 Years | 38 (4.6%) | 55 (6.4%) |
| 60 to 64 Years | 31 (3.8%) | 23 (2.7%) |
| 65 to 69 Years | 27 (3.3%) | 69 (8.0%) |
| 70 to 74 Years | 45 (5.5%) | 55 (6.4%) |
| 75 to 79 Years | 35 (4.3%) | 39 (4.5%) |
| 80 to 84 Years | 18 (2.2%) | 9 (1.0%) |
| 85 Years and over | 57 (6.9%) | 74 (8.6%) |
| Total | 822 (100.0%) | 864 (100.0%) |
Families and Households in Waterbury
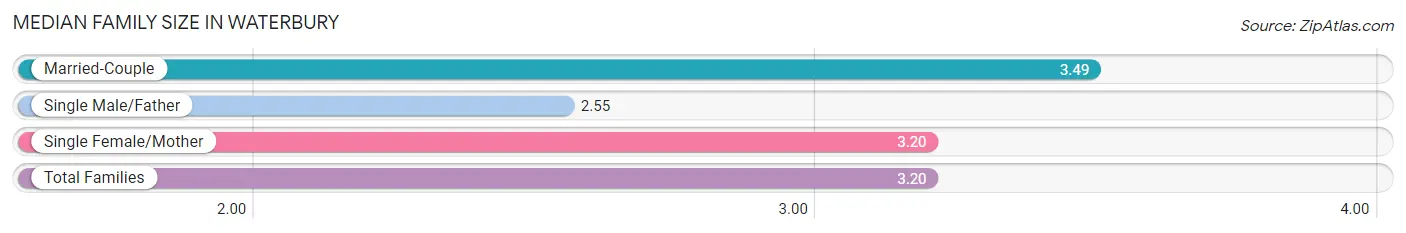
Median Family Size in Waterbury
The median family size in Waterbury is 3.20 persons per family, with married-couple families (163 | 57.2%) accounting for the largest median family size of 3.49 persons per family. On the other hand, single male/father families (71 | 24.9%) represent the smallest median family size with 2.55 persons per family.
| Family Type | # Families | Family Size |
| Married-Couple | 163 (57.2%) | 3.49 |
| Single Male/Father | 71 (24.9%) | 2.55 |
| Single Female/Mother | 51 (17.9%) | 3.20 |
| Total Families | 285 (100.0%) | 3.20 |
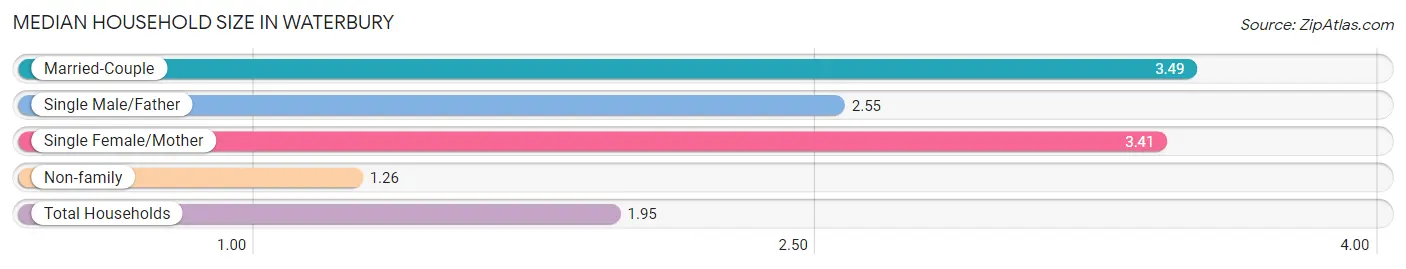
Median Household Size in Waterbury
The median household size in Waterbury is 1.95 persons per household, with married-couple households (163 | 19.9%) accounting for the largest median household size of 3.49 persons per household. non-family households (534 | 65.2%) represent the smallest median household size with 1.26 persons per household.
| Household Type | # Households | Household Size |
| Married-Couple | 163 (19.9%) | 3.49 |
| Single Male/Father | 71 (8.7%) | 2.55 |
| Single Female/Mother | 51 (6.2%) | 3.41 |
| Non-family | 534 (65.2%) | 1.26 |
| Total Households | 819 (100.0%) | 1.95 |
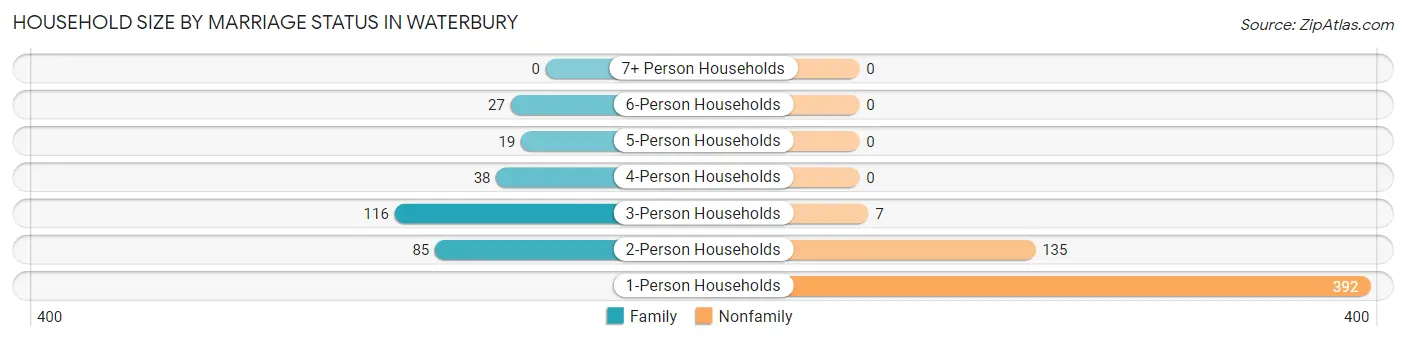
Household Size by Marriage Status in Waterbury
Out of a total of 819 households in Waterbury, 285 (34.8%) are family households, while 534 (65.2%) are nonfamily households. The most numerous type of family households are 3-person households, comprising 116, and the most common type of nonfamily households are 1-person households, comprising 392.
| Household Size | Family Households | Nonfamily Households |
| 1-Person Households | - | 392 (47.9%) |
| 2-Person Households | 85 (10.4%) | 135 (16.5%) |
| 3-Person Households | 116 (14.2%) | 7 (0.9%) |
| 4-Person Households | 38 (4.6%) | 0 (0.0%) |
| 5-Person Households | 19 (2.3%) | 0 (0.0%) |
| 6-Person Households | 27 (3.3%) | 0 (0.0%) |
| 7+ Person Households | 0 (0.0%) | 0 (0.0%) |
| Total | 285 (34.8%) | 534 (65.2%) |
Female Fertility in Waterbury
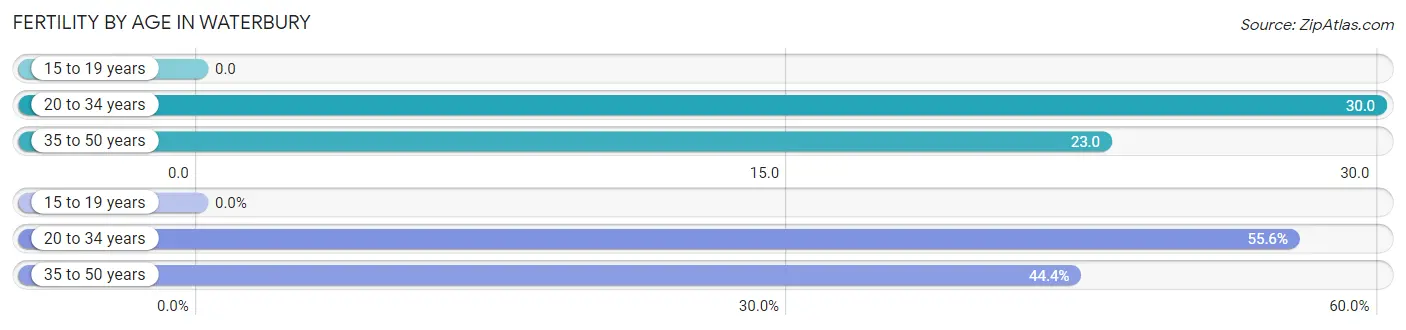
Fertility by Age in Waterbury
Average fertility rate in Waterbury is 24.0 births per 1,000 women. Women in the age bracket of 20 to 34 years have the highest fertility rate with 30.0 births per 1,000 women. Women in the age bracket of 20 to 34 years acount for 55.6% of all women with births.
| Age Bracket | Women with Births | Births / 1,000 Women |
| 15 to 19 years | 0 (0.0%) | 0.0 |
| 20 to 34 years | 5 (55.6%) | 30.0 |
| 35 to 50 years | 4 (44.4%) | 23.0 |
| Total | 9 (100.0%) | 24.0 |
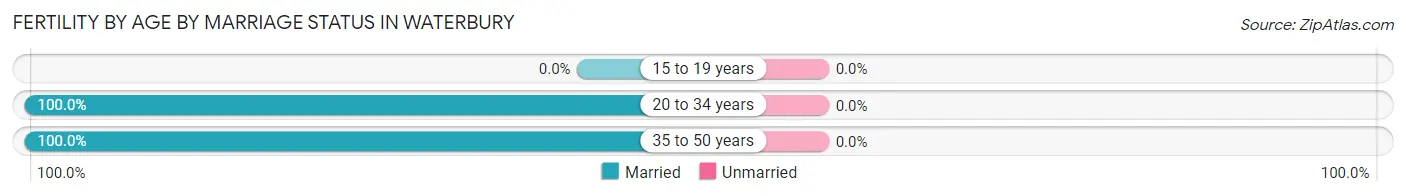
Fertility by Age by Marriage Status in Waterbury
| Age Bracket | Married | Unmarried |
| 15 to 19 years | 0 (0.0%) | 0 (0.0%) |
| 20 to 34 years | 5 (100.0%) | 0 (0.0%) |
| 35 to 50 years | 4 (100.0%) | 0 (0.0%) |
| Total | 9 (100.0%) | 0 (0.0%) |
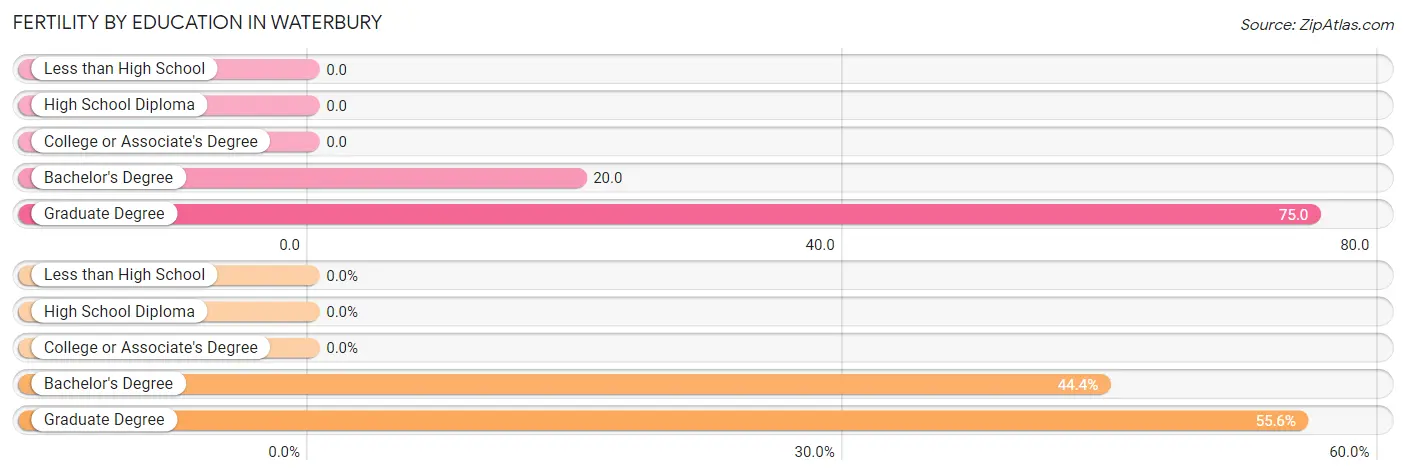
Fertility by Education in Waterbury
| Educational Attainment | Women with Births | Births / 1,000 Women |
| Less than High School | 0 (0.0%) | 0.0 |
| High School Diploma | 0 (0.0%) | 0.0 |
| College or Associate's Degree | 0 (0.0%) | 0.0 |
| Bachelor's Degree | 4 (44.4%) | 20.0 |
| Graduate Degree | 5 (55.6%) | 75.0 |
| Total | 9 (100.0%) | 24.0 |
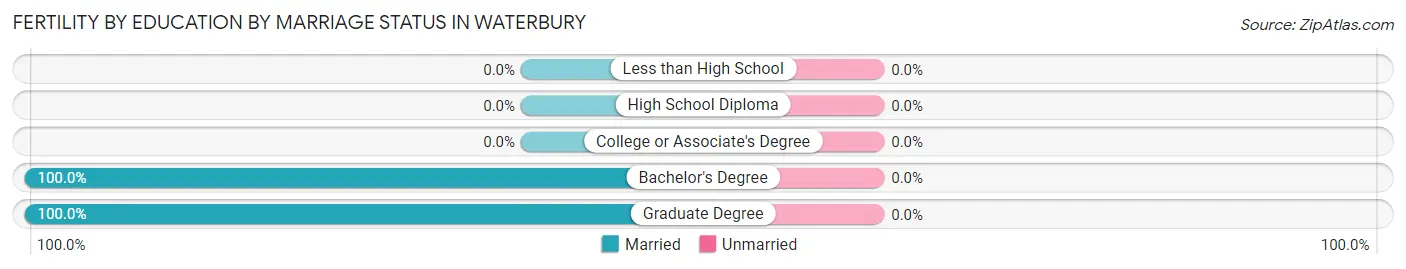
Fertility by Education by Marriage Status in Waterbury
| Educational Attainment | Married | Unmarried |
| Less than High School | 0 (0.0%) | 0 (0.0%) |
| High School Diploma | 0 (0.0%) | 0 (0.0%) |
| College or Associate's Degree | 0 (0.0%) | 0 (0.0%) |
| Bachelor's Degree | 4 (100.0%) | 0 (0.0%) |
| Graduate Degree | 5 (100.0%) | 0 (0.0%) |
| Total | 9 (100.0%) | 0 (0.0%) |
Income in Waterbury
Income Overview in Waterbury
Per Capita Income in Waterbury is $37,116, while median incomes of families and households are $92,188 and $55,655 respectively.
| Characteristic | Number | Measure |
| Per Capita Income | 1,686 | $37,116 |
| Median Family Income | 285 | $92,188 |
| Mean Family Income | 285 | $99,545 |
| Median Household Income | 819 | $55,655 |
| Mean Household Income | 819 | $74,081 |
| Income Deficit | 285 | $0 |
| Wage / Income Gap (%) | 1,686 | 7.08% |
| Wage / Income Gap ($) | 1,686 | 92.92¢ per $1 |
| Gini / Inequality Index | 1,686 | 0.44 |
Earnings by Sex in Waterbury
Average Earnings in Waterbury are $47,917, $51,118 for men and $47,500 for women, a difference of 7.1%.
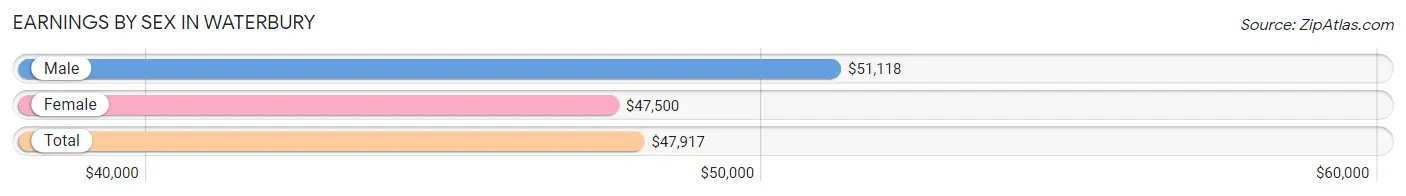
| Sex | Number | Average Earnings |
| Male | 407 (45.5%) | $51,118 |
| Female | 488 (54.5%) | $47,500 |
| Total | 895 (100.0%) | $47,917 |
Earnings by Sex by Income Bracket in Waterbury
The most common earnings brackets in Waterbury are $65,000 to $74,999 for men (79 | 19.4%) and $45,000 to $49,999 for women (61 | 12.5%).
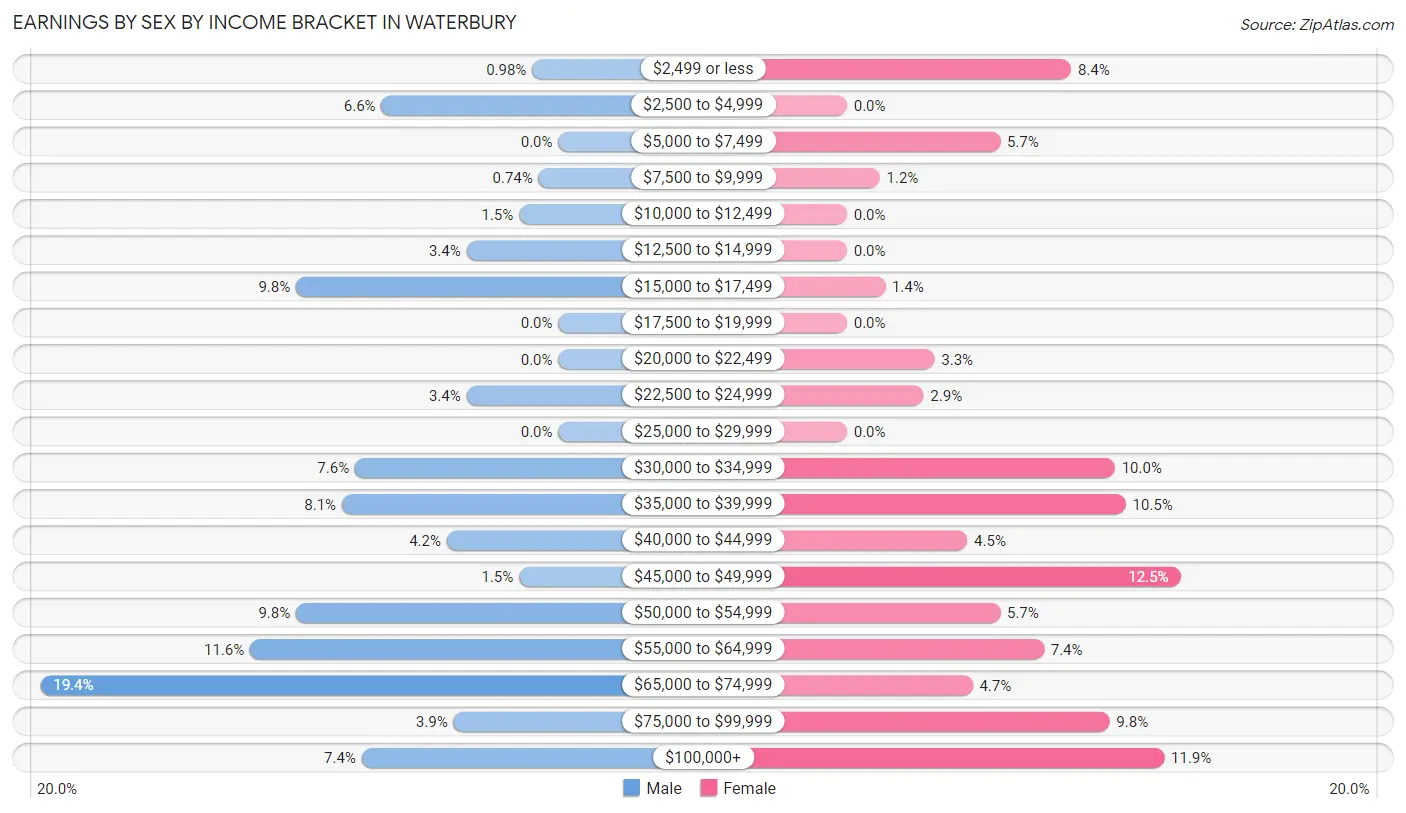
| Income | Male | Female |
| $2,499 or less | 4 (1.0%) | 41 (8.4%) |
| $2,500 to $4,999 | 27 (6.6%) | 0 (0.0%) |
| $5,000 to $7,499 | 0 (0.0%) | 28 (5.7%) |
| $7,500 to $9,999 | 3 (0.7%) | 6 (1.2%) |
| $10,000 to $12,499 | 6 (1.5%) | 0 (0.0%) |
| $12,500 to $14,999 | 14 (3.4%) | 0 (0.0%) |
| $15,000 to $17,499 | 40 (9.8%) | 7 (1.4%) |
| $17,500 to $19,999 | 0 (0.0%) | 0 (0.0%) |
| $20,000 to $22,499 | 0 (0.0%) | 16 (3.3%) |
| $22,500 to $24,999 | 14 (3.4%) | 14 (2.9%) |
| $25,000 to $29,999 | 0 (0.0%) | 0 (0.0%) |
| $30,000 to $34,999 | 31 (7.6%) | 49 (10.0%) |
| $35,000 to $39,999 | 33 (8.1%) | 51 (10.4%) |
| $40,000 to $44,999 | 17 (4.2%) | 22 (4.5%) |
| $45,000 to $49,999 | 6 (1.5%) | 61 (12.5%) |
| $50,000 to $54,999 | 40 (9.8%) | 28 (5.7%) |
| $55,000 to $64,999 | 47 (11.6%) | 36 (7.4%) |
| $65,000 to $74,999 | 79 (19.4%) | 23 (4.7%) |
| $75,000 to $99,999 | 16 (3.9%) | 48 (9.8%) |
| $100,000+ | 30 (7.4%) | 58 (11.9%) |
| Total | 407 (100.0%) | 488 (100.0%) |
Earnings by Sex by Educational Attainment in Waterbury
Average earnings in Waterbury are $53,571 for men and $48,652 for women, a difference of 9.2%. Men with an educational attainment of graduate degree enjoy the highest average annual earnings of $72,308, while those with college or associate's degree education earn the least with $39,773. Women with an educational attainment of graduate degree earn the most with the average annual earnings of $59,375, while those with college or associate's degree education have the smallest earnings of $40,341.
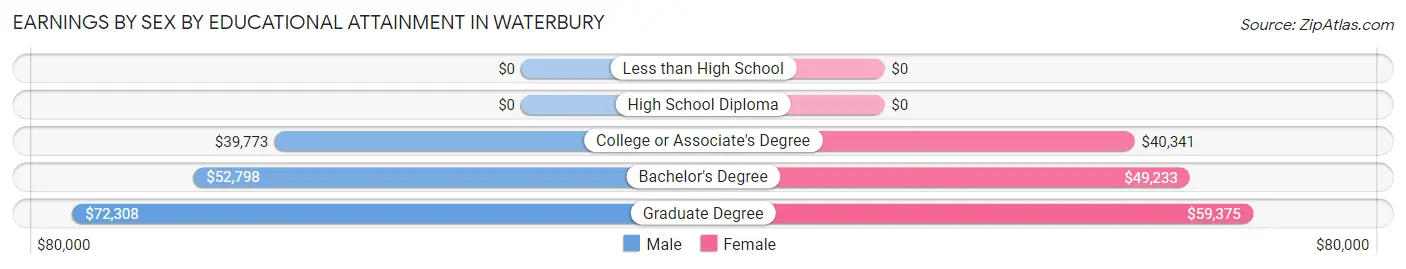
| Educational Attainment | Male Income | Female Income |
| Less than High School | - | - |
| High School Diploma | - | - |
| College or Associate's Degree | $39,773 | $40,341 |
| Bachelor's Degree | $52,798 | $49,233 |
| Graduate Degree | $72,308 | $59,375 |
| Total | $53,571 | $48,652 |
Family Income in Waterbury
Family Income Brackets in Waterbury
According to the Waterbury family income data, there are 83 families falling into the less than $10,000 income range, which is the most common income bracket and makes up 29.1% of all families.
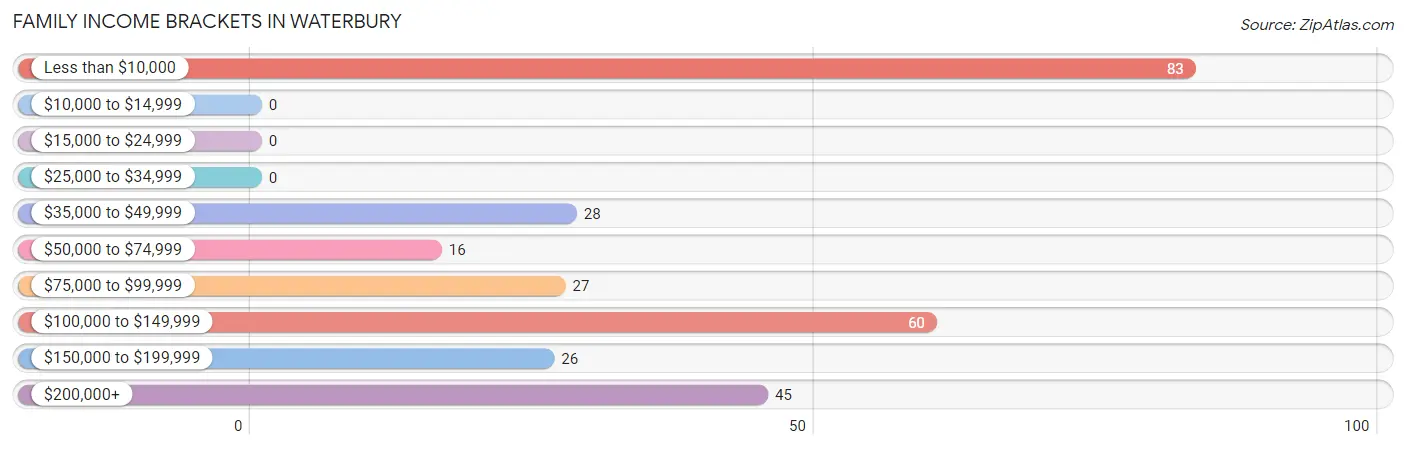
| Income Bracket | # Families | % Families |
| Less than $10,000 | 83 | 29.1% |
| $10,000 to $14,999 | 0 | 0.0% |
| $15,000 to $24,999 | 0 | 0.0% |
| $25,000 to $34,999 | 0 | 0.0% |
| $35,000 to $49,999 | 28 | 9.8% |
| $50,000 to $74,999 | 16 | 5.6% |
| $75,000 to $99,999 | 27 | 9.5% |
| $100,000 to $149,999 | 60 | 21.1% |
| $150,000 to $199,999 | 26 | 9.1% |
| $200,000+ | 45 | 15.8% |
Family Income by Famaliy Size in Waterbury
4-person families (38 | 13.3%) account for the highest median family income in Waterbury with $116,667 per family, while 2-person families (99 | 34.7%) have the highest median income of $40,982 per family member.
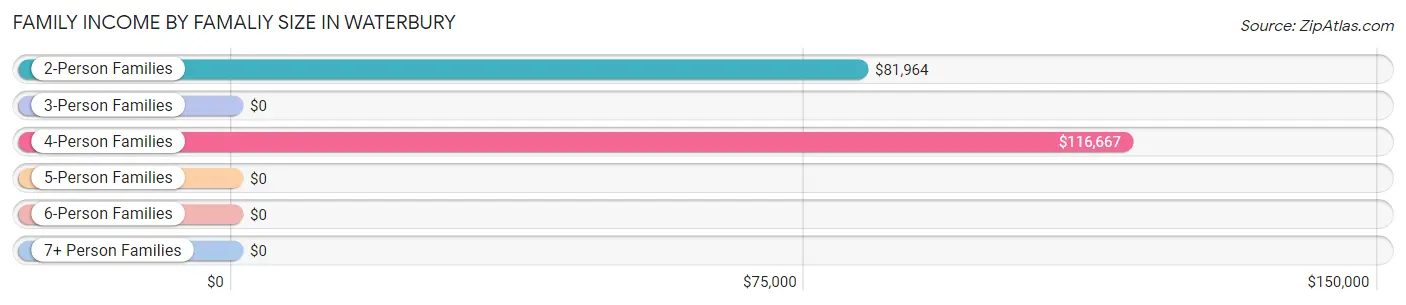
| Income Bracket | # Families | Median Income |
| 2-Person Families | 99 (34.7%) | $81,964 |
| 3-Person Families | 102 (35.8%) | $0 |
| 4-Person Families | 38 (13.3%) | $116,667 |
| 5-Person Families | 19 (6.7%) | $0 |
| 6-Person Families | 27 (9.5%) | $0 |
| 7+ Person Families | 0 (0.0%) | $0 |
| Total | 285 (100.0%) | $92,188 |
Family Income by Number of Earners in Waterbury
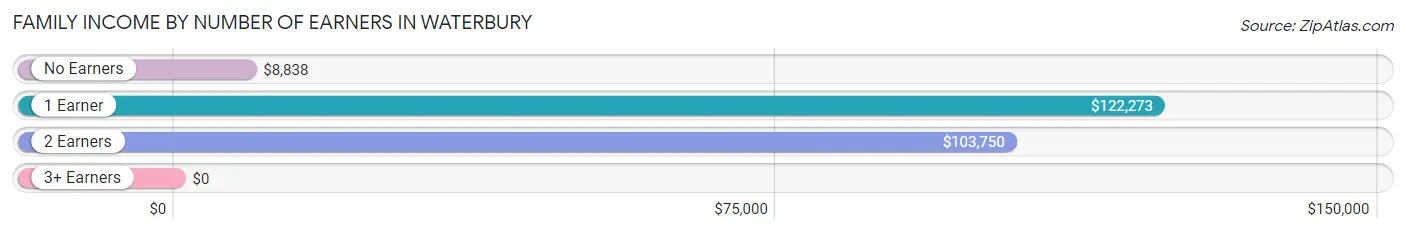
| Number of Earners | # Families | Median Income |
| No Earners | 84 (29.5%) | $8,838 |
| 1 Earner | 54 (19.0%) | $122,273 |
| 2 Earners | 116 (40.7%) | $103,750 |
| 3+ Earners | 31 (10.9%) | $0 |
| Total | 285 (100.0%) | $92,188 |
Household Income in Waterbury
Household Income Brackets in Waterbury
With 149 households falling in the category, the $50,000 to $74,999 income range is the most frequent in Waterbury, accounting for 18.2% of all households. In contrast, only 26 households (3.2%) fall into the $150,000 to $199,999 income bracket, making it the least populous group.
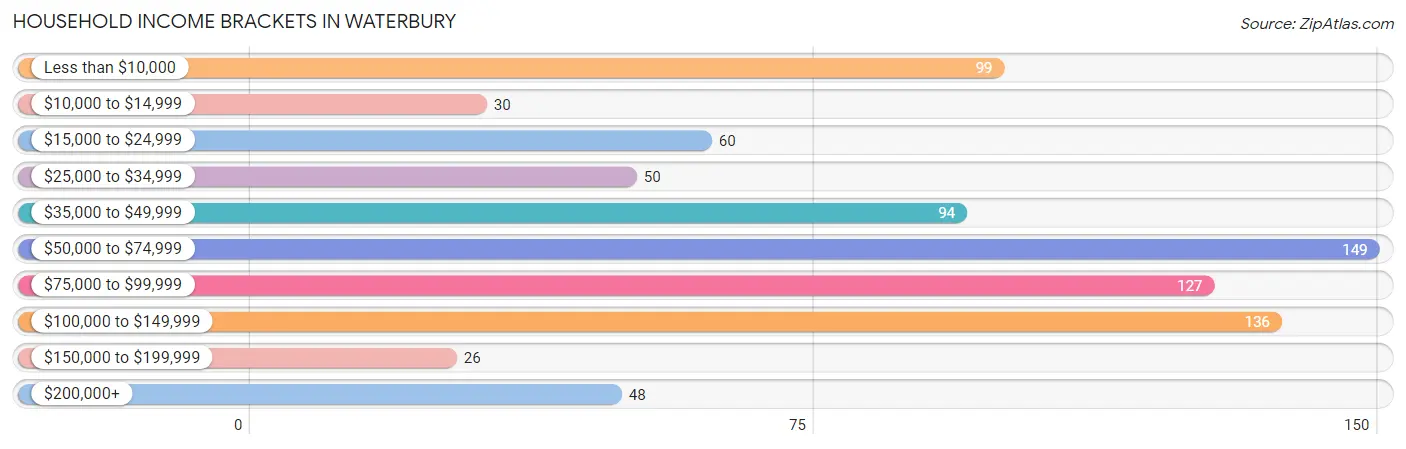
| Income Bracket | # Households | % Households |
| Less than $10,000 | 99 | 12.1% |
| $10,000 to $14,999 | 30 | 3.7% |
| $15,000 to $24,999 | 60 | 7.3% |
| $25,000 to $34,999 | 50 | 6.1% |
| $35,000 to $49,999 | 94 | 11.5% |
| $50,000 to $74,999 | 149 | 18.2% |
| $75,000 to $99,999 | 127 | 15.5% |
| $100,000 to $149,999 | 136 | 16.6% |
| $150,000 to $199,999 | 26 | 3.2% |
| $200,000+ | 48 | 5.9% |
Household Income by Householder Age in Waterbury
The median household income in Waterbury is $55,655, with the highest median household income of $83,646 found in the 45 to 64 years age bracket for the primary householder. A total of 181 households (22.1%) fall into this category.
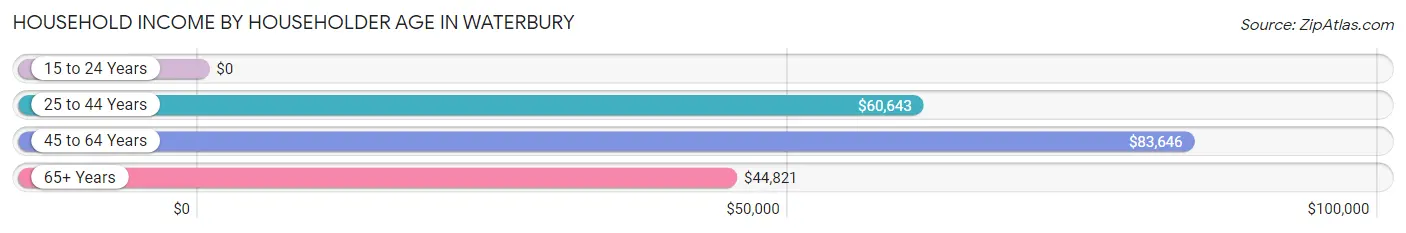
| Income Bracket | # Households | Median Income |
| 15 to 24 Years | 0 (0.0%) | $0 |
| 25 to 44 Years | 380 (46.4%) | $60,643 |
| 45 to 64 Years | 181 (22.1%) | $83,646 |
| 65+ Years | 258 (31.5%) | $44,821 |
| Total | 819 (100.0%) | $55,655 |
Poverty in Waterbury
Income Below Poverty by Sex and Age in Waterbury
With 31.0% poverty level for males and 9.4% for females among the residents of Waterbury, 6 to 11 year old males and 12 to 14 year old females are the most vulnerable to poverty, with 117 males (72.7%) and 16 females (37.2%) in their respective age groups living below the poverty level.
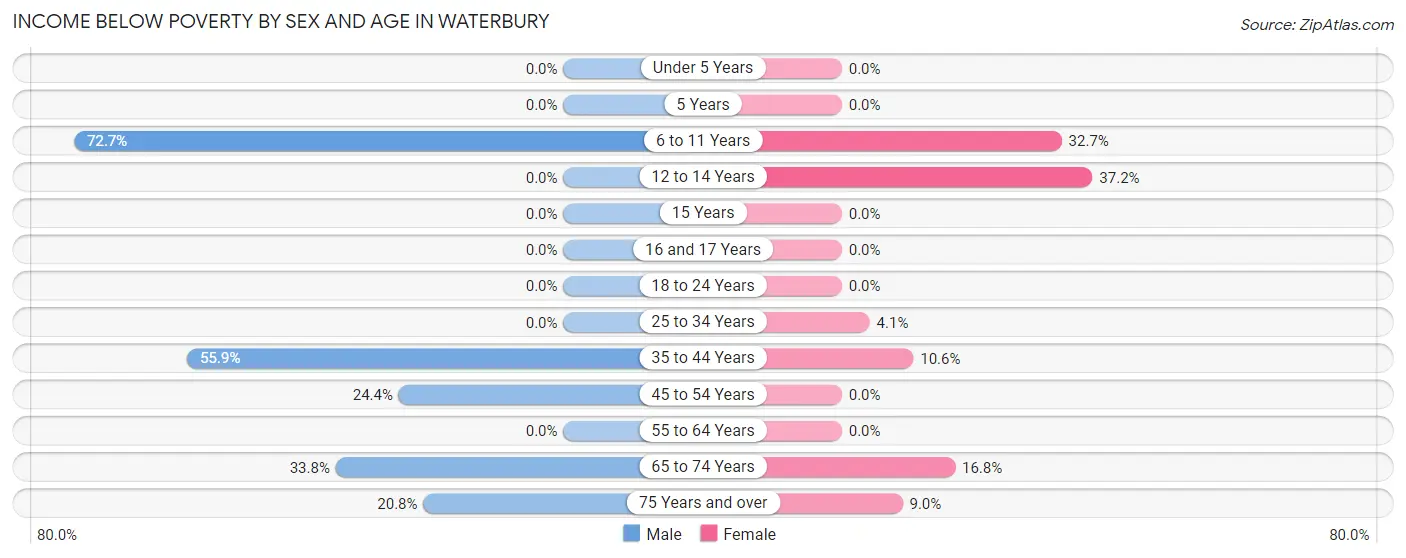
| Age Bracket | Male | Female |
| Under 5 Years | 0 (0.0%) | 0 (0.0%) |
| 5 Years | 0 (0.0%) | 0 (0.0%) |
| 6 to 11 Years | 117 (72.7%) | 16 (32.7%) |
| 12 to 14 Years | 0 (0.0%) | 16 (37.2%) |
| 15 Years | 0 (0.0%) | 0 (0.0%) |
| 16 and 17 Years | 0 (0.0%) | 0 (0.0%) |
| 18 to 24 Years | 0 (0.0%) | 0 (0.0%) |
| 25 to 34 Years | 0 (0.0%) | 6 (4.1%) |
| 35 to 44 Years | 76 (55.9%) | 12 (10.6%) |
| 45 to 54 Years | 11 (24.4%) | 0 (0.0%) |
| 55 to 64 Years | 0 (0.0%) | 0 (0.0%) |
| 65 to 74 Years | 24 (33.8%) | 19 (16.8%) |
| 75 Years and over | 21 (20.8%) | 11 (9.0%) |
| Total | 249 (31.0%) | 80 (9.4%) |
Income Above Poverty by Sex and Age in Waterbury
According to the poverty statistics in Waterbury, males aged 12 to 14 years and females aged under 5 years are the age groups that are most secure financially, with 100.0% of males and 100.0% of females in these age groups living above the poverty line.
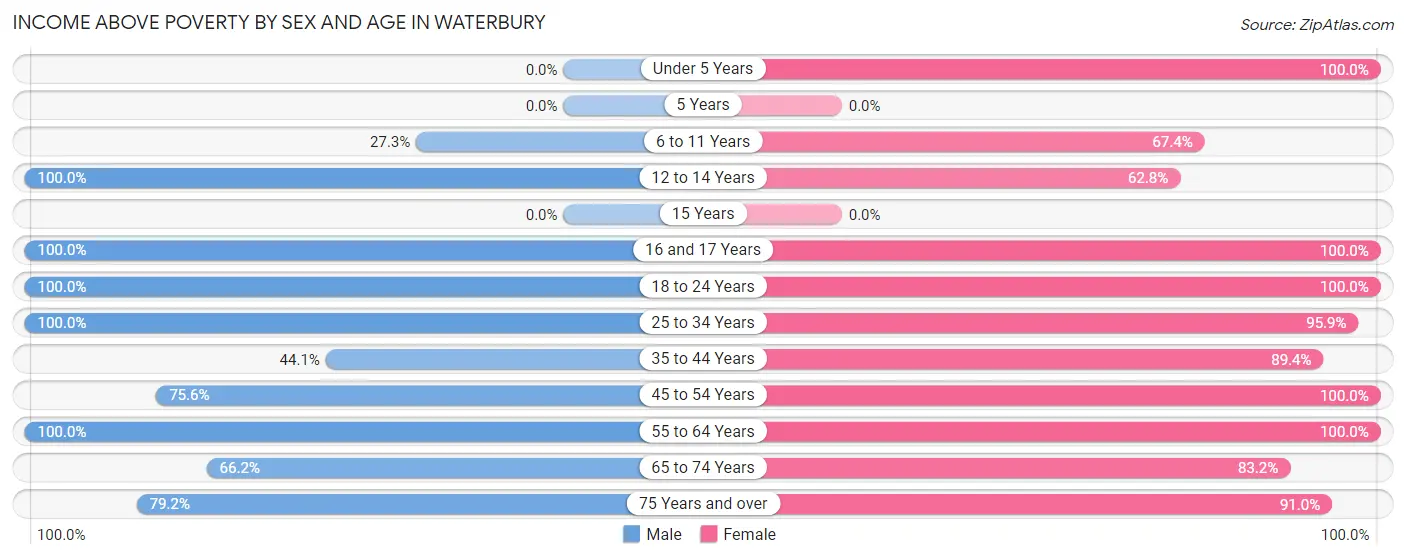
| Age Bracket | Male | Female |
| Under 5 Years | 0 (0.0%) | 44 (100.0%) |
| 5 Years | 0 (0.0%) | 0 (0.0%) |
| 6 to 11 Years | 44 (27.3%) | 33 (67.3%) |
| 12 to 14 Years | 7 (100.0%) | 27 (62.8%) |
| 15 Years | 0 (0.0%) | 0 (0.0%) |
| 16 and 17 Years | 3 (100.0%) | 37 (100.0%) |
| 18 to 24 Years | 36 (100.0%) | 19 (100.0%) |
| 25 to 34 Years | 175 (100.0%) | 139 (95.9%) |
| 35 to 44 Years | 60 (44.1%) | 101 (89.4%) |
| 45 to 54 Years | 34 (75.6%) | 90 (100.0%) |
| 55 to 64 Years | 69 (100.0%) | 78 (100.0%) |
| 65 to 74 Years | 47 (66.2%) | 94 (83.2%) |
| 75 Years and over | 80 (79.2%) | 111 (91.0%) |
| Total | 555 (69.0%) | 773 (90.6%) |
Income Below Poverty Among Married-Couple Families in Waterbury
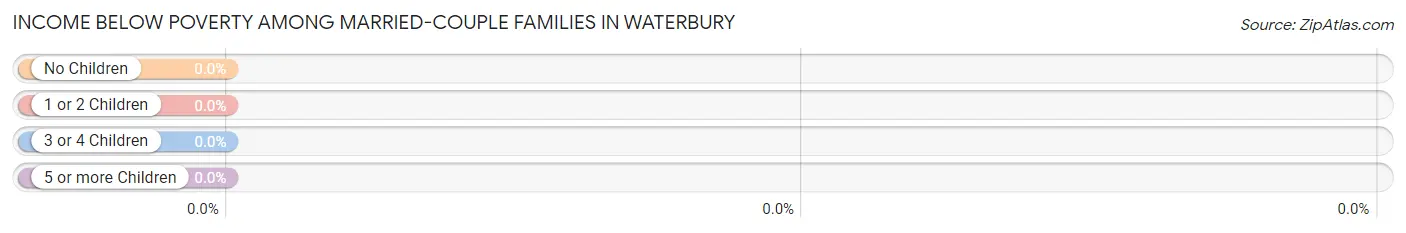
| Children | Above Poverty | Below Poverty |
| No Children | 82 (100.0%) | 0 (0.0%) |
| 1 or 2 Children | 70 (100.0%) | 0 (0.0%) |
| 3 or 4 Children | 11 (100.0%) | 0 (0.0%) |
| 5 or more Children | 0 (0.0%) | 0 (0.0%) |
| Total | 163 (100.0%) | 0 (0.0%) |
Income Below Poverty Among Single-Parent Households in Waterbury
According to the poverty data in Waterbury, 100.0% or 71 single-father households and 23.5% or 12 single-mother households are living below the poverty line. Among single-father households, those with 1 or 2 children have the highest poverty rate, with 71 households (100.0%) experiencing poverty. Likewise, among single-mother households, those with 3 or 4 children have the highest poverty rate, with 12 households (100.0%) falling below the poverty line.
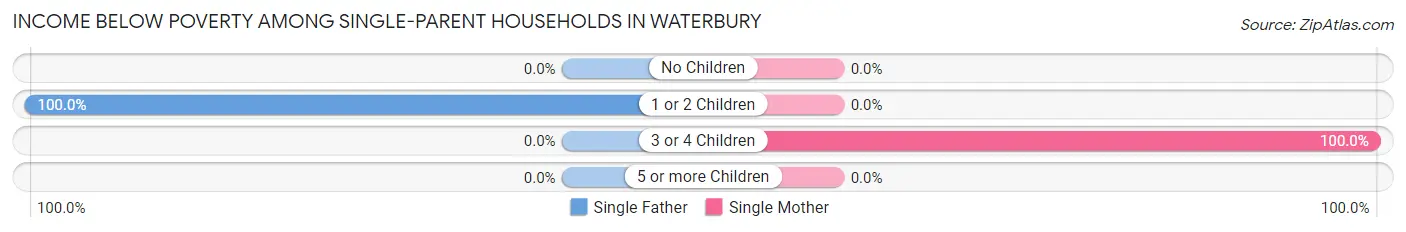
| Children | Single Father | Single Mother |
| No Children | 0 (0.0%) | 0 (0.0%) |
| 1 or 2 Children | 71 (100.0%) | 0 (0.0%) |
| 3 or 4 Children | 0 (0.0%) | 12 (100.0%) |
| 5 or more Children | 0 (0.0%) | 0 (0.0%) |
| Total | 71 (100.0%) | 12 (23.5%) |
Income Below Poverty Among Married-Couple vs Single-Parent Households in Waterbury
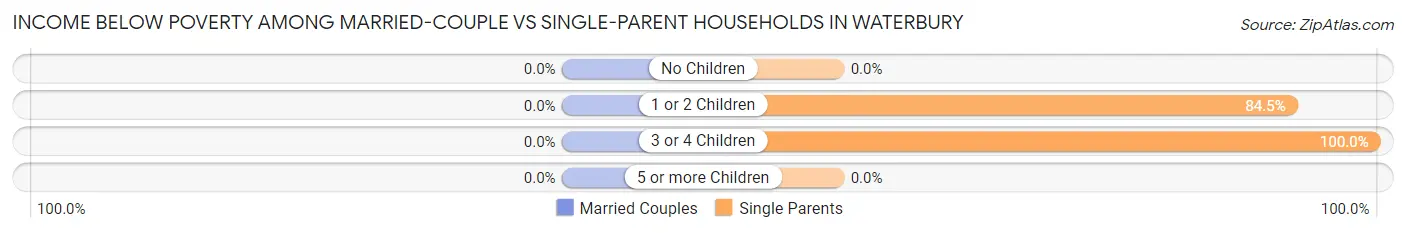
| Children | Married-Couple Families | Single-Parent Households |
| No Children | 0 (0.0%) | 0 (0.0%) |
| 1 or 2 Children | 0 (0.0%) | 71 (84.5%) |
| 3 or 4 Children | 0 (0.0%) | 12 (100.0%) |
| 5 or more Children | 0 (0.0%) | 0 (0.0%) |
| Total | 0 (0.0%) | 83 (68.0%) |
Employment Characteristics in Waterbury
Employment by Class of Employer in Waterbury
Among the 847 employed individuals in Waterbury, private company employees (432 | 51.0%), not-for-profit organizations (111 | 13.1%), and state government employees (103 | 12.2%) make up the most common classes of employment.
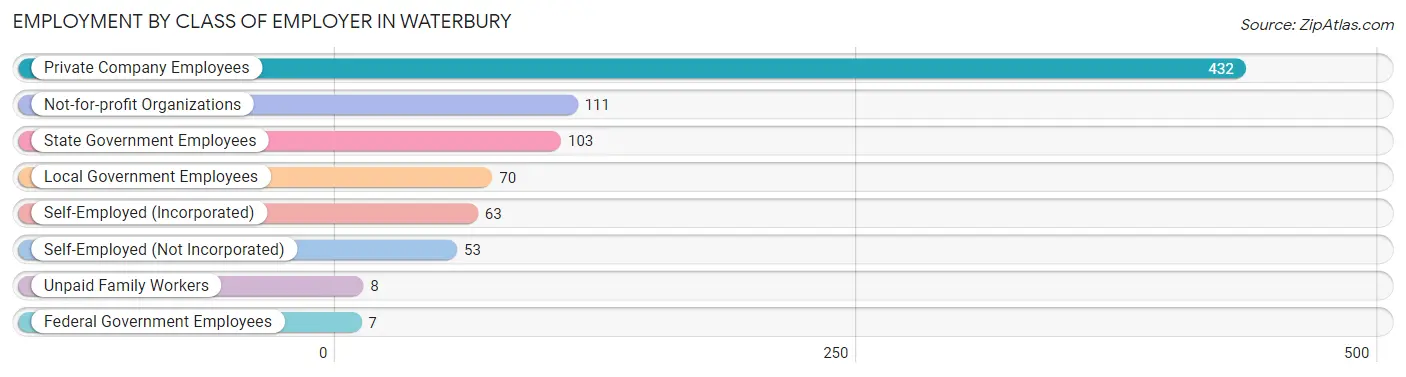
| Employer Class | # Employees | % Employees |
| Private Company Employees | 432 | 51.0% |
| Self-Employed (Incorporated) | 63 | 7.4% |
| Self-Employed (Not Incorporated) | 53 | 6.3% |
| Not-for-profit Organizations | 111 | 13.1% |
| Local Government Employees | 70 | 8.3% |
| State Government Employees | 103 | 12.2% |
| Federal Government Employees | 7 | 0.8% |
| Unpaid Family Workers | 8 | 0.9% |
| Total | 847 | 100.0% |
Employment Status by Age in Waterbury
According to the labor force statistics for Waterbury, out of the total population over 16 years of age (1,375), 64.2% or 883 individuals are in the labor force, with 2.5% or 22 of them unemployed. The age group with the highest labor force participation rate is 20 to 24 years, with 100.0% or 33 individuals in the labor force. Within the labor force, the 55 to 59 years age range has the highest percentage of unemployed individuals, with 12.8% or 11 of them being unemployed.
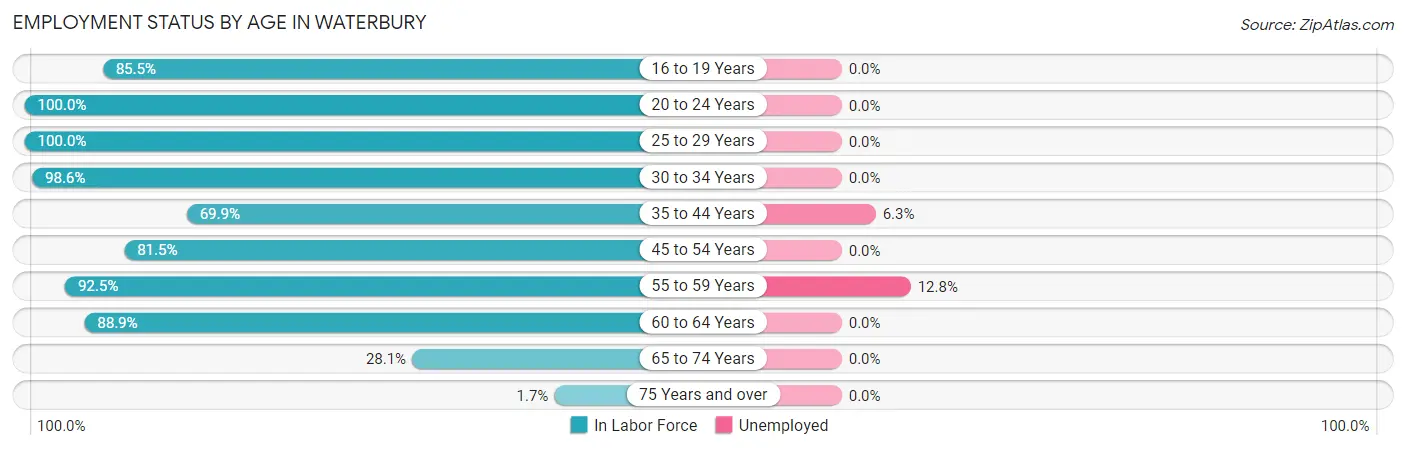
| Age Bracket | In Labor Force | Unemployed |
| 16 to 19 Years | 53 (85.5%) | 0 (0.0%) |
| 20 to 24 Years | 33 (100.0%) | 0 (0.0%) |
| 25 to 29 Years | 252 (100.0%) | 0 (0.0%) |
| 30 to 34 Years | 68 (98.6%) | 0 (0.0%) |
| 35 to 44 Years | 174 (69.9%) | 11 (6.3%) |
| 45 to 54 Years | 110 (81.5%) | 0 (0.0%) |
| 55 to 59 Years | 86 (92.5%) | 11 (12.8%) |
| 60 to 64 Years | 48 (88.9%) | 0 (0.0%) |
| 65 to 74 Years | 55 (28.1%) | 0 (0.0%) |
| 75 Years and over | 4 (1.7%) | 0 (0.0%) |
| Total | 883 (64.2%) | 22 (2.5%) |
Employment Status by Educational Attainment in Waterbury
According to labor force statistics for Waterbury, 86.6% of individuals (738) out of the total population between 25 and 64 years of age (852) are in the labor force, with 3.0% or 22 of them being unemployed. The group with the highest labor force participation rate are those with the educational attainment of less than high school, with 100.0% or 8 individuals in the labor force. Within the labor force, individuals with high school diploma education have the highest percentage of unemployment, with 28.2% or 11 of them being unemployed.
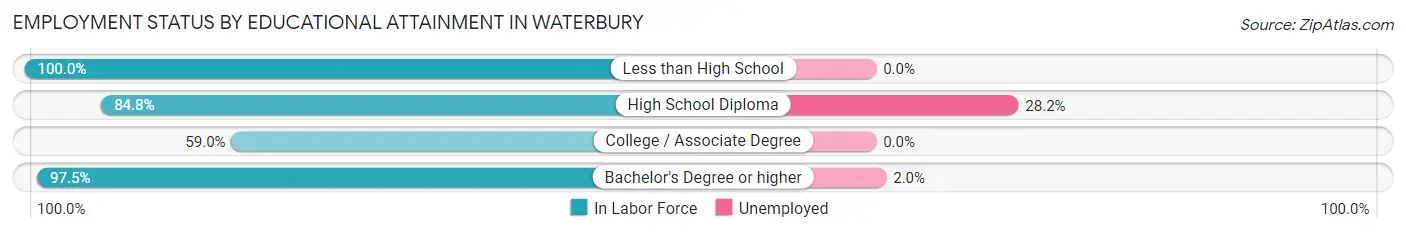
| Educational Attainment | In Labor Force | Unemployed |
| Less than High School | 8 (100.0%) | 0 (0.0%) |
| High School Diploma | 39 (84.8%) | 13 (28.2%) |
| College / Associate Degree | 134 (59.0%) | 0 (0.0%) |
| Bachelor's Degree or higher | 557 (97.5%) | 11 (2.0%) |
| Total | 738 (86.6%) | 26 (3.0%) |
Employment Occupations by Sex in Waterbury
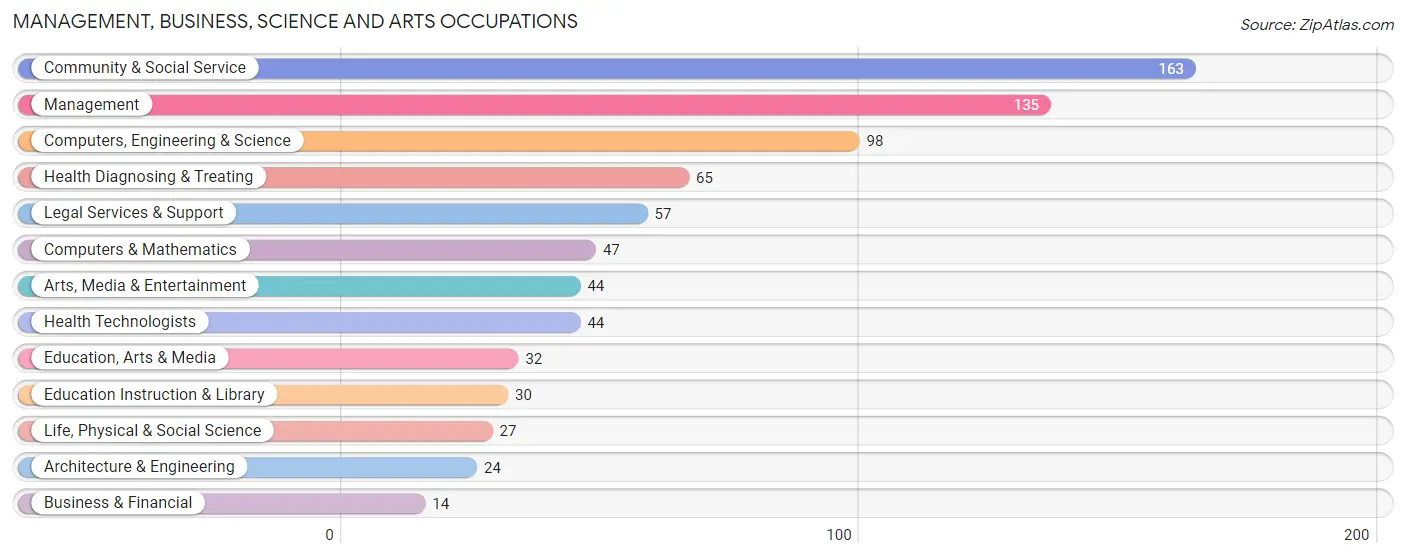
Management, Business, Science and Arts Occupations
The most common Management, Business, Science and Arts occupations in Waterbury are Community & Social Service (163 | 18.9%), Management (135 | 15.7%), Computers, Engineering & Science (98 | 11.4%), Health Diagnosing & Treating (65 | 7.5%), and Legal Services & Support (57 | 6.6%).
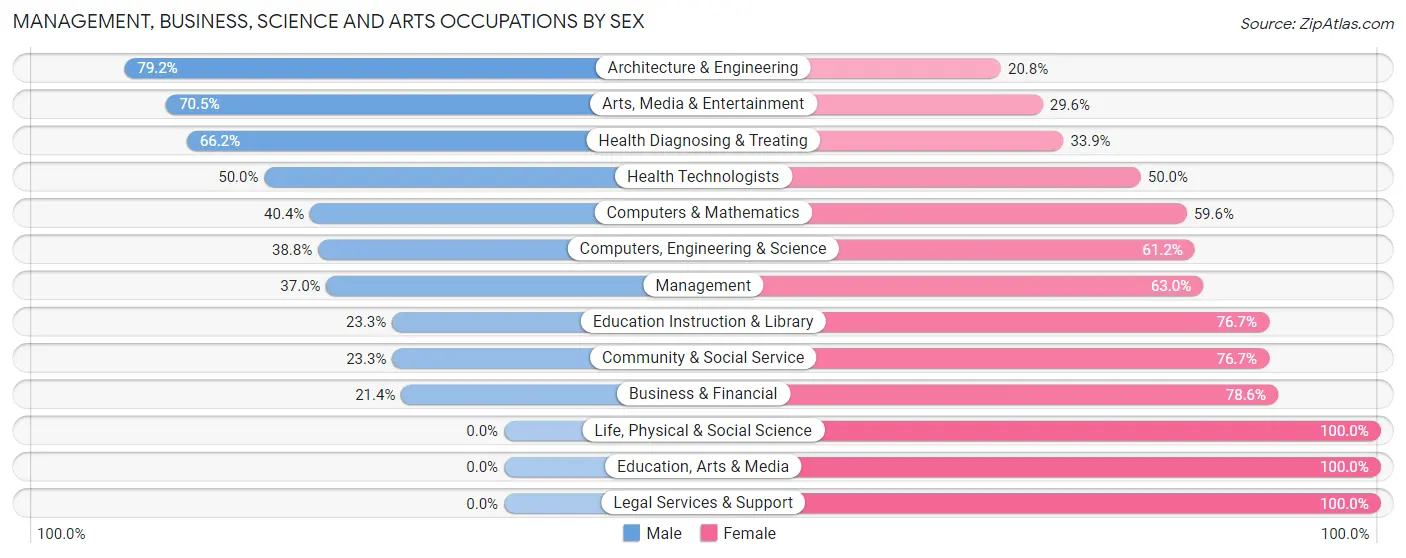
Management, Business, Science and Arts Occupations by Sex
Within the Management, Business, Science and Arts occupations in Waterbury, the most male-oriented occupations are Architecture & Engineering (79.2%), Arts, Media & Entertainment (70.5%), and Health Diagnosing & Treating (66.1%), while the most female-oriented occupations are Life, Physical & Social Science (100.0%), Education, Arts & Media (100.0%), and Legal Services & Support (100.0%).
| Occupation | Male | Female |
| Management | 50 (37.0%) | 85 (63.0%) |
| Business & Financial | 3 (21.4%) | 11 (78.6%) |
| Computers, Engineering & Science | 38 (38.8%) | 60 (61.2%) |
| Computers & Mathematics | 19 (40.4%) | 28 (59.6%) |
| Architecture & Engineering | 19 (79.2%) | 5 (20.8%) |
| Life, Physical & Social Science | 0 (0.0%) | 27 (100.0%) |
| Community & Social Service | 38 (23.3%) | 125 (76.7%) |
| Education, Arts & Media | 0 (0.0%) | 32 (100.0%) |
| Legal Services & Support | 0 (0.0%) | 57 (100.0%) |
| Education Instruction & Library | 7 (23.3%) | 23 (76.7%) |
| Arts, Media & Entertainment | 31 (70.5%) | 13 (29.5%) |
| Health Diagnosing & Treating | 43 (66.1%) | 22 (33.9%) |
| Health Technologists | 22 (50.0%) | 22 (50.0%) |
| Total (Category) | 172 (36.2%) | 303 (63.8%) |
| Total (Overall) | 396 (46.0%) | 465 (54.0%) |
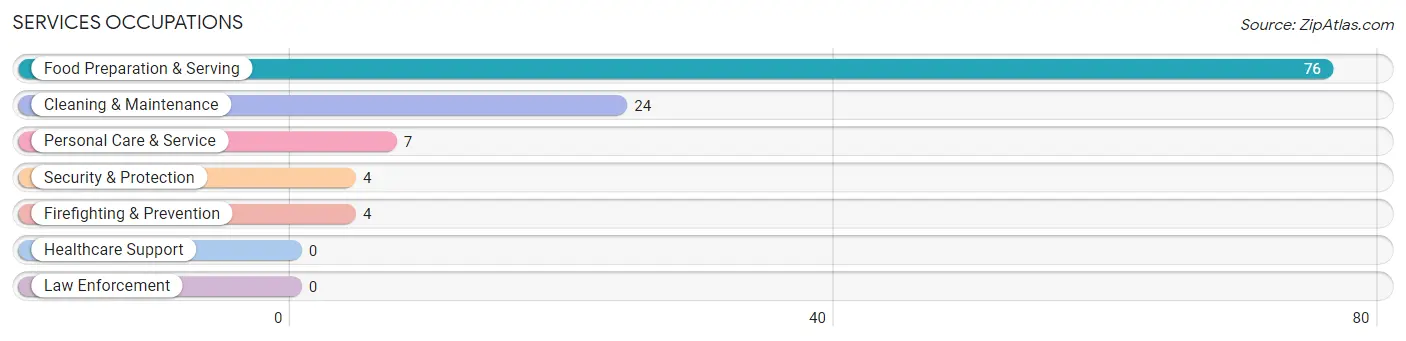
Services Occupations
The most common Services occupations in Waterbury are Food Preparation & Serving (76 | 8.8%), Cleaning & Maintenance (24 | 2.8%), Personal Care & Service (7 | 0.8%), Security & Protection (4 | 0.5%), and Firefighting & Prevention (4 | 0.5%).
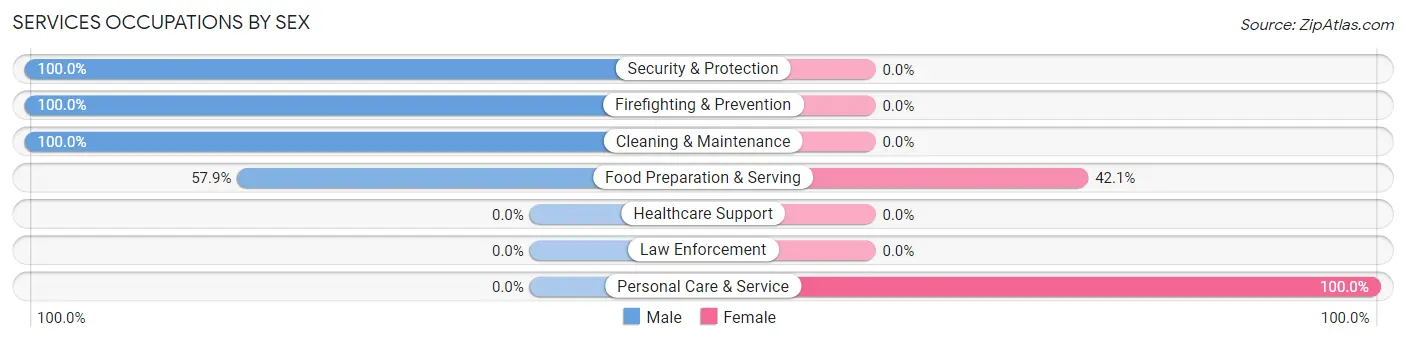
Services Occupations by Sex
Within the Services occupations in Waterbury, the most male-oriented occupations are Security & Protection (100.0%), Firefighting & Prevention (100.0%), and Cleaning & Maintenance (100.0%), while the most female-oriented occupations are Personal Care & Service (100.0%), and Food Preparation & Serving (42.1%).
| Occupation | Male | Female |
| Healthcare Support | 0 (0.0%) | 0 (0.0%) |
| Security & Protection | 4 (100.0%) | 0 (0.0%) |
| Firefighting & Prevention | 4 (100.0%) | 0 (0.0%) |
| Law Enforcement | 0 (0.0%) | 0 (0.0%) |
| Food Preparation & Serving | 44 (57.9%) | 32 (42.1%) |
| Cleaning & Maintenance | 24 (100.0%) | 0 (0.0%) |
| Personal Care & Service | 0 (0.0%) | 7 (100.0%) |
| Total (Category) | 72 (64.9%) | 39 (35.1%) |
| Total (Overall) | 396 (46.0%) | 465 (54.0%) |
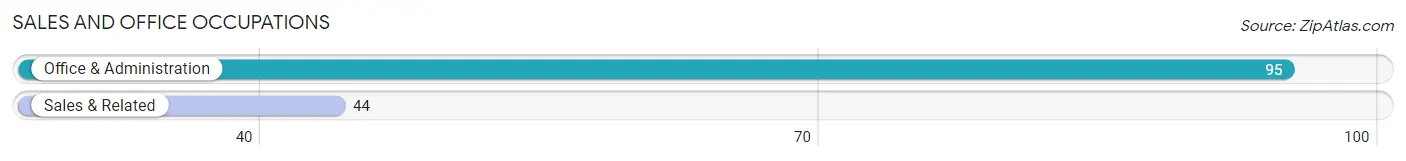
Sales and Office Occupations
The most common Sales and Office occupations in Waterbury are Office & Administration (95 | 11.0%), and Sales & Related (44 | 5.1%).
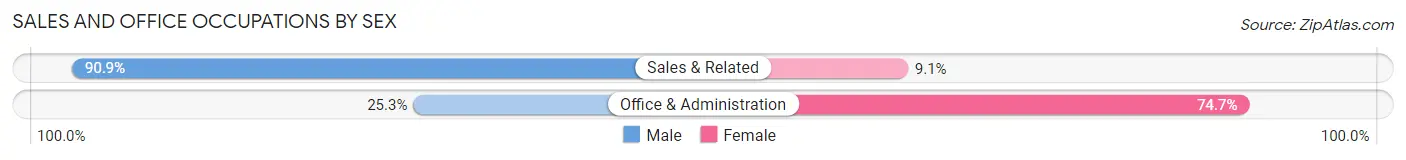
Sales and Office Occupations by Sex
| Occupation | Male | Female |
| Sales & Related | 40 (90.9%) | 4 (9.1%) |
| Office & Administration | 24 (25.3%) | 71 (74.7%) |
| Total (Category) | 64 (46.0%) | 75 (54.0%) |
| Total (Overall) | 396 (46.0%) | 465 (54.0%) |
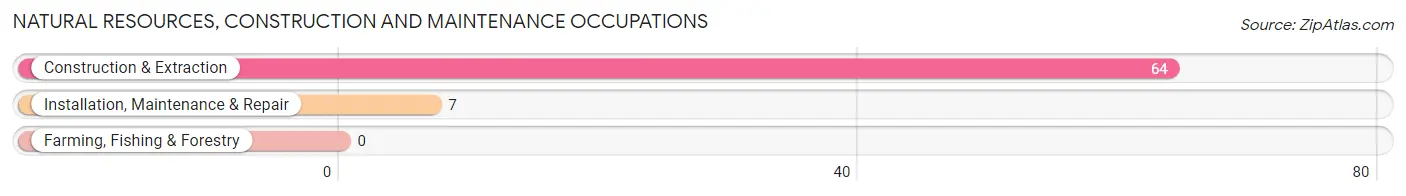
Natural Resources, Construction and Maintenance Occupations
The most common Natural Resources, Construction and Maintenance occupations in Waterbury are Construction & Extraction (64 | 7.4%), and Installation, Maintenance & Repair (7 | 0.8%).
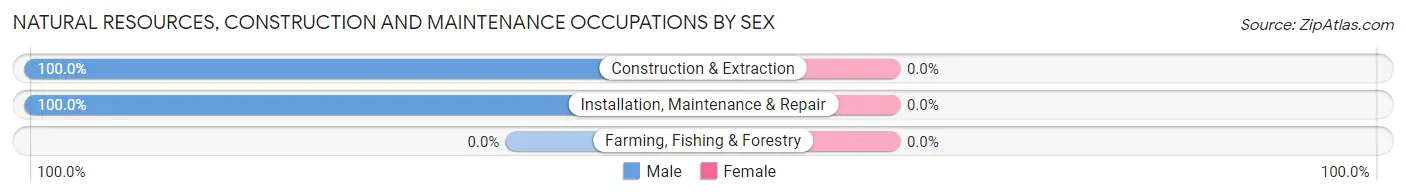
Natural Resources, Construction and Maintenance Occupations by Sex
| Occupation | Male | Female |
| Farming, Fishing & Forestry | 0 (0.0%) | 0 (0.0%) |
| Construction & Extraction | 64 (100.0%) | 0 (0.0%) |
| Installation, Maintenance & Repair | 7 (100.0%) | 0 (0.0%) |
| Total (Category) | 71 (100.0%) | 0 (0.0%) |
| Total (Overall) | 396 (46.0%) | 465 (54.0%) |
Production, Transportation and Moving Occupations
The most common Production, Transportation and Moving occupations in Waterbury are Production (53 | 6.2%), and Material Moving (12 | 1.4%).
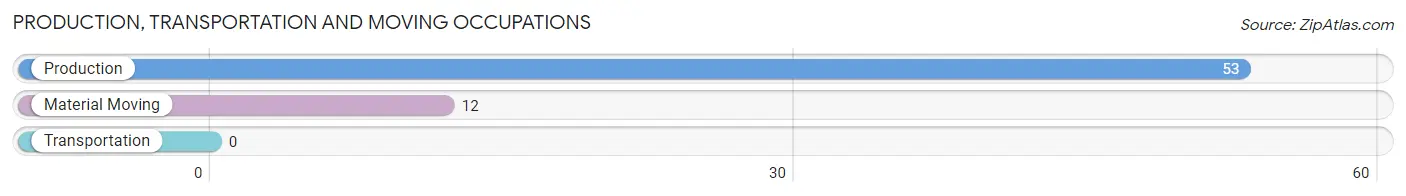
Production, Transportation and Moving Occupations by Sex
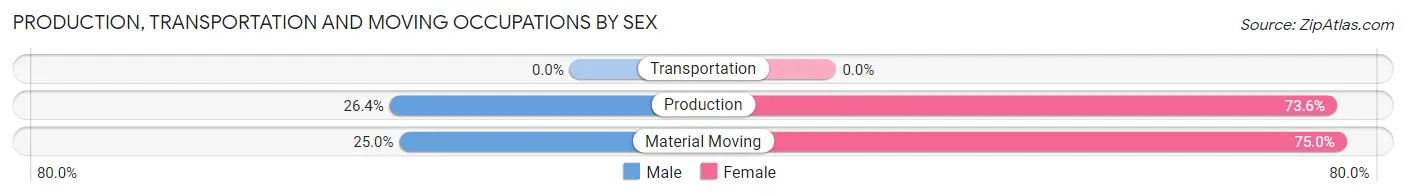
| Occupation | Male | Female |
| Production | 14 (26.4%) | 39 (73.6%) |
| Transportation | 0 (0.0%) | 0 (0.0%) |
| Material Moving | 3 (25.0%) | 9 (75.0%) |
| Total (Category) | 17 (26.2%) | 48 (73.9%) |
| Total (Overall) | 396 (46.0%) | 465 (54.0%) |
Employment Industries by Sex in Waterbury
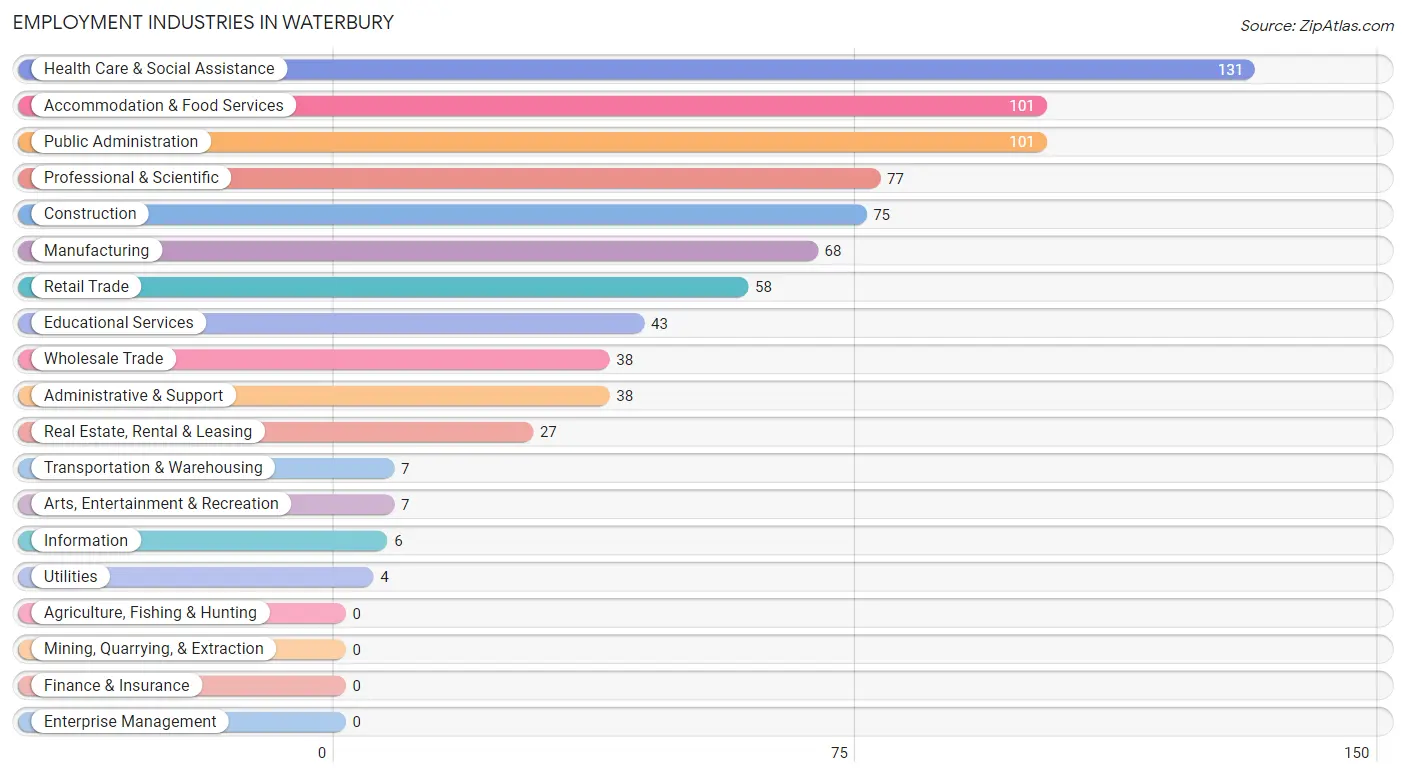
Employment Industries in Waterbury
The major employment industries in Waterbury include Health Care & Social Assistance (131 | 15.2%), Accommodation & Food Services (101 | 11.7%), Public Administration (101 | 11.7%), Professional & Scientific (77 | 8.9%), and Construction (75 | 8.7%).
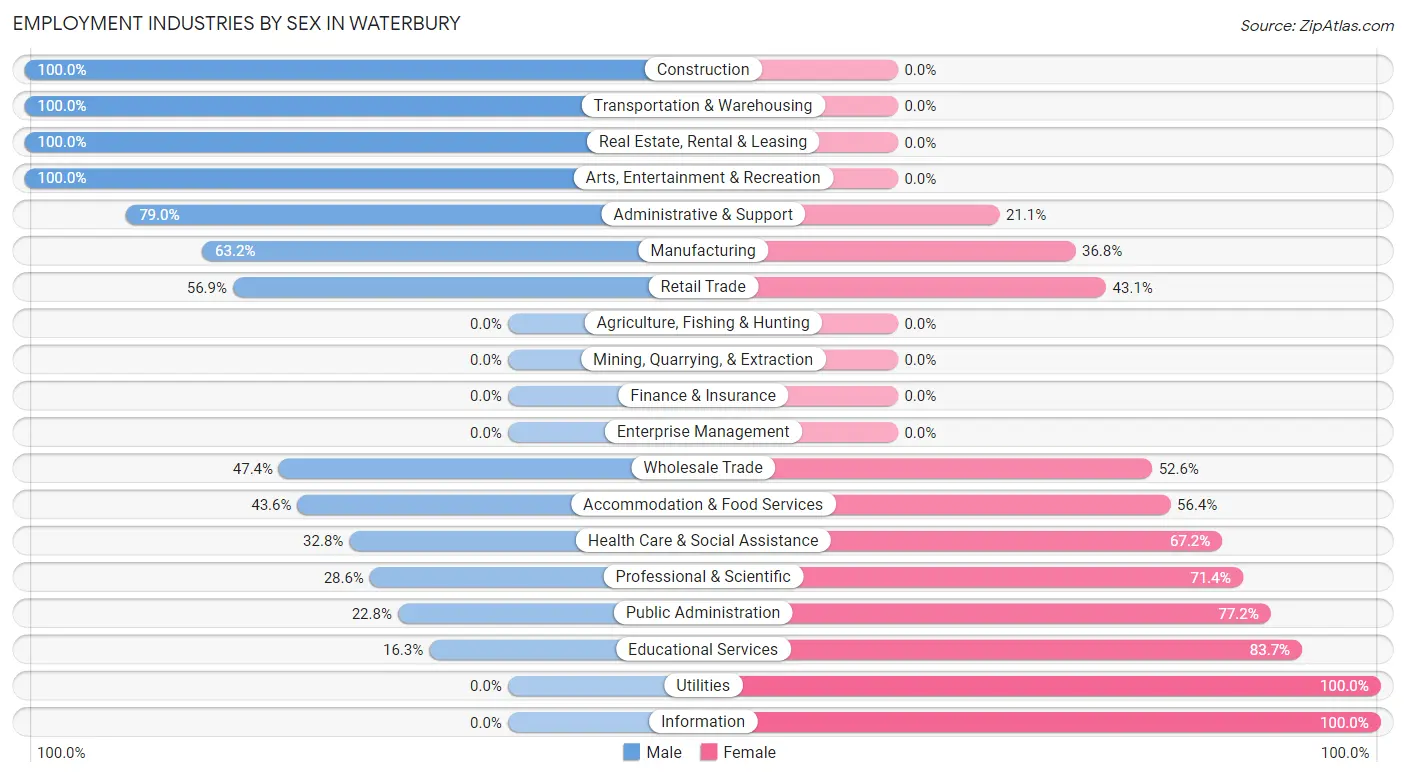
Employment Industries by Sex in Waterbury
The Waterbury industries that see more men than women are Construction (100.0%), Transportation & Warehousing (100.0%), and Real Estate, Rental & Leasing (100.0%), whereas the industries that tend to have a higher number of women are Utilities (100.0%), Information (100.0%), and Educational Services (83.7%).
| Industry | Male | Female |
| Agriculture, Fishing & Hunting | 0 (0.0%) | 0 (0.0%) |
| Mining, Quarrying, & Extraction | 0 (0.0%) | 0 (0.0%) |
| Construction | 75 (100.0%) | 0 (0.0%) |
| Manufacturing | 43 (63.2%) | 25 (36.8%) |
| Wholesale Trade | 18 (47.4%) | 20 (52.6%) |
| Retail Trade | 33 (56.9%) | 25 (43.1%) |
| Transportation & Warehousing | 7 (100.0%) | 0 (0.0%) |
| Utilities | 0 (0.0%) | 4 (100.0%) |
| Information | 0 (0.0%) | 6 (100.0%) |
| Finance & Insurance | 0 (0.0%) | 0 (0.0%) |
| Real Estate, Rental & Leasing | 27 (100.0%) | 0 (0.0%) |
| Professional & Scientific | 22 (28.6%) | 55 (71.4%) |
| Enterprise Management | 0 (0.0%) | 0 (0.0%) |
| Administrative & Support | 30 (78.9%) | 8 (21.0%) |
| Educational Services | 7 (16.3%) | 36 (83.7%) |
| Health Care & Social Assistance | 43 (32.8%) | 88 (67.2%) |
| Arts, Entertainment & Recreation | 7 (100.0%) | 0 (0.0%) |
| Accommodation & Food Services | 44 (43.6%) | 57 (56.4%) |
| Public Administration | 23 (22.8%) | 78 (77.2%) |
| Total | 396 (46.0%) | 465 (54.0%) |
Education in Waterbury
School Enrollment in Waterbury
The most common levels of schooling among the 385 students in Waterbury are middle school (137 | 35.6%), elementary school (103 | 26.8%), and high school (50 | 13.0%).
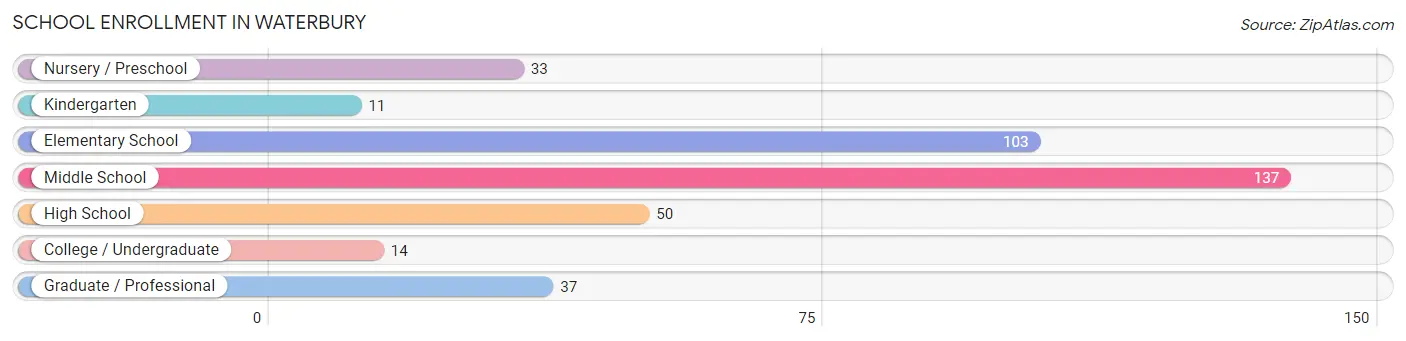
| School Level | # Students | % Students |
| Nursery / Preschool | 33 | 8.6% |
| Kindergarten | 11 | 2.9% |
| Elementary School | 103 | 26.8% |
| Middle School | 137 | 35.6% |
| High School | 50 | 13.0% |
| College / Undergraduate | 14 | 3.6% |
| Graduate / Professional | 37 | 9.6% |
| Total | 385 | 100.0% |
School Enrollment by Age by Funding Source in Waterbury
Out of a total of 385 students who are enrolled in schools in Waterbury, 71 (18.4%) attend a private institution, while the remaining 314 (81.6%) are enrolled in public schools. The age group of 20 to 24 year olds has the highest likelihood of being enrolled in private schools, with 14 (100.0% in the age bracket) enrolled. Conversely, the age group of 5 to 9 year old has the lowest likelihood of being enrolled in a private school, with 114 (100.0% in the age bracket) attending a public institution.
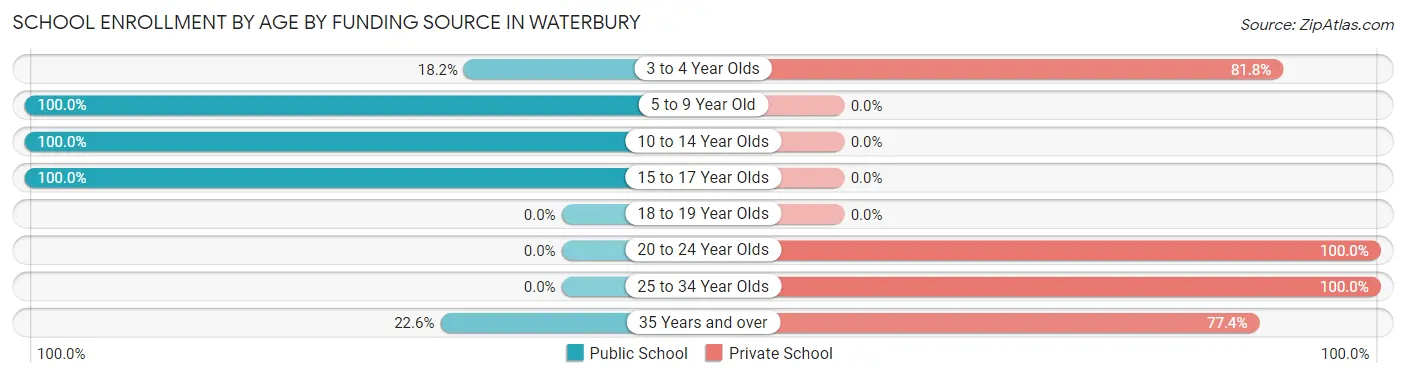
| Age Bracket | Public School | Private School |
| 3 to 4 Year Olds | 6 (18.2%) | 27 (81.8%) |
| 5 to 9 Year Old | 114 (100.0%) | 0 (0.0%) |
| 10 to 14 Year Olds | 147 (100.0%) | 0 (0.0%) |
| 15 to 17 Year Olds | 40 (100.0%) | 0 (0.0%) |
| 18 to 19 Year Olds | 0 (0.0%) | 0 (0.0%) |
| 20 to 24 Year Olds | 0 (0.0%) | 14 (100.0%) |
| 25 to 34 Year Olds | 0 (0.0%) | 6 (100.0%) |
| 35 Years and over | 7 (22.6%) | 24 (77.4%) |
| Total | 314 (81.6%) | 71 (18.4%) |
Educational Attainment by Field of Study in Waterbury
Literature & languages (111 | 14.6%), social sciences (107 | 14.1%), education (99 | 13.1%), bio, nature & agricultural (73 | 9.6%), and science & technology (72 | 9.5%) are the most common fields of study among 758 individuals in Waterbury who have obtained a bachelor's degree or higher.
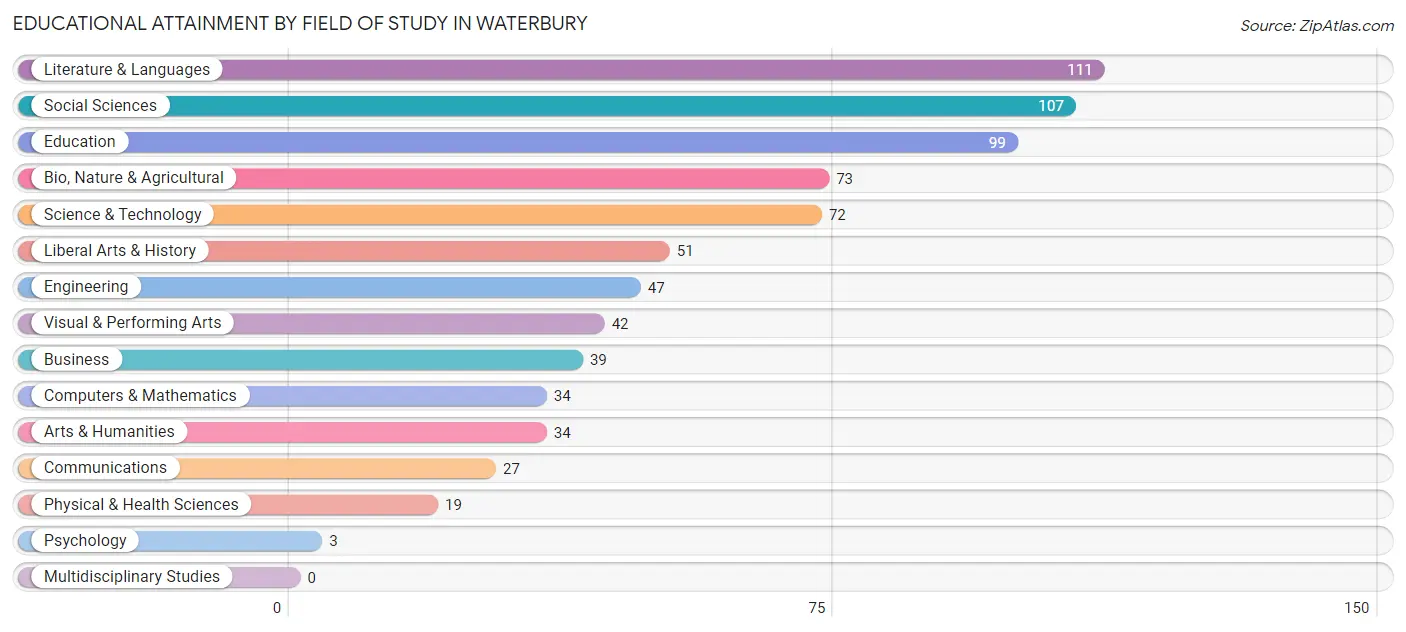
| Field of Study | # Graduates | % Graduates |
| Computers & Mathematics | 34 | 4.5% |
| Bio, Nature & Agricultural | 73 | 9.6% |
| Physical & Health Sciences | 19 | 2.5% |
| Psychology | 3 | 0.4% |
| Social Sciences | 107 | 14.1% |
| Engineering | 47 | 6.2% |
| Multidisciplinary Studies | 0 | 0.0% |
| Science & Technology | 72 | 9.5% |
| Business | 39 | 5.1% |
| Education | 99 | 13.1% |
| Literature & Languages | 111 | 14.6% |
| Liberal Arts & History | 51 | 6.7% |
| Visual & Performing Arts | 42 | 5.5% |
| Communications | 27 | 3.6% |
| Arts & Humanities | 34 | 4.5% |
| Total | 758 | 100.0% |
Transportation & Commute in Waterbury
Vehicle Availability by Sex in Waterbury
The most prevalent vehicle ownership categories in Waterbury are males with 2 vehicles (168, accounting for 44.0%) and females with 2 vehicles (204, making up 36.1%).
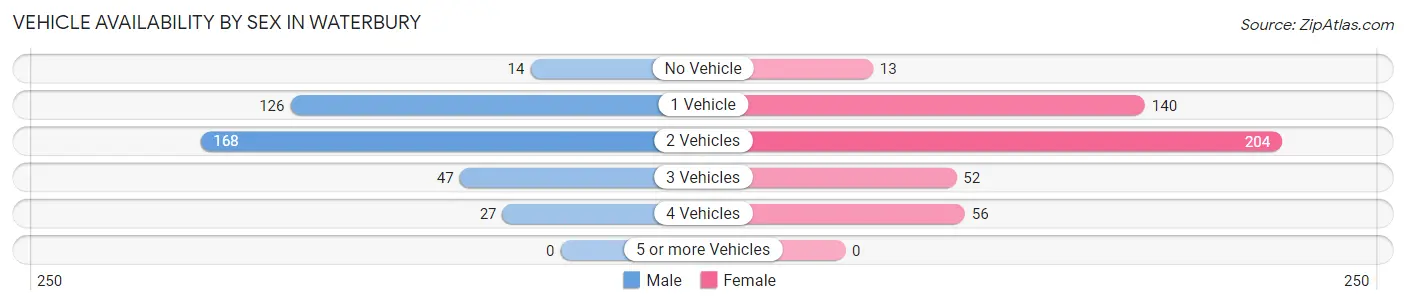
| Vehicles Available | Male | Female |
| No Vehicle | 14 (3.7%) | 13 (2.8%) |
| 1 Vehicle | 126 (33.0%) | 140 (30.1%) |
| 2 Vehicles | 168 (44.0%) | 204 (43.9%) |
| 3 Vehicles | 47 (12.3%) | 52 (11.2%) |
| 4 Vehicles | 27 (7.1%) | 56 (12.0%) |
| 5 or more Vehicles | 0 (0.0%) | 0 (0.0%) |
| Total | 382 (100.0%) | 465 (100.0%) |
Commute Time in Waterbury
The most frequently occuring commute durations in Waterbury are 30 to 34 minutes (135 commuters, 18.6%), 15 to 19 minutes (126 commuters, 17.3%), and 5 to 9 minutes (100 commuters, 13.8%).
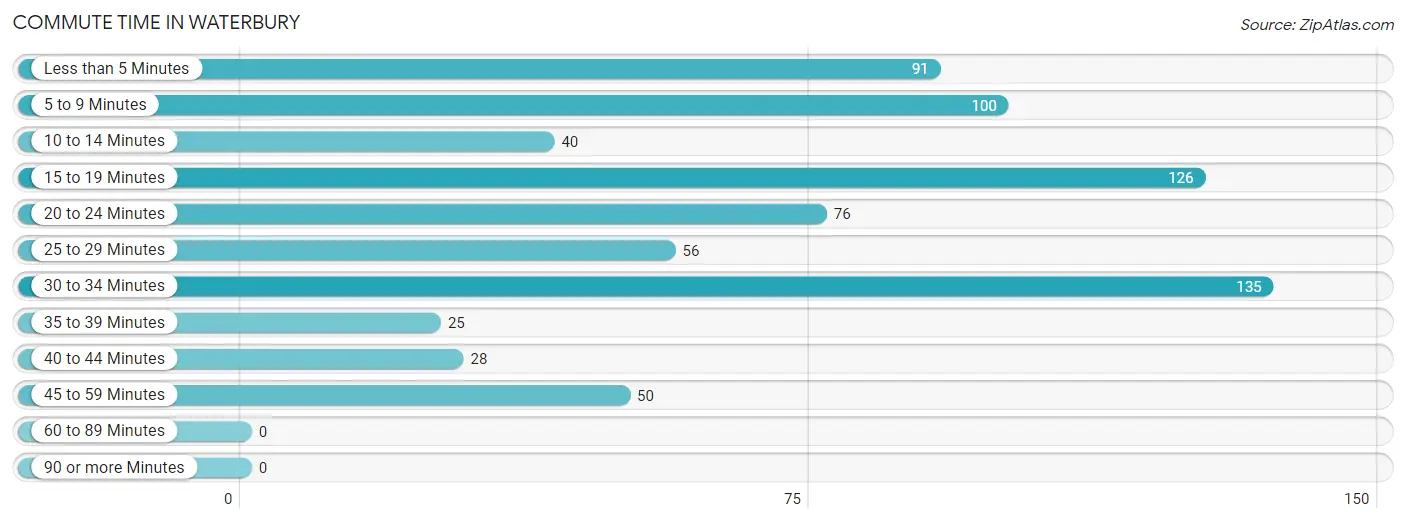
| Commute Time | # Commuters | % Commuters |
| Less than 5 Minutes | 91 | 12.5% |
| 5 to 9 Minutes | 100 | 13.8% |
| 10 to 14 Minutes | 40 | 5.5% |
| 15 to 19 Minutes | 126 | 17.3% |
| 20 to 24 Minutes | 76 | 10.4% |
| 25 to 29 Minutes | 56 | 7.7% |
| 30 to 34 Minutes | 135 | 18.6% |
| 35 to 39 Minutes | 25 | 3.4% |
| 40 to 44 Minutes | 28 | 3.8% |
| 45 to 59 Minutes | 50 | 6.9% |
| 60 to 89 Minutes | 0 | 0.0% |
| 90 or more Minutes | 0 | 0.0% |
Commute Time by Sex in Waterbury
The most common commute times in Waterbury are 30 to 34 minutes (93 commuters, 28.2%) for males and 5 to 9 minutes (78 commuters, 19.7%) for females.
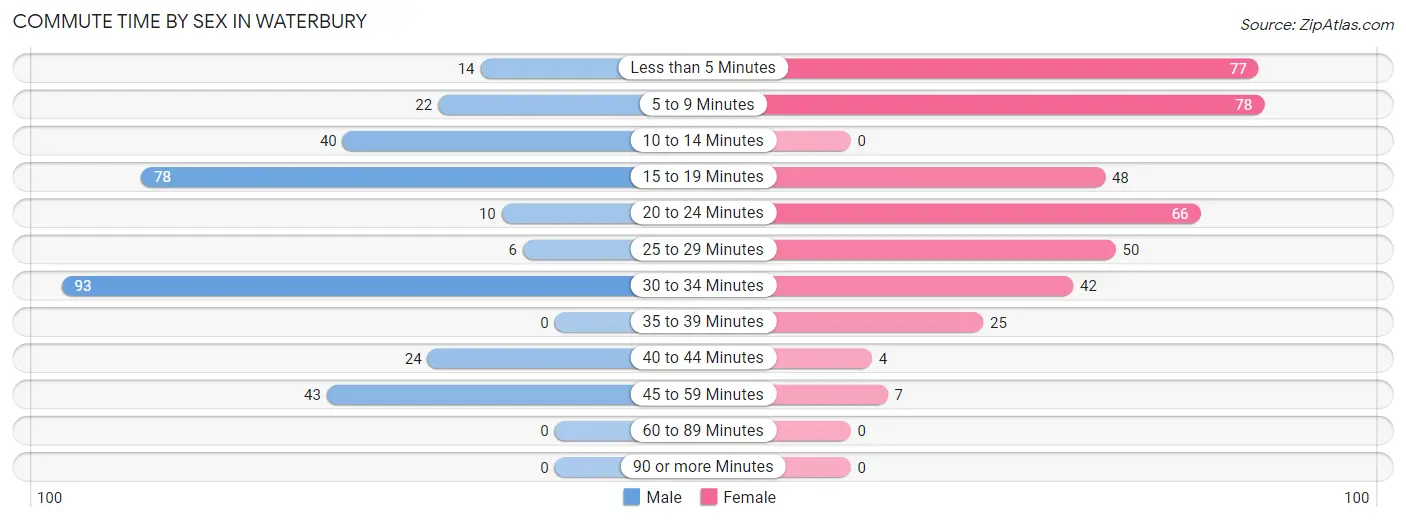
| Commute Time | Male | Female |
| Less than 5 Minutes | 14 (4.2%) | 77 (19.4%) |
| 5 to 9 Minutes | 22 (6.7%) | 78 (19.7%) |
| 10 to 14 Minutes | 40 (12.1%) | 0 (0.0%) |
| 15 to 19 Minutes | 78 (23.6%) | 48 (12.1%) |
| 20 to 24 Minutes | 10 (3.0%) | 66 (16.6%) |
| 25 to 29 Minutes | 6 (1.8%) | 50 (12.6%) |
| 30 to 34 Minutes | 93 (28.2%) | 42 (10.6%) |
| 35 to 39 Minutes | 0 (0.0%) | 25 (6.3%) |
| 40 to 44 Minutes | 24 (7.3%) | 4 (1.0%) |
| 45 to 59 Minutes | 43 (13.0%) | 7 (1.8%) |
| 60 to 89 Minutes | 0 (0.0%) | 0 (0.0%) |
| 90 or more Minutes | 0 (0.0%) | 0 (0.0%) |
Time of Departure to Work by Sex in Waterbury
The most frequent times of departure to work in Waterbury are 8:00 AM to 8:29 AM (131, 39.7%) for males and 8:00 AM to 8:29 AM (86, 21.7%) for females.
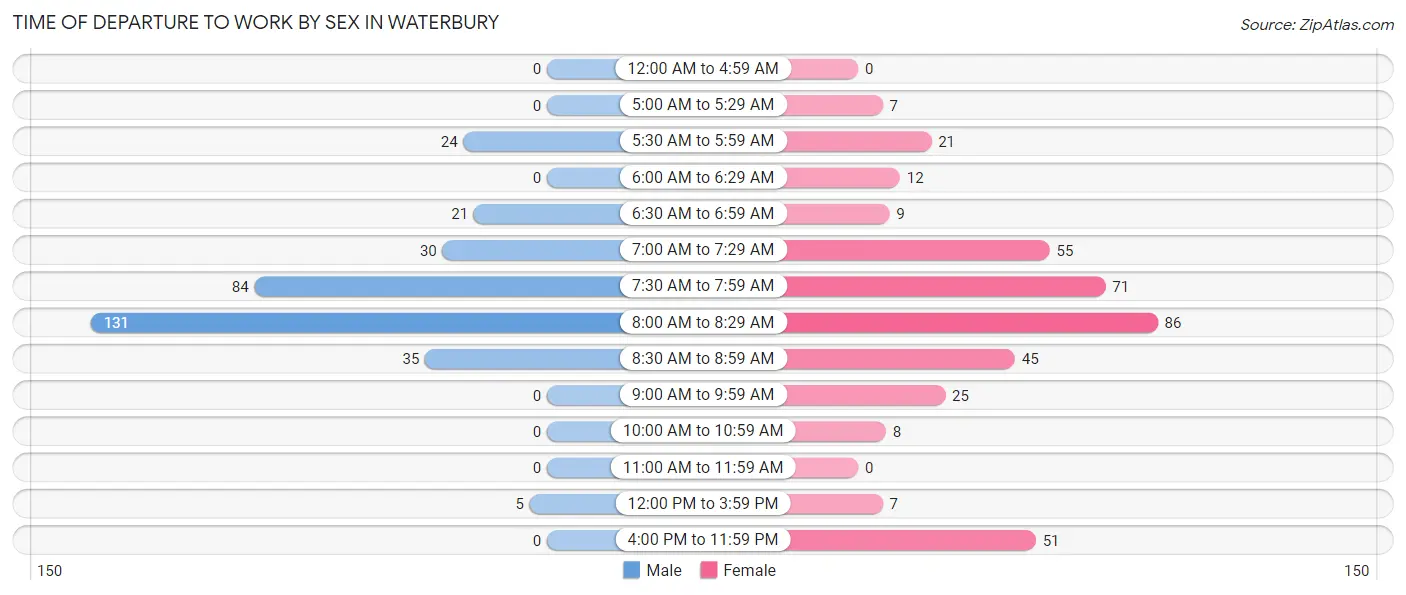
| Time of Departure | Male | Female |
| 12:00 AM to 4:59 AM | 0 (0.0%) | 0 (0.0%) |
| 5:00 AM to 5:29 AM | 0 (0.0%) | 7 (1.8%) |
| 5:30 AM to 5:59 AM | 24 (7.3%) | 21 (5.3%) |
| 6:00 AM to 6:29 AM | 0 (0.0%) | 12 (3.0%) |
| 6:30 AM to 6:59 AM | 21 (6.4%) | 9 (2.3%) |
| 7:00 AM to 7:29 AM | 30 (9.1%) | 55 (13.9%) |
| 7:30 AM to 7:59 AM | 84 (25.5%) | 71 (17.9%) |
| 8:00 AM to 8:29 AM | 131 (39.7%) | 86 (21.7%) |
| 8:30 AM to 8:59 AM | 35 (10.6%) | 45 (11.3%) |
| 9:00 AM to 9:59 AM | 0 (0.0%) | 25 (6.3%) |
| 10:00 AM to 10:59 AM | 0 (0.0%) | 8 (2.0%) |
| 11:00 AM to 11:59 AM | 0 (0.0%) | 0 (0.0%) |
| 12:00 PM to 3:59 PM | 5 (1.5%) | 7 (1.8%) |
| 4:00 PM to 11:59 PM | 0 (0.0%) | 51 (12.9%) |
| Total | 330 (100.0%) | 397 (100.0%) |
Housing Occupancy in Waterbury
Occupancy by Ownership in Waterbury
Of the total 819 dwellings in Waterbury, owner-occupied units account for 310 (37.9%), while renter-occupied units make up 509 (62.2%).
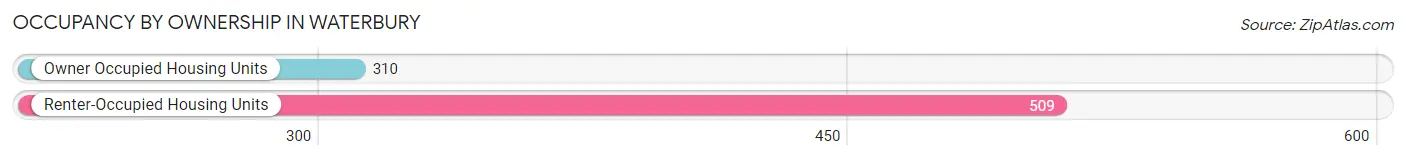
| Occupancy | # Housing Units | % Housing Units |
| Owner Occupied Housing Units | 310 | 37.9% |
| Renter-Occupied Housing Units | 509 | 62.2% |
| Total Occupied Housing Units | 819 | 100.0% |
Occupancy by Household Size in Waterbury
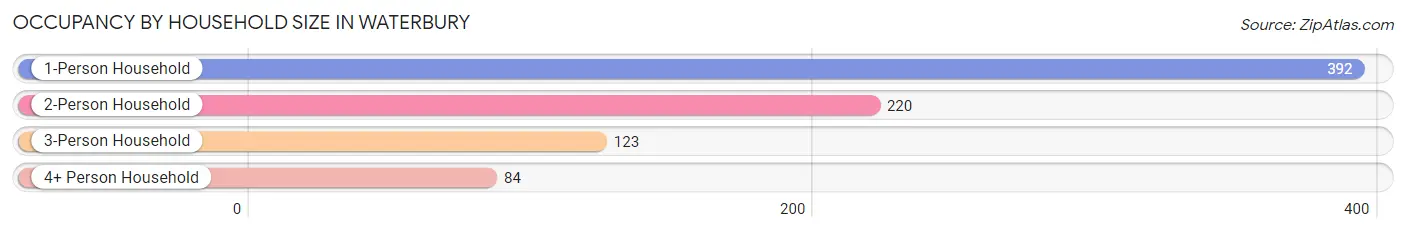
| Household Size | # Housing Units | % Housing Units |
| 1-Person Household | 392 | 47.9% |
| 2-Person Household | 220 | 26.9% |
| 3-Person Household | 123 | 15.0% |
| 4+ Person Household | 84 | 10.3% |
| Total Housing Units | 819 | 100.0% |
Occupancy by Ownership by Household Size in Waterbury
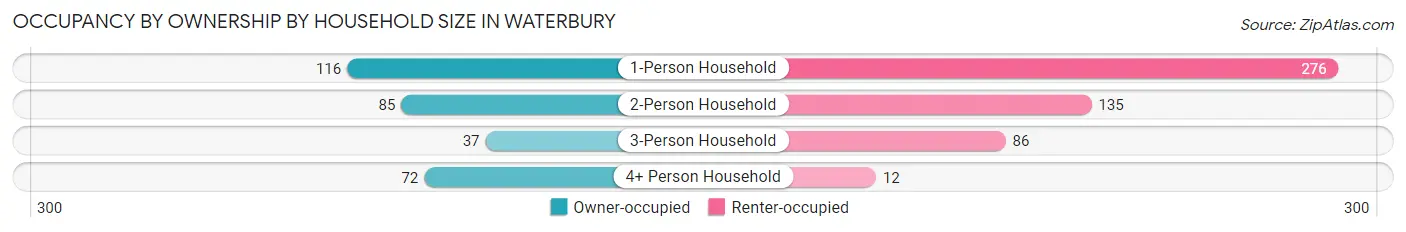
| Household Size | Owner-occupied | Renter-occupied |
| 1-Person Household | 116 (29.6%) | 276 (70.4%) |
| 2-Person Household | 85 (38.6%) | 135 (61.4%) |
| 3-Person Household | 37 (30.1%) | 86 (69.9%) |
| 4+ Person Household | 72 (85.7%) | 12 (14.3%) |
| Total Housing Units | 310 (37.9%) | 509 (62.2%) |
Occupancy by Educational Attainment in Waterbury
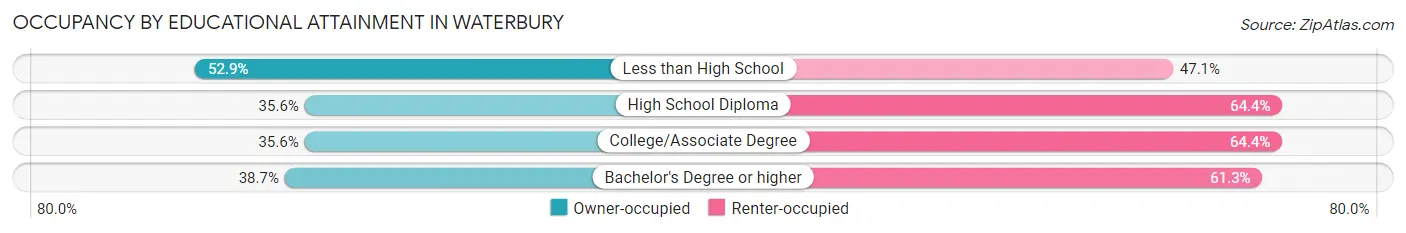
| Household Size | Owner-occupied | Renter-occupied |
| Less than High School | 9 (52.9%) | 8 (47.1%) |
| High School Diploma | 37 (35.6%) | 67 (64.4%) |
| College/Associate Degree | 73 (35.6%) | 132 (64.4%) |
| Bachelor's Degree or higher | 191 (38.7%) | 302 (61.3%) |
Occupancy by Age of Householder in Waterbury
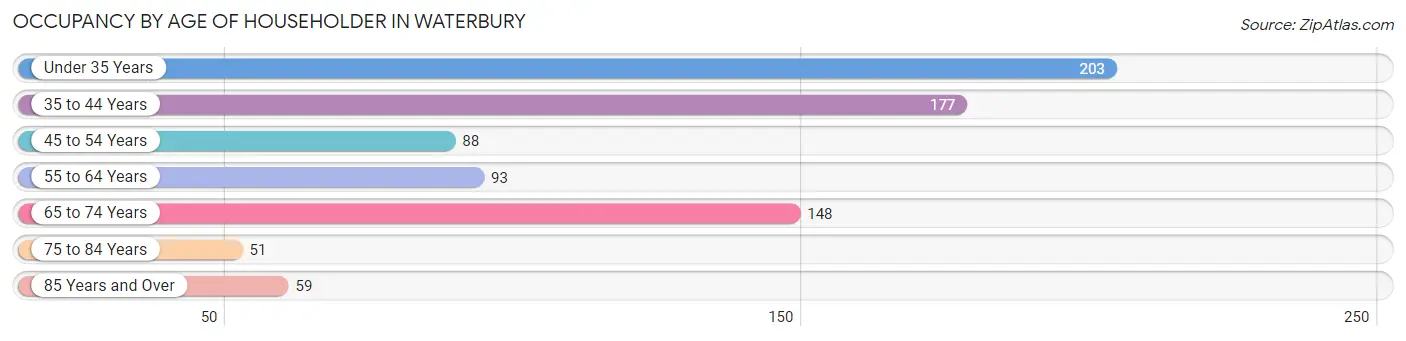
| Age Bracket | # Households | % Households |
| Under 35 Years | 203 | 24.8% |
| 35 to 44 Years | 177 | 21.6% |
| 45 to 54 Years | 88 | 10.7% |
| 55 to 64 Years | 93 | 11.4% |
| 65 to 74 Years | 148 | 18.1% |
| 75 to 84 Years | 51 | 6.2% |
| 85 Years and Over | 59 | 7.2% |
| Total | 819 | 100.0% |
Housing Finances in Waterbury
Median Income by Occupancy in Waterbury
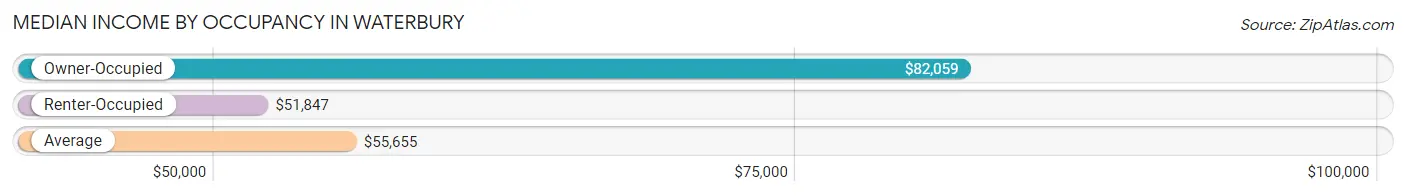
| Occupancy Type | # Households | Median Income |
| Owner-Occupied | 310 (37.9%) | $82,059 |
| Renter-Occupied | 509 (62.2%) | $51,847 |
| Average | 819 (100.0%) | $55,655 |
Occupancy by Householder Income Bracket in Waterbury
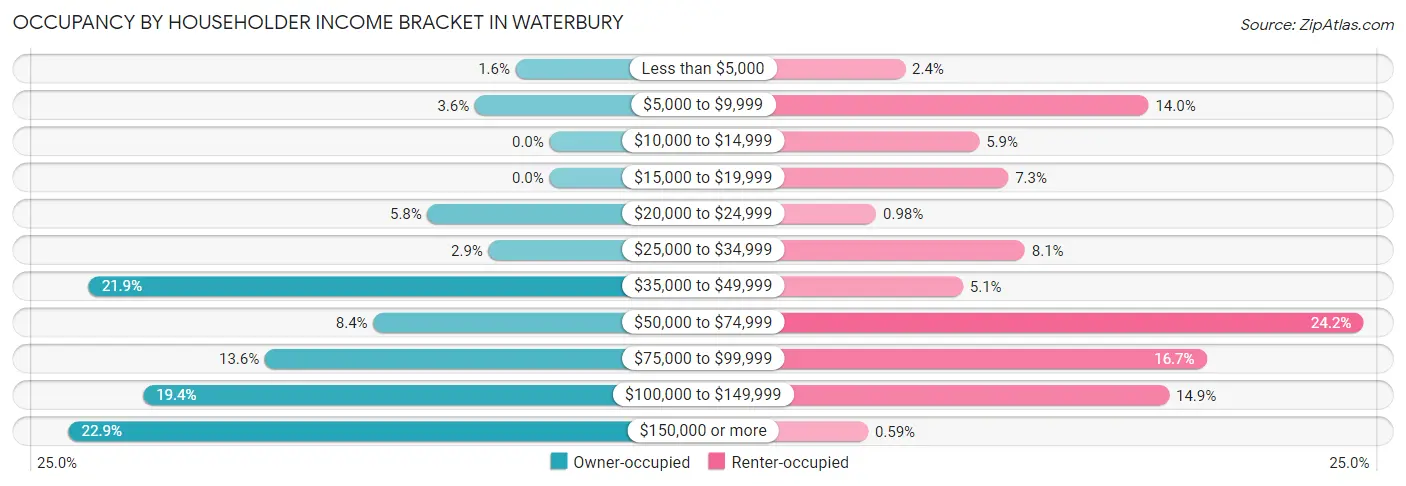
| Income Bracket | Owner-occupied | Renter-occupied |
| Less than $5,000 | 5 (1.6%) | 12 (2.4%) |
| $5,000 to $9,999 | 11 (3.5%) | 71 (14.0%) |
| $10,000 to $14,999 | 0 (0.0%) | 30 (5.9%) |
| $15,000 to $19,999 | 0 (0.0%) | 37 (7.3%) |
| $20,000 to $24,999 | 18 (5.8%) | 5 (1.0%) |
| $25,000 to $34,999 | 9 (2.9%) | 41 (8.1%) |
| $35,000 to $49,999 | 68 (21.9%) | 26 (5.1%) |
| $50,000 to $74,999 | 26 (8.4%) | 123 (24.2%) |
| $75,000 to $99,999 | 42 (13.6%) | 85 (16.7%) |
| $100,000 to $149,999 | 60 (19.4%) | 76 (14.9%) |
| $150,000 or more | 71 (22.9%) | 3 (0.6%) |
| Total | 310 (100.0%) | 509 (100.0%) |
Monthly Housing Cost Tiers in Waterbury
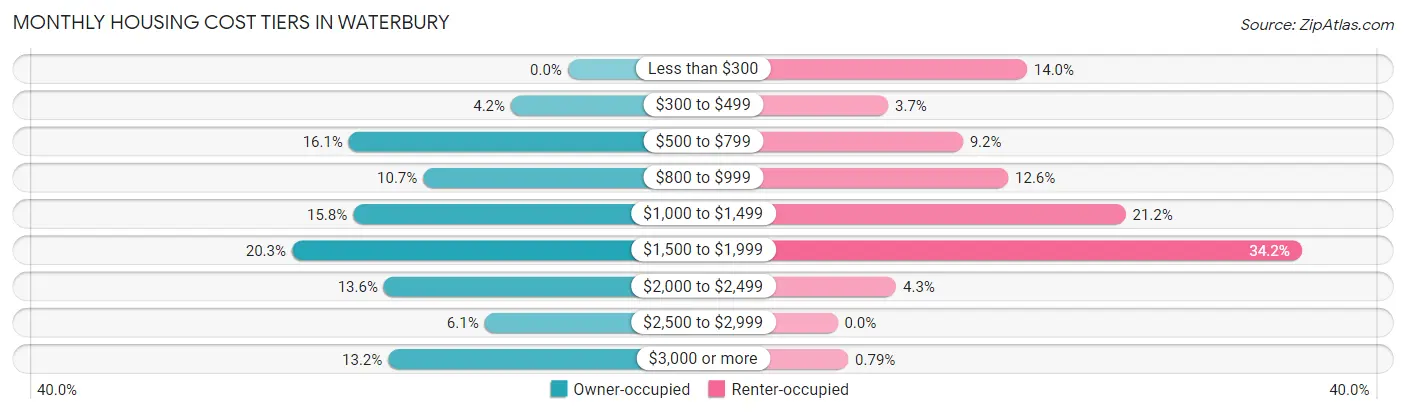
| Monthly Cost | Owner-occupied | Renter-occupied |
| Less than $300 | 0 (0.0%) | 71 (14.0%) |
| $300 to $499 | 13 (4.2%) | 19 (3.7%) |
| $500 to $799 | 50 (16.1%) | 47 (9.2%) |
| $800 to $999 | 33 (10.6%) | 64 (12.6%) |
| $1,000 to $1,499 | 49 (15.8%) | 108 (21.2%) |
| $1,500 to $1,999 | 63 (20.3%) | 174 (34.2%) |
| $2,000 to $2,499 | 42 (13.6%) | 22 (4.3%) |
| $2,500 to $2,999 | 19 (6.1%) | 0 (0.0%) |
| $3,000 or more | 41 (13.2%) | 4 (0.8%) |
| Total | 310 (100.0%) | 509 (100.0%) |
Physical Housing Characteristics in Waterbury
Housing Structures in Waterbury
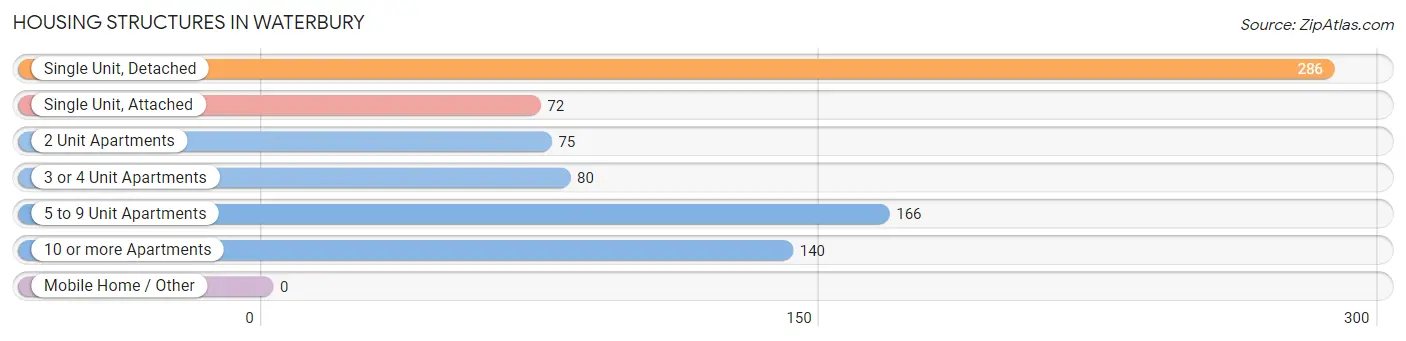
| Structure Type | # Housing Units | % Housing Units |
| Single Unit, Detached | 286 | 34.9% |
| Single Unit, Attached | 72 | 8.8% |
| 2 Unit Apartments | 75 | 9.2% |
| 3 or 4 Unit Apartments | 80 | 9.8% |
| 5 to 9 Unit Apartments | 166 | 20.3% |
| 10 or more Apartments | 140 | 17.1% |
| Mobile Home / Other | 0 | 0.0% |
| Total | 819 | 100.0% |
Housing Structures by Occupancy in Waterbury
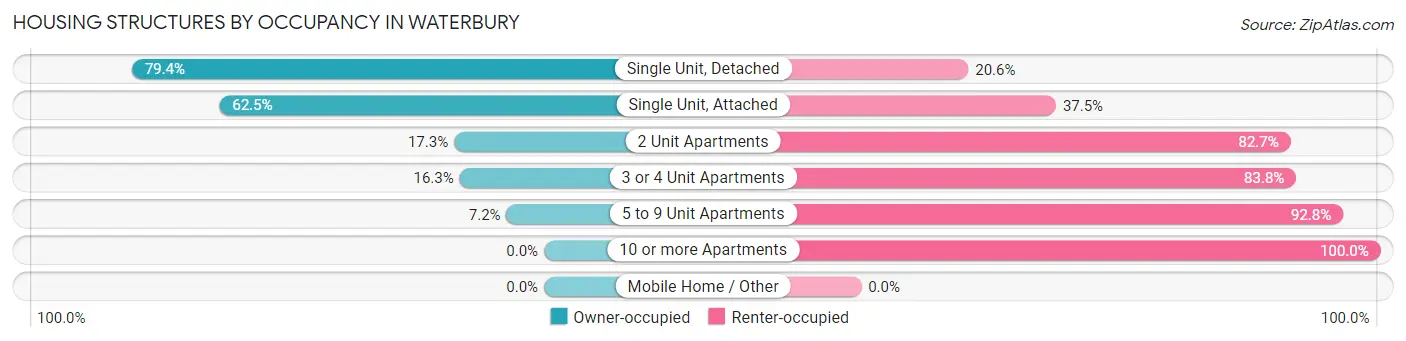
| Structure Type | Owner-occupied | Renter-occupied |
| Single Unit, Detached | 227 (79.4%) | 59 (20.6%) |
| Single Unit, Attached | 45 (62.5%) | 27 (37.5%) |
| 2 Unit Apartments | 13 (17.3%) | 62 (82.7%) |
| 3 or 4 Unit Apartments | 13 (16.3%) | 67 (83.8%) |
| 5 to 9 Unit Apartments | 12 (7.2%) | 154 (92.8%) |
| 10 or more Apartments | 0 (0.0%) | 140 (100.0%) |
| Mobile Home / Other | 0 (0.0%) | 0 (0.0%) |
| Total | 310 (37.9%) | 509 (62.2%) |
Housing Structures by Number of Rooms in Waterbury
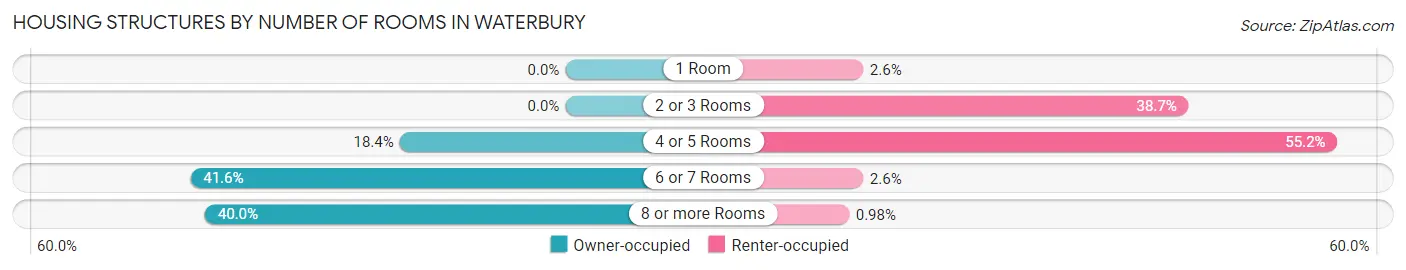
| Number of Rooms | Owner-occupied | Renter-occupied |
| 1 Room | 0 (0.0%) | 13 (2.5%) |
| 2 or 3 Rooms | 0 (0.0%) | 197 (38.7%) |
| 4 or 5 Rooms | 57 (18.4%) | 281 (55.2%) |
| 6 or 7 Rooms | 129 (41.6%) | 13 (2.5%) |
| 8 or more Rooms | 124 (40.0%) | 5 (1.0%) |
| Total | 310 (100.0%) | 509 (100.0%) |
Housing Structure by Heating Type in Waterbury
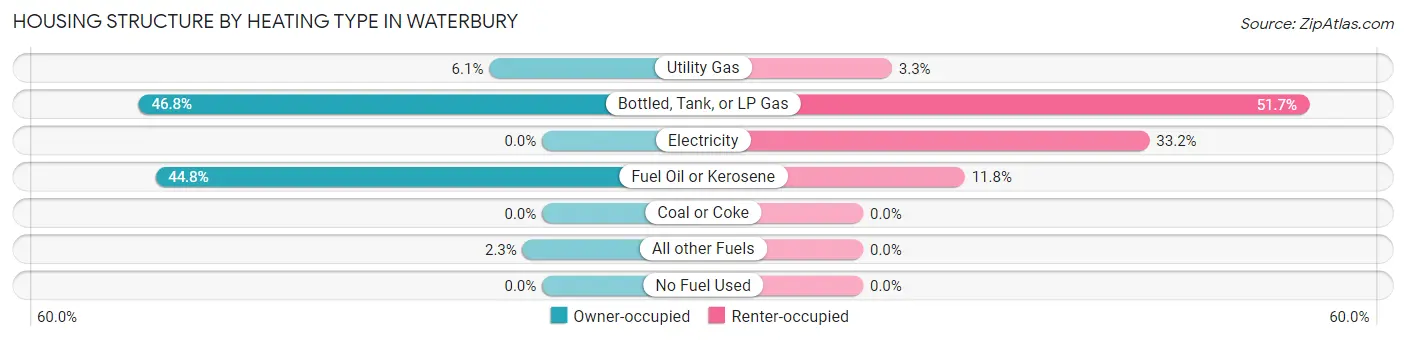
| Heating Type | Owner-occupied | Renter-occupied |
| Utility Gas | 19 (6.1%) | 17 (3.3%) |
| Bottled, Tank, or LP Gas | 145 (46.8%) | 263 (51.7%) |
| Electricity | 0 (0.0%) | 169 (33.2%) |
| Fuel Oil or Kerosene | 139 (44.8%) | 60 (11.8%) |
| Coal or Coke | 0 (0.0%) | 0 (0.0%) |
| All other Fuels | 7 (2.3%) | 0 (0.0%) |
| No Fuel Used | 0 (0.0%) | 0 (0.0%) |
| Total | 310 (100.0%) | 509 (100.0%) |
Household Vehicle Usage in Waterbury
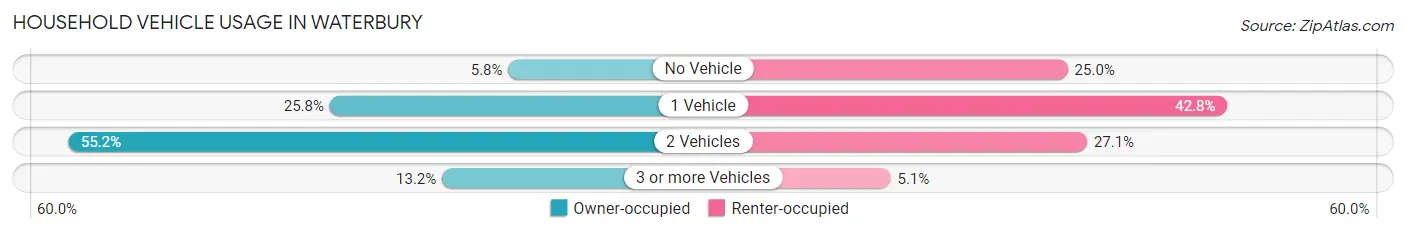
| Vehicles per Household | Owner-occupied | Renter-occupied |
| No Vehicle | 18 (5.8%) | 127 (24.9%) |
| 1 Vehicle | 80 (25.8%) | 218 (42.8%) |
| 2 Vehicles | 171 (55.2%) | 138 (27.1%) |
| 3 or more Vehicles | 41 (13.2%) | 26 (5.1%) |
| Total | 310 (100.0%) | 509 (100.0%) |
Real Estate & Mortgages in Waterbury
Real Estate and Mortgage Overview in Waterbury
| Characteristic | Without Mortgage | With Mortgage |
| Housing Units | 120 | 190 |
| Median Property Value | $292,000 | $353,700 |
| Median Household Income | $44,464 | $71 |
| Monthly Housing Costs | $907 | $41 |
| Real Estate Taxes | $5,648 | $0 |
Property Value by Mortgage Status in Waterbury
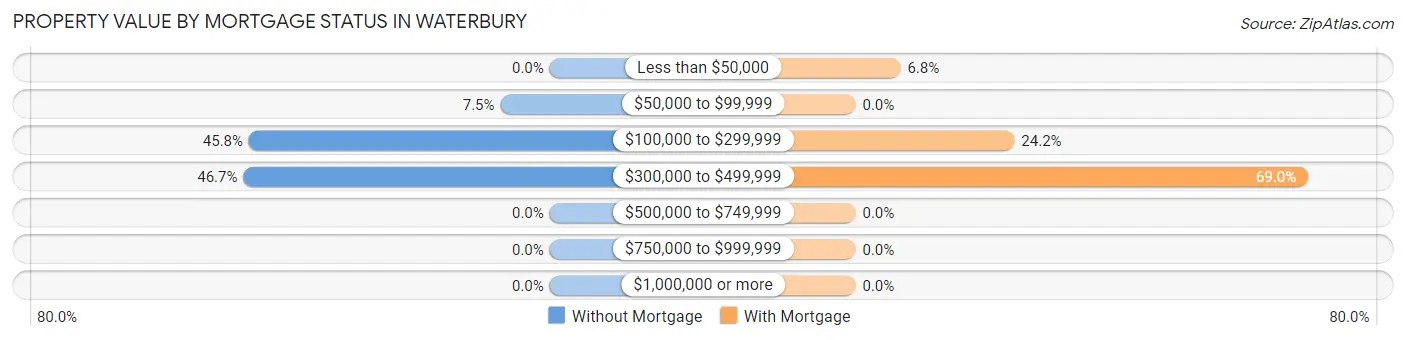
| Property Value | Without Mortgage | With Mortgage |
| Less than $50,000 | 0 (0.0%) | 13 (6.8%) |
| $50,000 to $99,999 | 9 (7.5%) | 0 (0.0%) |
| $100,000 to $299,999 | 55 (45.8%) | 46 (24.2%) |
| $300,000 to $499,999 | 56 (46.7%) | 131 (69.0%) |
| $500,000 to $749,999 | 0 (0.0%) | 0 (0.0%) |
| $750,000 to $999,999 | 0 (0.0%) | 0 (0.0%) |
| $1,000,000 or more | 0 (0.0%) | 0 (0.0%) |
| Total | 120 (100.0%) | 190 (100.0%) |
Household Income by Mortgage Status in Waterbury
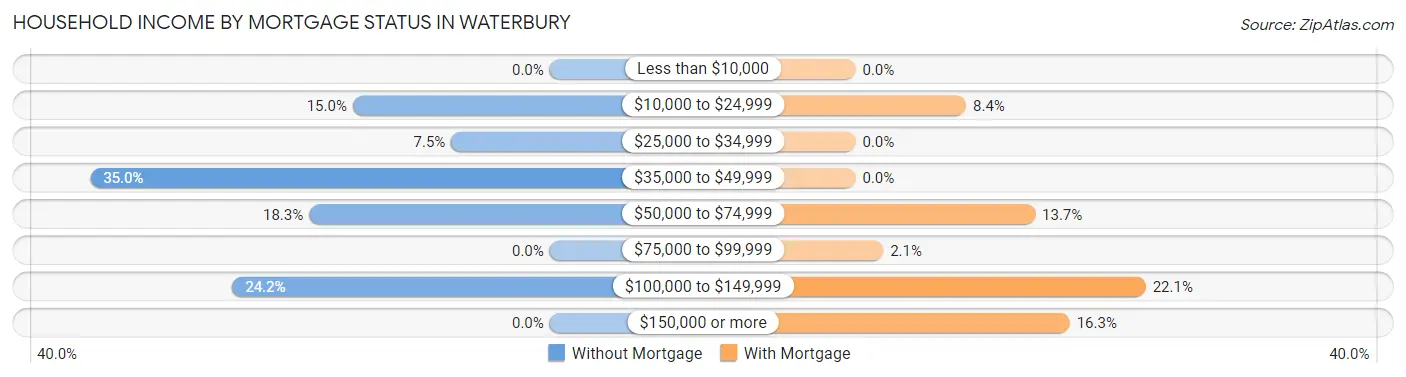
| Household Income | Without Mortgage | With Mortgage |
| Less than $10,000 | 0 (0.0%) | 0 (0.0%) |
| $10,000 to $24,999 | 18 (15.0%) | 16 (8.4%) |
| $25,000 to $34,999 | 9 (7.5%) | 0 (0.0%) |
| $35,000 to $49,999 | 42 (35.0%) | 0 (0.0%) |
| $50,000 to $74,999 | 22 (18.3%) | 26 (13.7%) |
| $75,000 to $99,999 | 0 (0.0%) | 4 (2.1%) |
| $100,000 to $149,999 | 29 (24.2%) | 42 (22.1%) |
| $150,000 or more | 0 (0.0%) | 31 (16.3%) |
| Total | 120 (100.0%) | 190 (100.0%) |
Property Value to Household Income Ratio in Waterbury
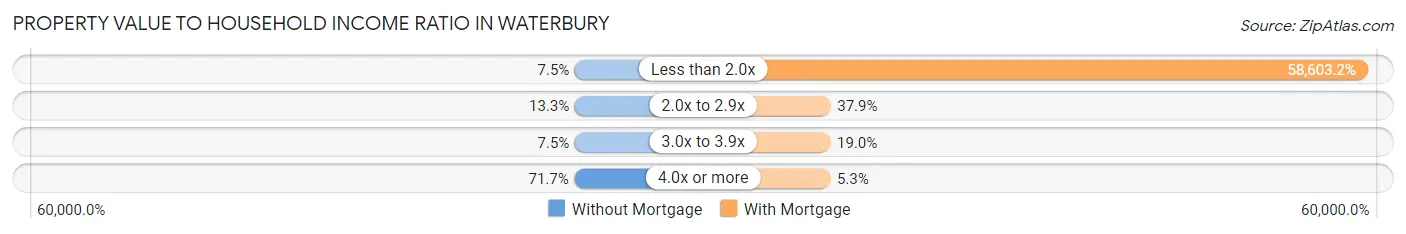
| Value-to-Income Ratio | Without Mortgage | With Mortgage |
| Less than 2.0x | 9 (7.5%) | 111,346 (58,603.2%) |
| 2.0x to 2.9x | 16 (13.3%) | 72 (37.9%) |
| 3.0x to 3.9x | 9 (7.5%) | 36 (19.0%) |
| 4.0x or more | 86 (71.7%) | 10 (5.3%) |
| Total | 120 (100.0%) | 190 (100.0%) |
Real Estate Taxes by Mortgage Status in Waterbury
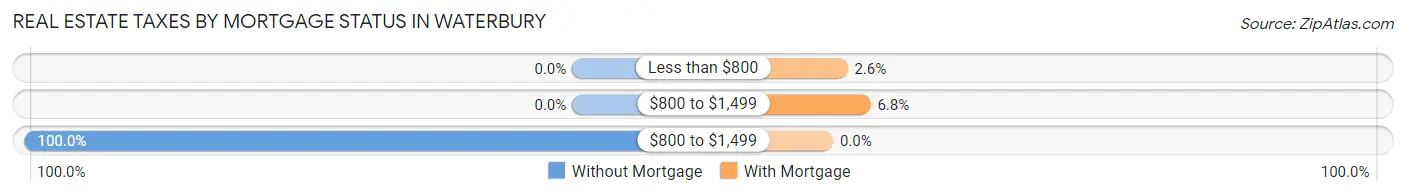
| Property Taxes | Without Mortgage | With Mortgage |
| Less than $800 | 0 (0.0%) | 5 (2.6%) |
| $800 to $1,499 | 0 (0.0%) | 13 (6.8%) |
| $800 to $1,499 | 120 (100.0%) | 0 (0.0%) |
| Total | 120 (100.0%) | 190 (100.0%) |
Health & Disability in Waterbury
Health Insurance Coverage by Age in Waterbury
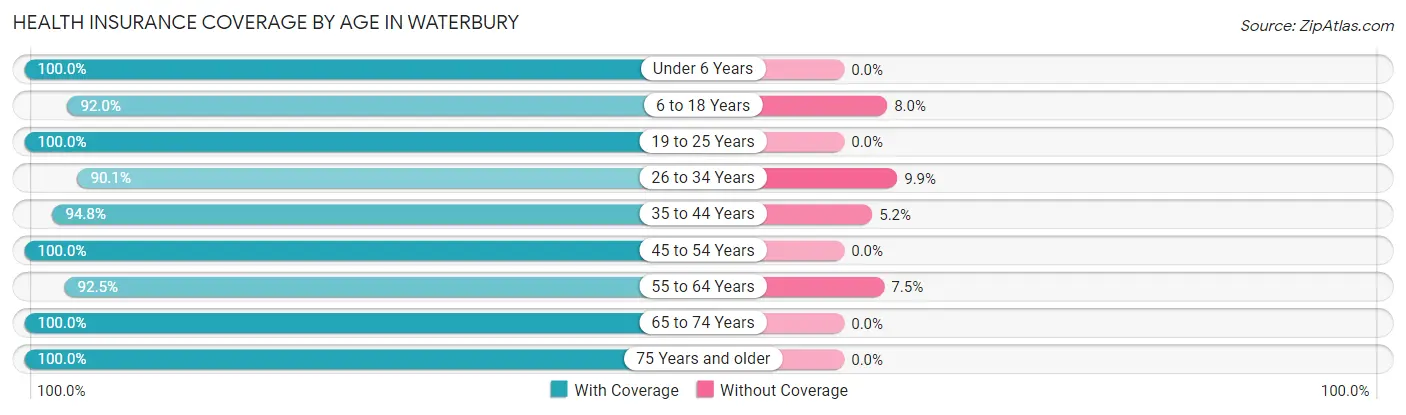
| Age Bracket | With Coverage | Without Coverage |
| Under 6 Years | 50 (100.0%) | 0 (0.0%) |
| 6 to 18 Years | 276 (92.0%) | 24 (8.0%) |
| 19 to 25 Years | 132 (100.0%) | 0 (0.0%) |
| 26 to 34 Years | 219 (90.1%) | 24 (9.9%) |
| 35 to 44 Years | 236 (94.8%) | 13 (5.2%) |
| 45 to 54 Years | 135 (100.0%) | 0 (0.0%) |
| 55 to 64 Years | 136 (92.5%) | 11 (7.5%) |
| 65 to 74 Years | 184 (100.0%) | 0 (0.0%) |
| 75 Years and older | 223 (100.0%) | 0 (0.0%) |
| Total | 1,591 (95.7%) | 72 (4.3%) |
Health Insurance Coverage by Citizenship Status in Waterbury
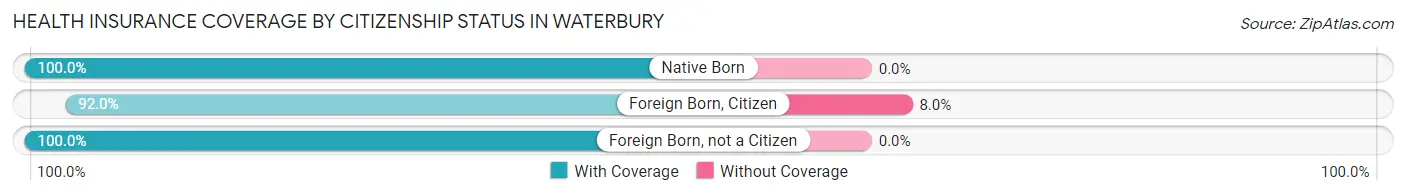
| Citizenship Status | With Coverage | Without Coverage |
| Native Born | 50 (100.0%) | 0 (0.0%) |
| Foreign Born, Citizen | 276 (92.0%) | 24 (8.0%) |
| Foreign Born, not a Citizen | 132 (100.0%) | 0 (0.0%) |
Health Insurance Coverage by Household Income in Waterbury
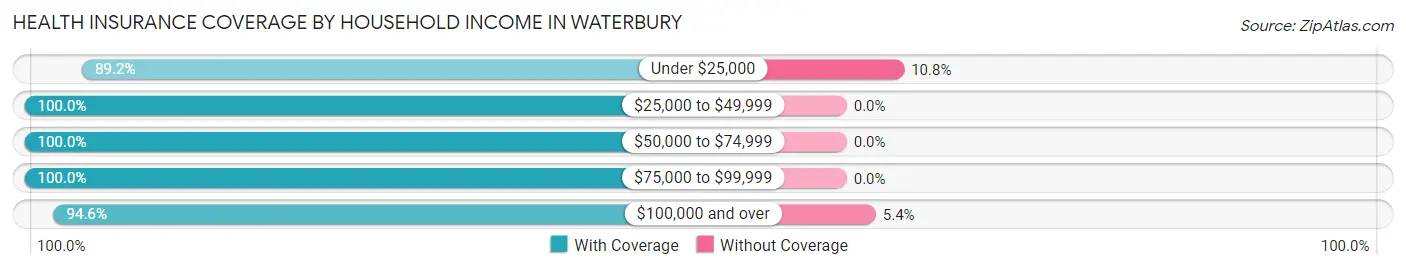
| Household Income | With Coverage | Without Coverage |
| Under $25,000 | 307 (89.2%) | 37 (10.8%) |
| $25,000 to $49,999 | 160 (100.0%) | 0 (0.0%) |
| $50,000 to $74,999 | 179 (100.0%) | 0 (0.0%) |
| $75,000 to $99,999 | 271 (100.0%) | 0 (0.0%) |
| $100,000 and over | 608 (94.6%) | 35 (5.4%) |
Public vs Private Health Insurance Coverage by Age in Waterbury
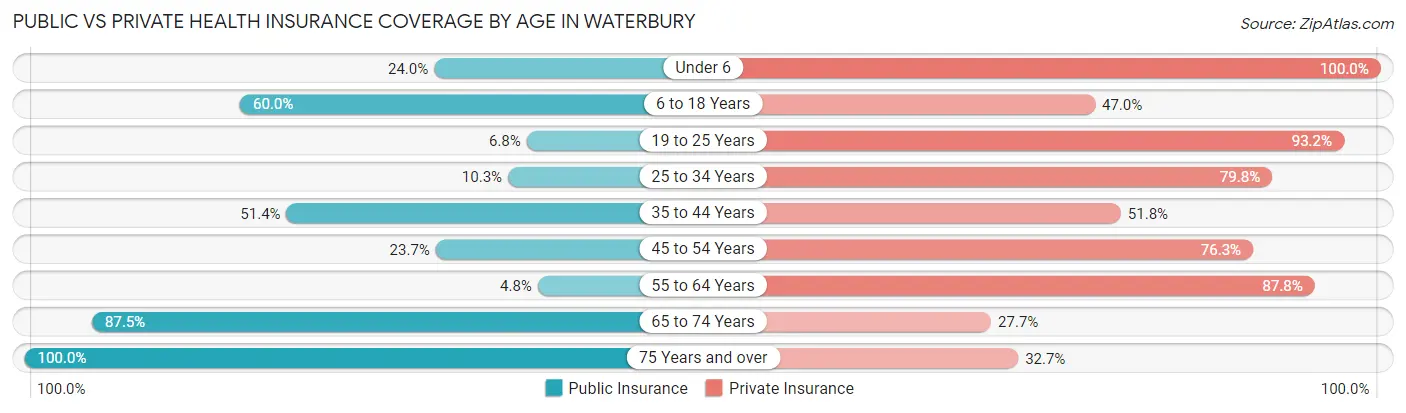
| Age Bracket | Public Insurance | Private Insurance |
| Under 6 | 12 (24.0%) | 50 (100.0%) |
| 6 to 18 Years | 180 (60.0%) | 141 (47.0%) |
| 19 to 25 Years | 9 (6.8%) | 123 (93.2%) |
| 25 to 34 Years | 25 (10.3%) | 194 (79.8%) |
| 35 to 44 Years | 128 (51.4%) | 129 (51.8%) |
| 45 to 54 Years | 32 (23.7%) | 103 (76.3%) |
| 55 to 64 Years | 7 (4.8%) | 129 (87.8%) |
| 65 to 74 Years | 161 (87.5%) | 51 (27.7%) |
| 75 Years and over | 223 (100.0%) | 73 (32.7%) |
| Total | 777 (46.7%) | 993 (59.7%) |
Disability Status by Sex by Age in Waterbury
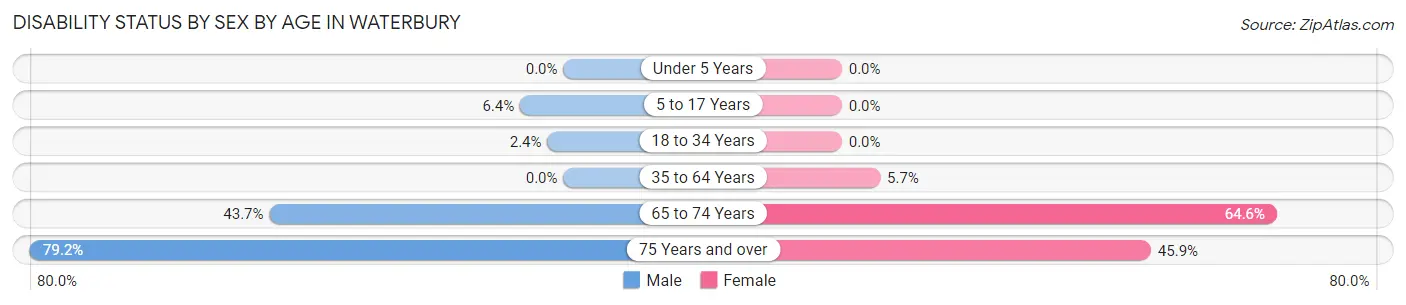
| Age Bracket | Male | Female |
| Under 5 Years | 0 (0.0%) | 0 (0.0%) |
| 5 to 17 Years | 11 (6.4%) | 0 (0.0%) |
| 18 to 34 Years | 5 (2.4%) | 0 (0.0%) |
| 35 to 64 Years | 0 (0.0%) | 16 (5.7%) |
| 65 to 74 Years | 31 (43.7%) | 73 (64.6%) |
| 75 Years and over | 80 (79.2%) | 56 (45.9%) |
Disability Class by Sex by Age in Waterbury
Disability Class: Hearing Difficulty
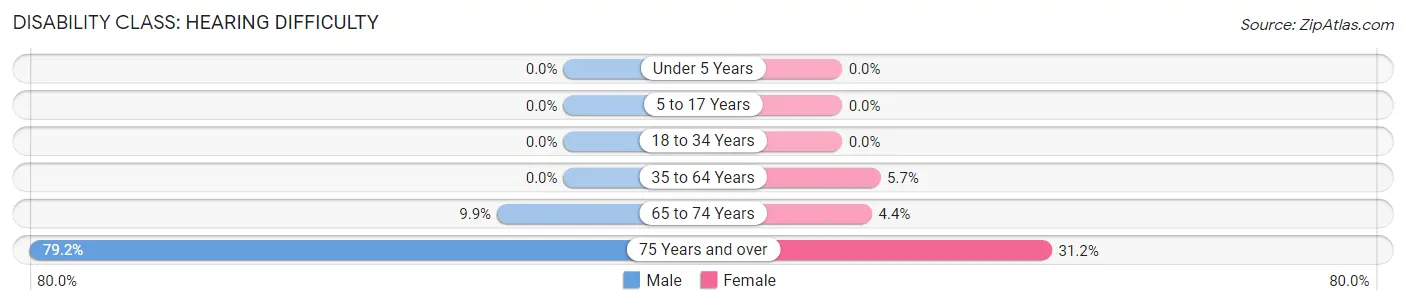
| Age Bracket | Male | Female |
| Under 5 Years | 0 (0.0%) | 0 (0.0%) |
| 5 to 17 Years | 0 (0.0%) | 0 (0.0%) |
| 18 to 34 Years | 0 (0.0%) | 0 (0.0%) |
| 35 to 64 Years | 0 (0.0%) | 16 (5.7%) |
| 65 to 74 Years | 7 (9.9%) | 5 (4.4%) |
| 75 Years and over | 80 (79.2%) | 38 (31.1%) |
Disability Class: Vision Difficulty
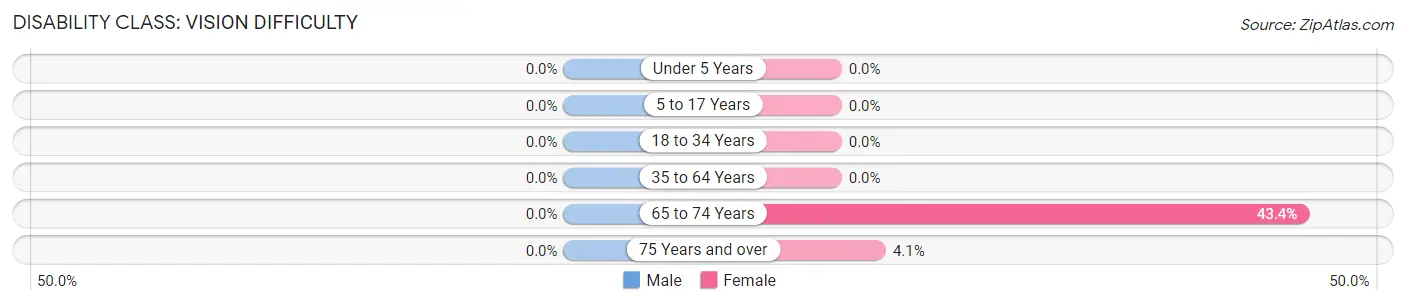
| Age Bracket | Male | Female |
| Under 5 Years | 0 (0.0%) | 0 (0.0%) |
| 5 to 17 Years | 0 (0.0%) | 0 (0.0%) |
| 18 to 34 Years | 0 (0.0%) | 0 (0.0%) |
| 35 to 64 Years | 0 (0.0%) | 0 (0.0%) |
| 65 to 74 Years | 0 (0.0%) | 49 (43.4%) |
| 75 Years and over | 0 (0.0%) | 5 (4.1%) |
Disability Class: Cognitive Difficulty
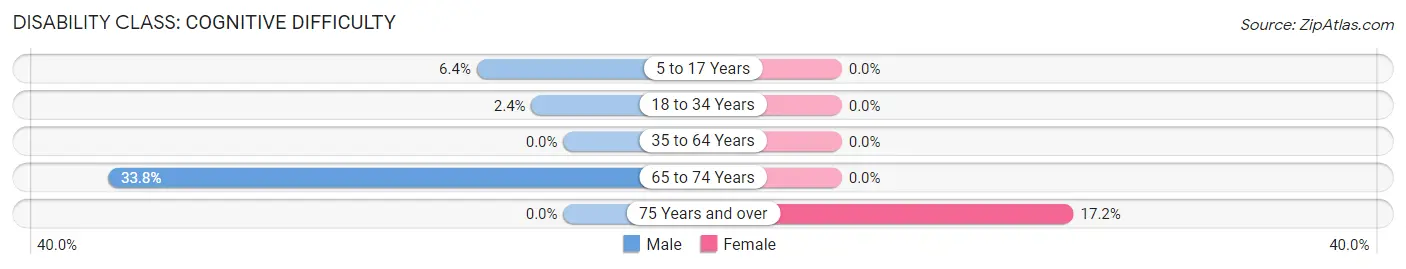
| Age Bracket | Male | Female |
| 5 to 17 Years | 11 (6.4%) | 0 (0.0%) |
| 18 to 34 Years | 5 (2.4%) | 0 (0.0%) |
| 35 to 64 Years | 0 (0.0%) | 0 (0.0%) |
| 65 to 74 Years | 24 (33.8%) | 0 (0.0%) |
| 75 Years and over | 0 (0.0%) | 21 (17.2%) |
Disability Class: Ambulatory Difficulty
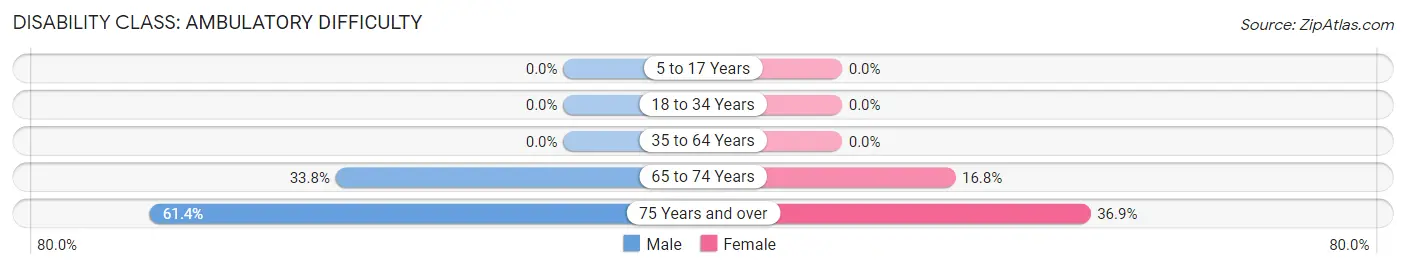
| Age Bracket | Male | Female |
| 5 to 17 Years | 0 (0.0%) | 0 (0.0%) |
| 18 to 34 Years | 0 (0.0%) | 0 (0.0%) |
| 35 to 64 Years | 0 (0.0%) | 0 (0.0%) |
| 65 to 74 Years | 24 (33.8%) | 19 (16.8%) |
| 75 Years and over | 62 (61.4%) | 45 (36.9%) |
Disability Class: Self-Care Difficulty
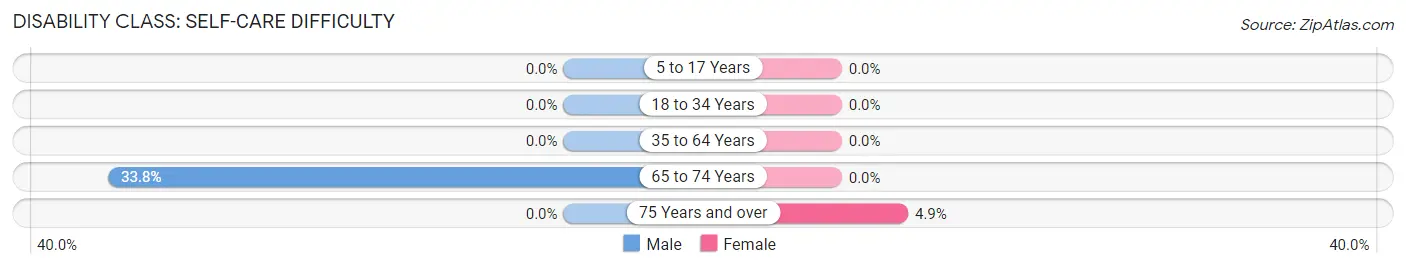
| Age Bracket | Male | Female |
| 5 to 17 Years | 0 (0.0%) | 0 (0.0%) |
| 18 to 34 Years | 0 (0.0%) | 0 (0.0%) |
| 35 to 64 Years | 0 (0.0%) | 0 (0.0%) |
| 65 to 74 Years | 24 (33.8%) | 0 (0.0%) |
| 75 Years and over | 0 (0.0%) | 6 (4.9%) |
Technology Access in Waterbury
Computing Device Access in Waterbury
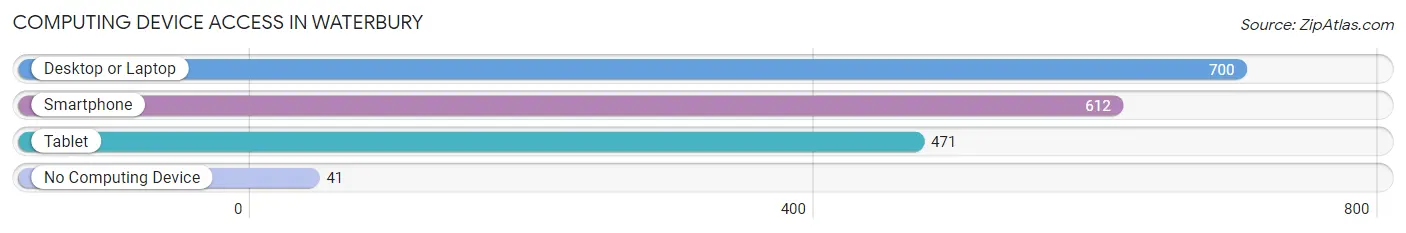
| Device Type | # Households | % Households |
| Desktop or Laptop | 700 | 85.5% |
| Smartphone | 612 | 74.7% |
| Tablet | 471 | 57.5% |
| No Computing Device | 41 | 5.0% |
| Total | 819 | 100.0% |
Internet Access in Waterbury
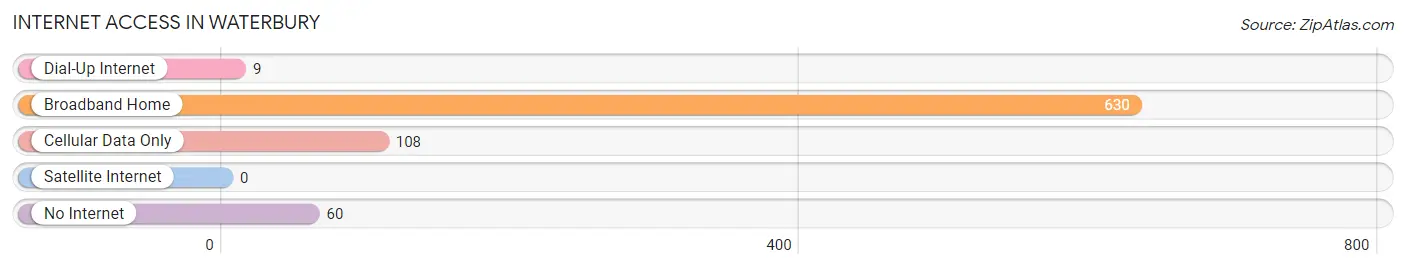
| Internet Type | # Households | % Households |
| Dial-Up Internet | 9 | 1.1% |
| Broadband Home | 630 | 76.9% |
| Cellular Data Only | 108 | 13.2% |
| Satellite Internet | 0 | 0.0% |
| No Internet | 60 | 7.3% |
| Total | 819 | 100.0% |
Waterbury Summary
Waterbury, Vermont is a small town located in the heart of the Green Mountains in Washington County. It is situated on the Winooski River, and is home to a population of 5,064 people as of the 2010 census. The town is known for its picturesque scenery, its historic downtown, and its proximity to the state capital of Montpelier.
History
Waterbury was first settled in 1763 by a group of settlers from Connecticut. The town was originally known as "The Town of the Falls," due to its location at the falls of the Winooski River. The town was officially incorporated in 1783, and was named after Waterbury, Connecticut.
In the 19th century, Waterbury was an important stop on the stagecoach route between Montpelier and Burlington. The town was also home to a number of mills, including a woolen mill, a paper mill, and a grist mill.
In the late 19th century, Waterbury became a popular tourist destination, due to its proximity to the Green Mountains and its picturesque scenery. The town was also home to a number of resorts, including the Waterbury Inn, which was built in 1891.
Geography
Waterbury is located in the heart of the Green Mountains in Washington County. The town is situated on the Winooski River, and is bordered by the towns of Stowe, Duxbury, Moretown, and Worcester. The town is located approximately 15 miles from the state capital of Montpelier.
The town has a total area of 24.2 square miles, of which 24.1 square miles is land and 0.1 square miles is water. The highest point in Waterbury is Mount Hunger, which has an elevation of 2,890 feet.
Economy
Waterbury is home to a number of businesses, including a number of restaurants, retail stores, and professional services. The town is also home to a number of manufacturing companies, including a paper mill, a printing company, and a furniture manufacturer.
The town is also home to a number of tourist attractions, including the Ben & Jerry's Ice Cream Factory, the Cold Hollow Cider Mill, and the Waterbury Center State Park.
Demographics
As of the 2010 census, Waterbury had a population of 5,064 people. The racial makeup of the town was 95.3% White, 0.7% African American, 0.3% Native American, 0.7% Asian, 0.1% Pacific Islander, 0.7% from other races, and 2.1% from two or more races. Hispanic or Latino of any race were 2.2% of the population.
The median household income in Waterbury was $50,977, and the median family income was $60,977. The per capita income for the town was $25,977. About 8.3% of families and 11.2% of the population were below the poverty line, including 15.2% of those under age 18 and 6.2% of those age 65 or over.
Common Questions
What is the Total Population of Waterbury?
Total Population of Waterbury is 1,686.
What is the Total Male Population of Waterbury?
Total Male Population of Waterbury is 822.
What is the Total Female Population of Waterbury?
Total Female Population of Waterbury is 864.
What is the Ratio of Males per 100 Females in Waterbury?
There are 95.14 Males per 100 Females in Waterbury.
What is the Ratio of Females per 100 Males in Waterbury?
There are 105.11 Females per 100 Males in Waterbury.
What is the Median Population Age in Waterbury?
Median Population Age in Waterbury is 40.9 Years.
What is the Average Family Size in Waterbury
Average Family Size in Waterbury is 3.2 People.
What is the Average Household Size in Waterbury
Average Household Size in Waterbury is 1.9 People.
What is Per Capita Income in Waterbury?
Per Capita income in Waterbury is $37,116.
What is the Median Family Income in Waterbury?
Median Family Income in Waterbury is $92,188.
What is the Median Household income in Waterbury?
Median Household Income in Waterbury is $55,655.
What is Income or Wage Gap in Waterbury?
Income or Wage Gap in Waterbury is 7.1%.
Women in Waterbury earn 92.9 cents for every dollar earned by a man.
What is Inequality or Gini Index in Waterbury?
Inequality or Gini Index in Waterbury is 0.44.
How Large is the Labor Force in Waterbury?
There are 883 People in the Labor Forcein in Waterbury.
What is the Percentage of People in the Labor Force in Waterbury?
64.2% of People are in the Labor Force in Waterbury.
What is the Unemployment Rate in Waterbury?
Unemployment Rate in Waterbury is 2.5%.