Springfield, VT
Springfield Map
Springfield Overview
3,946
TOTAL POPULATION
1,755
MALE POPULATION
2,191
FEMALE POPULATION
80.10
MALES / 100 FEMALES
124.84
FEMALES / 100 MALES
49.7
MEDIAN AGE
3.3
AVG FAMILY SIZE
2.1
AVG HOUSEHOLD SIZE
$27,572
PER CAPITA INCOME
$70,341
AVG FAMILY INCOME
$48,476
AVG HOUSEHOLD INCOME
32.5%
WAGE / INCOME GAP [ % ]
67.5¢/ $1
WAGE / INCOME GAP [ $ ]
0.46
INEQUALITY / GINI INDEX
1,625
LABOR FORCE [ PEOPLE ]
48.6%
PERCENT IN LABOR FORCE
4.2%
UNEMPLOYMENT RATE
Springfield Zip Codes
Springfield Area Codes
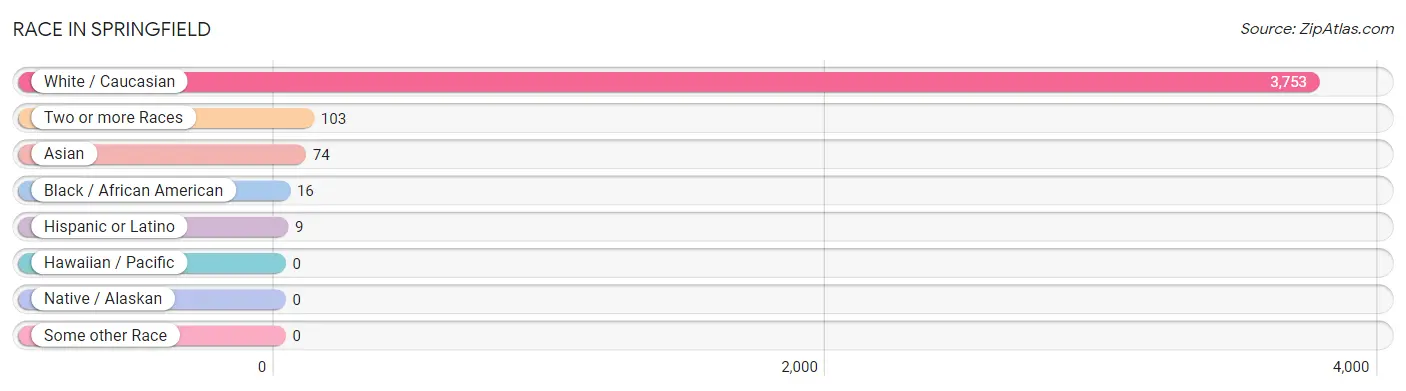
Race in Springfield
The most populous races in Springfield are White / Caucasian (3,753 | 95.1%), Two or more Races (103 | 2.6%), and Asian (74 | 1.9%).
| Race | # Population | % Population |
| Asian | 74 | 1.9% |
| Black / African American | 16 | 0.4% |
| Hawaiian / Pacific | 0 | 0.0% |
| Hispanic or Latino | 9 | 0.2% |
| Native / Alaskan | 0 | 0.0% |
| White / Caucasian | 3,753 | 95.1% |
| Two or more Races | 103 | 2.6% |
| Some other Race | 0 | 0.0% |
| Total | 3,946 | 100.0% |
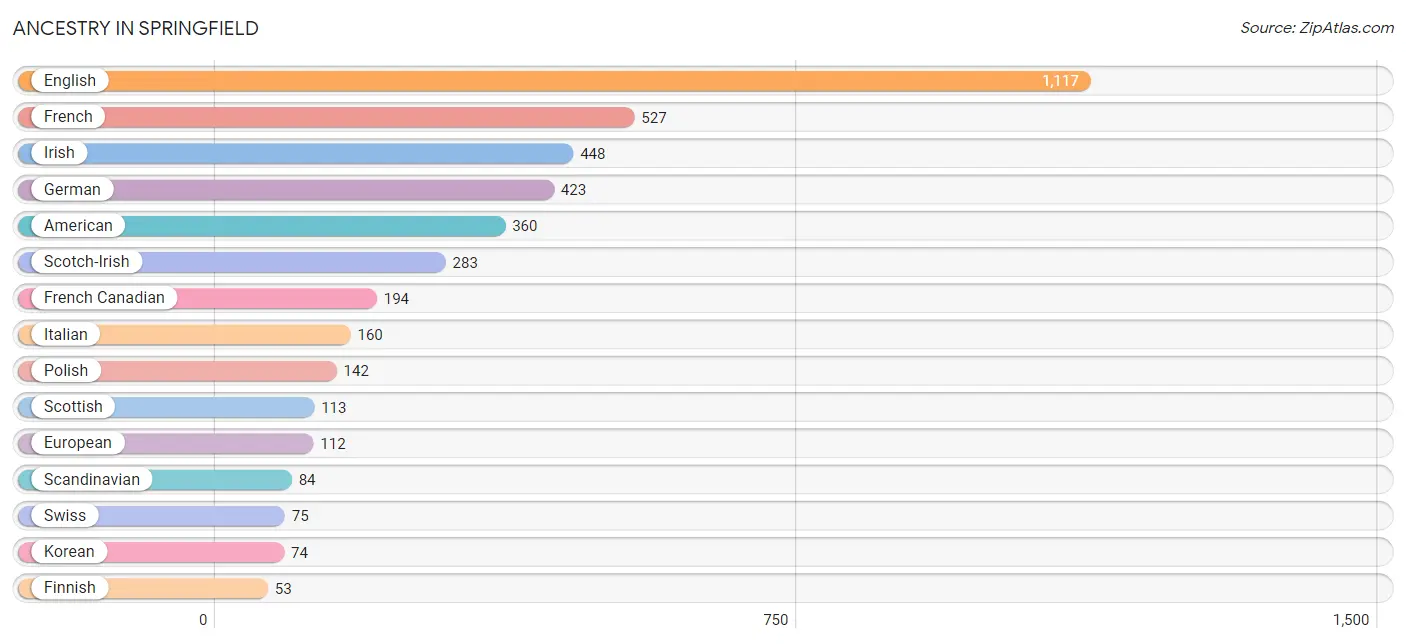
Ancestry in Springfield
The most populous ancestries reported in Springfield are English (1,117 | 28.3%), French (527 | 13.4%), Irish (448 | 11.4%), German (423 | 10.7%), and American (360 | 9.1%), together accounting for 72.9% of all Springfield residents.
| Ancestry | # Population | % Population |
| American | 360 | 9.1% |
| Arab | 8 | 0.2% |
| Austrian | 9 | 0.2% |
| British | 28 | 0.7% |
| Canadian | 44 | 1.1% |
| Celtic | 23 | 0.6% |
| Cherokee | 1 | 0.0% |
| Creek | 7 | 0.2% |
| Danish | 31 | 0.8% |
| Dutch | 33 | 0.8% |
| Eastern European | 20 | 0.5% |
| English | 1,117 | 28.3% |
| European | 112 | 2.8% |
| Finnish | 53 | 1.3% |
| French | 527 | 13.4% |
| French Canadian | 194 | 4.9% |
| German | 423 | 10.7% |
| Hungarian | 10 | 0.3% |
| Irish | 448 | 11.4% |
| Italian | 160 | 4.1% |
| Korean | 74 | 1.9% |
| Lithuanian | 7 | 0.2% |
| Polish | 142 | 3.6% |
| Russian | 9 | 0.2% |
| Scandinavian | 84 | 2.1% |
| Scotch-Irish | 283 | 7.2% |
| Scottish | 113 | 2.9% |
| Spanish | 9 | 0.2% |
| Swedish | 28 | 0.7% |
| Swiss | 75 | 1.9% |
| Syrian | 8 | 0.2% |
| Ukrainian | 7 | 0.2% |
| Welsh | 18 | 0.5% | View All 33 Rows |
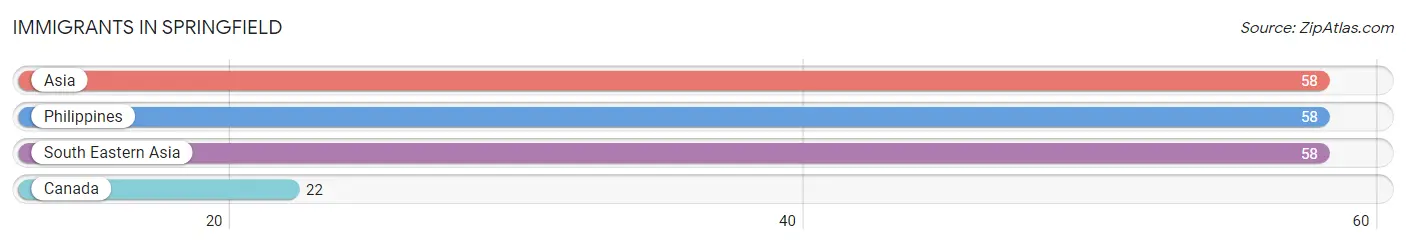
Immigrants in Springfield
The most numerous immigrant groups reported in Springfield came from Asia (58 | 1.5%), Philippines (58 | 1.5%), South Eastern Asia (58 | 1.5%), and Canada (22 | 0.6%), together accounting for 5.0% of all Springfield residents.
| Immigration Origin | # Population | % Population |
| Asia | 58 | 1.5% |
| Canada | 22 | 0.6% |
| Philippines | 58 | 1.5% |
| South Eastern Asia | 58 | 1.5% | View All 4 Rows |
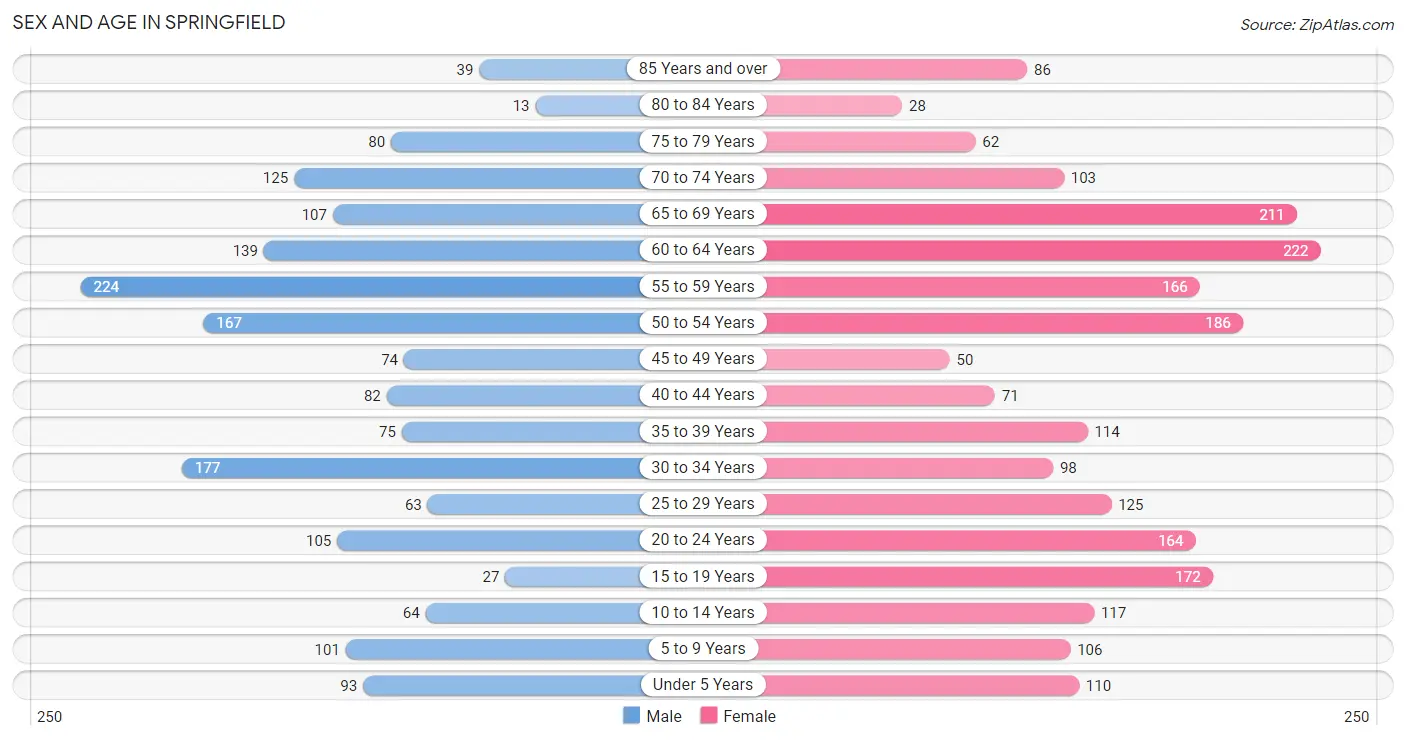
Sex and Age in Springfield
Sex and Age in Springfield
The most populous age groups in Springfield are 55 to 59 Years (224 | 12.8%) for men and 60 to 64 Years (222 | 10.1%) for women.
| Age Bracket | Male | Female |
| Under 5 Years | 93 (5.3%) | 110 (5.0%) |
| 5 to 9 Years | 101 (5.8%) | 106 (4.8%) |
| 10 to 14 Years | 64 (3.6%) | 117 (5.3%) |
| 15 to 19 Years | 27 (1.5%) | 172 (7.9%) |
| 20 to 24 Years | 105 (6.0%) | 164 (7.5%) |
| 25 to 29 Years | 63 (3.6%) | 125 (5.7%) |
| 30 to 34 Years | 177 (10.1%) | 98 (4.5%) |
| 35 to 39 Years | 75 (4.3%) | 114 (5.2%) |
| 40 to 44 Years | 82 (4.7%) | 71 (3.2%) |
| 45 to 49 Years | 74 (4.2%) | 50 (2.3%) |
| 50 to 54 Years | 167 (9.5%) | 186 (8.5%) |
| 55 to 59 Years | 224 (12.8%) | 166 (7.6%) |
| 60 to 64 Years | 139 (7.9%) | 222 (10.1%) |
| 65 to 69 Years | 107 (6.1%) | 211 (9.6%) |
| 70 to 74 Years | 125 (7.1%) | 103 (4.7%) |
| 75 to 79 Years | 80 (4.6%) | 62 (2.8%) |
| 80 to 84 Years | 13 (0.7%) | 28 (1.3%) |
| 85 Years and over | 39 (2.2%) | 86 (3.9%) |
| Total | 1,755 (100.0%) | 2,191 (100.0%) |
Families and Households in Springfield
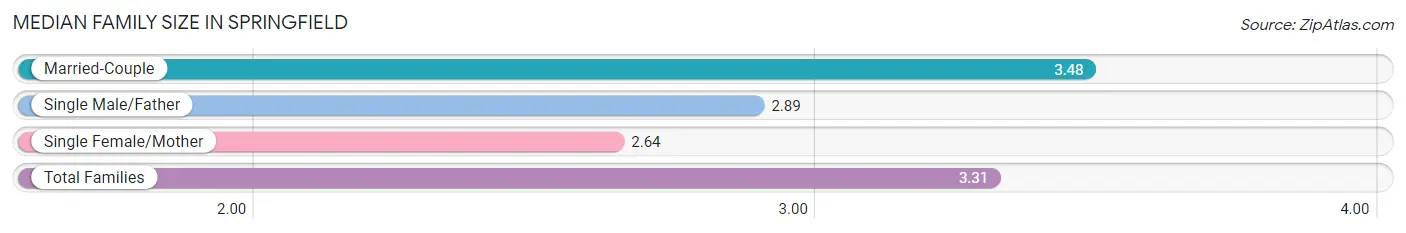
Median Family Size in Springfield
The median family size in Springfield is 3.31 persons per family, with married-couple families (597 | 78.5%) accounting for the largest median family size of 3.48 persons per family. On the other hand, single female/mother families (119 | 15.7%) represent the smallest median family size with 2.64 persons per family.
| Family Type | # Families | Family Size |
| Married-Couple | 597 (78.5%) | 3.48 |
| Single Male/Father | 44 (5.8%) | 2.89 |
| Single Female/Mother | 119 (15.7%) | 2.64 |
| Total Families | 760 (100.0%) | 3.31 |
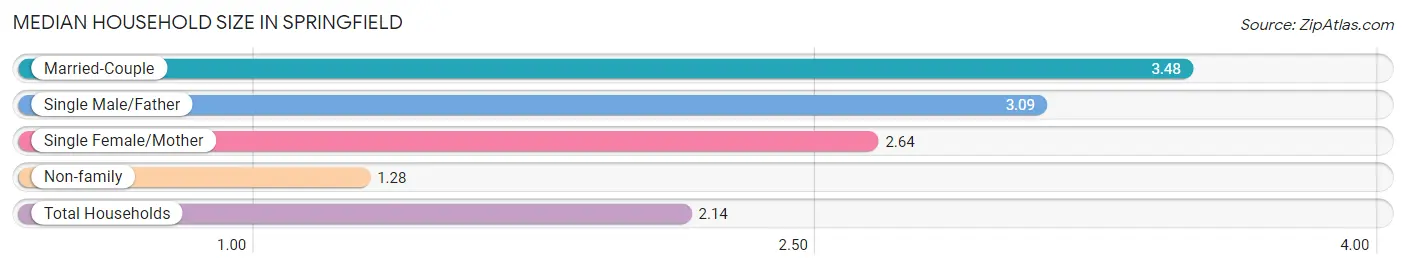
Median Household Size in Springfield
The median household size in Springfield is 2.14 persons per household, with married-couple households (597 | 32.9%) accounting for the largest median household size of 3.48 persons per household. non-family households (1,056 | 58.2%) represent the smallest median household size with 1.28 persons per household.
| Household Type | # Households | Household Size |
| Married-Couple | 597 (32.9%) | 3.48 |
| Single Male/Father | 44 (2.4%) | 3.09 |
| Single Female/Mother | 119 (6.6%) | 2.64 |
| Non-family | 1,056 (58.2%) | 1.28 |
| Total Households | 1,816 (100.0%) | 2.14 |
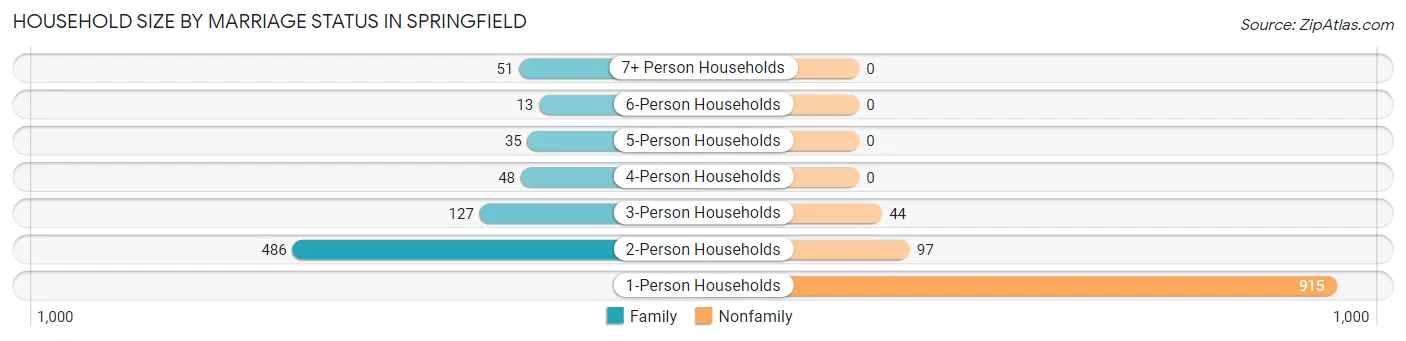
Household Size by Marriage Status in Springfield
Out of a total of 1,816 households in Springfield, 760 (41.8%) are family households, while 1,056 (58.2%) are nonfamily households. The most numerous type of family households are 2-person households, comprising 486, and the most common type of nonfamily households are 1-person households, comprising 915.
| Household Size | Family Households | Nonfamily Households |
| 1-Person Households | - | 915 (50.4%) |
| 2-Person Households | 486 (26.8%) | 97 (5.3%) |
| 3-Person Households | 127 (7.0%) | 44 (2.4%) |
| 4-Person Households | 48 (2.6%) | 0 (0.0%) |
| 5-Person Households | 35 (1.9%) | 0 (0.0%) |
| 6-Person Households | 13 (0.7%) | 0 (0.0%) |
| 7+ Person Households | 51 (2.8%) | 0 (0.0%) |
| Total | 760 (41.8%) | 1,056 (58.2%) |
Female Fertility in Springfield
Fertility by Age in Springfield
Average fertility rate in Springfield is 20.0 births per 1,000 women. Women in the age bracket of 20 to 34 years have the highest fertility rate with 41.0 births per 1,000 women. Women in the age bracket of 20 to 34 years acount for 100.0% of all women with births.
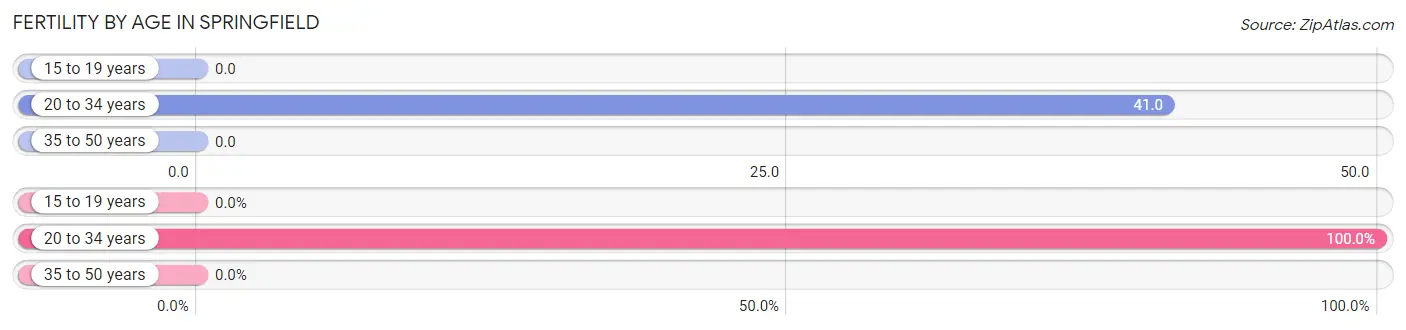
| Age Bracket | Women with Births | Births / 1,000 Women |
| 15 to 19 years | 0 (0.0%) | 0.0 |
| 20 to 34 years | 16 (100.0%) | 41.0 |
| 35 to 50 years | 0 (0.0%) | 0.0 |
| Total | 16 (100.0%) | 20.0 |
Fertility by Age by Marriage Status in Springfield
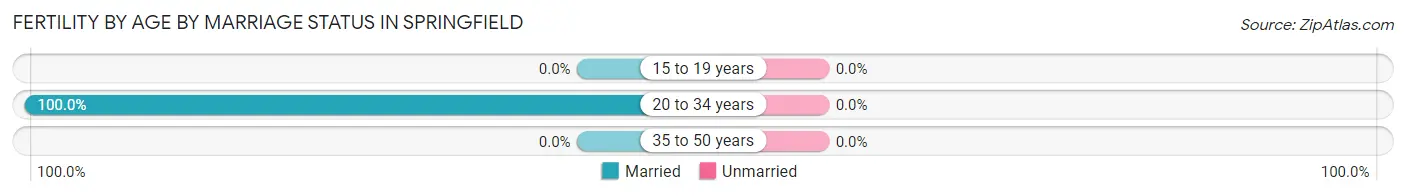
| Age Bracket | Married | Unmarried |
| 15 to 19 years | 0 (0.0%) | 0 (0.0%) |
| 20 to 34 years | 16 (100.0%) | 0 (0.0%) |
| 35 to 50 years | 0 (0.0%) | 0 (0.0%) |
| Total | 16 (100.0%) | 0 (0.0%) |
Fertility by Education in Springfield
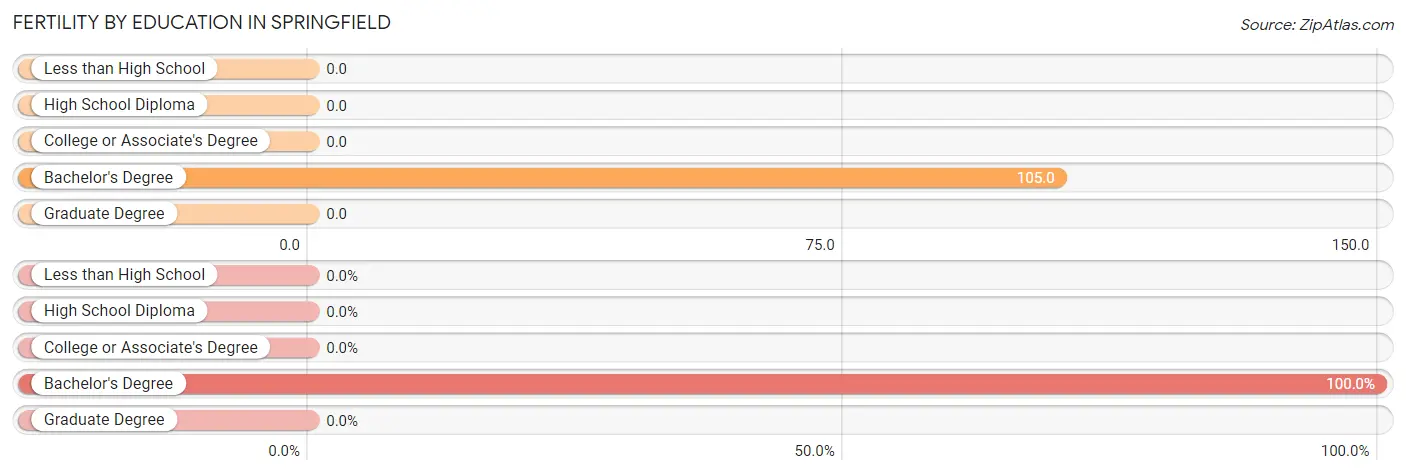
| Educational Attainment | Women with Births | Births / 1,000 Women |
| Less than High School | 0 (0.0%) | 0.0 |
| High School Diploma | 0 (0.0%) | 0.0 |
| College or Associate's Degree | 0 (0.0%) | 0.0 |
| Bachelor's Degree | 16 (100.0%) | 105.0 |
| Graduate Degree | 0 (0.0%) | 0.0 |
| Total | 16 (100.0%) | 20.0 |
Fertility by Education by Marriage Status in Springfield
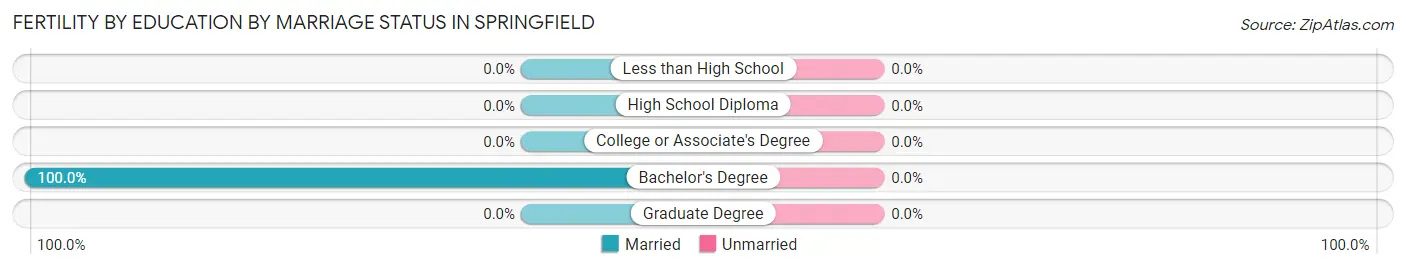
| Educational Attainment | Married | Unmarried |
| Less than High School | 0 (0.0%) | 0 (0.0%) |
| High School Diploma | 0 (0.0%) | 0 (0.0%) |
| College or Associate's Degree | 0 (0.0%) | 0 (0.0%) |
| Bachelor's Degree | 16 (100.0%) | 0 (0.0%) |
| Graduate Degree | 0 (0.0%) | 0 (0.0%) |
| Total | 16 (100.0%) | 0 (0.0%) |
Income in Springfield
Income Overview in Springfield
Per Capita Income in Springfield is $27,572, while median incomes of families and households are $70,341 and $48,476 respectively.
| Characteristic | Number | Measure |
| Per Capita Income | 3,946 | $27,572 |
| Median Family Income | 760 | $70,341 |
| Mean Family Income | 760 | $84,043 |
| Median Household Income | 1,816 | $48,476 |
| Mean Household Income | 1,816 | $57,094 |
| Income Deficit | 760 | $0 |
| Wage / Income Gap (%) | 3,946 | 32.55% |
| Wage / Income Gap ($) | 3,946 | 67.45¢ per $1 |
| Gini / Inequality Index | 3,946 | 0.46 |
Earnings by Sex in Springfield
Average Earnings in Springfield are $39,167, $41,979 for men and $28,315 for women, a difference of 32.6%.
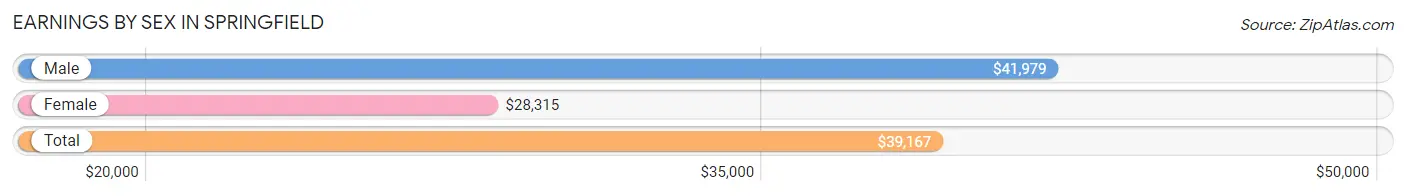
| Sex | Number | Average Earnings |
| Male | 919 (52.6%) | $41,979 |
| Female | 827 (47.4%) | $28,315 |
| Total | 1,746 (100.0%) | $39,167 |
Earnings by Sex by Income Bracket in Springfield
The most common earnings brackets in Springfield are $30,000 to $34,999 for men (133 | 14.5%) and $50,000 to $54,999 for women (93 | 11.3%).
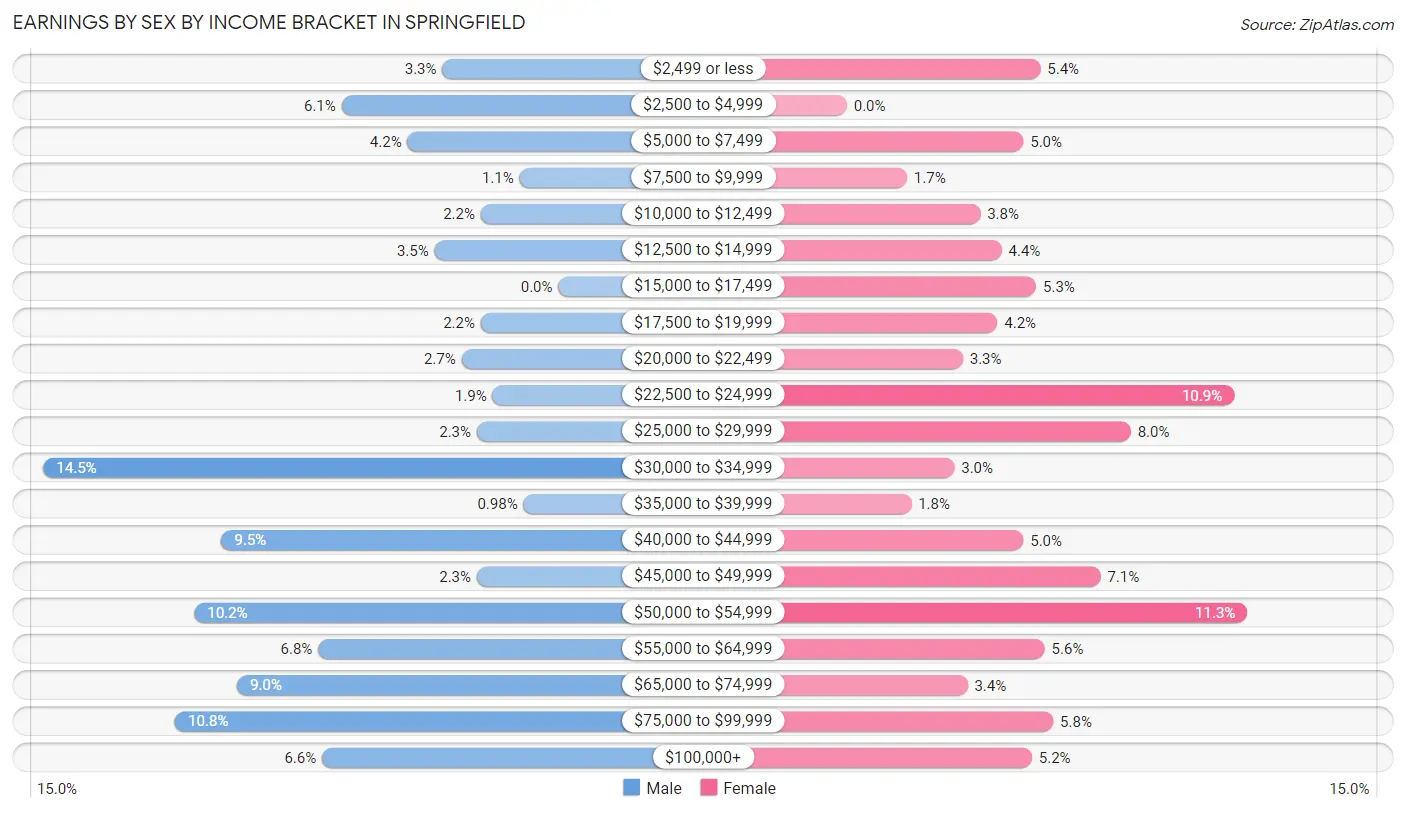
| Income | Male | Female |
| $2,499 or less | 30 (3.3%) | 45 (5.4%) |
| $2,500 to $4,999 | 56 (6.1%) | 0 (0.0%) |
| $5,000 to $7,499 | 39 (4.2%) | 41 (5.0%) |
| $7,500 to $9,999 | 10 (1.1%) | 14 (1.7%) |
| $10,000 to $12,499 | 20 (2.2%) | 31 (3.7%) |
| $12,500 to $14,999 | 32 (3.5%) | 36 (4.3%) |
| $15,000 to $17,499 | 0 (0.0%) | 44 (5.3%) |
| $17,500 to $19,999 | 20 (2.2%) | 35 (4.2%) |
| $20,000 to $22,499 | 25 (2.7%) | 27 (3.3%) |
| $22,500 to $24,999 | 17 (1.8%) | 90 (10.9%) |
| $25,000 to $29,999 | 21 (2.3%) | 66 (8.0%) |
| $30,000 to $34,999 | 133 (14.5%) | 25 (3.0%) |
| $35,000 to $39,999 | 9 (1.0%) | 15 (1.8%) |
| $40,000 to $44,999 | 87 (9.5%) | 41 (5.0%) |
| $45,000 to $49,999 | 21 (2.3%) | 59 (7.1%) |
| $50,000 to $54,999 | 94 (10.2%) | 93 (11.3%) |
| $55,000 to $64,999 | 62 (6.8%) | 46 (5.6%) |
| $65,000 to $74,999 | 83 (9.0%) | 28 (3.4%) |
| $75,000 to $99,999 | 99 (10.8%) | 48 (5.8%) |
| $100,000+ | 61 (6.6%) | 43 (5.2%) |
| Total | 919 (100.0%) | 827 (100.0%) |
Earnings by Sex by Educational Attainment in Springfield
Average earnings in Springfield are $49,844 for men and $44,412 for women, a difference of 10.9%. Men with an educational attainment of college or associate's degree enjoy the highest average annual earnings of $57,647, while those with high school diploma education earn the least with $34,977. Women with an educational attainment of graduate degree earn the most with the average annual earnings of $51,375, while those with less than high school education have the smallest earnings of $14,808.
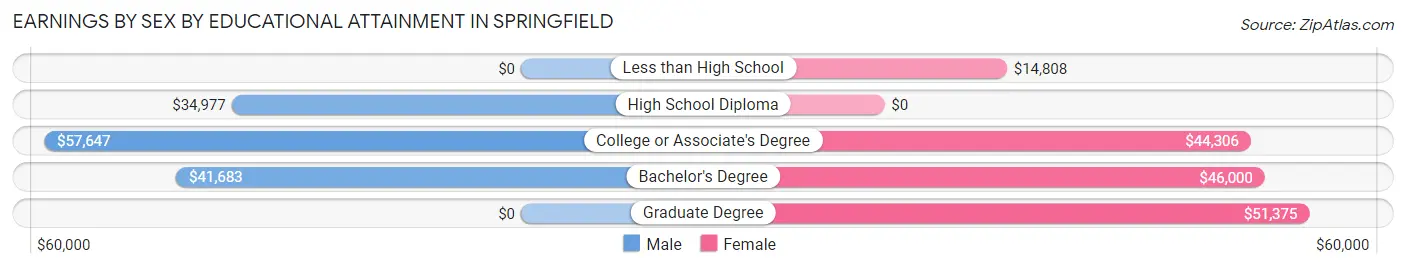
| Educational Attainment | Male Income | Female Income |
| Less than High School | - | - |
| High School Diploma | $34,977 | $0 |
| College or Associate's Degree | $57,647 | $44,306 |
| Bachelor's Degree | $41,683 | $46,000 |
| Graduate Degree | - | - |
| Total | $49,844 | $44,412 |
Family Income in Springfield
Family Income Brackets in Springfield
According to the Springfield family income data, there are 261 families falling into the $50,000 to $74,999 income range, which is the most common income bracket and makes up 34.3% of all families.
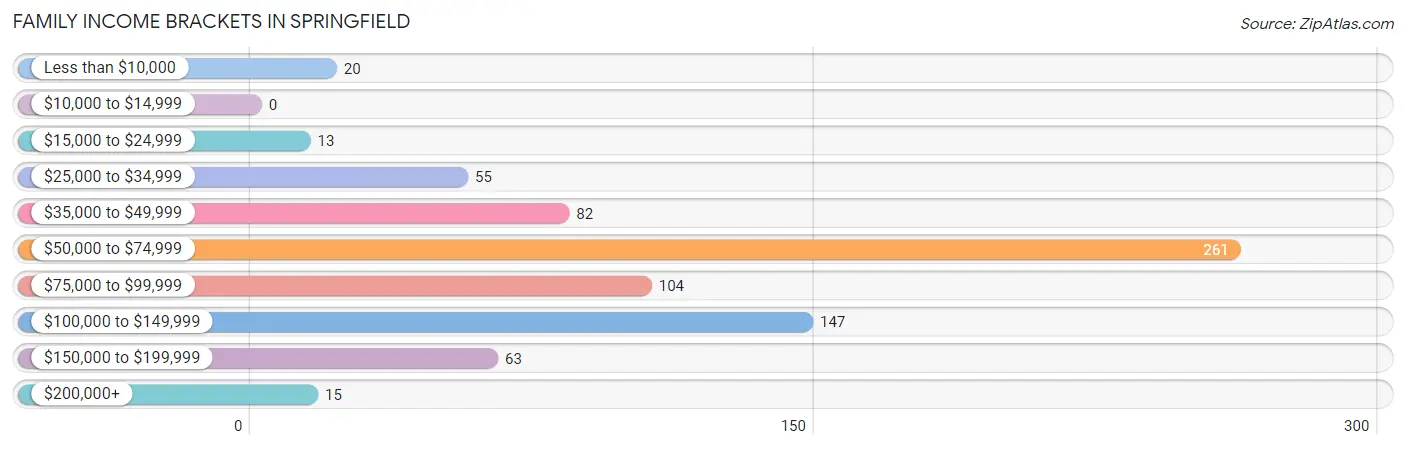
| Income Bracket | # Families | % Families |
| Less than $10,000 | 20 | 2.6% |
| $10,000 to $14,999 | 0 | 0.0% |
| $15,000 to $24,999 | 13 | 1.7% |
| $25,000 to $34,999 | 55 | 7.2% |
| $35,000 to $49,999 | 82 | 10.8% |
| $50,000 to $74,999 | 261 | 34.3% |
| $75,000 to $99,999 | 104 | 13.7% |
| $100,000 to $149,999 | 147 | 19.3% |
| $150,000 to $199,999 | 63 | 8.3% |
| $200,000+ | 15 | 2.0% |
Family Income by Famaliy Size in Springfield
4-person families (48 | 6.3%) account for the highest median family income in Springfield with $142,500 per family, while 4-person families (48 | 6.3%) have the highest median income of $35,625 per family member.
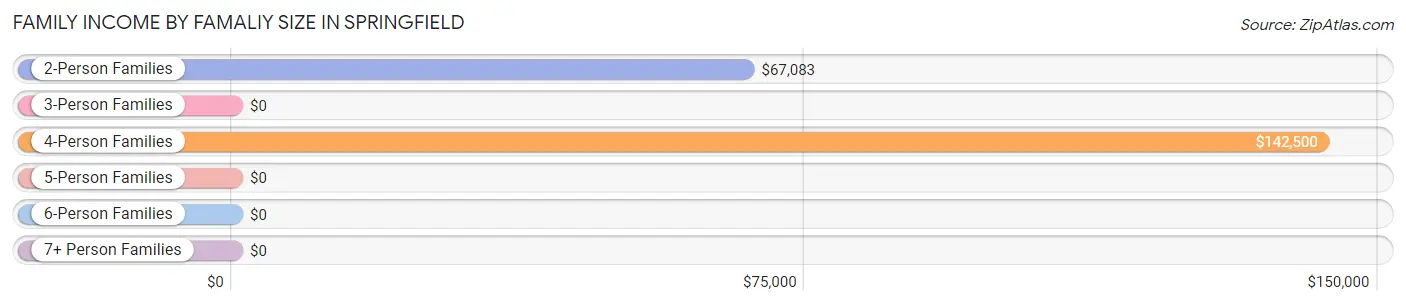
| Income Bracket | # Families | Median Income |
| 2-Person Families | 496 (65.3%) | $67,083 |
| 3-Person Families | 117 (15.4%) | $0 |
| 4-Person Families | 48 (6.3%) | $142,500 |
| 5-Person Families | 35 (4.6%) | $0 |
| 6-Person Families | 13 (1.7%) | $0 |
| 7+ Person Families | 51 (6.7%) | $0 |
| Total | 760 (100.0%) | $70,341 |
Family Income by Number of Earners in Springfield
The median family income in Springfield is $70,341, with families comprising 3+ earners (36) having the highest median family income of $171,250, while families with no earners (133) have the lowest median family income of $49,732, accounting for 4.7% and 17.5% of families, respectively.
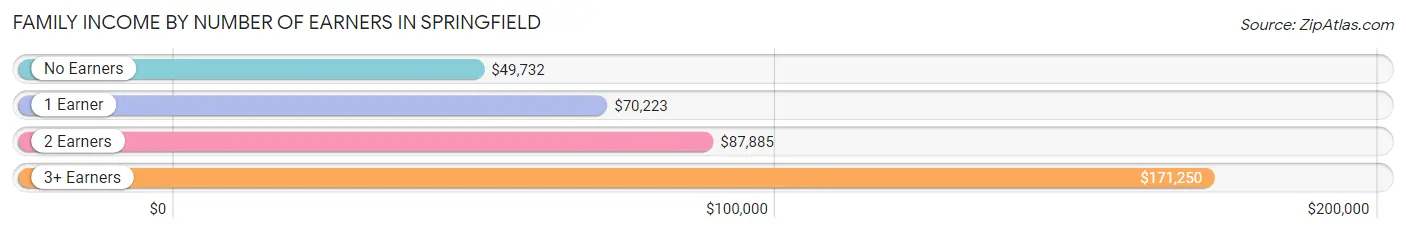
| Number of Earners | # Families | Median Income |
| No Earners | 133 (17.5%) | $49,732 |
| 1 Earner | 261 (34.3%) | $70,223 |
| 2 Earners | 330 (43.4%) | $87,885 |
| 3+ Earners | 36 (4.7%) | $171,250 |
| Total | 760 (100.0%) | $70,341 |
Household Income in Springfield
Household Income Brackets in Springfield
With 398 households falling in the category, the $50,000 to $74,999 income range is the most frequent in Springfield, accounting for 21.9% of all households. In contrast, only 33 households (1.8%) fall into the $200,000+ income bracket, making it the least populous group.
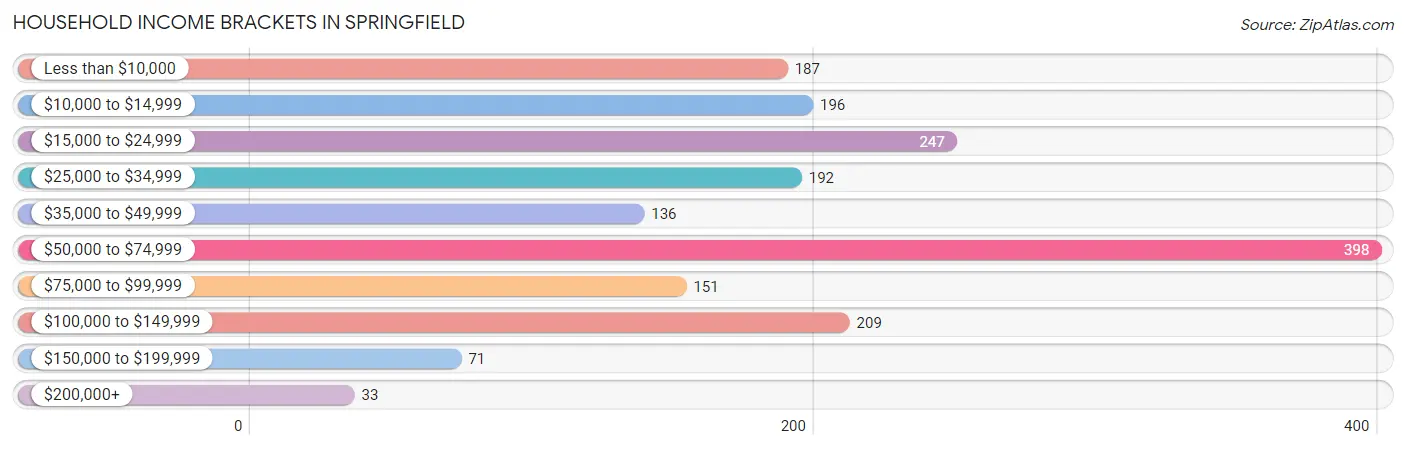
| Income Bracket | # Households | % Households |
| Less than $10,000 | 187 | 10.3% |
| $10,000 to $14,999 | 196 | 10.8% |
| $15,000 to $24,999 | 247 | 13.6% |
| $25,000 to $34,999 | 192 | 10.6% |
| $35,000 to $49,999 | 136 | 7.5% |
| $50,000 to $74,999 | 398 | 21.9% |
| $75,000 to $99,999 | 151 | 8.3% |
| $100,000 to $149,999 | 209 | 11.5% |
| $150,000 to $199,999 | 71 | 3.9% |
| $200,000+ | 33 | 1.8% |
Household Income by Householder Age in Springfield
The median household income in Springfield is $48,476, with the highest median household income of $64,243 found in the 25 to 44 years age bracket for the primary householder. A total of 413 households (22.7%) fall into this category. Meanwhile, the 15 to 24 years age bracket for the primary householder has the lowest median household income of $0, with 74 households (4.1%) in this group.
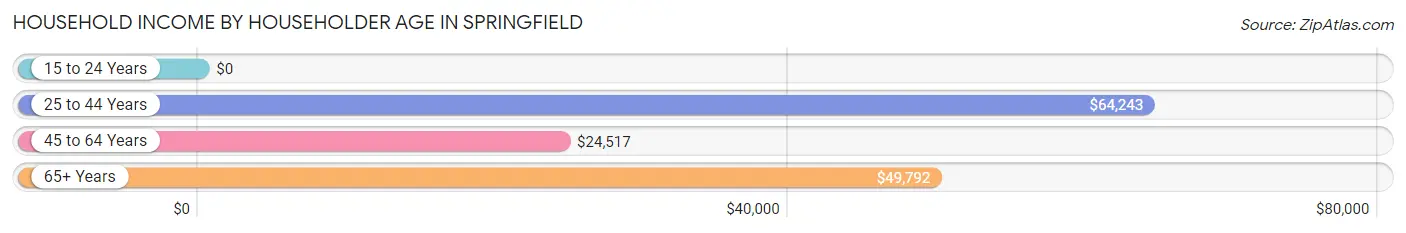
| Income Bracket | # Households | Median Income |
| 15 to 24 Years | 74 (4.1%) | $0 |
| 25 to 44 Years | 413 (22.7%) | $64,243 |
| 45 to 64 Years | 756 (41.6%) | $24,517 |
| 65+ Years | 573 (31.6%) | $49,792 |
| Total | 1,816 (100.0%) | $48,476 |
Poverty in Springfield
Income Below Poverty by Sex and Age in Springfield
With 18.2% poverty level for males and 16.8% for females among the residents of Springfield, 18 to 24 year old males and 5 year old females are the most vulnerable to poverty, with 62 males (51.7%) and 17 females (47.2%) in their respective age groups living below the poverty level.
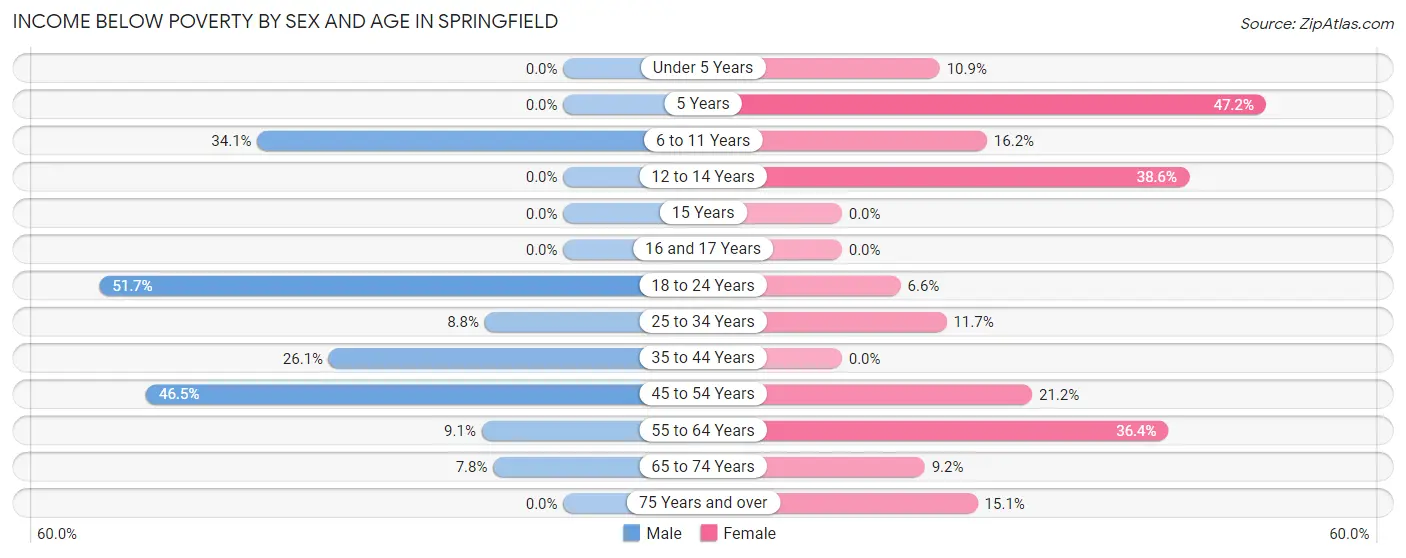
| Age Bracket | Male | Female |
| Under 5 Years | 0 (0.0%) | 12 (10.9%) |
| 5 Years | 0 (0.0%) | 17 (47.2%) |
| 6 to 11 Years | 31 (34.1%) | 16 (16.2%) |
| 12 to 14 Years | 0 (0.0%) | 34 (38.6%) |
| 15 Years | 0 (0.0%) | 0 (0.0%) |
| 16 and 17 Years | 0 (0.0%) | 0 (0.0%) |
| 18 to 24 Years | 62 (51.7%) | 19 (6.6%) |
| 25 to 34 Years | 21 (8.7%) | 26 (11.7%) |
| 35 to 44 Years | 41 (26.1%) | 0 (0.0%) |
| 45 to 54 Years | 112 (46.5%) | 50 (21.2%) |
| 55 to 64 Years | 33 (9.1%) | 136 (36.4%) |
| 65 to 74 Years | 17 (7.8%) | 29 (9.2%) |
| 75 Years and over | 0 (0.0%) | 23 (15.1%) |
| Total | 317 (18.2%) | 362 (16.8%) |
Income Above Poverty by Sex and Age in Springfield
According to the poverty statistics in Springfield, males aged under 5 years and females aged 15 years are the age groups that are most secure financially, with 100.0% of males and 100.0% of females in these age groups living above the poverty line.
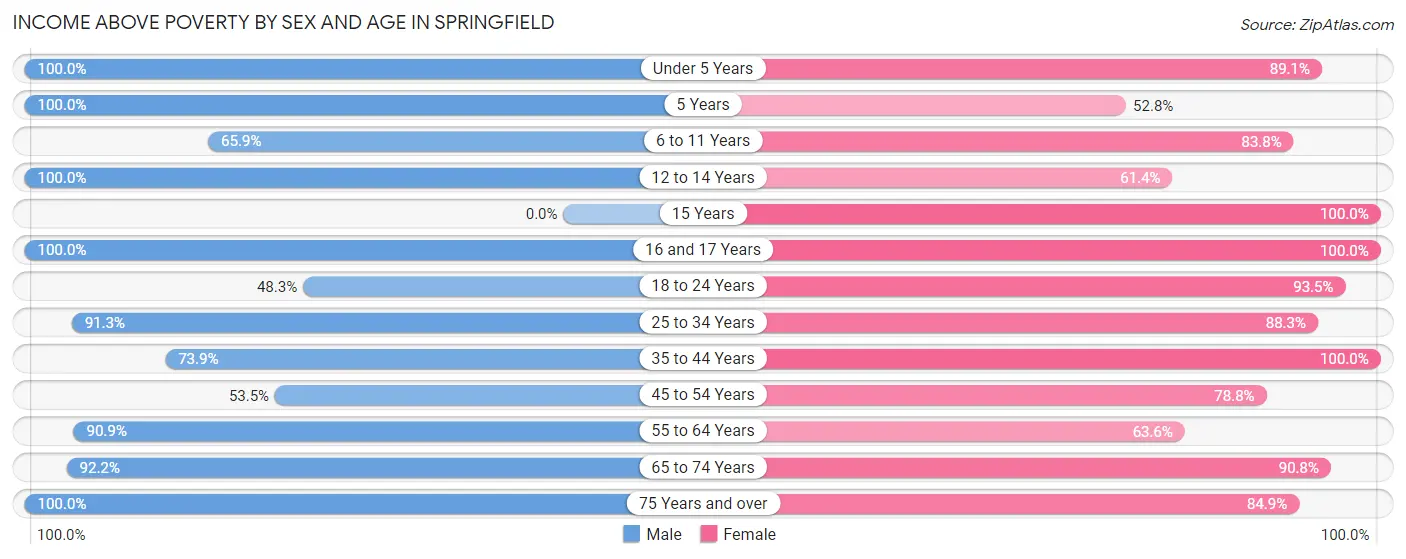
| Age Bracket | Male | Female |
| Under 5 Years | 93 (100.0%) | 98 (89.1%) |
| 5 Years | 52 (100.0%) | 19 (52.8%) |
| 6 to 11 Years | 60 (65.9%) | 83 (83.8%) |
| 12 to 14 Years | 22 (100.0%) | 54 (61.4%) |
| 15 Years | 0 (0.0%) | 11 (100.0%) |
| 16 and 17 Years | 12 (100.0%) | 35 (100.0%) |
| 18 to 24 Years | 58 (48.3%) | 271 (93.4%) |
| 25 to 34 Years | 219 (91.2%) | 197 (88.3%) |
| 35 to 44 Years | 116 (73.9%) | 185 (100.0%) |
| 45 to 54 Years | 129 (53.5%) | 186 (78.8%) |
| 55 to 64 Years | 330 (90.9%) | 238 (63.6%) |
| 65 to 74 Years | 201 (92.2%) | 285 (90.8%) |
| 75 Years and over | 132 (100.0%) | 129 (84.9%) |
| Total | 1,424 (81.8%) | 1,791 (83.2%) |
Income Below Poverty Among Married-Couple Families in Springfield
The poverty statistics for married-couple families in Springfield show that 5.2% or 31 of the total 597 families live below the poverty line. Families with 5 or more children have the highest poverty rate of 100.0%, comprising of 15 families. On the other hand, families with 1 or 2 children have the lowest poverty rate of 0.0%, which includes 0 families.
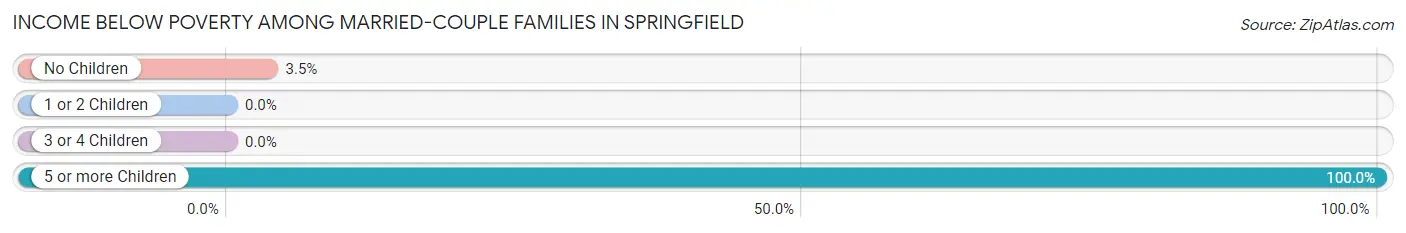
| Children | Above Poverty | Below Poverty |
| No Children | 437 (96.5%) | 16 (3.5%) |
| 1 or 2 Children | 66 (100.0%) | 0 (0.0%) |
| 3 or 4 Children | 63 (100.0%) | 0 (0.0%) |
| 5 or more Children | 0 (0.0%) | 15 (100.0%) |
| Total | 566 (94.8%) | 31 (5.2%) |
Income Below Poverty Among Single-Parent Households in Springfield
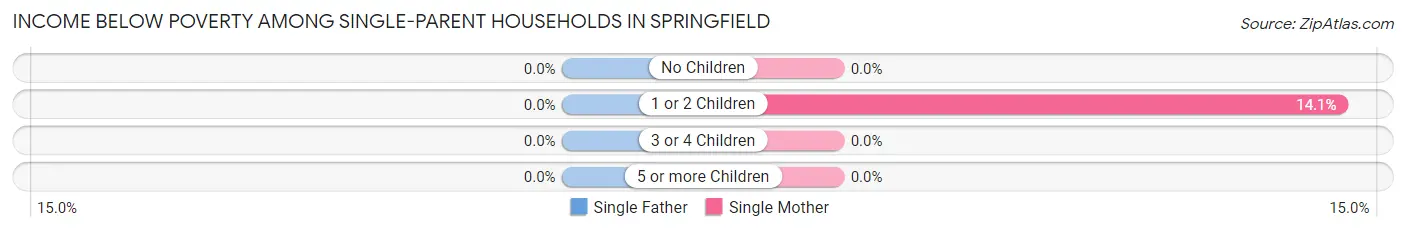
| Children | Single Father | Single Mother |
| No Children | 0 (0.0%) | 0 (0.0%) |
| 1 or 2 Children | 0 (0.0%) | 11 (14.1%) |
| 3 or 4 Children | 0 (0.0%) | 0 (0.0%) |
| 5 or more Children | 0 (0.0%) | 0 (0.0%) |
| Total | 0 (0.0%) | 11 (9.2%) |
Income Below Poverty Among Married-Couple vs Single-Parent Households in Springfield
The poverty data for Springfield shows that 31 of the married-couple family households (5.2%) and 11 of the single-parent households (6.8%) are living below the poverty level. Within the married-couple family households, those with 5 or more children have the highest poverty rate, with 15 households (100.0%) falling below the poverty line. Among the single-parent households, those with 1 or 2 children have the highest poverty rate, with 11 household (10.2%) living below poverty.
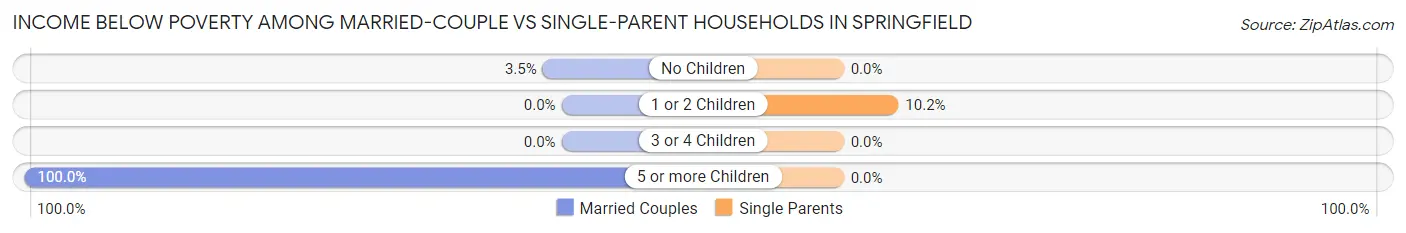
| Children | Married-Couple Families | Single-Parent Households |
| No Children | 16 (3.5%) | 0 (0.0%) |
| 1 or 2 Children | 0 (0.0%) | 11 (10.2%) |
| 3 or 4 Children | 0 (0.0%) | 0 (0.0%) |
| 5 or more Children | 15 (100.0%) | 0 (0.0%) |
| Total | 31 (5.2%) | 11 (6.8%) |
Employment Characteristics in Springfield
Employment by Class of Employer in Springfield
Among the 1,500 employed individuals in Springfield, private company employees (945 | 63.0%), not-for-profit organizations (247 | 16.5%), and self-employed (not incorporated) (155 | 10.3%) make up the most common classes of employment.
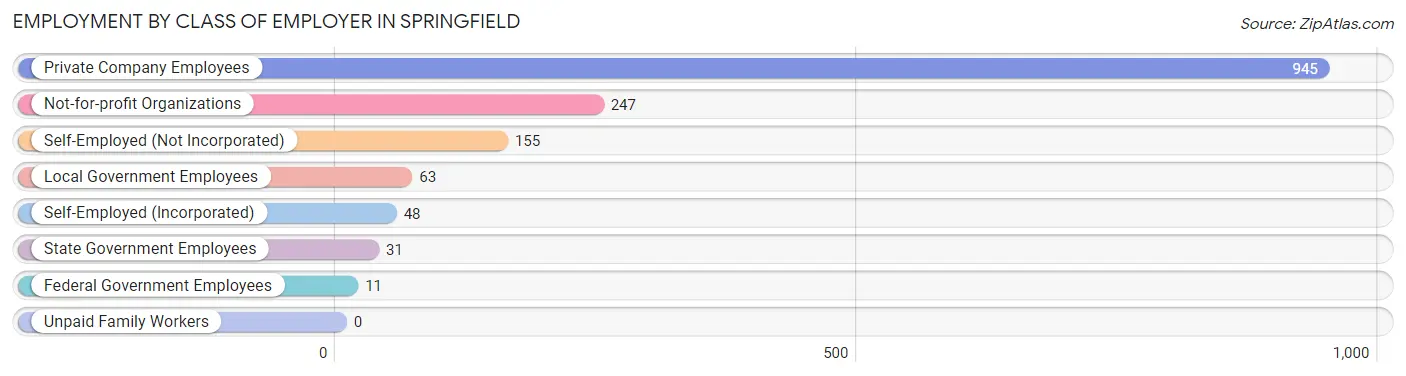
| Employer Class | # Employees | % Employees |
| Private Company Employees | 945 | 63.0% |
| Self-Employed (Incorporated) | 48 | 3.2% |
| Self-Employed (Not Incorporated) | 155 | 10.3% |
| Not-for-profit Organizations | 247 | 16.5% |
| Local Government Employees | 63 | 4.2% |
| State Government Employees | 31 | 2.1% |
| Federal Government Employees | 11 | 0.7% |
| Unpaid Family Workers | 0 | 0.0% |
| Total | 1,500 | 100.0% |
Employment Status by Age in Springfield
According to the labor force statistics for Springfield, out of the total population over 16 years of age (3,344), 48.6% or 1,625 individuals are in the labor force, with 4.2% or 68 of them unemployed. The age group with the highest labor force participation rate is 20 to 24 years, with 96.7% or 260 individuals in the labor force. Within the labor force, the 75 years and over age range has the highest percentage of unemployed individuals, with 46.7% or 14 of them being unemployed.
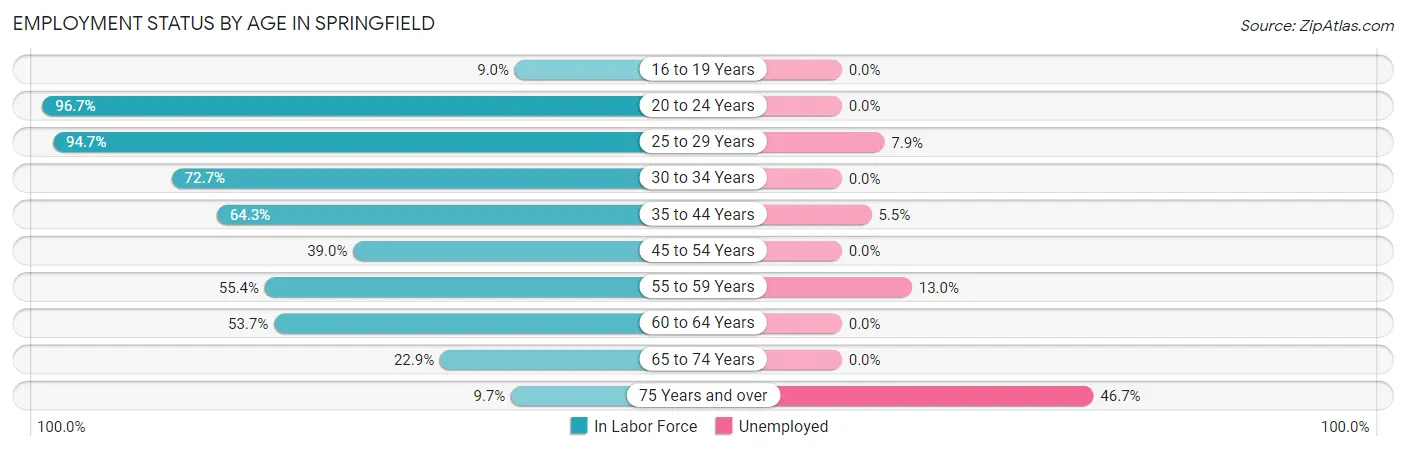
| Age Bracket | In Labor Force | Unemployed |
| 16 to 19 Years | 17 (9.0%) | 0 (0.0%) |
| 20 to 24 Years | 260 (96.7%) | 0 (0.0%) |
| 25 to 29 Years | 178 (94.7%) | 14 (7.9%) |
| 30 to 34 Years | 200 (72.7%) | 0 (0.0%) |
| 35 to 44 Years | 220 (64.3%) | 12 (5.5%) |
| 45 to 54 Years | 186 (39.0%) | 0 (0.0%) |
| 55 to 59 Years | 216 (55.4%) | 28 (13.0%) |
| 60 to 64 Years | 194 (53.7%) | 0 (0.0%) |
| 65 to 74 Years | 125 (22.9%) | 0 (0.0%) |
| 75 Years and over | 30 (9.7%) | 14 (46.7%) |
| Total | 1,625 (48.6%) | 68 (4.2%) |
Employment Status by Educational Attainment in Springfield
According to labor force statistics for Springfield, 58.7% of individuals (1,193) out of the total population between 25 and 64 years of age (2,033) are in the labor force, with 4.5% or 54 of them being unemployed. The group with the highest labor force participation rate are those with the educational attainment of bachelor's degree or higher, with 79.0% or 358 individuals in the labor force. Within the labor force, individuals with less than high school education have the highest percentage of unemployment, with 21.9% or 14 of them being unemployed.
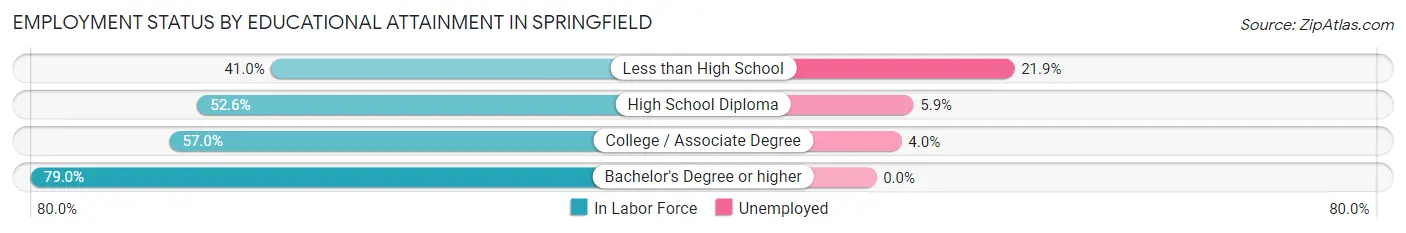
| Educational Attainment | In Labor Force | Unemployed |
| Less than High School | 64 (41.0%) | 34 (21.9%) |
| High School Diploma | 472 (52.6%) | 53 (5.9%) |
| College / Associate Degree | 300 (57.0%) | 21 (4.0%) |
| Bachelor's Degree or higher | 358 (79.0%) | 0 (0.0%) |
| Total | 1,193 (58.7%) | 91 (4.5%) |
Employment Occupations by Sex in Springfield
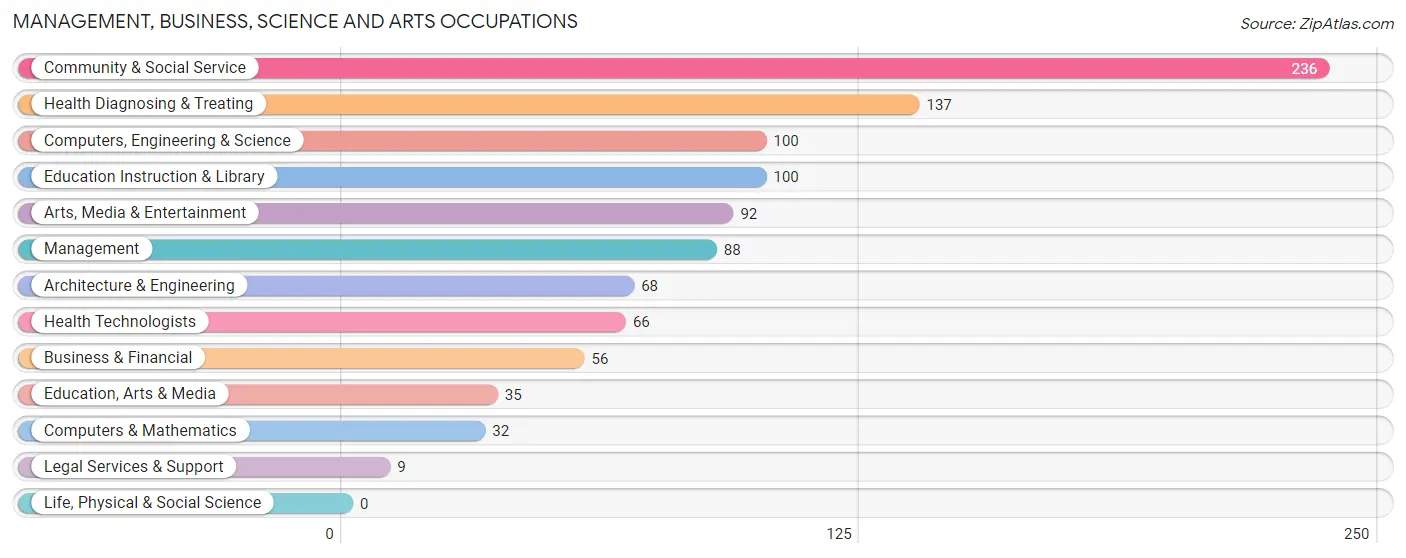
Management, Business, Science and Arts Occupations
The most common Management, Business, Science and Arts occupations in Springfield are Community & Social Service (236 | 15.1%), Health Diagnosing & Treating (137 | 8.8%), Computers, Engineering & Science (100 | 6.4%), Education Instruction & Library (100 | 6.4%), and Arts, Media & Entertainment (92 | 5.9%).
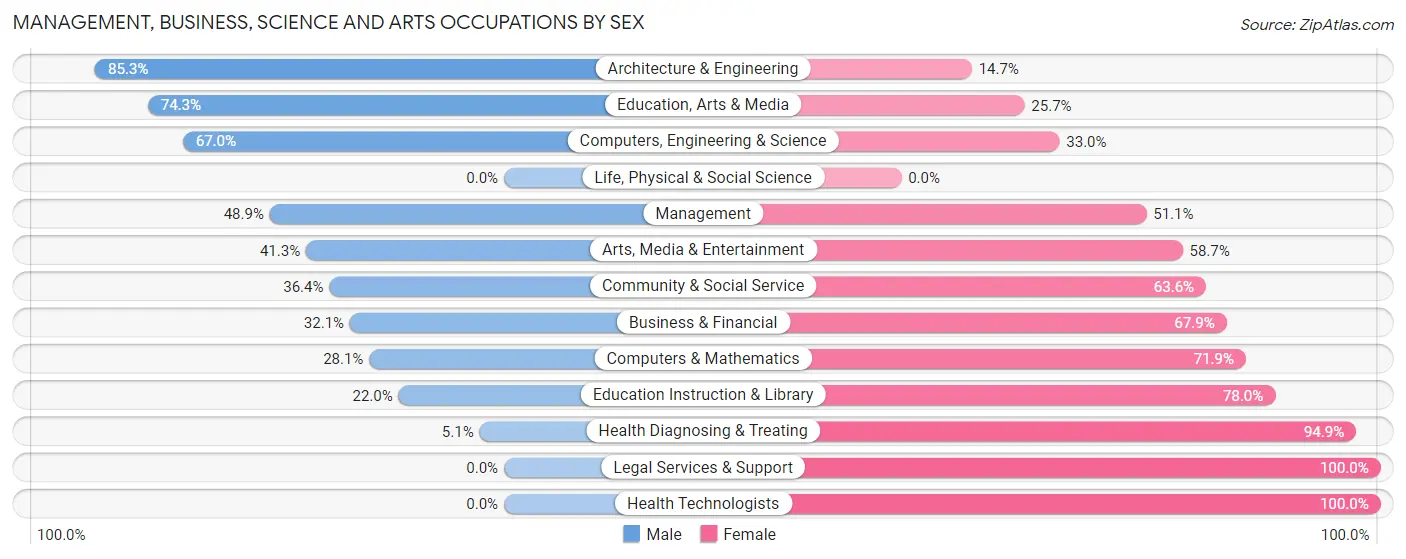
Management, Business, Science and Arts Occupations by Sex
Within the Management, Business, Science and Arts occupations in Springfield, the most male-oriented occupations are Architecture & Engineering (85.3%), Education, Arts & Media (74.3%), and Computers, Engineering & Science (67.0%), while the most female-oriented occupations are Legal Services & Support (100.0%), Health Technologists (100.0%), and Health Diagnosing & Treating (94.9%).
| Occupation | Male | Female |
| Management | 43 (48.9%) | 45 (51.1%) |
| Business & Financial | 18 (32.1%) | 38 (67.9%) |
| Computers, Engineering & Science | 67 (67.0%) | 33 (33.0%) |
| Computers & Mathematics | 9 (28.1%) | 23 (71.9%) |
| Architecture & Engineering | 58 (85.3%) | 10 (14.7%) |
| Life, Physical & Social Science | 0 (0.0%) | 0 (0.0%) |
| Community & Social Service | 86 (36.4%) | 150 (63.6%) |
| Education, Arts & Media | 26 (74.3%) | 9 (25.7%) |
| Legal Services & Support | 0 (0.0%) | 9 (100.0%) |
| Education Instruction & Library | 22 (22.0%) | 78 (78.0%) |
| Arts, Media & Entertainment | 38 (41.3%) | 54 (58.7%) |
| Health Diagnosing & Treating | 7 (5.1%) | 130 (94.9%) |
| Health Technologists | 0 (0.0%) | 66 (100.0%) |
| Total (Category) | 221 (35.8%) | 396 (64.2%) |
| Total (Overall) | 838 (53.8%) | 720 (46.2%) |
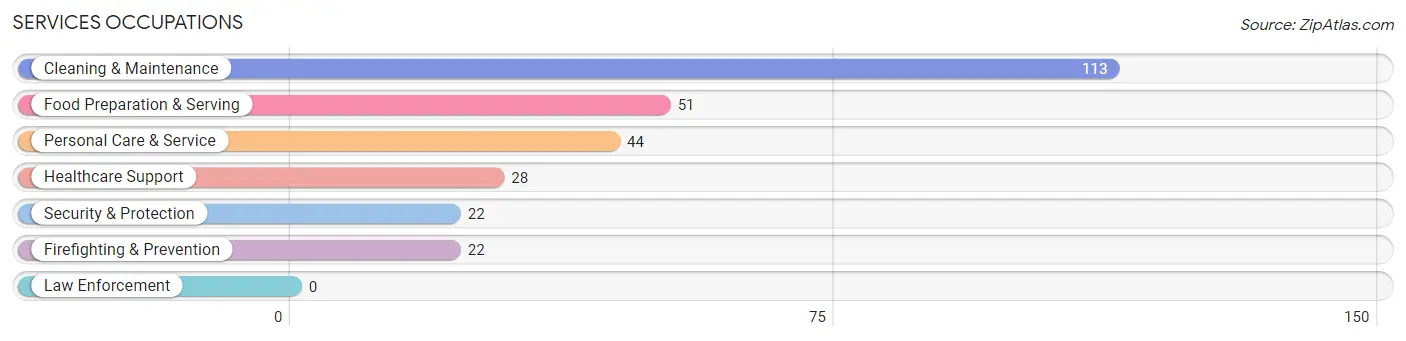
Services Occupations
The most common Services occupations in Springfield are Cleaning & Maintenance (113 | 7.2%), Food Preparation & Serving (51 | 3.3%), Personal Care & Service (44 | 2.8%), Healthcare Support (28 | 1.8%), and Security & Protection (22 | 1.4%).
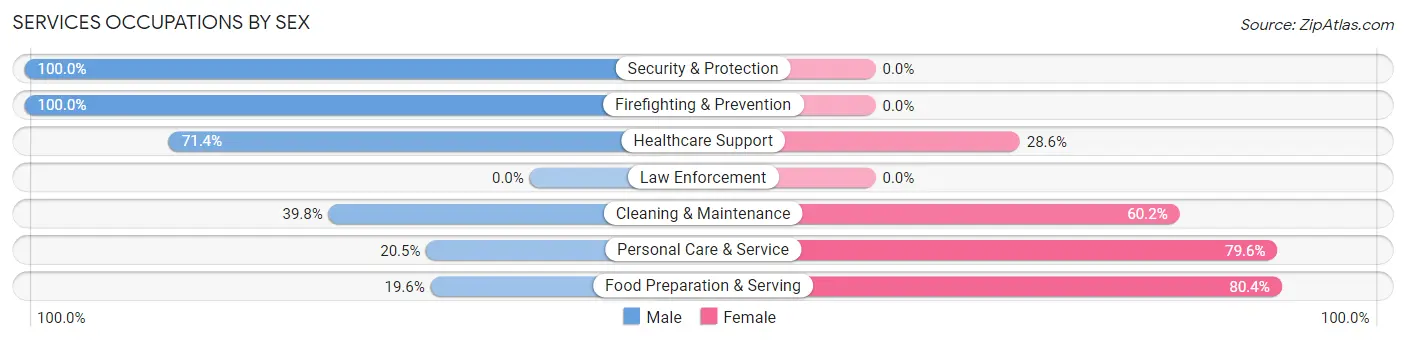
Services Occupations by Sex
Within the Services occupations in Springfield, the most male-oriented occupations are Security & Protection (100.0%), Firefighting & Prevention (100.0%), and Healthcare Support (71.4%), while the most female-oriented occupations are Food Preparation & Serving (80.4%), Personal Care & Service (79.5%), and Cleaning & Maintenance (60.2%).
| Occupation | Male | Female |
| Healthcare Support | 20 (71.4%) | 8 (28.6%) |
| Security & Protection | 22 (100.0%) | 0 (0.0%) |
| Firefighting & Prevention | 22 (100.0%) | 0 (0.0%) |
| Law Enforcement | 0 (0.0%) | 0 (0.0%) |
| Food Preparation & Serving | 10 (19.6%) | 41 (80.4%) |
| Cleaning & Maintenance | 45 (39.8%) | 68 (60.2%) |
| Personal Care & Service | 9 (20.4%) | 35 (79.5%) |
| Total (Category) | 106 (41.1%) | 152 (58.9%) |
| Total (Overall) | 838 (53.8%) | 720 (46.2%) |
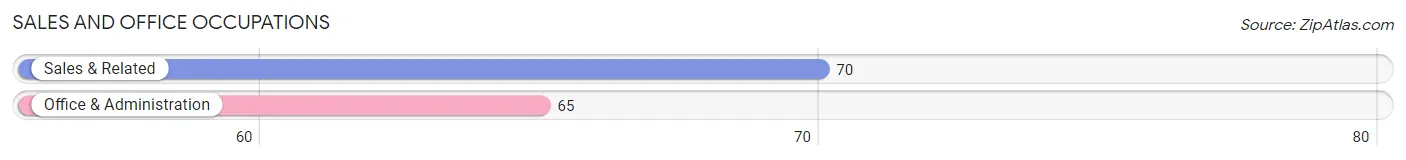
Sales and Office Occupations
The most common Sales and Office occupations in Springfield are Sales & Related (70 | 4.5%), and Office & Administration (65 | 4.2%).
Sales and Office Occupations by Sex
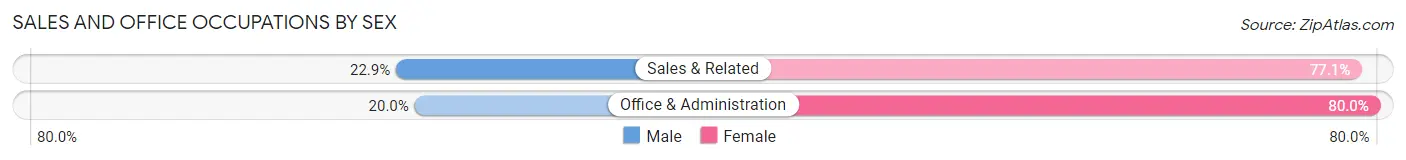
| Occupation | Male | Female |
| Sales & Related | 16 (22.9%) | 54 (77.1%) |
| Office & Administration | 13 (20.0%) | 52 (80.0%) |
| Total (Category) | 29 (21.5%) | 106 (78.5%) |
| Total (Overall) | 838 (53.8%) | 720 (46.2%) |
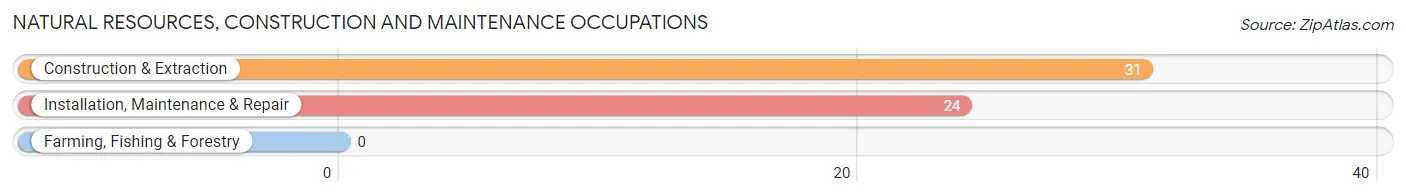
Natural Resources, Construction and Maintenance Occupations
The most common Natural Resources, Construction and Maintenance occupations in Springfield are Construction & Extraction (31 | 2.0%), and Installation, Maintenance & Repair (24 | 1.5%).
Natural Resources, Construction and Maintenance Occupations by Sex
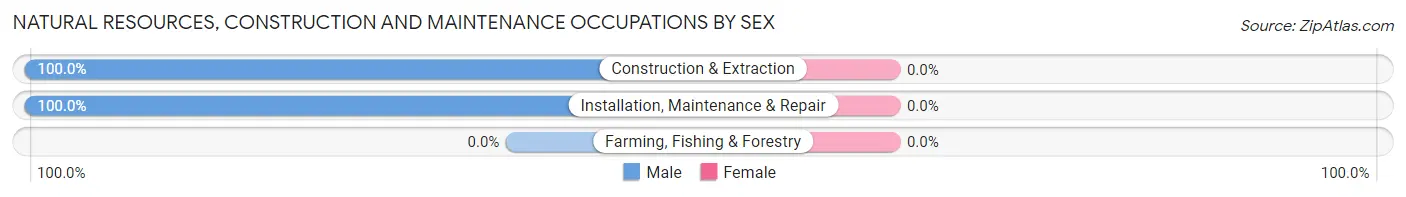
| Occupation | Male | Female |
| Farming, Fishing & Forestry | 0 (0.0%) | 0 (0.0%) |
| Construction & Extraction | 31 (100.0%) | 0 (0.0%) |
| Installation, Maintenance & Repair | 24 (100.0%) | 0 (0.0%) |
| Total (Category) | 55 (100.0%) | 0 (0.0%) |
| Total (Overall) | 838 (53.8%) | 720 (46.2%) |
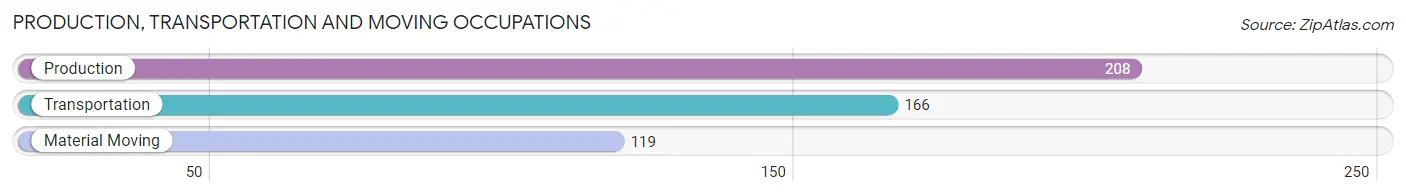
Production, Transportation and Moving Occupations
The most common Production, Transportation and Moving occupations in Springfield are Production (208 | 13.4%), Transportation (166 | 10.6%), and Material Moving (119 | 7.6%).
Production, Transportation and Moving Occupations by Sex
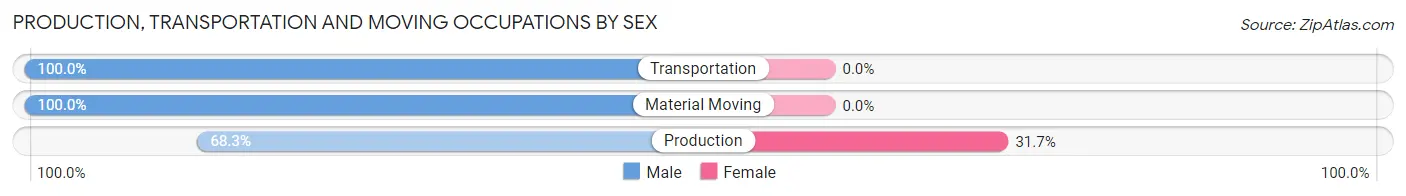
| Occupation | Male | Female |
| Production | 142 (68.3%) | 66 (31.7%) |
| Transportation | 166 (100.0%) | 0 (0.0%) |
| Material Moving | 119 (100.0%) | 0 (0.0%) |
| Total (Category) | 427 (86.6%) | 66 (13.4%) |
| Total (Overall) | 838 (53.8%) | 720 (46.2%) |
Employment Industries by Sex in Springfield
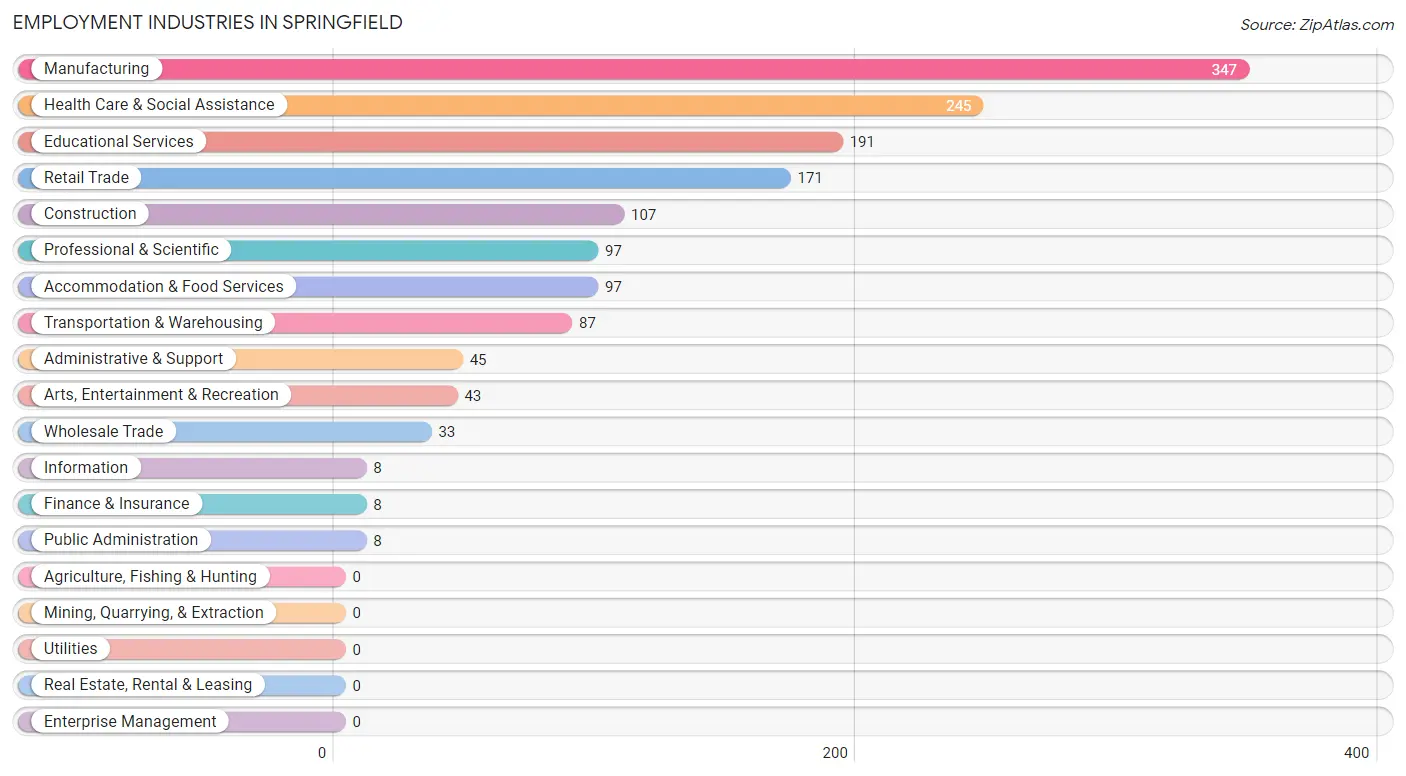
Employment Industries in Springfield
The major employment industries in Springfield include Manufacturing (347 | 22.3%), Health Care & Social Assistance (245 | 15.7%), Educational Services (191 | 12.3%), Retail Trade (171 | 11.0%), and Construction (107 | 6.9%).
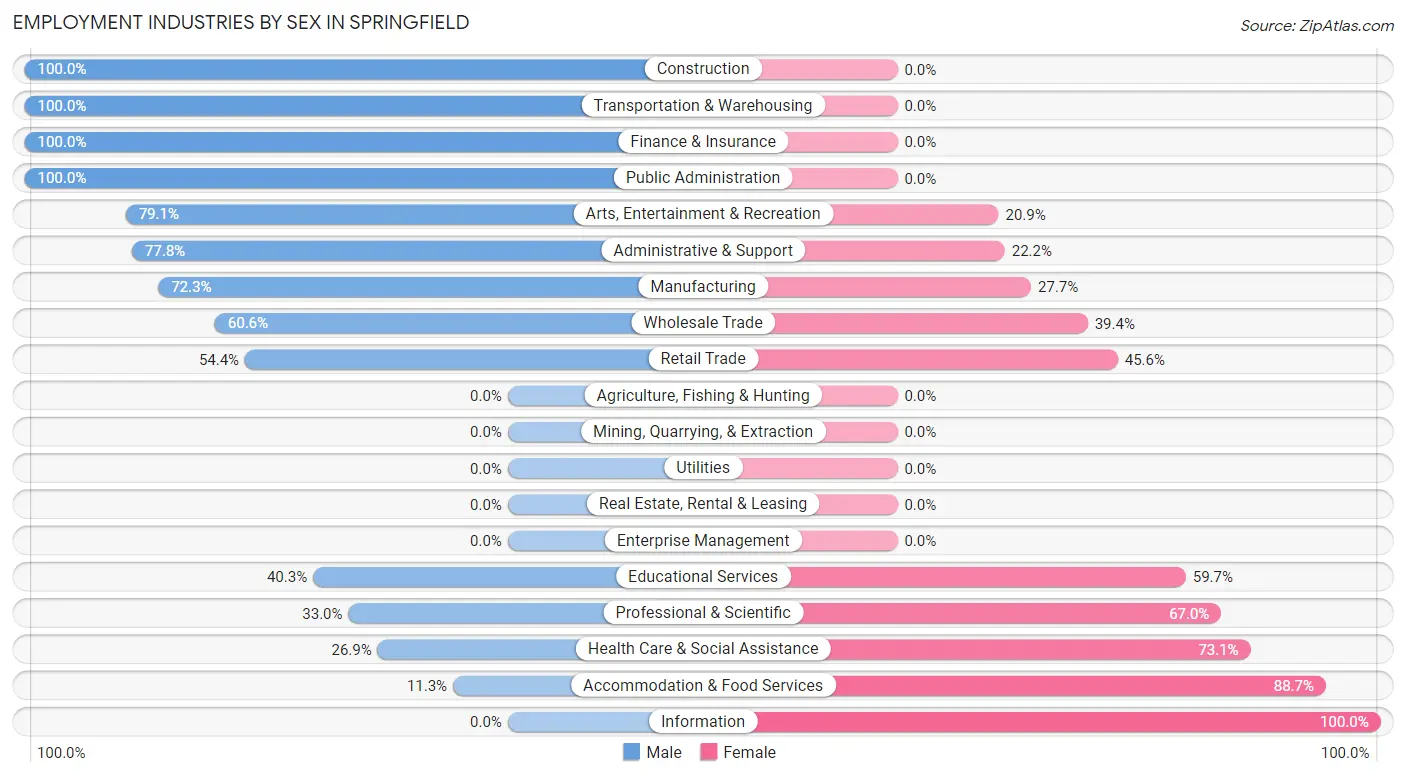
Employment Industries by Sex in Springfield
The Springfield industries that see more men than women are Construction (100.0%), Transportation & Warehousing (100.0%), and Finance & Insurance (100.0%), whereas the industries that tend to have a higher number of women are Information (100.0%), Accommodation & Food Services (88.7%), and Health Care & Social Assistance (73.1%).
| Industry | Male | Female |
| Agriculture, Fishing & Hunting | 0 (0.0%) | 0 (0.0%) |
| Mining, Quarrying, & Extraction | 0 (0.0%) | 0 (0.0%) |
| Construction | 107 (100.0%) | 0 (0.0%) |
| Manufacturing | 251 (72.3%) | 96 (27.7%) |
| Wholesale Trade | 20 (60.6%) | 13 (39.4%) |
| Retail Trade | 93 (54.4%) | 78 (45.6%) |
| Transportation & Warehousing | 87 (100.0%) | 0 (0.0%) |
| Utilities | 0 (0.0%) | 0 (0.0%) |
| Information | 0 (0.0%) | 8 (100.0%) |
| Finance & Insurance | 8 (100.0%) | 0 (0.0%) |
| Real Estate, Rental & Leasing | 0 (0.0%) | 0 (0.0%) |
| Professional & Scientific | 32 (33.0%) | 65 (67.0%) |
| Enterprise Management | 0 (0.0%) | 0 (0.0%) |
| Administrative & Support | 35 (77.8%) | 10 (22.2%) |
| Educational Services | 77 (40.3%) | 114 (59.7%) |
| Health Care & Social Assistance | 66 (26.9%) | 179 (73.1%) |
| Arts, Entertainment & Recreation | 34 (79.1%) | 9 (20.9%) |
| Accommodation & Food Services | 11 (11.3%) | 86 (88.7%) |
| Public Administration | 8 (100.0%) | 0 (0.0%) |
| Total | 838 (53.8%) | 720 (46.2%) |
Education in Springfield
School Enrollment in Springfield
The most common levels of schooling among the 701 students in Springfield are middle school (181 | 25.8%), college / undergraduate (139 | 19.8%), and elementary school (103 | 14.7%).
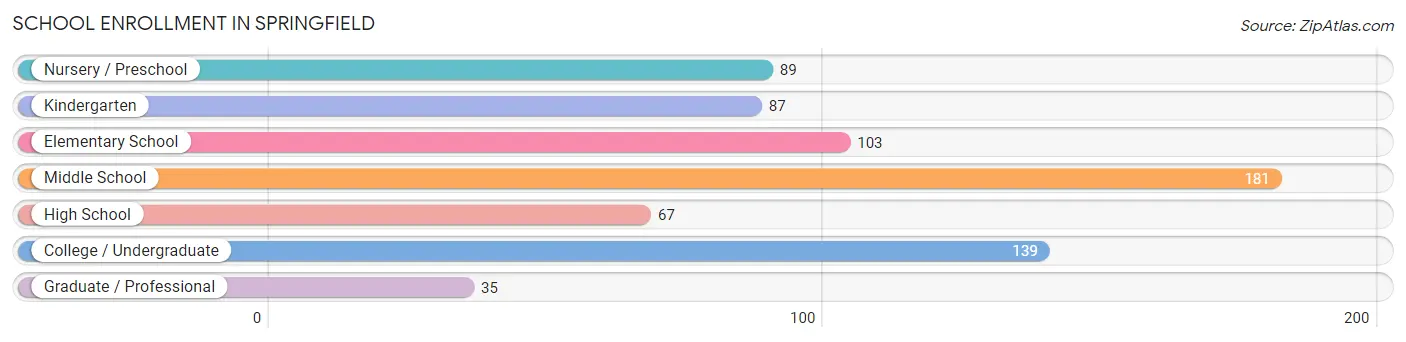
| School Level | # Students | % Students |
| Nursery / Preschool | 89 | 12.7% |
| Kindergarten | 87 | 12.4% |
| Elementary School | 103 | 14.7% |
| Middle School | 181 | 25.8% |
| High School | 67 | 9.6% |
| College / Undergraduate | 139 | 19.8% |
| Graduate / Professional | 35 | 5.0% |
| Total | 701 | 100.0% |
School Enrollment by Age by Funding Source in Springfield
Out of a total of 701 students who are enrolled in schools in Springfield, 171 (24.4%) attend a private institution, while the remaining 530 (75.6%) are enrolled in public schools. The age group of 35 years and over has the highest likelihood of being enrolled in private schools, with 35 (76.1% in the age bracket) enrolled. Conversely, the age group of 5 to 9 year old has the lowest likelihood of being enrolled in a private school, with 190 (100.0% in the age bracket) attending a public institution.
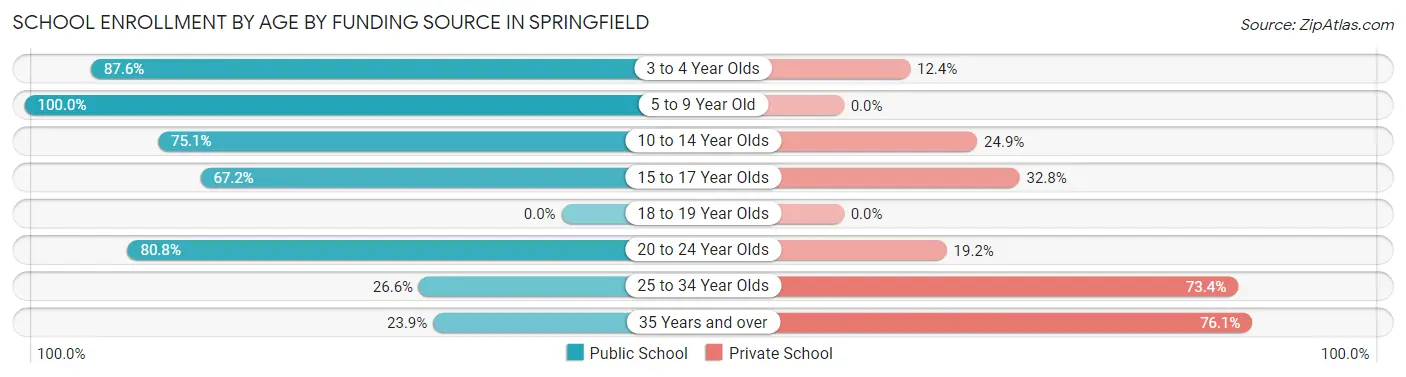
| Age Bracket | Public School | Private School |
| 3 to 4 Year Olds | 78 (87.6%) | 11 (12.4%) |
| 5 to 9 Year Old | 190 (100.0%) | 0 (0.0%) |
| 10 to 14 Year Olds | 136 (75.1%) | 45 (24.9%) |
| 15 to 17 Year Olds | 39 (67.2%) | 19 (32.8%) |
| 18 to 19 Year Olds | 0 (0.0%) | 0 (0.0%) |
| 20 to 24 Year Olds | 59 (80.8%) | 14 (19.2%) |
| 25 to 34 Year Olds | 17 (26.6%) | 47 (73.4%) |
| 35 Years and over | 11 (23.9%) | 35 (76.1%) |
| Total | 530 (75.6%) | 171 (24.4%) |
Educational Attainment by Field of Study in Springfield
Education (119 | 17.2%), bio, nature & agricultural (80 | 11.6%), liberal arts & history (75 | 10.9%), literature & languages (68 | 9.9%), and psychology (63 | 9.1%) are the most common fields of study among 690 individuals in Springfield who have obtained a bachelor's degree or higher.
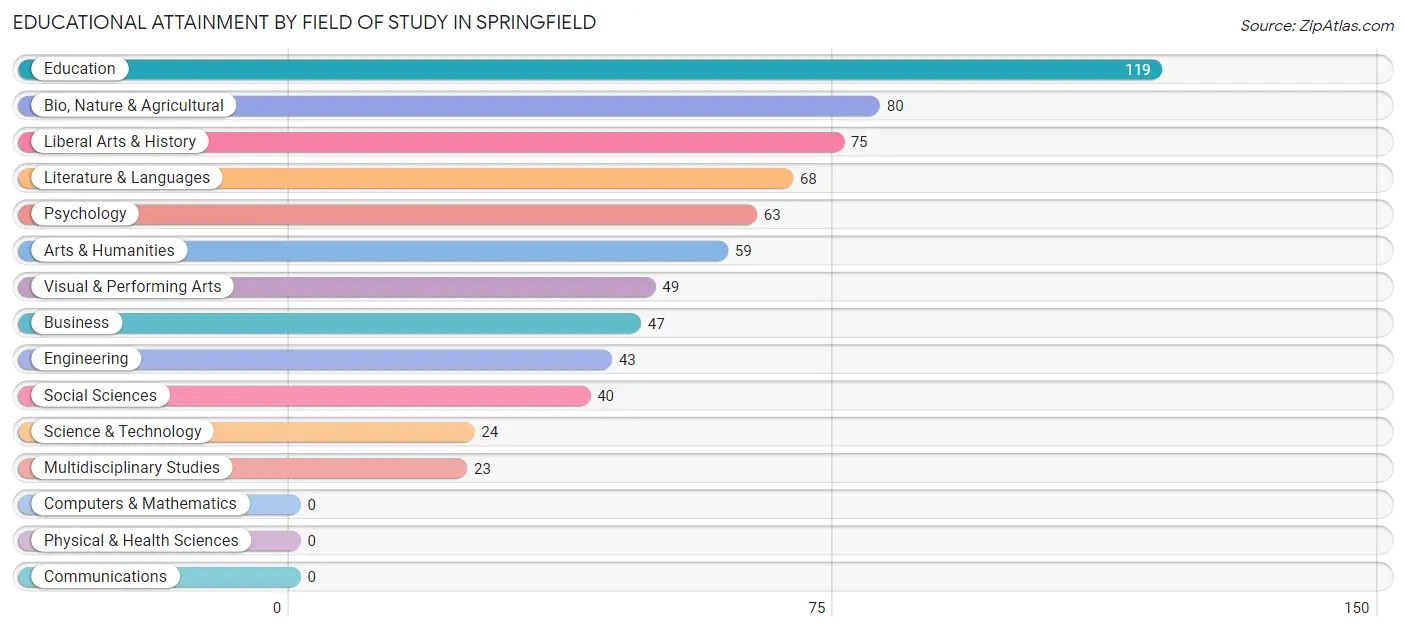
| Field of Study | # Graduates | % Graduates |
| Computers & Mathematics | 0 | 0.0% |
| Bio, Nature & Agricultural | 80 | 11.6% |
| Physical & Health Sciences | 0 | 0.0% |
| Psychology | 63 | 9.1% |
| Social Sciences | 40 | 5.8% |
| Engineering | 43 | 6.2% |
| Multidisciplinary Studies | 23 | 3.3% |
| Science & Technology | 24 | 3.5% |
| Business | 47 | 6.8% |
| Education | 119 | 17.2% |
| Literature & Languages | 68 | 9.9% |
| Liberal Arts & History | 75 | 10.9% |
| Visual & Performing Arts | 49 | 7.1% |
| Communications | 0 | 0.0% |
| Arts & Humanities | 59 | 8.6% |
| Total | 690 | 100.0% |
Transportation & Commute in Springfield
Vehicle Availability by Sex in Springfield
The most prevalent vehicle ownership categories in Springfield are males with 2 vehicles (350, accounting for 43.5%) and females with 2 vehicles (227, making up 50.3%).
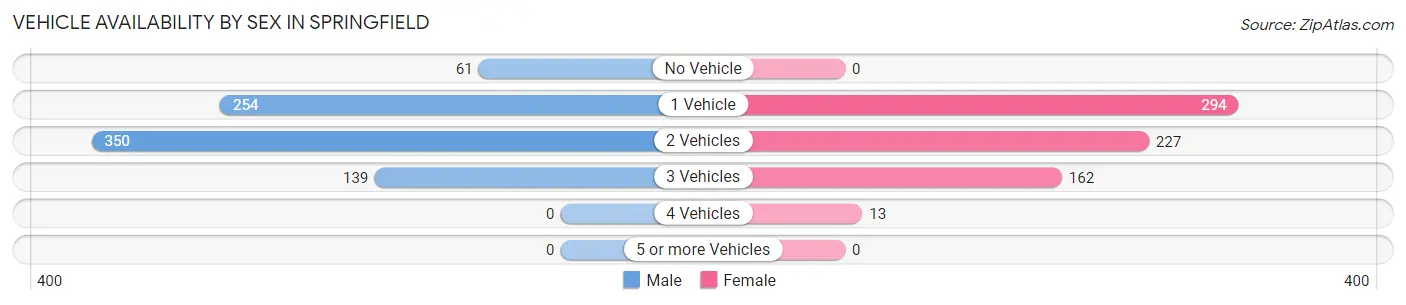
| Vehicles Available | Male | Female |
| No Vehicle | 61 (7.6%) | 0 (0.0%) |
| 1 Vehicle | 254 (31.6%) | 294 (42.2%) |
| 2 Vehicles | 350 (43.5%) | 227 (32.6%) |
| 3 Vehicles | 139 (17.3%) | 162 (23.3%) |
| 4 Vehicles | 0 (0.0%) | 13 (1.9%) |
| 5 or more Vehicles | 0 (0.0%) | 0 (0.0%) |
| Total | 804 (100.0%) | 696 (100.0%) |
Commute Time in Springfield
The most frequently occuring commute durations in Springfield are 30 to 34 minutes (249 commuters, 17.1%), 45 to 59 minutes (198 commuters, 13.6%), and 10 to 14 minutes (186 commuters, 12.8%).
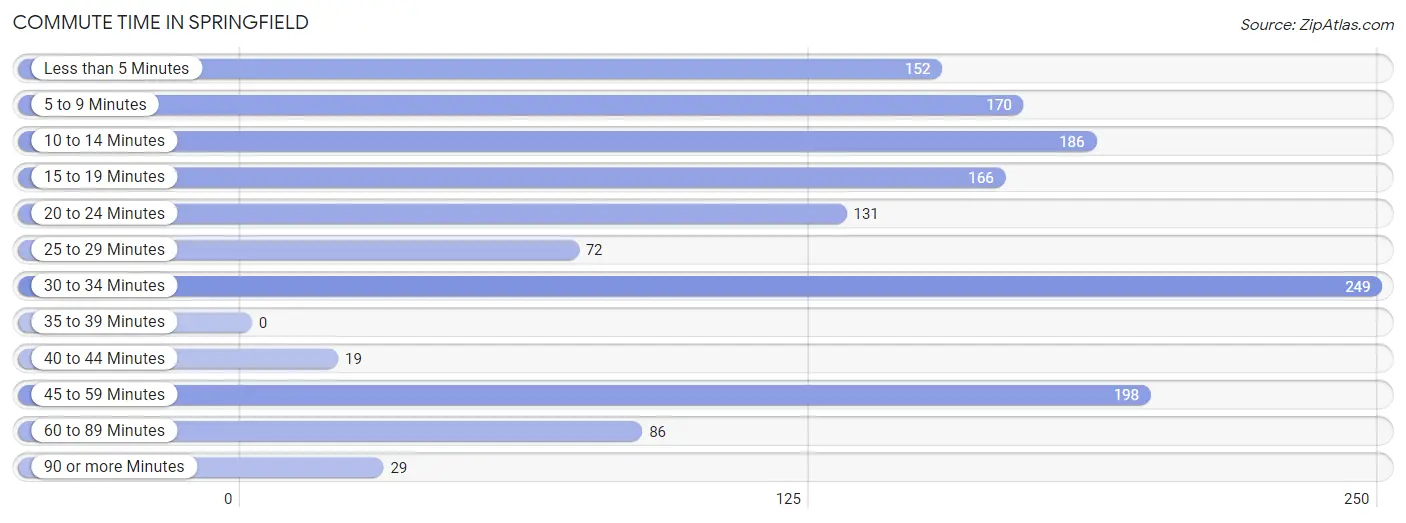
| Commute Time | # Commuters | % Commuters |
| Less than 5 Minutes | 152 | 10.4% |
| 5 to 9 Minutes | 170 | 11.7% |
| 10 to 14 Minutes | 186 | 12.8% |
| 15 to 19 Minutes | 166 | 11.4% |
| 20 to 24 Minutes | 131 | 9.0% |
| 25 to 29 Minutes | 72 | 4.9% |
| 30 to 34 Minutes | 249 | 17.1% |
| 35 to 39 Minutes | 0 | 0.0% |
| 40 to 44 Minutes | 19 | 1.3% |
| 45 to 59 Minutes | 198 | 13.6% |
| 60 to 89 Minutes | 86 | 5.9% |
| 90 or more Minutes | 29 | 2.0% |
Commute Time by Sex in Springfield
The most common commute times in Springfield are 45 to 59 minutes (169 commuters, 21.9%) for males and 30 to 34 minutes (183 commuters, 26.7%) for females.
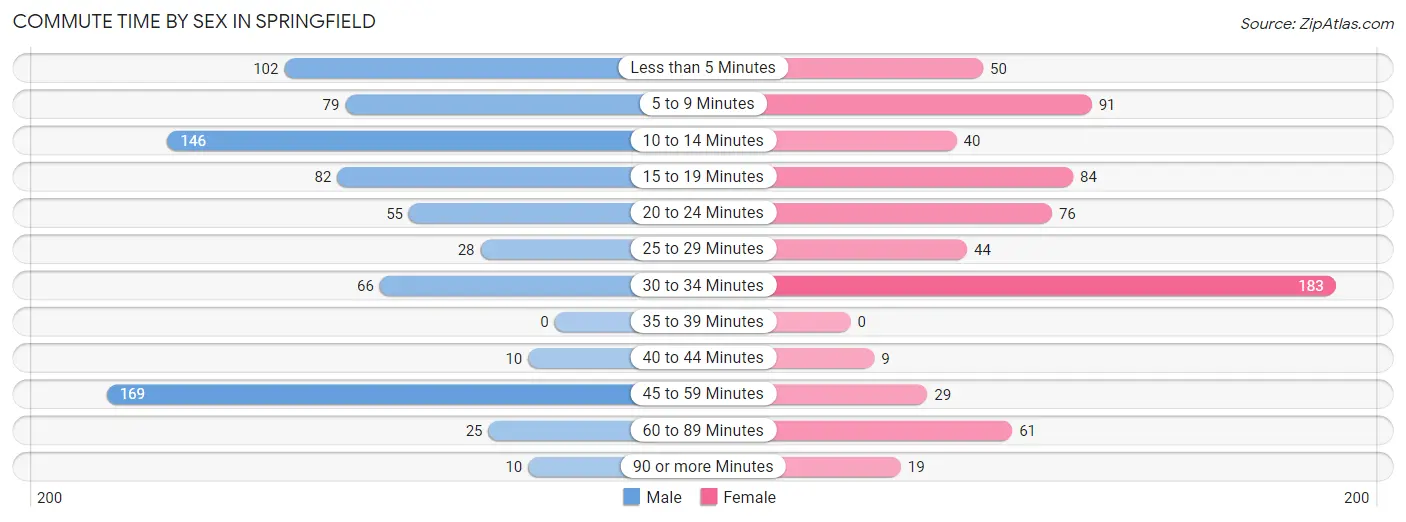
| Commute Time | Male | Female |
| Less than 5 Minutes | 102 (13.2%) | 50 (7.3%) |
| 5 to 9 Minutes | 79 (10.2%) | 91 (13.3%) |
| 10 to 14 Minutes | 146 (18.9%) | 40 (5.8%) |
| 15 to 19 Minutes | 82 (10.6%) | 84 (12.2%) |
| 20 to 24 Minutes | 55 (7.1%) | 76 (11.1%) |
| 25 to 29 Minutes | 28 (3.6%) | 44 (6.4%) |
| 30 to 34 Minutes | 66 (8.6%) | 183 (26.7%) |
| 35 to 39 Minutes | 0 (0.0%) | 0 (0.0%) |
| 40 to 44 Minutes | 10 (1.3%) | 9 (1.3%) |
| 45 to 59 Minutes | 169 (21.9%) | 29 (4.2%) |
| 60 to 89 Minutes | 25 (3.2%) | 61 (8.9%) |
| 90 or more Minutes | 10 (1.3%) | 19 (2.8%) |
Time of Departure to Work by Sex in Springfield
The most frequent times of departure to work in Springfield are 7:30 AM to 7:59 AM (157, 20.3%) for males and 7:00 AM to 7:29 AM (120, 17.5%) for females.
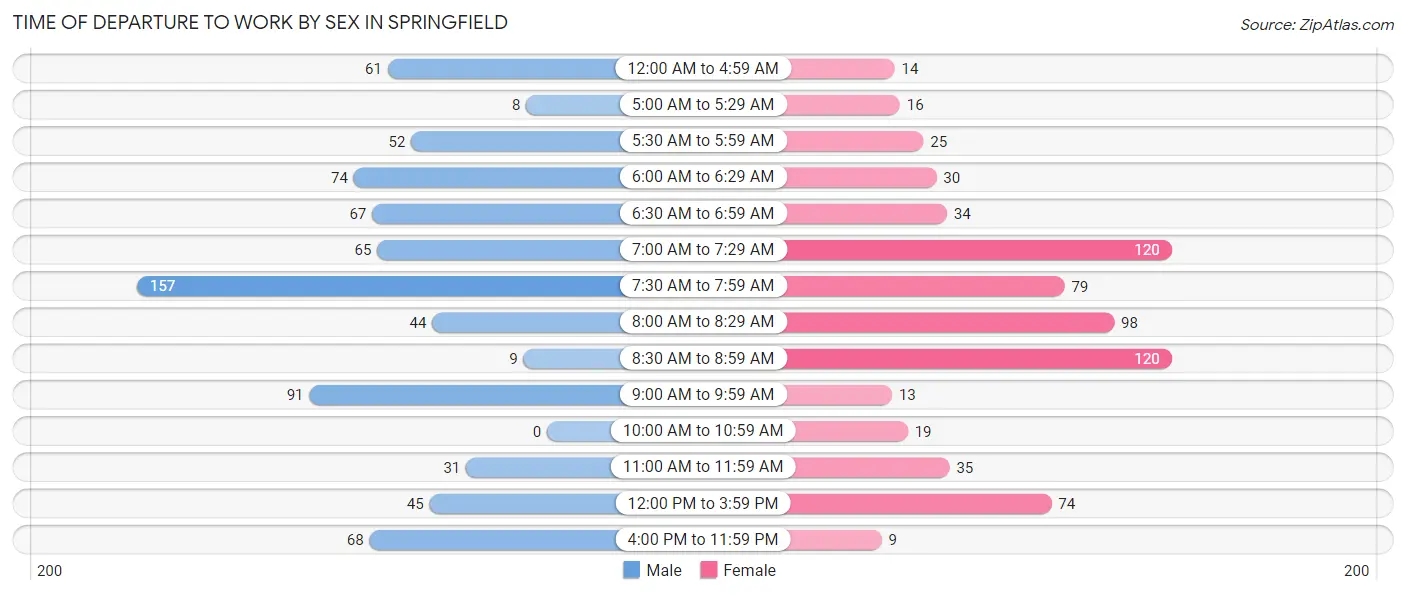
| Time of Departure | Male | Female |
| 12:00 AM to 4:59 AM | 61 (7.9%) | 14 (2.0%) |
| 5:00 AM to 5:29 AM | 8 (1.0%) | 16 (2.3%) |
| 5:30 AM to 5:59 AM | 52 (6.7%) | 25 (3.6%) |
| 6:00 AM to 6:29 AM | 74 (9.6%) | 30 (4.4%) |
| 6:30 AM to 6:59 AM | 67 (8.7%) | 34 (5.0%) |
| 7:00 AM to 7:29 AM | 65 (8.4%) | 120 (17.5%) |
| 7:30 AM to 7:59 AM | 157 (20.3%) | 79 (11.5%) |
| 8:00 AM to 8:29 AM | 44 (5.7%) | 98 (14.3%) |
| 8:30 AM to 8:59 AM | 9 (1.2%) | 120 (17.5%) |
| 9:00 AM to 9:59 AM | 91 (11.8%) | 13 (1.9%) |
| 10:00 AM to 10:59 AM | 0 (0.0%) | 19 (2.8%) |
| 11:00 AM to 11:59 AM | 31 (4.0%) | 35 (5.1%) |
| 12:00 PM to 3:59 PM | 45 (5.8%) | 74 (10.8%) |
| 4:00 PM to 11:59 PM | 68 (8.8%) | 9 (1.3%) |
| Total | 772 (100.0%) | 686 (100.0%) |
Housing Occupancy in Springfield
Occupancy by Ownership in Springfield
Of the total 1,816 dwellings in Springfield, owner-occupied units account for 1,014 (55.8%), while renter-occupied units make up 802 (44.2%).
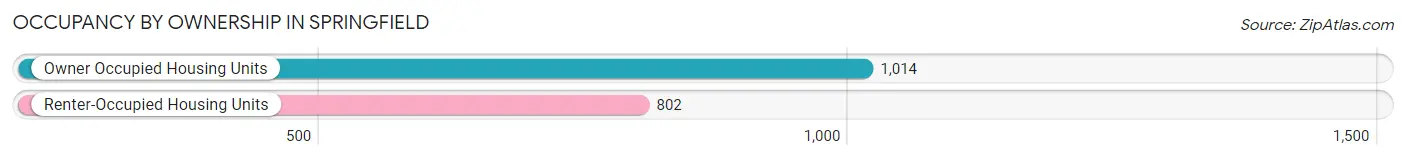
| Occupancy | # Housing Units | % Housing Units |
| Owner Occupied Housing Units | 1,014 | 55.8% |
| Renter-Occupied Housing Units | 802 | 44.2% |
| Total Occupied Housing Units | 1,816 | 100.0% |
Occupancy by Household Size in Springfield
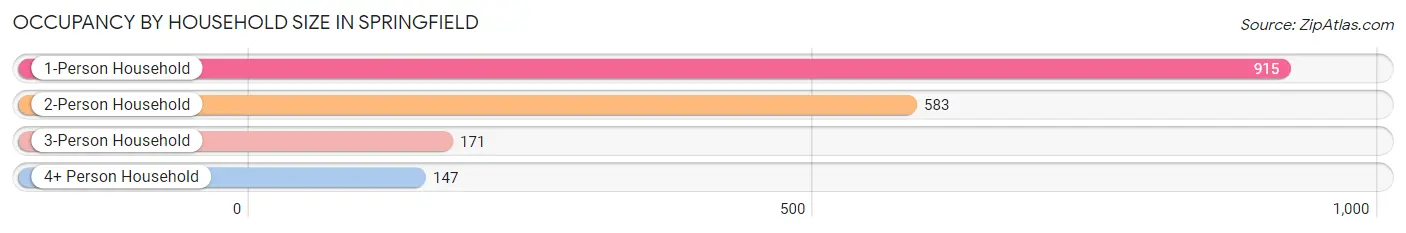
| Household Size | # Housing Units | % Housing Units |
| 1-Person Household | 915 | 50.4% |
| 2-Person Household | 583 | 32.1% |
| 3-Person Household | 171 | 9.4% |
| 4+ Person Household | 147 | 8.1% |
| Total Housing Units | 1,816 | 100.0% |
Occupancy by Ownership by Household Size in Springfield
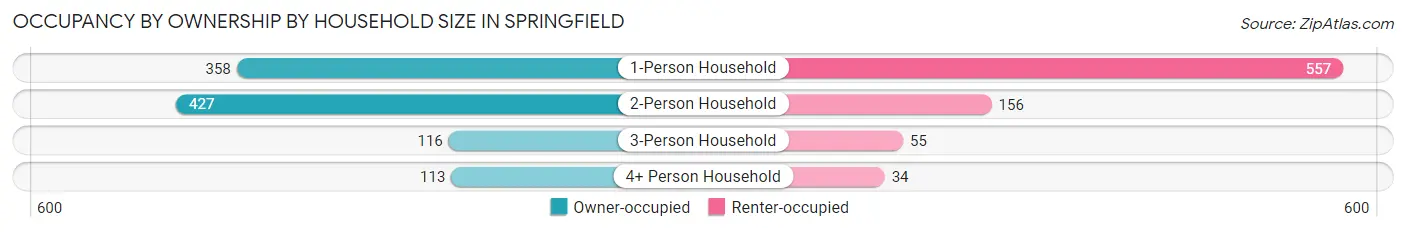
| Household Size | Owner-occupied | Renter-occupied |
| 1-Person Household | 358 (39.1%) | 557 (60.9%) |
| 2-Person Household | 427 (73.2%) | 156 (26.8%) |
| 3-Person Household | 116 (67.8%) | 55 (32.2%) |
| 4+ Person Household | 113 (76.9%) | 34 (23.1%) |
| Total Housing Units | 1,014 (55.8%) | 802 (44.2%) |
Occupancy by Educational Attainment in Springfield
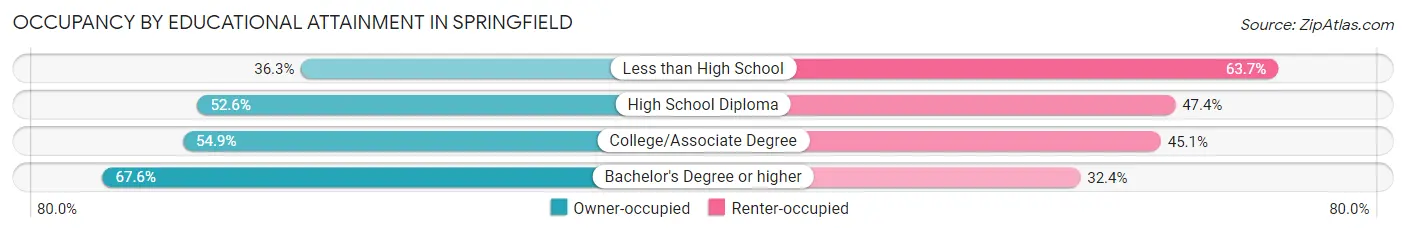
| Household Size | Owner-occupied | Renter-occupied |
| Less than High School | 37 (36.3%) | 65 (63.7%) |
| High School Diploma | 388 (52.6%) | 350 (47.4%) |
| College/Associate Degree | 305 (54.9%) | 251 (45.1%) |
| Bachelor's Degree or higher | 284 (67.6%) | 136 (32.4%) |
Occupancy by Age of Householder in Springfield
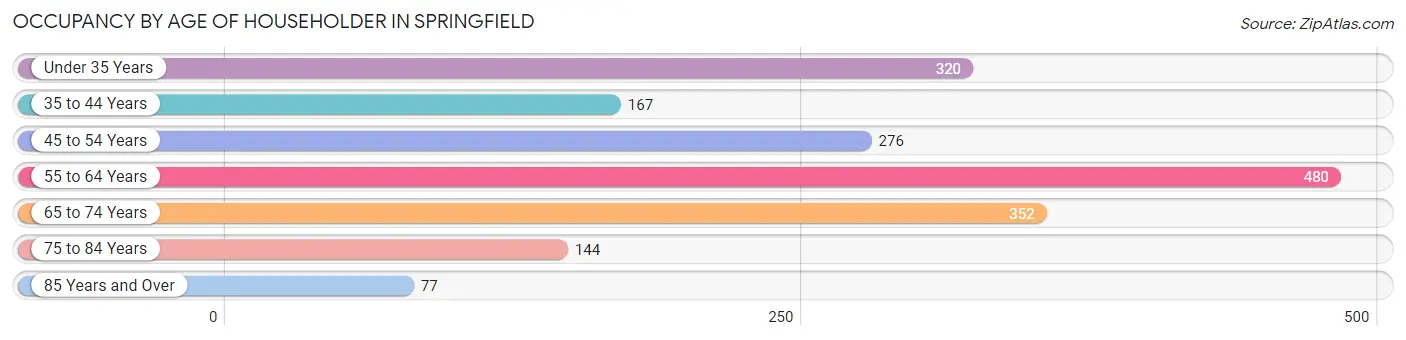
| Age Bracket | # Households | % Households |
| Under 35 Years | 320 | 17.6% |
| 35 to 44 Years | 167 | 9.2% |
| 45 to 54 Years | 276 | 15.2% |
| 55 to 64 Years | 480 | 26.4% |
| 65 to 74 Years | 352 | 19.4% |
| 75 to 84 Years | 144 | 7.9% |
| 85 Years and Over | 77 | 4.2% |
| Total | 1,816 | 100.0% |
Housing Finances in Springfield
Median Income by Occupancy in Springfield
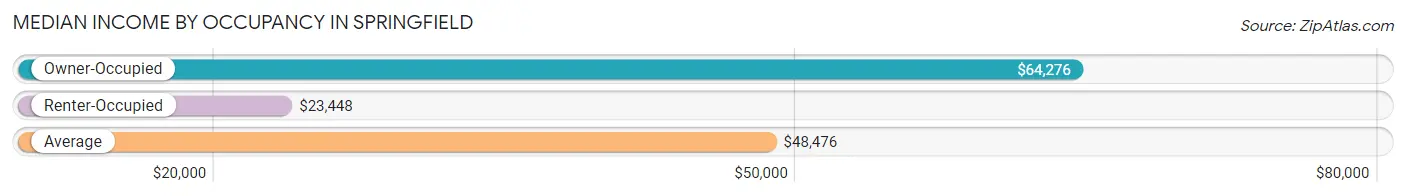
| Occupancy Type | # Households | Median Income |
| Owner-Occupied | 1,014 (55.8%) | $64,276 |
| Renter-Occupied | 802 (44.2%) | $23,448 |
| Average | 1,816 (100.0%) | $48,476 |
Occupancy by Householder Income Bracket in Springfield
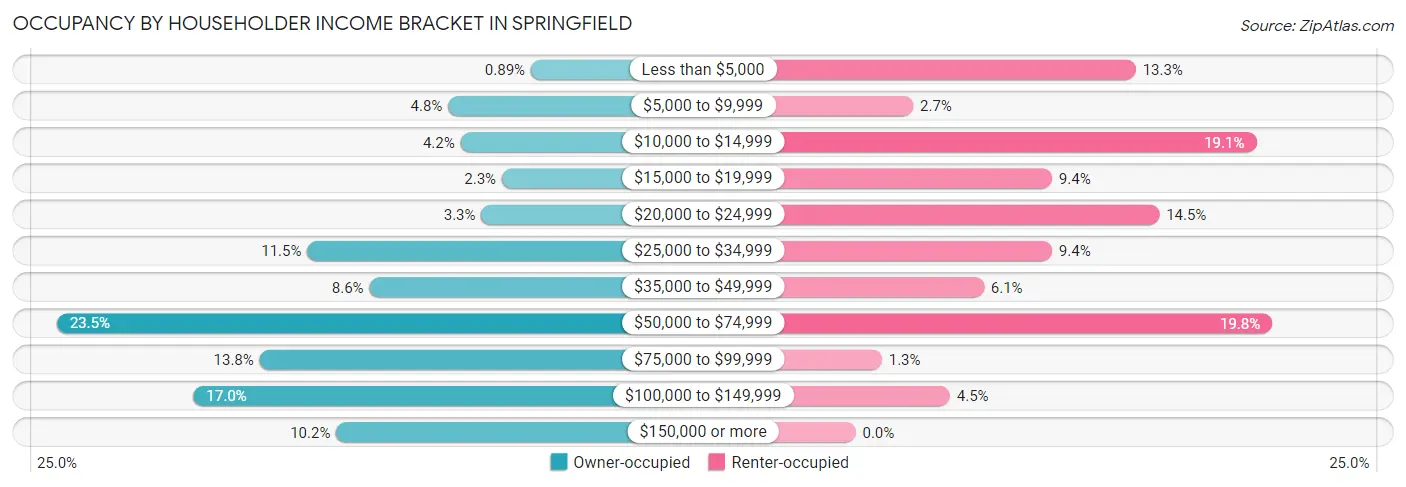
| Income Bracket | Owner-occupied | Renter-occupied |
| Less than $5,000 | 9 (0.9%) | 107 (13.3%) |
| $5,000 to $9,999 | 49 (4.8%) | 22 (2.7%) |
| $10,000 to $14,999 | 43 (4.2%) | 153 (19.1%) |
| $15,000 to $19,999 | 23 (2.3%) | 75 (9.3%) |
| $20,000 to $24,999 | 33 (3.3%) | 116 (14.5%) |
| $25,000 to $34,999 | 117 (11.5%) | 75 (9.3%) |
| $35,000 to $49,999 | 87 (8.6%) | 49 (6.1%) |
| $50,000 to $74,999 | 238 (23.5%) | 159 (19.8%) |
| $75,000 to $99,999 | 140 (13.8%) | 10 (1.3%) |
| $100,000 to $149,999 | 172 (17.0%) | 36 (4.5%) |
| $150,000 or more | 103 (10.2%) | 0 (0.0%) |
| Total | 1,014 (100.0%) | 802 (100.0%) |
Monthly Housing Cost Tiers in Springfield
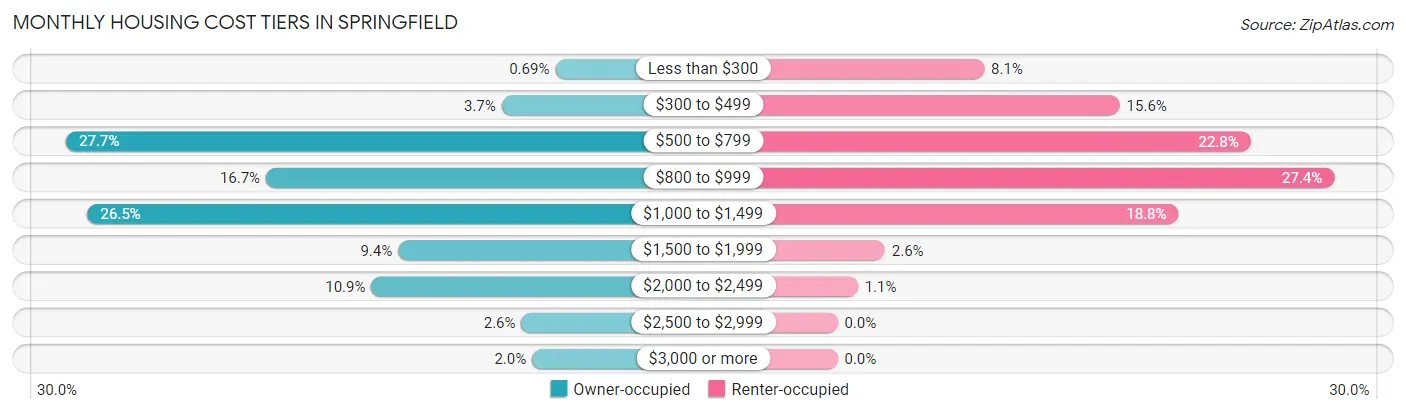
| Monthly Cost | Owner-occupied | Renter-occupied |
| Less than $300 | 7 (0.7%) | 65 (8.1%) |
| $300 to $499 | 37 (3.6%) | 125 (15.6%) |
| $500 to $799 | 281 (27.7%) | 183 (22.8%) |
| $800 to $999 | 169 (16.7%) | 220 (27.4%) |
| $1,000 to $1,499 | 269 (26.5%) | 151 (18.8%) |
| $1,500 to $1,999 | 95 (9.4%) | 21 (2.6%) |
| $2,000 to $2,499 | 110 (10.8%) | 9 (1.1%) |
| $2,500 to $2,999 | 26 (2.6%) | 0 (0.0%) |
| $3,000 or more | 20 (2.0%) | 0 (0.0%) |
| Total | 1,014 (100.0%) | 802 (100.0%) |
Physical Housing Characteristics in Springfield
Housing Structures in Springfield
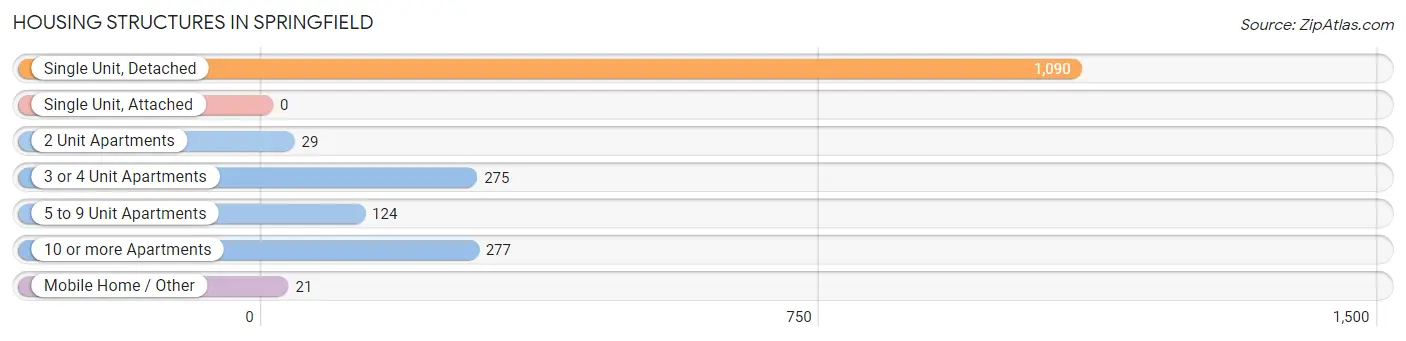
| Structure Type | # Housing Units | % Housing Units |
| Single Unit, Detached | 1,090 | 60.0% |
| Single Unit, Attached | 0 | 0.0% |
| 2 Unit Apartments | 29 | 1.6% |
| 3 or 4 Unit Apartments | 275 | 15.1% |
| 5 to 9 Unit Apartments | 124 | 6.8% |
| 10 or more Apartments | 277 | 15.2% |
| Mobile Home / Other | 21 | 1.2% |
| Total | 1,816 | 100.0% |
Housing Structures by Occupancy in Springfield
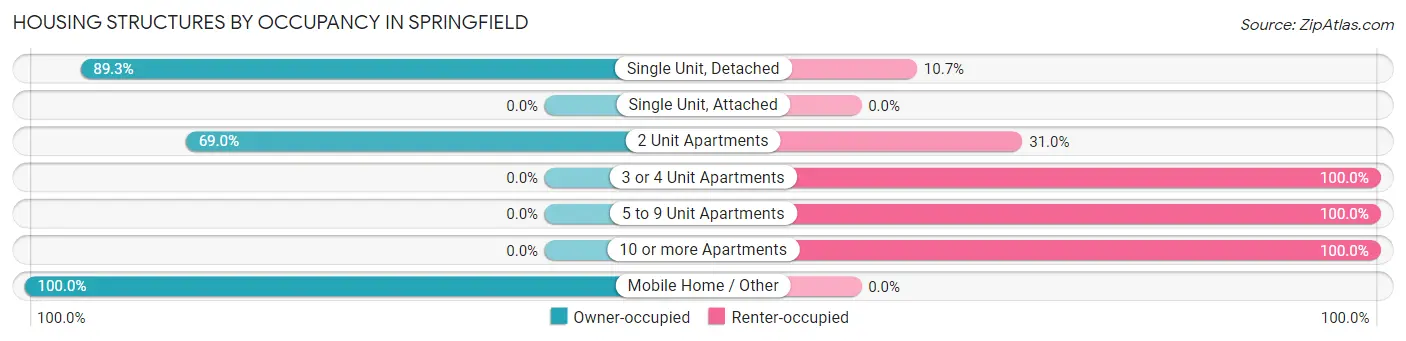
| Structure Type | Owner-occupied | Renter-occupied |
| Single Unit, Detached | 973 (89.3%) | 117 (10.7%) |
| Single Unit, Attached | 0 (0.0%) | 0 (0.0%) |
| 2 Unit Apartments | 20 (69.0%) | 9 (31.0%) |
| 3 or 4 Unit Apartments | 0 (0.0%) | 275 (100.0%) |
| 5 to 9 Unit Apartments | 0 (0.0%) | 124 (100.0%) |
| 10 or more Apartments | 0 (0.0%) | 277 (100.0%) |
| Mobile Home / Other | 21 (100.0%) | 0 (0.0%) |
| Total | 1,014 (55.8%) | 802 (44.2%) |
Housing Structures by Number of Rooms in Springfield
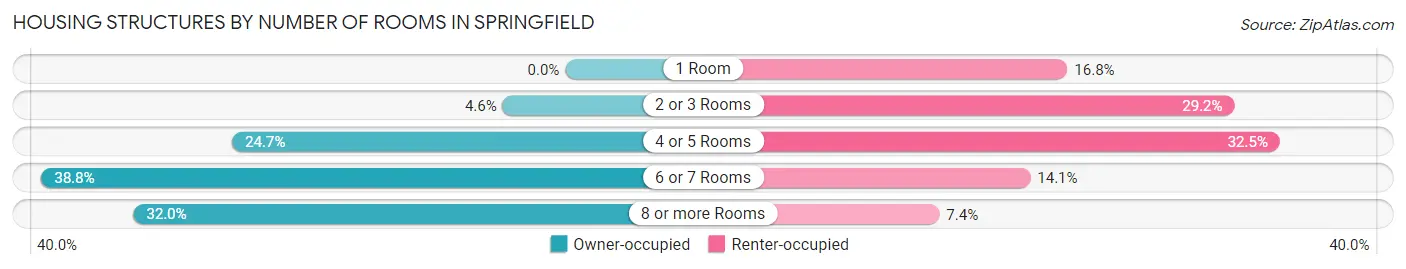
| Number of Rooms | Owner-occupied | Renter-occupied |
| 1 Room | 0 (0.0%) | 135 (16.8%) |
| 2 or 3 Rooms | 47 (4.6%) | 234 (29.2%) |
| 4 or 5 Rooms | 250 (24.6%) | 261 (32.5%) |
| 6 or 7 Rooms | 393 (38.8%) | 113 (14.1%) |
| 8 or more Rooms | 324 (32.0%) | 59 (7.4%) |
| Total | 1,014 (100.0%) | 802 (100.0%) |
Housing Structure by Heating Type in Springfield
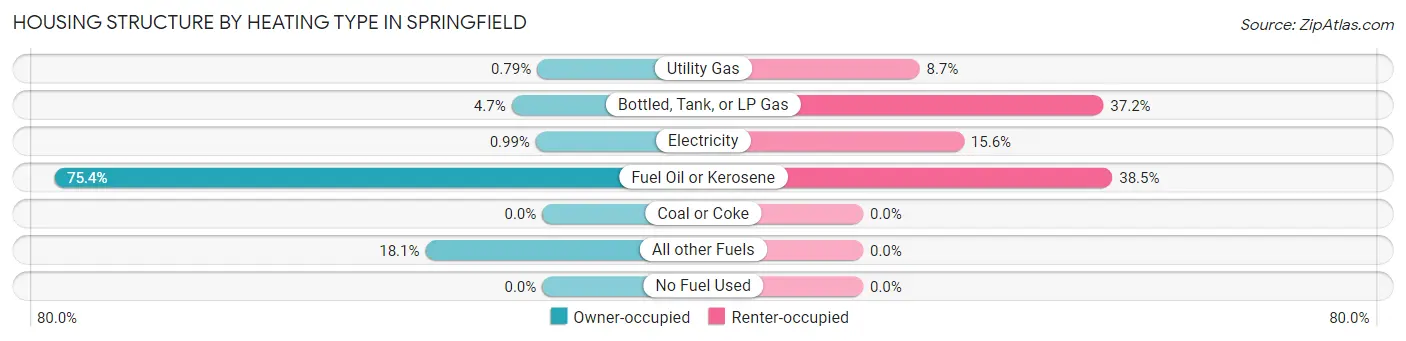
| Heating Type | Owner-occupied | Renter-occupied |
| Utility Gas | 8 (0.8%) | 70 (8.7%) |
| Bottled, Tank, or LP Gas | 48 (4.7%) | 298 (37.2%) |
| Electricity | 10 (1.0%) | 125 (15.6%) |
| Fuel Oil or Kerosene | 765 (75.4%) | 309 (38.5%) |
| Coal or Coke | 0 (0.0%) | 0 (0.0%) |
| All other Fuels | 183 (18.0%) | 0 (0.0%) |
| No Fuel Used | 0 (0.0%) | 0 (0.0%) |
| Total | 1,014 (100.0%) | 802 (100.0%) |
Household Vehicle Usage in Springfield
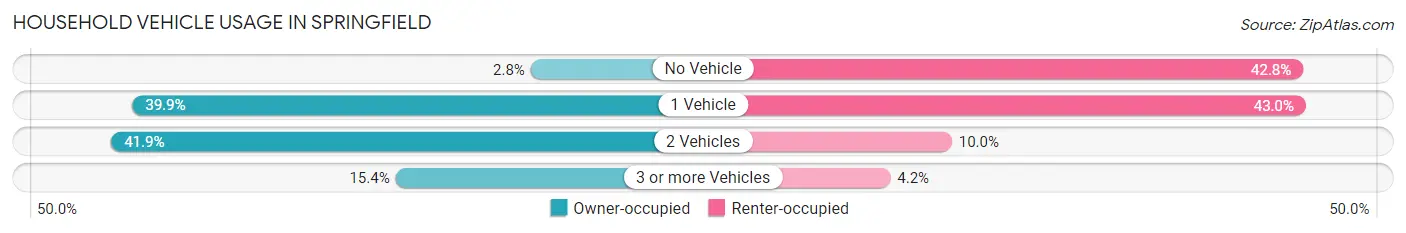
| Vehicles per Household | Owner-occupied | Renter-occupied |
| No Vehicle | 28 (2.8%) | 343 (42.8%) |
| 1 Vehicle | 405 (39.9%) | 345 (43.0%) |
| 2 Vehicles | 425 (41.9%) | 80 (10.0%) |
| 3 or more Vehicles | 156 (15.4%) | 34 (4.2%) |
| Total | 1,014 (100.0%) | 802 (100.0%) |
Real Estate & Mortgages in Springfield
Real Estate and Mortgage Overview in Springfield
| Characteristic | Without Mortgage | With Mortgage |
| Housing Units | 426 | 588 |
| Median Property Value | $129,700 | $145,600 |
| Median Household Income | $56,000 | $79 |
| Monthly Housing Costs | $746 | $20 |
| Real Estate Taxes | $4,207 | $0 |
Property Value by Mortgage Status in Springfield
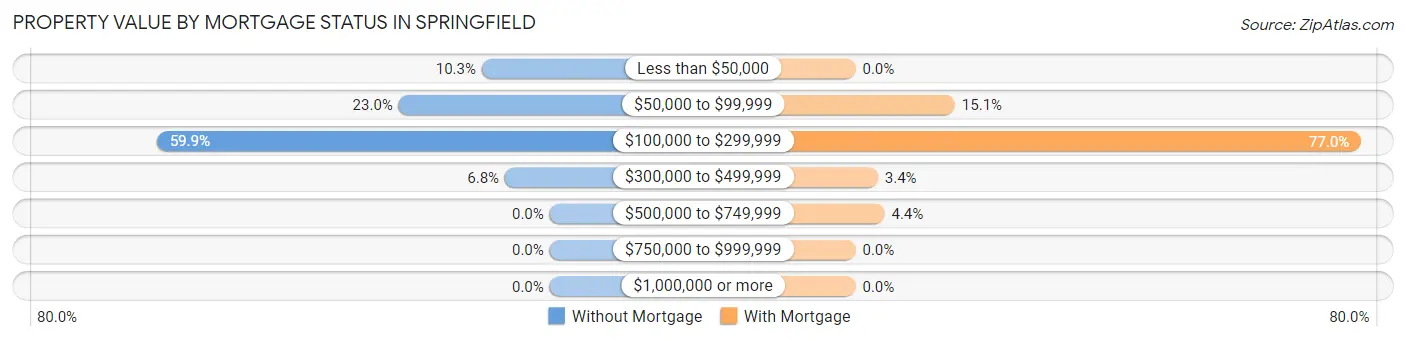
| Property Value | Without Mortgage | With Mortgage |
| Less than $50,000 | 44 (10.3%) | 0 (0.0%) |
| $50,000 to $99,999 | 98 (23.0%) | 89 (15.1%) |
| $100,000 to $299,999 | 255 (59.9%) | 453 (77.0%) |
| $300,000 to $499,999 | 29 (6.8%) | 20 (3.4%) |
| $500,000 to $749,999 | 0 (0.0%) | 26 (4.4%) |
| $750,000 to $999,999 | 0 (0.0%) | 0 (0.0%) |
| $1,000,000 or more | 0 (0.0%) | 0 (0.0%) |
| Total | 426 (100.0%) | 588 (100.0%) |
Household Income by Mortgage Status in Springfield
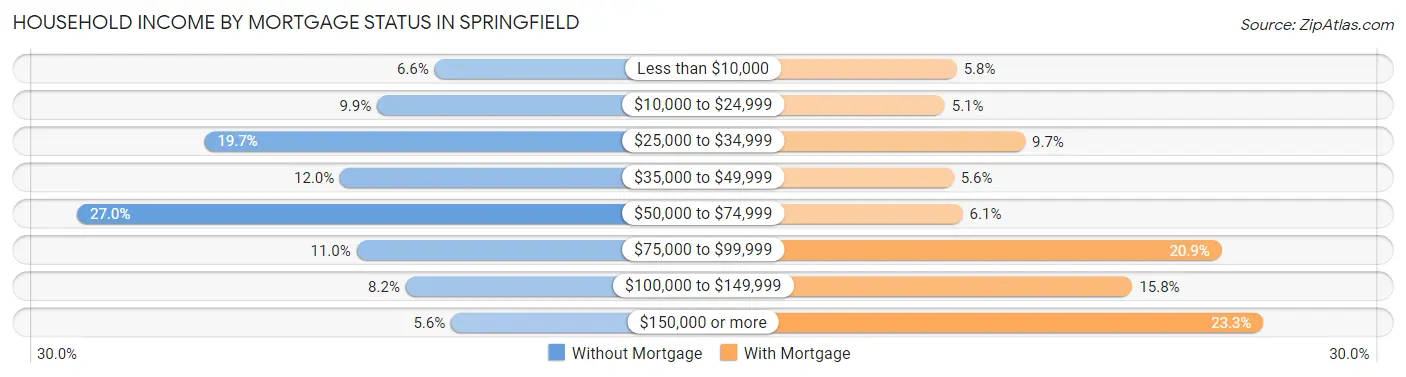
| Household Income | Without Mortgage | With Mortgage |
| Less than $10,000 | 28 (6.6%) | 34 (5.8%) |
| $10,000 to $24,999 | 42 (9.9%) | 30 (5.1%) |
| $25,000 to $34,999 | 84 (19.7%) | 57 (9.7%) |
| $35,000 to $49,999 | 51 (12.0%) | 33 (5.6%) |
| $50,000 to $74,999 | 115 (27.0%) | 36 (6.1%) |
| $75,000 to $99,999 | 47 (11.0%) | 123 (20.9%) |
| $100,000 to $149,999 | 35 (8.2%) | 93 (15.8%) |
| $150,000 or more | 24 (5.6%) | 137 (23.3%) |
| Total | 426 (100.0%) | 588 (100.0%) |
Property Value to Household Income Ratio in Springfield
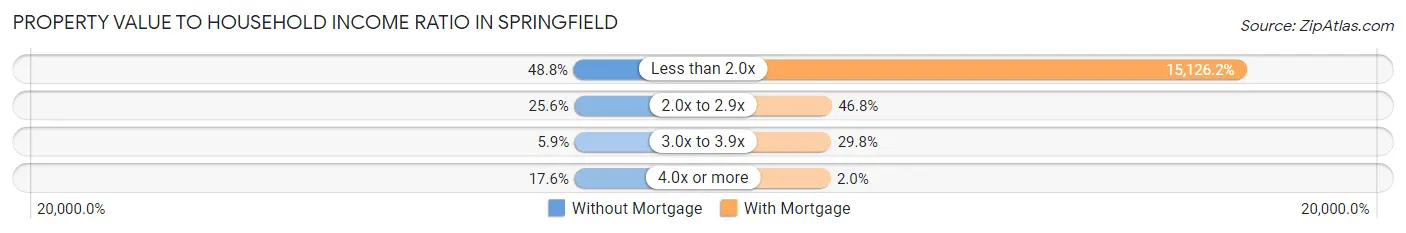
| Value-to-Income Ratio | Without Mortgage | With Mortgage |
| Less than 2.0x | 208 (48.8%) | 88,942 (15,126.2%) |
| 2.0x to 2.9x | 109 (25.6%) | 275 (46.8%) |
| 3.0x to 3.9x | 25 (5.9%) | 175 (29.8%) |
| 4.0x or more | 75 (17.6%) | 12 (2.0%) |
| Total | 426 (100.0%) | 588 (100.0%) |
Real Estate Taxes by Mortgage Status in Springfield
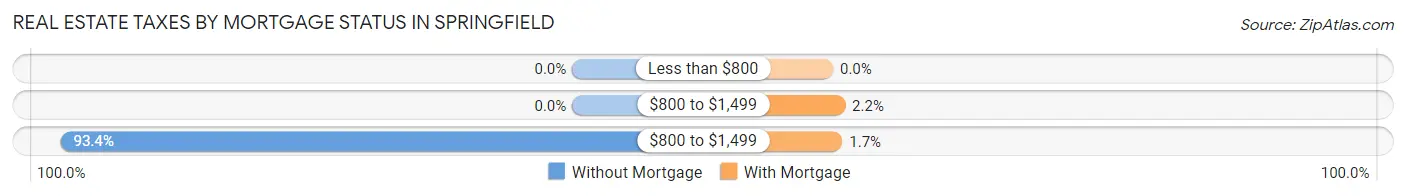
| Property Taxes | Without Mortgage | With Mortgage |
| Less than $800 | 0 (0.0%) | 0 (0.0%) |
| $800 to $1,499 | 0 (0.0%) | 13 (2.2%) |
| $800 to $1,499 | 398 (93.4%) | 10 (1.7%) |
| Total | 426 (100.0%) | 588 (100.0%) |
Health & Disability in Springfield
Health Insurance Coverage by Age in Springfield
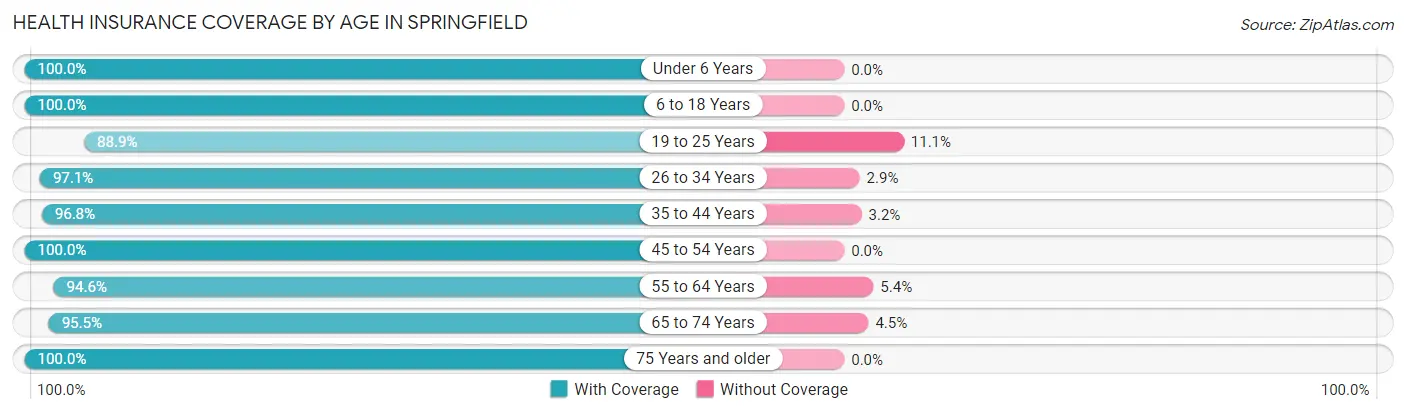
| Age Bracket | With Coverage | Without Coverage |
| Under 6 Years | 291 (100.0%) | 0 (0.0%) |
| 6 to 18 Years | 373 (100.0%) | 0 (0.0%) |
| 19 to 25 Years | 360 (88.9%) | 45 (11.1%) |
| 26 to 34 Years | 440 (97.1%) | 13 (2.9%) |
| 35 to 44 Years | 331 (96.8%) | 11 (3.2%) |
| 45 to 54 Years | 477 (100.0%) | 0 (0.0%) |
| 55 to 64 Years | 697 (94.6%) | 40 (5.4%) |
| 65 to 74 Years | 508 (95.5%) | 24 (4.5%) |
| 75 Years and older | 284 (100.0%) | 0 (0.0%) |
| Total | 3,761 (96.6%) | 133 (3.4%) |
Health Insurance Coverage by Citizenship Status in Springfield
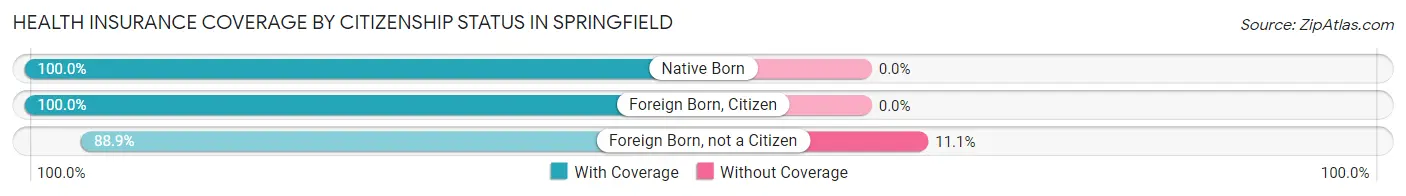
| Citizenship Status | With Coverage | Without Coverage |
| Native Born | 291 (100.0%) | 0 (0.0%) |
| Foreign Born, Citizen | 373 (100.0%) | 0 (0.0%) |
| Foreign Born, not a Citizen | 360 (88.9%) | 45 (11.1%) |
Health Insurance Coverage by Household Income in Springfield
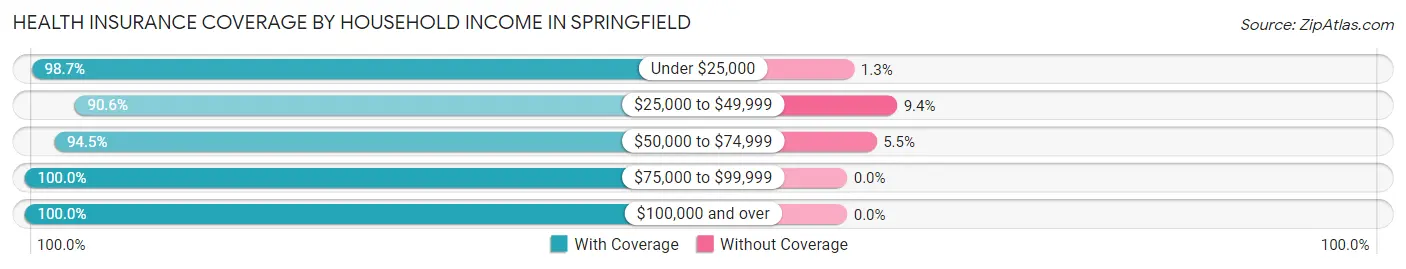
| Household Income | With Coverage | Without Coverage |
| Under $25,000 | 670 (98.7%) | 9 (1.3%) |
| $25,000 to $49,999 | 639 (90.6%) | 66 (9.4%) |
| $50,000 to $74,999 | 994 (94.5%) | 58 (5.5%) |
| $75,000 to $99,999 | 587 (100.0%) | 0 (0.0%) |
| $100,000 and over | 861 (100.0%) | 0 (0.0%) |
Public vs Private Health Insurance Coverage by Age in Springfield
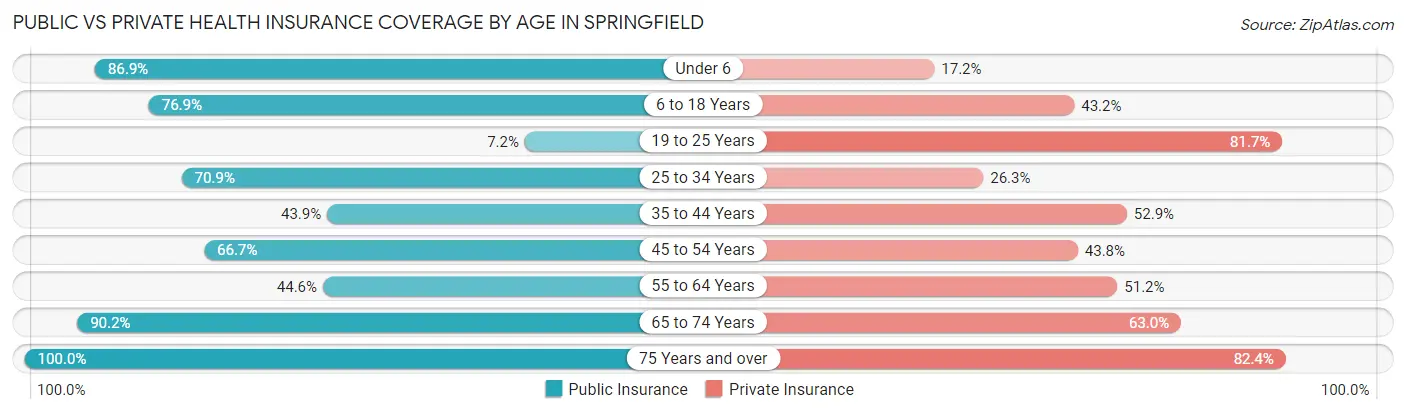
| Age Bracket | Public Insurance | Private Insurance |
| Under 6 | 253 (86.9%) | 50 (17.2%) |
| 6 to 18 Years | 287 (76.9%) | 161 (43.2%) |
| 19 to 25 Years | 29 (7.2%) | 331 (81.7%) |
| 25 to 34 Years | 321 (70.9%) | 119 (26.3%) |
| 35 to 44 Years | 150 (43.9%) | 181 (52.9%) |
| 45 to 54 Years | 318 (66.7%) | 209 (43.8%) |
| 55 to 64 Years | 329 (44.6%) | 377 (51.1%) |
| 65 to 74 Years | 480 (90.2%) | 335 (63.0%) |
| 75 Years and over | 284 (100.0%) | 234 (82.4%) |
| Total | 2,451 (62.9%) | 1,997 (51.3%) |
Disability Status by Sex by Age in Springfield
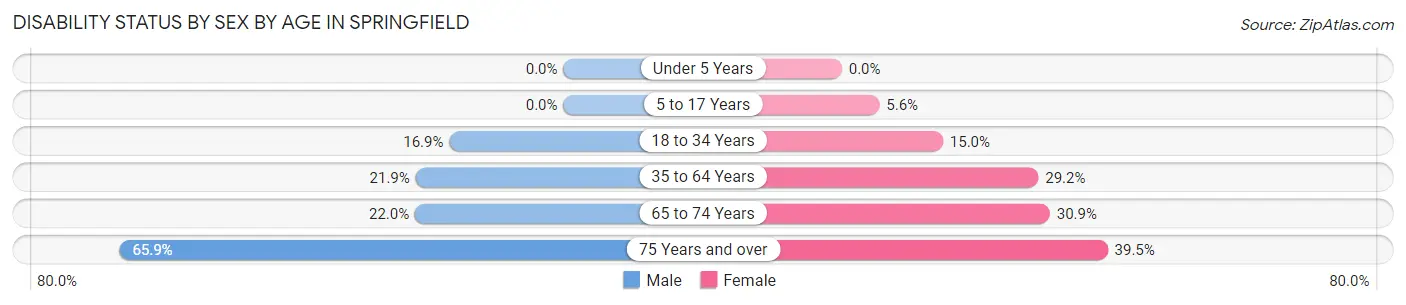
| Age Bracket | Male | Female |
| Under 5 Years | 0 (0.0%) | 0 (0.0%) |
| 5 to 17 Years | 0 (0.0%) | 15 (5.6%) |
| 18 to 34 Years | 61 (16.9%) | 77 (15.0%) |
| 35 to 64 Years | 167 (21.9%) | 232 (29.2%) |
| 65 to 74 Years | 48 (22.0%) | 97 (30.9%) |
| 75 Years and over | 87 (65.9%) | 60 (39.5%) |
Disability Class by Sex by Age in Springfield
Disability Class: Hearing Difficulty
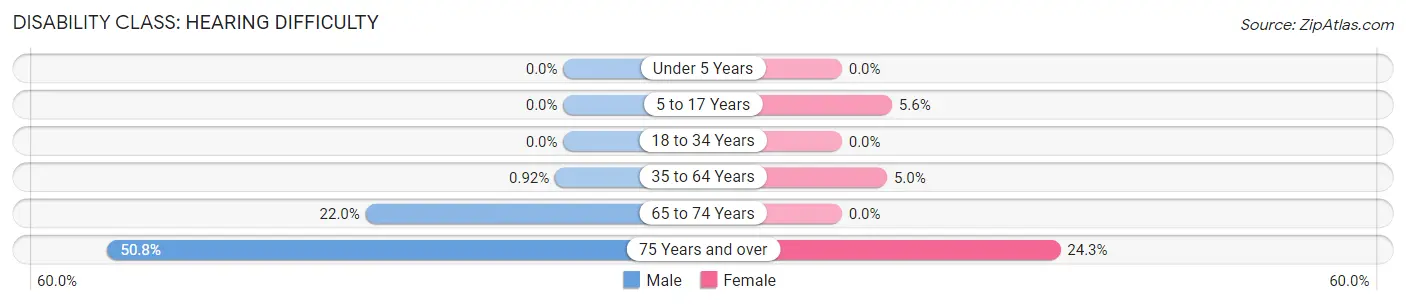
| Age Bracket | Male | Female |
| Under 5 Years | 0 (0.0%) | 0 (0.0%) |
| 5 to 17 Years | 0 (0.0%) | 15 (5.6%) |
| 18 to 34 Years | 0 (0.0%) | 0 (0.0%) |
| 35 to 64 Years | 7 (0.9%) | 40 (5.0%) |
| 65 to 74 Years | 48 (22.0%) | 0 (0.0%) |
| 75 Years and over | 67 (50.8%) | 37 (24.3%) |
Disability Class: Vision Difficulty
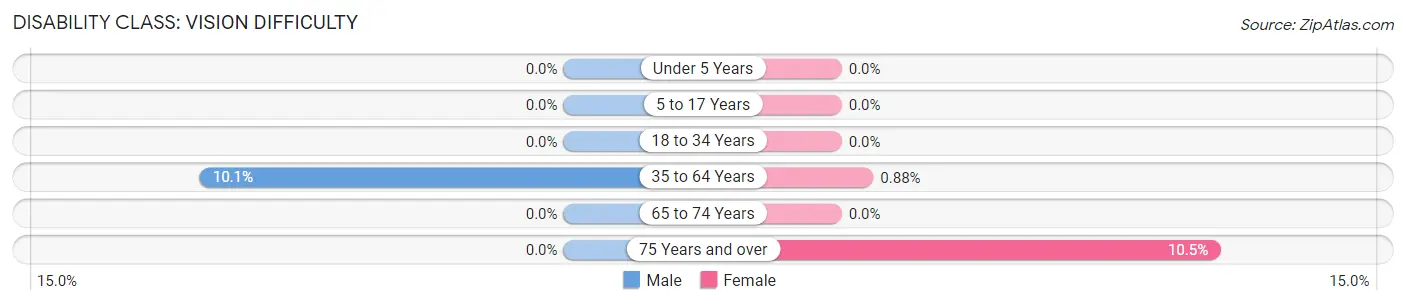
| Age Bracket | Male | Female |
| Under 5 Years | 0 (0.0%) | 0 (0.0%) |
| 5 to 17 Years | 0 (0.0%) | 0 (0.0%) |
| 18 to 34 Years | 0 (0.0%) | 0 (0.0%) |
| 35 to 64 Years | 77 (10.1%) | 7 (0.9%) |
| 65 to 74 Years | 0 (0.0%) | 0 (0.0%) |
| 75 Years and over | 0 (0.0%) | 16 (10.5%) |
Disability Class: Cognitive Difficulty
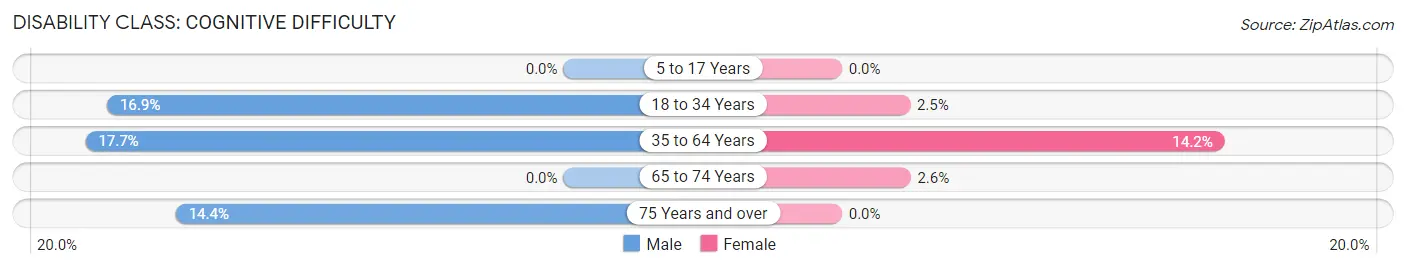
| Age Bracket | Male | Female |
| 5 to 17 Years | 0 (0.0%) | 0 (0.0%) |
| 18 to 34 Years | 61 (16.9%) | 13 (2.5%) |
| 35 to 64 Years | 135 (17.7%) | 113 (14.2%) |
| 65 to 74 Years | 0 (0.0%) | 8 (2.5%) |
| 75 Years and over | 19 (14.4%) | 0 (0.0%) |
Disability Class: Ambulatory Difficulty
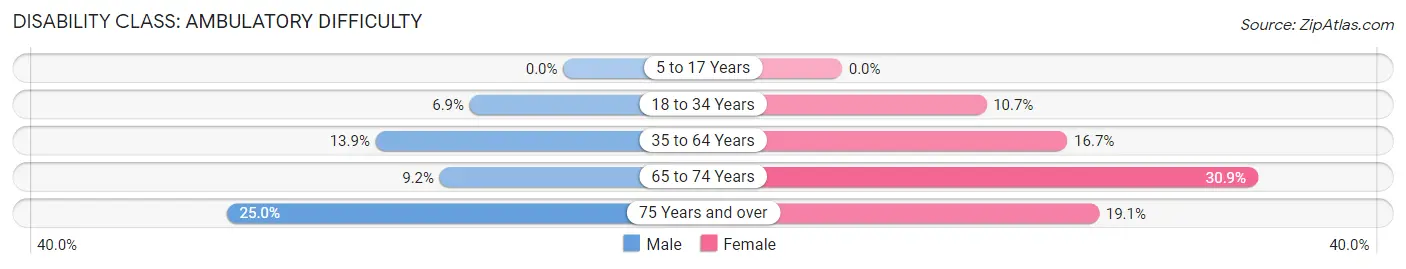
| Age Bracket | Male | Female |
| 5 to 17 Years | 0 (0.0%) | 0 (0.0%) |
| 18 to 34 Years | 25 (6.9%) | 55 (10.7%) |
| 35 to 64 Years | 106 (13.9%) | 133 (16.7%) |
| 65 to 74 Years | 20 (9.2%) | 97 (30.9%) |
| 75 Years and over | 33 (25.0%) | 29 (19.1%) |
Disability Class: Self-Care Difficulty
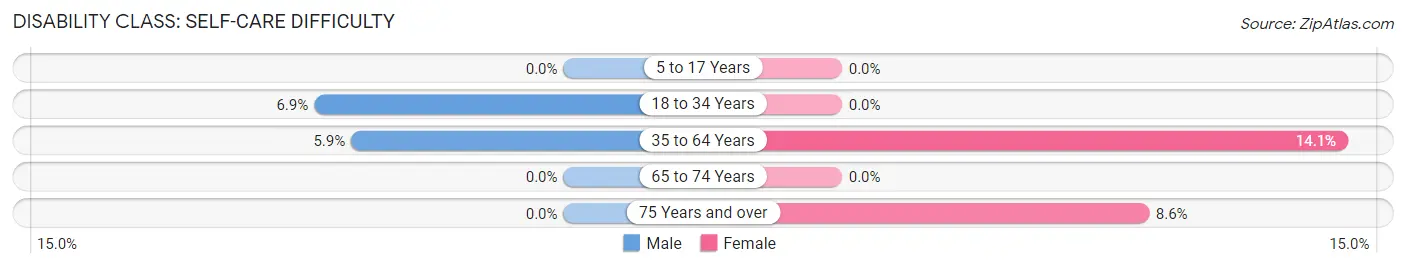
| Age Bracket | Male | Female |
| 5 to 17 Years | 0 (0.0%) | 0 (0.0%) |
| 18 to 34 Years | 25 (6.9%) | 0 (0.0%) |
| 35 to 64 Years | 45 (5.9%) | 112 (14.1%) |
| 65 to 74 Years | 0 (0.0%) | 0 (0.0%) |
| 75 Years and over | 0 (0.0%) | 13 (8.6%) |
Technology Access in Springfield
Computing Device Access in Springfield
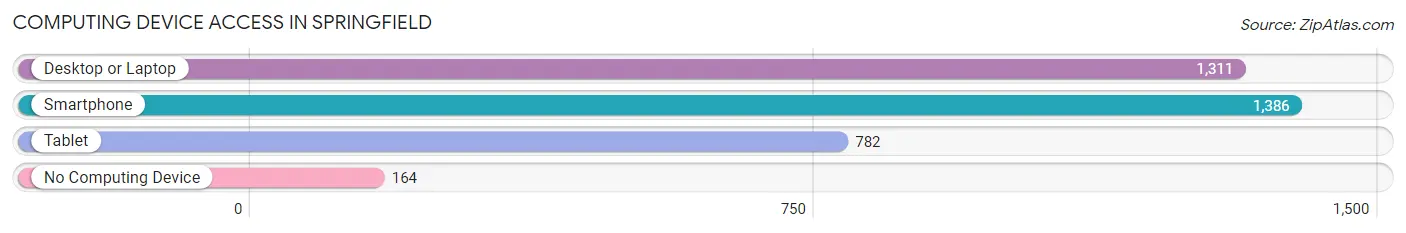
| Device Type | # Households | % Households |
| Desktop or Laptop | 1,311 | 72.2% |
| Smartphone | 1,386 | 76.3% |
| Tablet | 782 | 43.1% |
| No Computing Device | 164 | 9.0% |
| Total | 1,816 | 100.0% |
Internet Access in Springfield
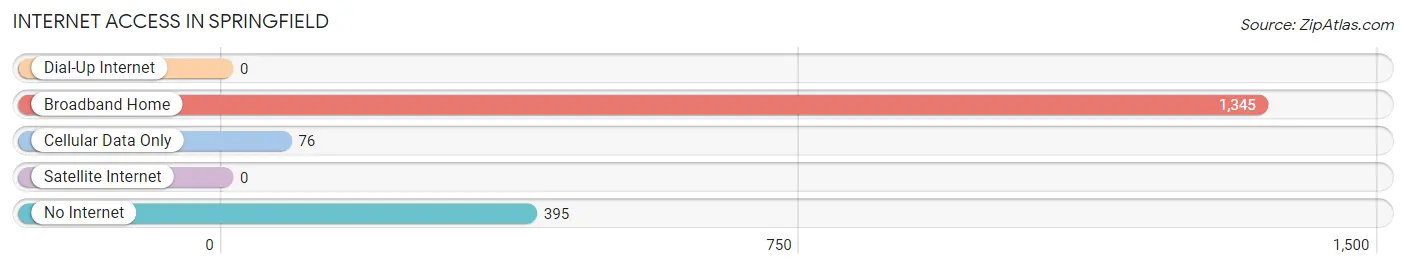
| Internet Type | # Households | % Households |
| Dial-Up Internet | 0 | 0.0% |
| Broadband Home | 1,345 | 74.1% |
| Cellular Data Only | 76 | 4.2% |
| Satellite Internet | 0 | 0.0% |
| No Internet | 395 | 21.7% |
| Total | 1,816 | 100.0% |
Springfield Summary
Springfield, Vermont is a small town located in the southeastern corner of the state, in Windsor County. It is situated on the banks of the Black River, and is bordered by the towns of Weathersfield, Cavendish, and Hartland. The town has a population of approximately 9,000 people, and is the largest town in Windsor County.
History
The area that is now Springfield was first settled in 1761 by a group of settlers from Connecticut. The town was originally known as New Connecticut, and was later renamed Springfield in 1786. The town was named after Springfield, Massachusetts, which was the hometown of many of the settlers.
The town was an important center of industry in the 19th century, with several mills and factories located in the area. The town was also home to the first railroad in Vermont, which was built in 1848.
Geography
Springfield is located in the southeastern corner of Vermont, in Windsor County. It is situated on the banks of the Black River, and is bordered by the towns of Weathersfield, Cavendish, and Hartland. The town has a total area of 24.2 square miles, of which 23.9 square miles is land and 0.3 square miles is water.
The town is located in the Connecticut River Valley, and is surrounded by rolling hills and mountains. The highest point in the town is Mount Ascutney, which has an elevation of 3,144 feet.
Economy
The economy of Springfield is largely based on tourism and manufacturing. The town is home to several tourist attractions, including the Vermont State Fairgrounds, the Springfield Museum, and the Black River Railroad.
The town is also home to several manufacturing companies, including the Springfield Manufacturing Company, which produces paper products, and the Springfield Tool and Die Company, which produces metal products.
Demographics
As of the 2010 census, the population of Springfield was 8,945. The racial makeup of the town was 94.3% White, 1.2% African American, 0.3% Native American, 0.7% Asian, 0.1% Pacific Islander, 1.2% from other races, and 2.3% from two or more races. Hispanic or Latino of any race were 3.2% of the population.
The median household income in Springfield was $45,945, and the median family income was $54,945. The per capita income for the town was $22,945. About 8.3% of families and 10.7% of the population were below the poverty line, including 14.2% of those under age 18 and 6.2% of those age 65 or over.
Common Questions
What is the Total Population of Springfield?
Total Population of Springfield is 3,946.
What is the Total Male Population of Springfield?
Total Male Population of Springfield is 1,755.
What is the Total Female Population of Springfield?
Total Female Population of Springfield is 2,191.
What is the Ratio of Males per 100 Females in Springfield?
There are 80.10 Males per 100 Females in Springfield.
What is the Ratio of Females per 100 Males in Springfield?
There are 124.84 Females per 100 Males in Springfield.
What is the Median Population Age in Springfield?
Median Population Age in Springfield is 49.7 Years.
What is the Average Family Size in Springfield
Average Family Size in Springfield is 3.3 People.
What is the Average Household Size in Springfield
Average Household Size in Springfield is 2.1 People.
What is Per Capita Income in Springfield?
Per Capita income in Springfield is $27,572.
What is the Median Family Income in Springfield?
Median Family Income in Springfield is $70,341.
What is the Median Household income in Springfield?
Median Household Income in Springfield is $48,476.
What is Income or Wage Gap in Springfield?
Income or Wage Gap in Springfield is 32.5%.
Women in Springfield earn 67.5 cents for every dollar earned by a man.
What is Inequality or Gini Index in Springfield?
Inequality or Gini Index in Springfield is 0.46.
How Large is the Labor Force in Springfield?
There are 1,625 People in the Labor Forcein in Springfield.
What is the Percentage of People in the Labor Force in Springfield?
48.6% of People are in the Labor Force in Springfield.
What is the Unemployment Rate in Springfield?
Unemployment Rate in Springfield is 4.2%.