East Barre, VT
East Barre Map
East Barre Overview
1,136
TOTAL POPULATION
605
MALE POPULATION
531
FEMALE POPULATION
113.94
MALES / 100 FEMALES
87.77
FEMALES / 100 MALES
36.2
MEDIAN AGE
3.4
AVG FAMILY SIZE
3.1
AVG HOUSEHOLD SIZE
$27,875
PER CAPITA INCOME
$84,417
AVG FAMILY INCOME
0.30
INEQUALITY / GINI INDEX
526
LABOR FORCE [ PEOPLE ]
70.6%
PERCENT IN LABOR FORCE
11.2%
UNEMPLOYMENT RATE
East Barre Zip Codes
East Barre Area Codes
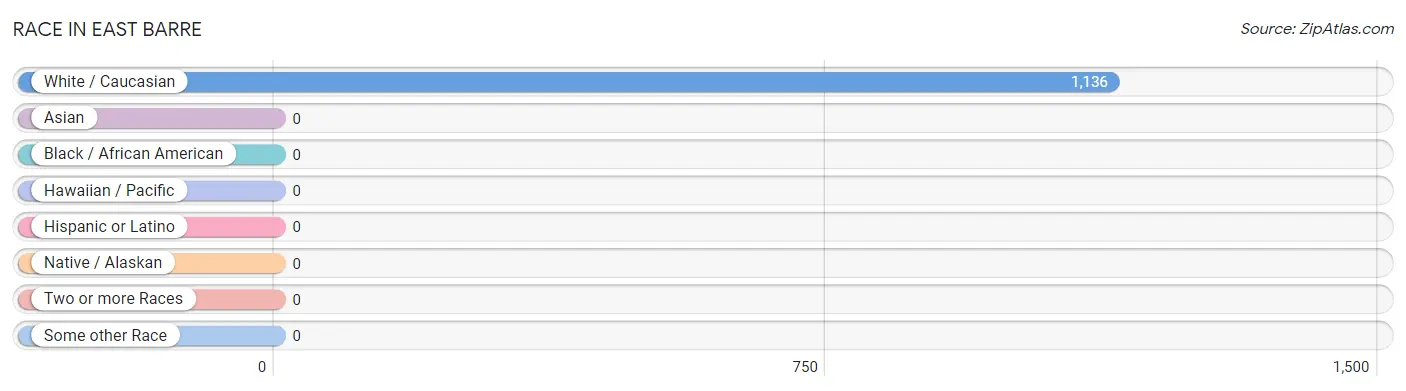
Race in East Barre
The most populous races in East Barre are , and White / Caucasian (1,136 | 100.0%).
| Race | # Population | % Population |
| Asian | 0 | 0.0% |
| Black / African American | 0 | 0.0% |
| Hawaiian / Pacific | 0 | 0.0% |
| Hispanic or Latino | 0 | 0.0% |
| Native / Alaskan | 0 | 0.0% |
| White / Caucasian | 1,136 | 100.0% |
| Two or more Races | 0 | 0.0% |
| Some other Race | 0 | 0.0% |
| Total | 1,136 | 100.0% |
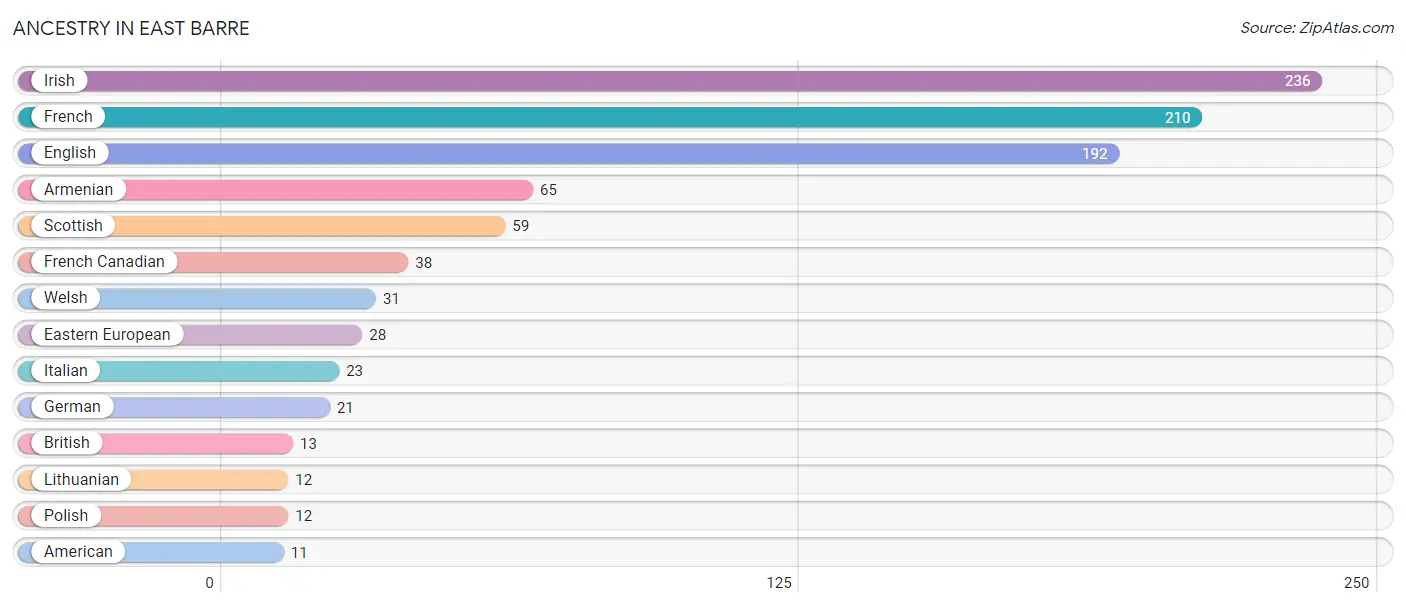
Ancestry in East Barre
The most populous ancestries reported in East Barre are Irish (236 | 20.8%), French (210 | 18.5%), English (192 | 16.9%), Armenian (65 | 5.7%), and Scottish (59 | 5.2%), together accounting for 67.1% of all East Barre residents.
| Ancestry | # Population | % Population |
| American | 11 | 1.0% |
| Armenian | 65 | 5.7% |
| British | 13 | 1.1% |
| Eastern European | 28 | 2.5% |
| English | 192 | 16.9% |
| French | 210 | 18.5% |
| French Canadian | 38 | 3.4% |
| German | 21 | 1.8% |
| Irish | 236 | 20.8% |
| Italian | 23 | 2.0% |
| Lithuanian | 12 | 1.1% |
| Polish | 12 | 1.1% |
| Scottish | 59 | 5.2% |
| Welsh | 31 | 2.7% | View All 14 Rows |
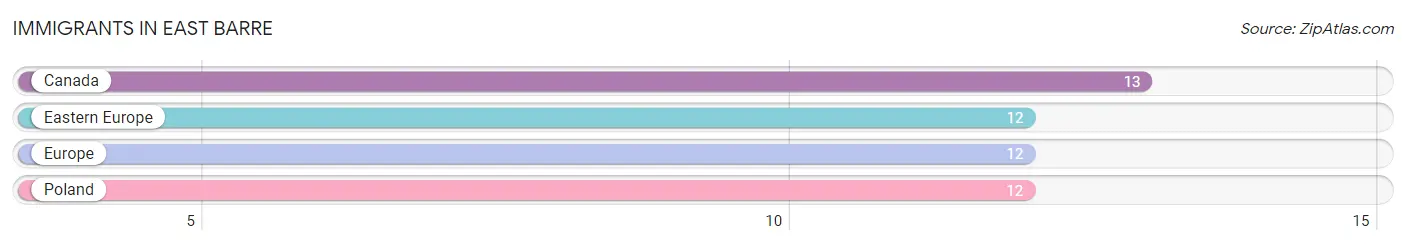
Immigrants in East Barre
The most numerous immigrant groups reported in East Barre came from Canada (13 | 1.1%), Eastern Europe (12 | 1.1%), Europe (12 | 1.1%), and Poland (12 | 1.1%), together accounting for 4.3% of all East Barre residents.
| Immigration Origin | # Population | % Population |
| Canada | 13 | 1.1% |
| Eastern Europe | 12 | 1.1% |
| Europe | 12 | 1.1% |
| Poland | 12 | 1.1% | View All 4 Rows |
Sex and Age in East Barre
Sex and Age in East Barre
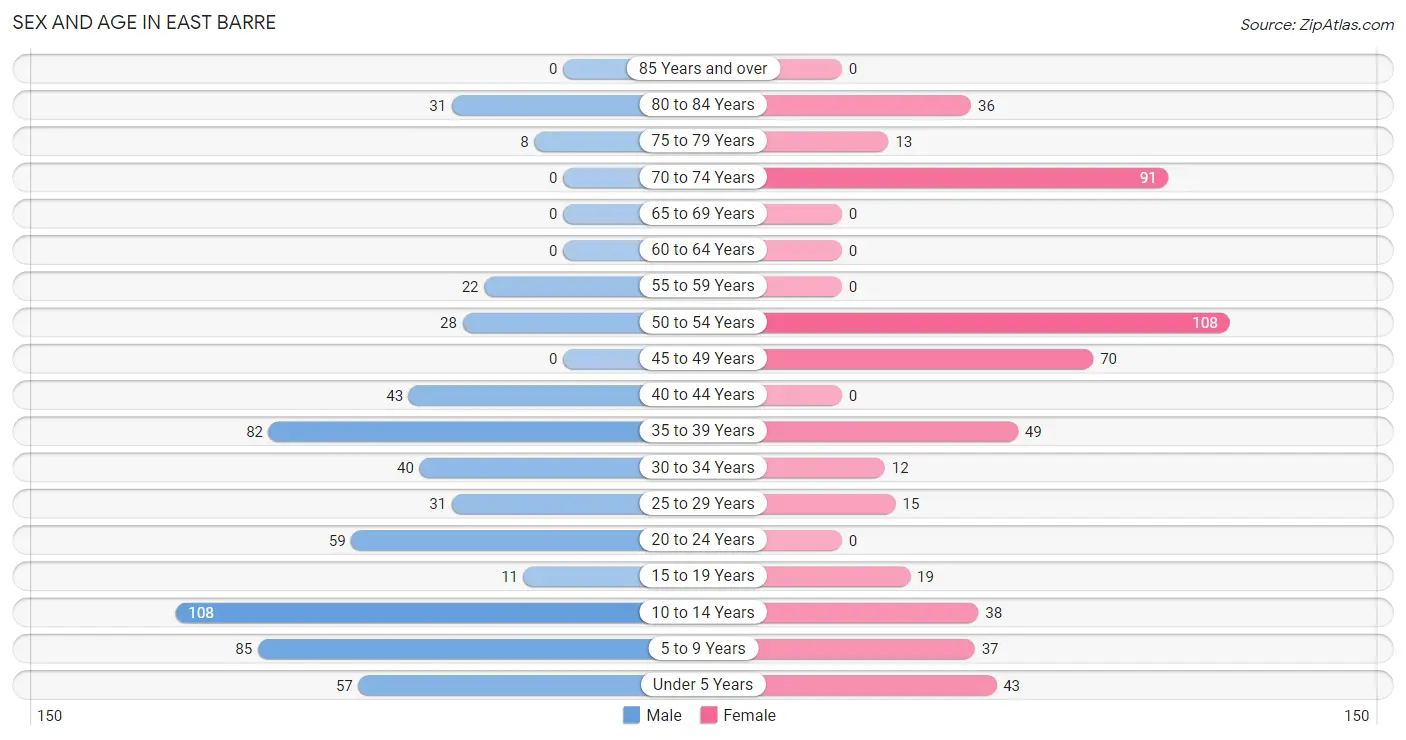
The most populous age groups in East Barre are 10 to 14 Years (108 | 17.8%) for men and 50 to 54 Years (108 | 20.3%) for women.
| Age Bracket | Male | Female |
| Under 5 Years | 57 (9.4%) | 43 (8.1%) |
| 5 to 9 Years | 85 (14.1%) | 37 (7.0%) |
| 10 to 14 Years | 108 (17.8%) | 38 (7.2%) |
| 15 to 19 Years | 11 (1.8%) | 19 (3.6%) |
| 20 to 24 Years | 59 (9.8%) | 0 (0.0%) |
| 25 to 29 Years | 31 (5.1%) | 15 (2.8%) |
| 30 to 34 Years | 40 (6.6%) | 12 (2.3%) |
| 35 to 39 Years | 82 (13.6%) | 49 (9.2%) |
| 40 to 44 Years | 43 (7.1%) | 0 (0.0%) |
| 45 to 49 Years | 0 (0.0%) | 70 (13.2%) |
| 50 to 54 Years | 28 (4.6%) | 108 (20.3%) |
| 55 to 59 Years | 22 (3.6%) | 0 (0.0%) |
| 60 to 64 Years | 0 (0.0%) | 0 (0.0%) |
| 65 to 69 Years | 0 (0.0%) | 0 (0.0%) |
| 70 to 74 Years | 0 (0.0%) | 91 (17.1%) |
| 75 to 79 Years | 8 (1.3%) | 13 (2.5%) |
| 80 to 84 Years | 31 (5.1%) | 36 (6.8%) |
| 85 Years and over | 0 (0.0%) | 0 (0.0%) |
| Total | 605 (100.0%) | 531 (100.0%) |
Families and Households in East Barre
Median Family Size in East Barre
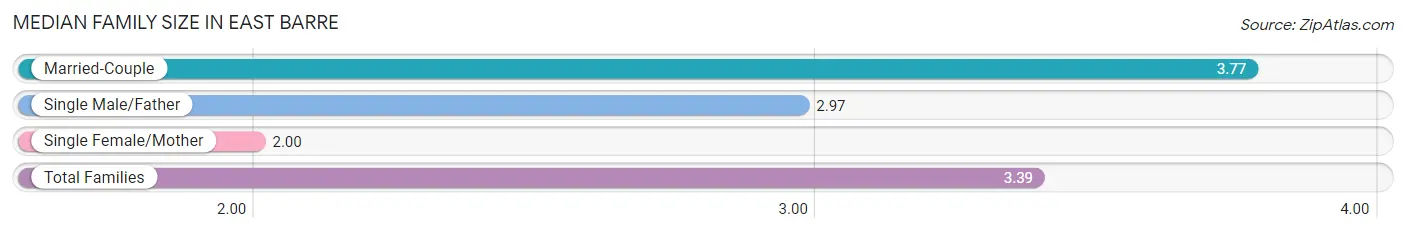
The median family size in East Barre is 3.39 persons per family, with married-couple families (168 | 64.9%) accounting for the largest median family size of 3.77 persons per family. On the other hand, single female/mother families (27 | 10.4%) represent the smallest median family size with 2.00 persons per family.
| Family Type | # Families | Family Size |
| Married-Couple | 168 (64.9%) | 3.77 |
| Single Male/Father | 64 (24.7%) | 2.97 |
| Single Female/Mother | 27 (10.4%) | 2.00 |
| Total Families | 259 (100.0%) | 3.39 |
Median Household Size in East Barre
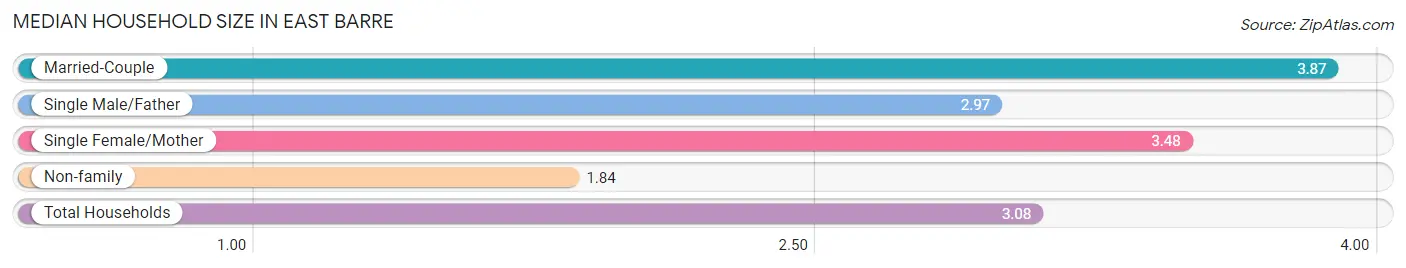
The median household size in East Barre is 3.08 persons per household, with married-couple households (168 | 45.5%) accounting for the largest median household size of 3.87 persons per household. non-family households (110 | 29.8%) represent the smallest median household size with 1.84 persons per household.
| Household Type | # Households | Household Size |
| Married-Couple | 168 (45.5%) | 3.87 |
| Single Male/Father | 64 (17.3%) | 2.97 |
| Single Female/Mother | 27 (7.3%) | 3.48 |
| Non-family | 110 (29.8%) | 1.84 |
| Total Households | 369 (100.0%) | 3.08 |
Household Size by Marriage Status in East Barre
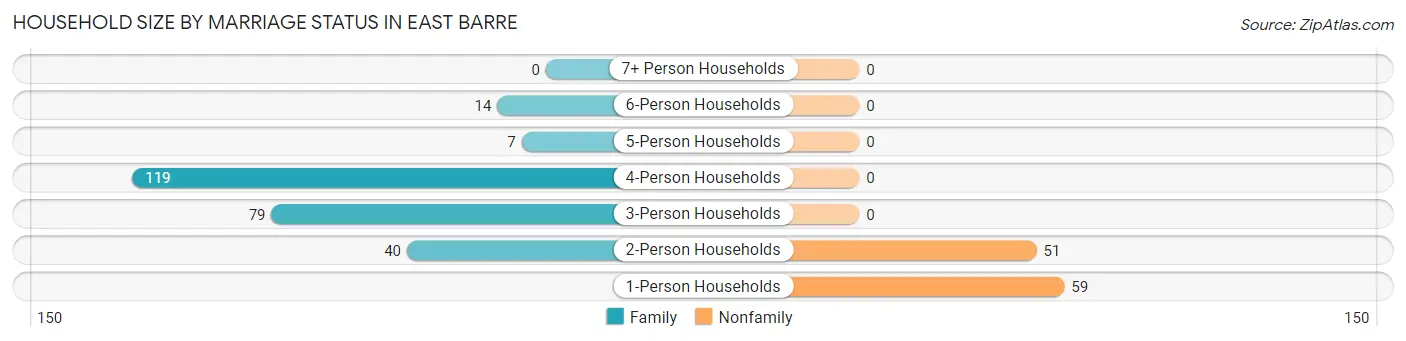
Out of a total of 369 households in East Barre, 259 (70.2%) are family households, while 110 (29.8%) are nonfamily households. The most numerous type of family households are 4-person households, comprising 119, and the most common type of nonfamily households are 1-person households, comprising 59.
| Household Size | Family Households | Nonfamily Households |
| 1-Person Households | - | 59 (16.0%) |
| 2-Person Households | 40 (10.8%) | 51 (13.8%) |
| 3-Person Households | 79 (21.4%) | 0 (0.0%) |
| 4-Person Households | 119 (32.3%) | 0 (0.0%) |
| 5-Person Households | 7 (1.9%) | 0 (0.0%) |
| 6-Person Households | 14 (3.8%) | 0 (0.0%) |
| 7+ Person Households | 0 (0.0%) | 0 (0.0%) |
| Total | 259 (70.2%) | 110 (29.8%) |
Female Fertility in East Barre
Fertility by Age in East Barre
Average fertility rate in East Barre is 182.0 births per 1,000 women. Women in the age bracket of 35 to 50 years have the highest fertility rate with 244.0 births per 1,000 women. Women in the age bracket of 35 to 50 years acount for 100.0% of all women with births.
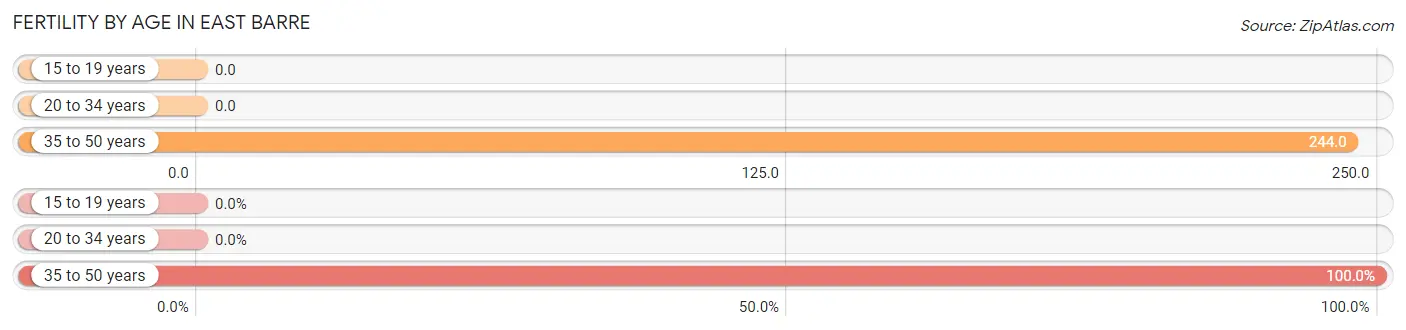
| Age Bracket | Women with Births | Births / 1,000 Women |
| 15 to 19 years | 0 (0.0%) | 0.0 |
| 20 to 34 years | 0 (0.0%) | 0.0 |
| 35 to 50 years | 33 (100.0%) | 244.0 |
| Total | 33 (100.0%) | 182.0 |
Fertility by Age by Marriage Status in East Barre
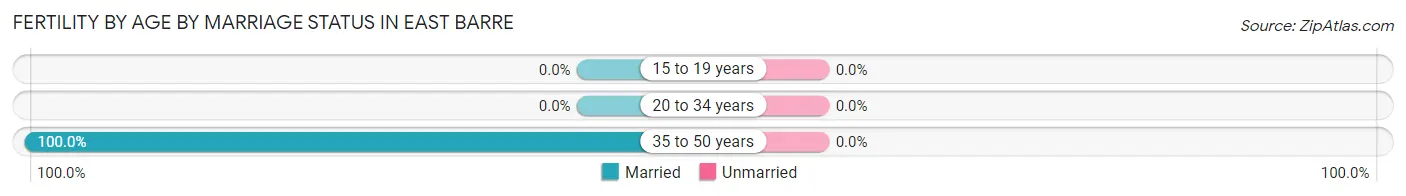
| Age Bracket | Married | Unmarried |
| 15 to 19 years | 0 (0.0%) | 0 (0.0%) |
| 20 to 34 years | 0 (0.0%) | 0 (0.0%) |
| 35 to 50 years | 33 (100.0%) | 0 (0.0%) |
| Total | 33 (100.0%) | 0 (0.0%) |
Fertility by Education in East Barre
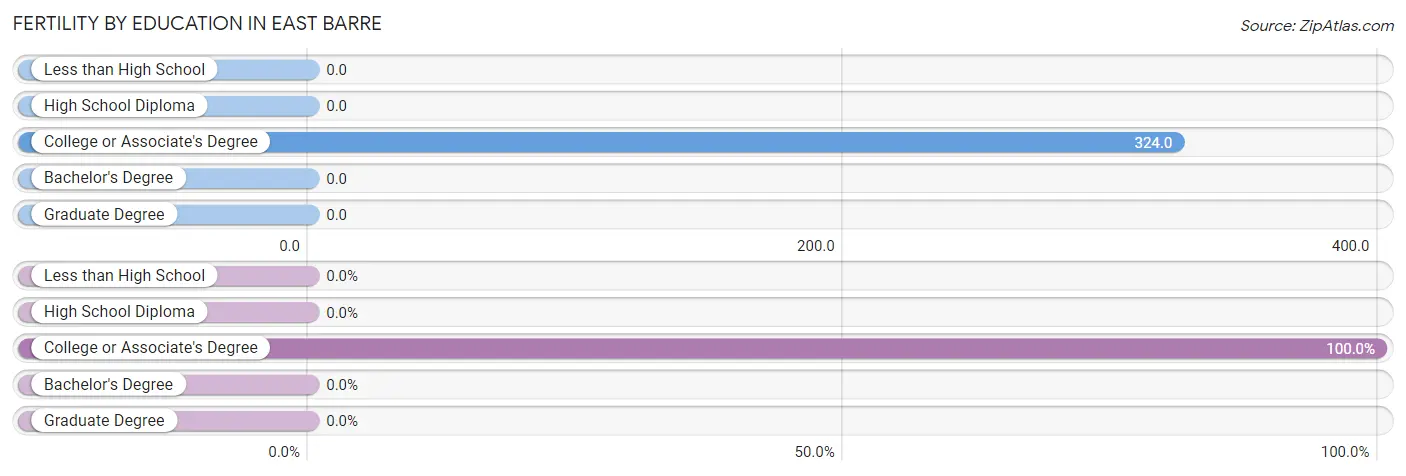
| Educational Attainment | Women with Births | Births / 1,000 Women |
| Less than High School | 0 (0.0%) | 0.0 |
| High School Diploma | 0 (0.0%) | 0.0 |
| College or Associate's Degree | 33 (100.0%) | 324.0 |
| Bachelor's Degree | 0 (0.0%) | 0.0 |
| Graduate Degree | 0 (0.0%) | 0.0 |
| Total | 33 (100.0%) | 182.0 |
Fertility by Education by Marriage Status in East Barre
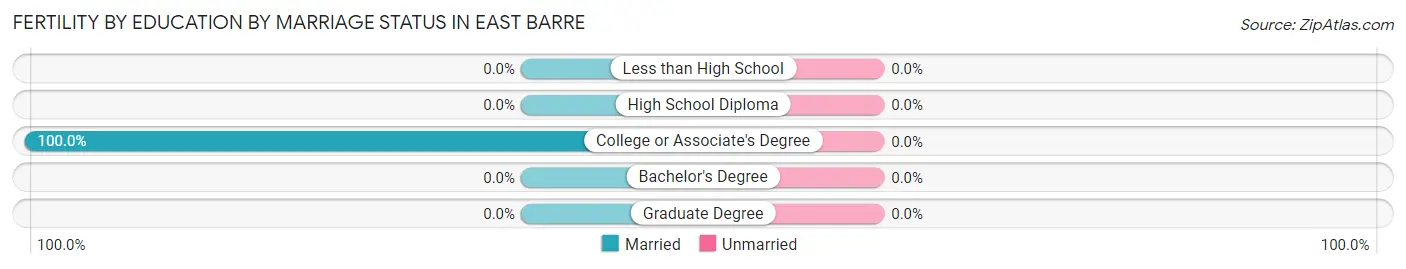
| Educational Attainment | Married | Unmarried |
| Less than High School | 0 (0.0%) | 0 (0.0%) |
| High School Diploma | 0 (0.0%) | 0 (0.0%) |
| College or Associate's Degree | 33 (100.0%) | 0 (0.0%) |
| Bachelor's Degree | 0 (0.0%) | 0 (0.0%) |
| Graduate Degree | 0 (0.0%) | 0 (0.0%) |
| Total | 33 (100.0%) | 0 (0.0%) |
Income in East Barre
Income Overview in East Barre
| Characteristic | Number | Measure |
| Per Capita Income | 1,136 | $27,875 |
| Median Family Income | 259 | $84,417 |
| Mean Family Income | 259 | $92,133 |
| Median Household Income | 369 | $0 |
| Mean Household Income | 369 | $85,461 |
| Income Deficit | 259 | $0 |
| Wage / Income Gap (%) | 1,136 | 0.00% |
| Wage / Income Gap ($) | 1,136 | 100.00¢ per $1 |
| Gini / Inequality Index | 1,136 | 0.30 |
Earnings by Sex in East Barre
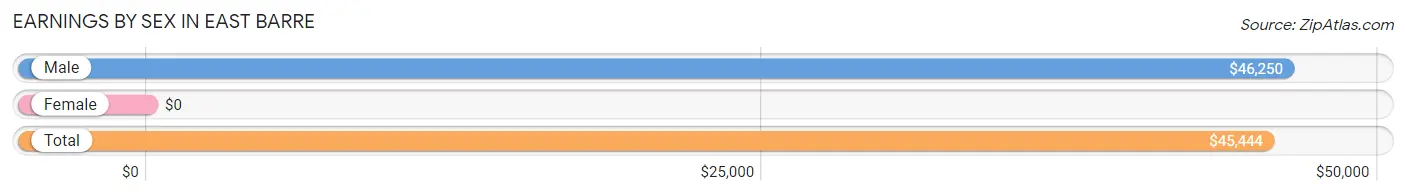
| Sex | Number | Average Earnings |
| Male | 244 (48.9%) | $46,250 |
| Female | 255 (51.1%) | $0 |
| Total | 499 (100.0%) | $45,444 |
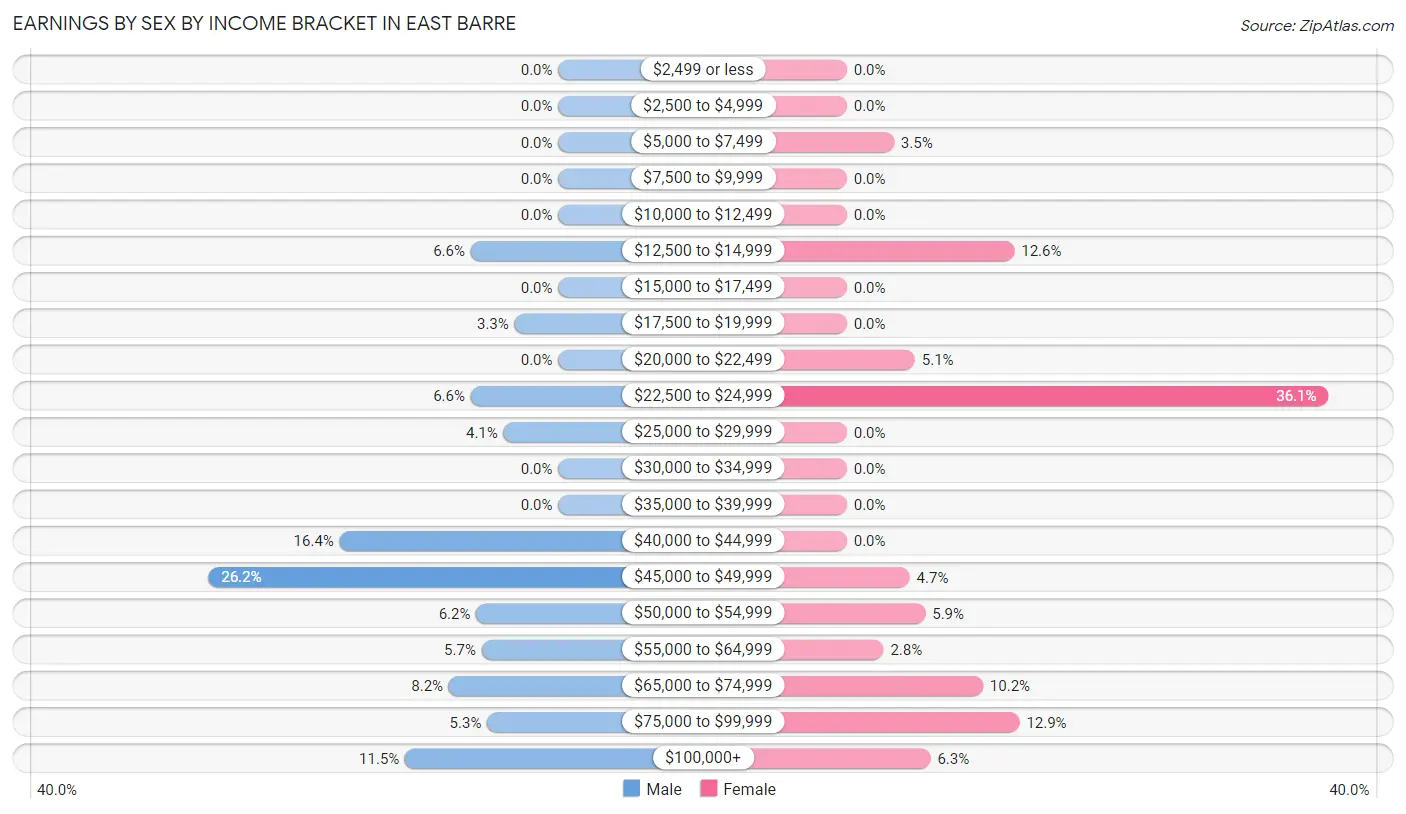
Earnings by Sex by Income Bracket in East Barre
The most common earnings brackets in East Barre are $45,000 to $49,999 for men (64 | 26.2%) and $22,500 to $24,999 for women (92 | 36.1%).
| Income | Male | Female |
| $2,499 or less | 0 (0.0%) | 0 (0.0%) |
| $2,500 to $4,999 | 0 (0.0%) | 0 (0.0%) |
| $5,000 to $7,499 | 0 (0.0%) | 9 (3.5%) |
| $7,500 to $9,999 | 0 (0.0%) | 0 (0.0%) |
| $10,000 to $12,499 | 0 (0.0%) | 0 (0.0%) |
| $12,500 to $14,999 | 16 (6.6%) | 32 (12.6%) |
| $15,000 to $17,499 | 0 (0.0%) | 0 (0.0%) |
| $17,500 to $19,999 | 8 (3.3%) | 0 (0.0%) |
| $20,000 to $22,499 | 0 (0.0%) | 13 (5.1%) |
| $22,500 to $24,999 | 16 (6.6%) | 92 (36.1%) |
| $25,000 to $29,999 | 10 (4.1%) | 0 (0.0%) |
| $30,000 to $34,999 | 0 (0.0%) | 0 (0.0%) |
| $35,000 to $39,999 | 0 (0.0%) | 0 (0.0%) |
| $40,000 to $44,999 | 40 (16.4%) | 0 (0.0%) |
| $45,000 to $49,999 | 64 (26.2%) | 12 (4.7%) |
| $50,000 to $54,999 | 15 (6.1%) | 15 (5.9%) |
| $55,000 to $64,999 | 14 (5.7%) | 7 (2.8%) |
| $65,000 to $74,999 | 20 (8.2%) | 26 (10.2%) |
| $75,000 to $99,999 | 13 (5.3%) | 33 (12.9%) |
| $100,000+ | 28 (11.5%) | 16 (6.3%) |
| Total | 244 (100.0%) | 255 (100.0%) |
Earnings by Sex by Educational Attainment in East Barre
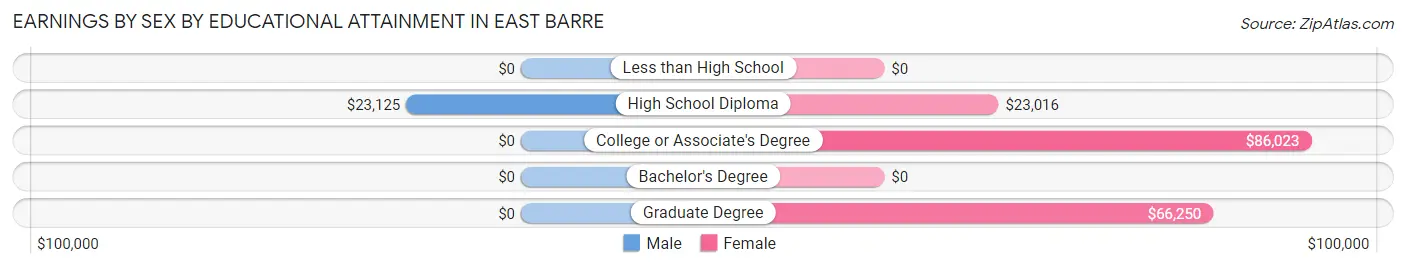
| Educational Attainment | Male Income | Female Income |
| Less than High School | - | - |
| High School Diploma | $23,125 | $23,016 |
| College or Associate's Degree | - | - |
| Bachelor's Degree | - | - |
| Graduate Degree | - | - |
| Total | $46,250 | $0 |
Family Income in East Barre
Family Income Brackets in East Barre
According to the East Barre family income data, there are 102 families falling into the $100,000 to $149,999 income range, which is the most common income bracket and makes up 39.4% of all families.
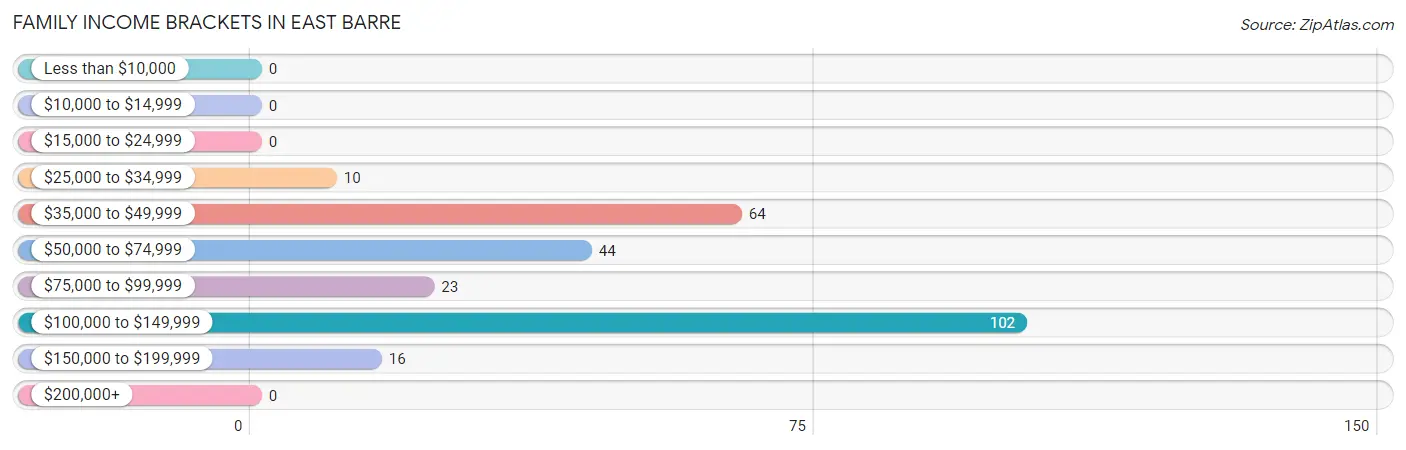
| Income Bracket | # Families | % Families |
| Less than $10,000 | 0 | 0.0% |
| $10,000 to $14,999 | 0 | 0.0% |
| $15,000 to $24,999 | 0 | 0.0% |
| $25,000 to $34,999 | 10 | 3.9% |
| $35,000 to $49,999 | 64 | 24.7% |
| $50,000 to $74,999 | 44 | 17.0% |
| $75,000 to $99,999 | 23 | 8.9% |
| $100,000 to $149,999 | 102 | 39.4% |
| $150,000 to $199,999 | 16 | 6.2% |
| $200,000+ | 0 | 0.0% |
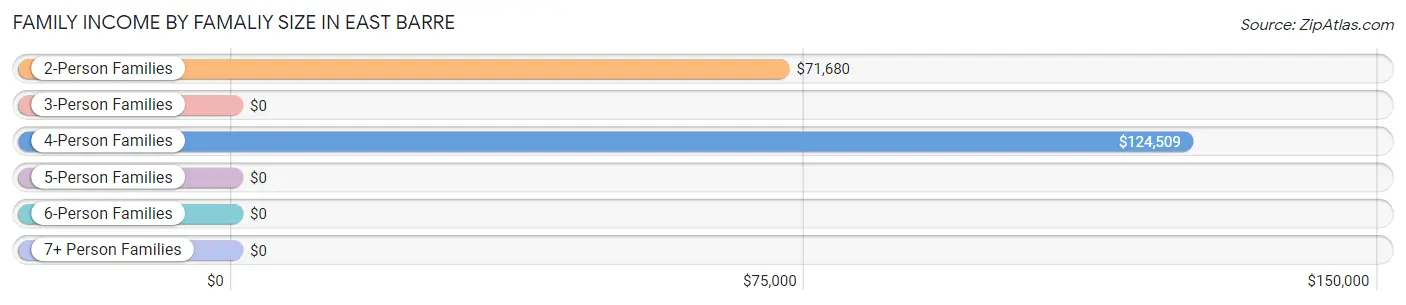
Family Income by Famaliy Size in East Barre
4-person families (91 | 35.1%) account for the highest median family income in East Barre with $124,509 per family, while 2-person families (67 | 25.9%) have the highest median income of $35,840 per family member.
| Income Bracket | # Families | Median Income |
| 2-Person Families | 67 (25.9%) | $71,680 |
| 3-Person Families | 80 (30.9%) | $0 |
| 4-Person Families | 91 (35.1%) | $124,509 |
| 5-Person Families | 7 (2.7%) | $0 |
| 6-Person Families | 14 (5.4%) | $0 |
| 7+ Person Families | 0 (0.0%) | $0 |
| Total | 259 (100.0%) | $84,417 |
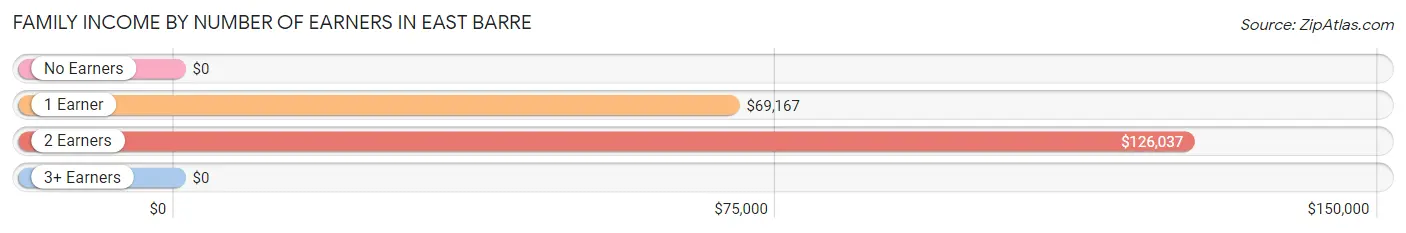
Family Income by Number of Earners in East Barre
| Number of Earners | # Families | Median Income |
| No Earners | 0 (0.0%) | $0 |
| 1 Earner | 144 (55.6%) | $69,167 |
| 2 Earners | 115 (44.4%) | $126,037 |
| 3+ Earners | 0 (0.0%) | $0 |
| Total | 259 (100.0%) | $84,417 |
Household Income in East Barre
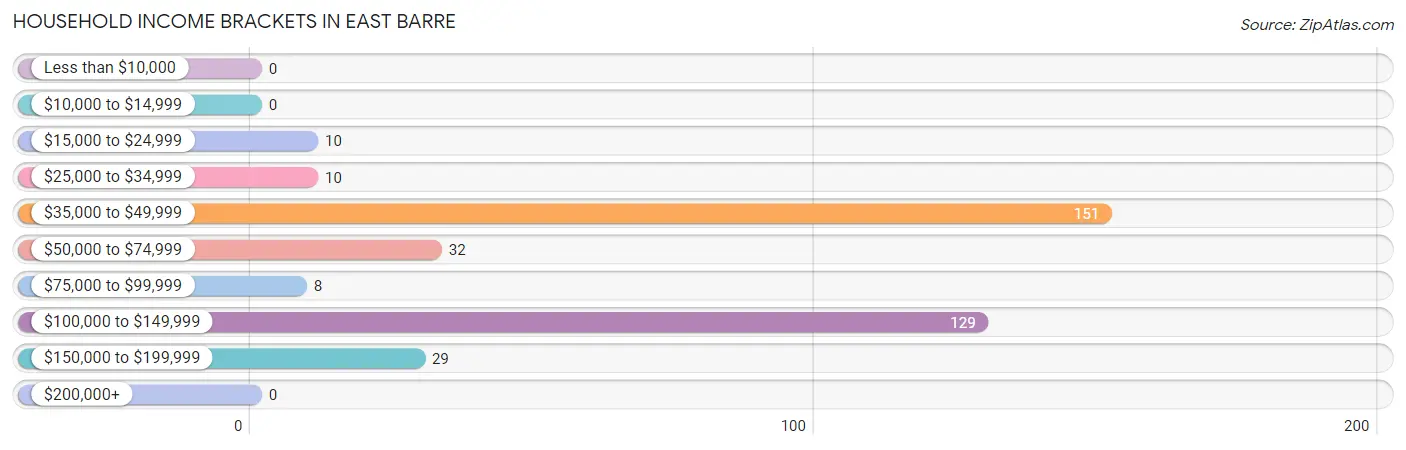
Household Income Brackets in East Barre
With 151 households falling in the category, the $35,000 to $49,999 income range is the most frequent in East Barre, accounting for 40.9% of all households.
| Income Bracket | # Households | % Households |
| Less than $10,000 | 0 | 0.0% |
| $10,000 to $14,999 | 0 | 0.0% |
| $15,000 to $24,999 | 10 | 2.7% |
| $25,000 to $34,999 | 10 | 2.7% |
| $35,000 to $49,999 | 151 | 40.9% |
| $50,000 to $74,999 | 32 | 8.7% |
| $75,000 to $99,999 | 8 | 2.2% |
| $100,000 to $149,999 | 129 | 35.0% |
| $150,000 to $199,999 | 29 | 7.9% |
| $200,000+ | 0 | 0.0% |
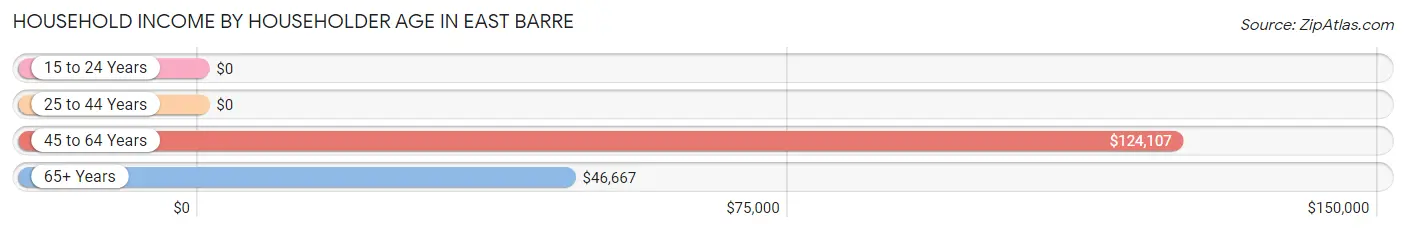
Household Income by Householder Age in East Barre
The median household income in East Barre is $0, with the highest median household income of $124,107 found in the 45 to 64 years age bracket for the primary householder. A total of 80 households (21.7%) fall into this category.
| Income Bracket | # Households | Median Income |
| 15 to 24 Years | 0 (0.0%) | $0 |
| 25 to 44 Years | 149 (40.4%) | $0 |
| 45 to 64 Years | 80 (21.7%) | $124,107 |
| 65+ Years | 140 (37.9%) | $46,667 |
| Total | 369 (100.0%) | $0 |
Poverty in East Barre
Income Below Poverty by Sex and Age in East Barre
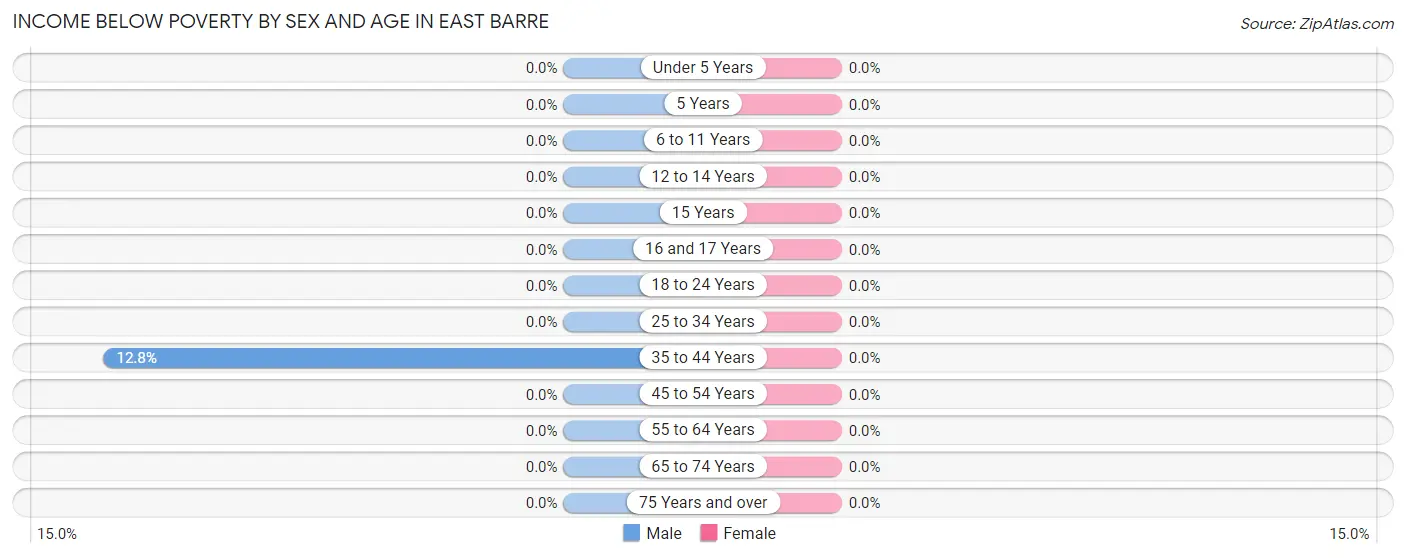
| Age Bracket | Male | Female |
| Under 5 Years | 0 (0.0%) | 0 (0.0%) |
| 5 Years | 0 (0.0%) | 0 (0.0%) |
| 6 to 11 Years | 0 (0.0%) | 0 (0.0%) |
| 12 to 14 Years | 0 (0.0%) | 0 (0.0%) |
| 15 Years | 0 (0.0%) | 0 (0.0%) |
| 16 and 17 Years | 0 (0.0%) | 0 (0.0%) |
| 18 to 24 Years | 0 (0.0%) | 0 (0.0%) |
| 25 to 34 Years | 0 (0.0%) | 0 (0.0%) |
| 35 to 44 Years | 16 (12.8%) | 0 (0.0%) |
| 45 to 54 Years | 0 (0.0%) | 0 (0.0%) |
| 55 to 64 Years | 0 (0.0%) | 0 (0.0%) |
| 65 to 74 Years | 0 (0.0%) | 0 (0.0%) |
| 75 Years and over | 0 (0.0%) | 0 (0.0%) |
| Total | 16 (2.7%) | 0 (0.0%) |
Income Above Poverty by Sex and Age in East Barre
According to the poverty statistics in East Barre, males aged under 5 years and females aged under 5 years are the age groups that are most secure financially, with 100.0% of males and 100.0% of females in these age groups living above the poverty line.
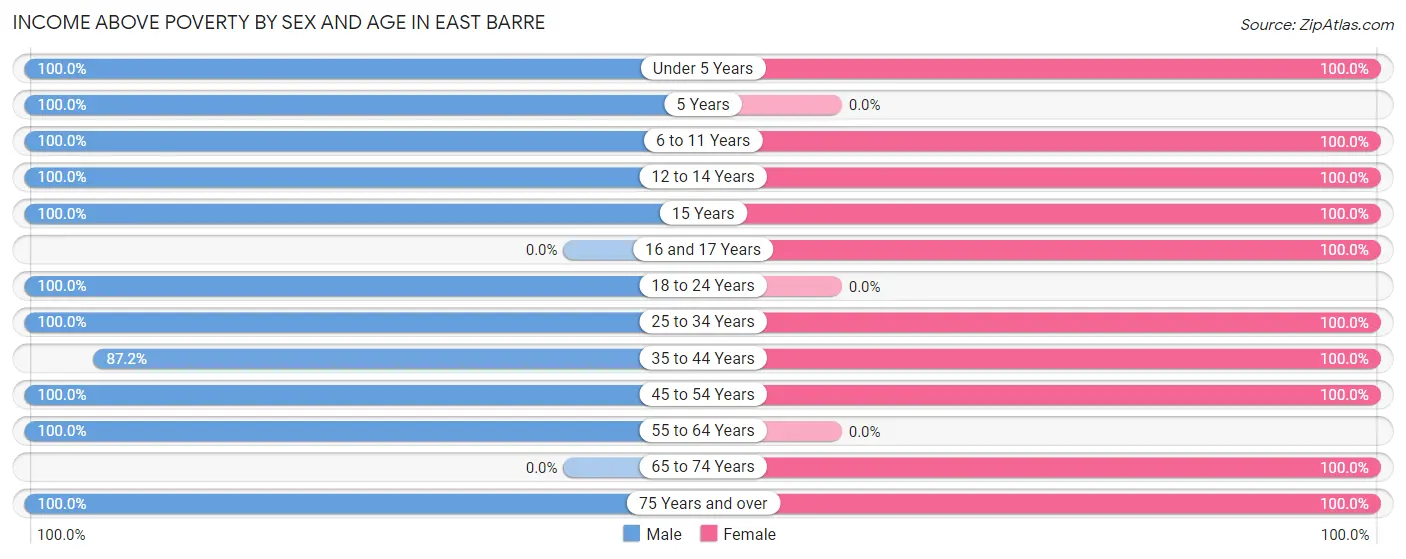
| Age Bracket | Male | Female |
| Under 5 Years | 44 (100.0%) | 43 (100.0%) |
| 5 Years | 63 (100.0%) | 0 (0.0%) |
| 6 to 11 Years | 40 (100.0%) | 67 (100.0%) |
| 12 to 14 Years | 90 (100.0%) | 8 (100.0%) |
| 15 Years | 11 (100.0%) | 12 (100.0%) |
| 16 and 17 Years | 0 (0.0%) | 7 (100.0%) |
| 18 to 24 Years | 59 (100.0%) | 0 (0.0%) |
| 25 to 34 Years | 71 (100.0%) | 27 (100.0%) |
| 35 to 44 Years | 109 (87.2%) | 49 (100.0%) |
| 45 to 54 Years | 28 (100.0%) | 178 (100.0%) |
| 55 to 64 Years | 22 (100.0%) | 0 (0.0%) |
| 65 to 74 Years | 0 (0.0%) | 91 (100.0%) |
| 75 Years and over | 39 (100.0%) | 49 (100.0%) |
| Total | 576 (97.3%) | 531 (100.0%) |
Income Below Poverty Among Married-Couple Families in East Barre
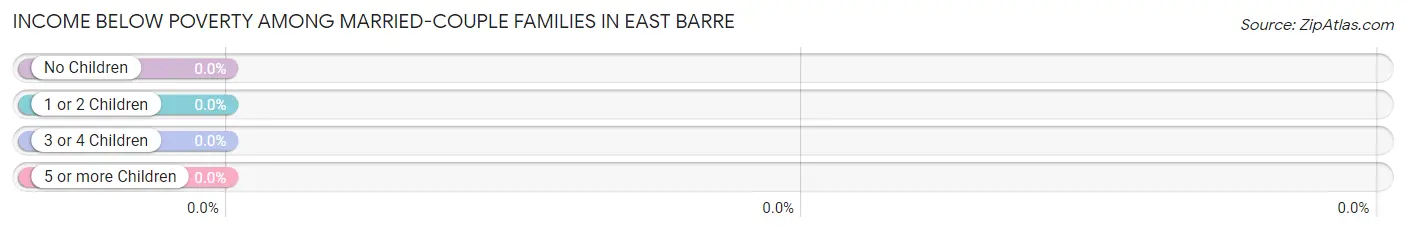
| Children | Above Poverty | Below Poverty |
| No Children | 40 (100.0%) | 0 (0.0%) |
| 1 or 2 Children | 107 (100.0%) | 0 (0.0%) |
| 3 or 4 Children | 21 (100.0%) | 0 (0.0%) |
| 5 or more Children | 0 (0.0%) | 0 (0.0%) |
| Total | 168 (100.0%) | 0 (0.0%) |
Income Below Poverty Among Single-Parent Households in East Barre
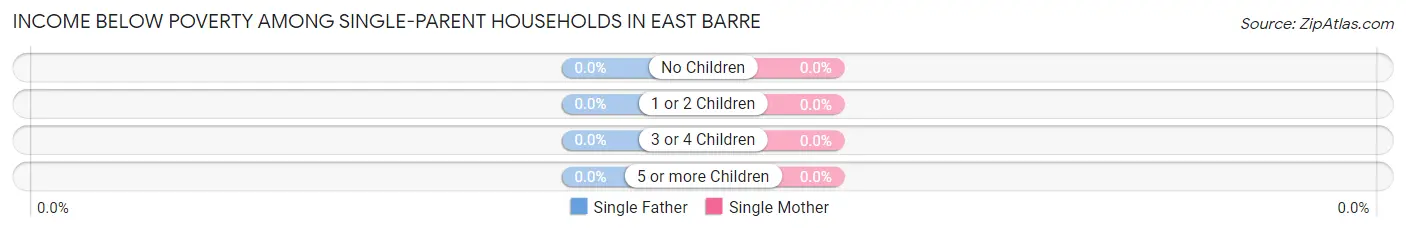
| Children | Single Father | Single Mother |
| No Children | 0 (0.0%) | 0 (0.0%) |
| 1 or 2 Children | 0 (0.0%) | 0 (0.0%) |
| 3 or 4 Children | 0 (0.0%) | 0 (0.0%) |
| 5 or more Children | 0 (0.0%) | 0 (0.0%) |
| Total | 0 (0.0%) | 0 (0.0%) |
Income Below Poverty Among Married-Couple vs Single-Parent Households in East Barre
| Children | Married-Couple Families | Single-Parent Households |
| No Children | 0 (0.0%) | 0 (0.0%) |
| 1 or 2 Children | 0 (0.0%) | 0 (0.0%) |
| 3 or 4 Children | 0 (0.0%) | 0 (0.0%) |
| 5 or more Children | 0 (0.0%) | 0 (0.0%) |
| Total | 0 (0.0%) | 0 (0.0%) |
Employment Characteristics in East Barre
Employment by Class of Employer in East Barre
Among the 453 employed individuals in East Barre, private company employees (250 | 55.2%), self-employed (not incorporated) (100 | 22.1%), and not-for-profit organizations (71 | 15.7%) make up the most common classes of employment.

| Employer Class | # Employees | % Employees |
| Private Company Employees | 250 | 55.2% |
| Self-Employed (Incorporated) | 10 | 2.2% |
| Self-Employed (Not Incorporated) | 100 | 22.1% |
| Not-for-profit Organizations | 71 | 15.7% |
| Local Government Employees | 9 | 2.0% |
| State Government Employees | 13 | 2.9% |
| Federal Government Employees | 0 | 0.0% |
| Unpaid Family Workers | 0 | 0.0% |
| Total | 453 | 100.0% |
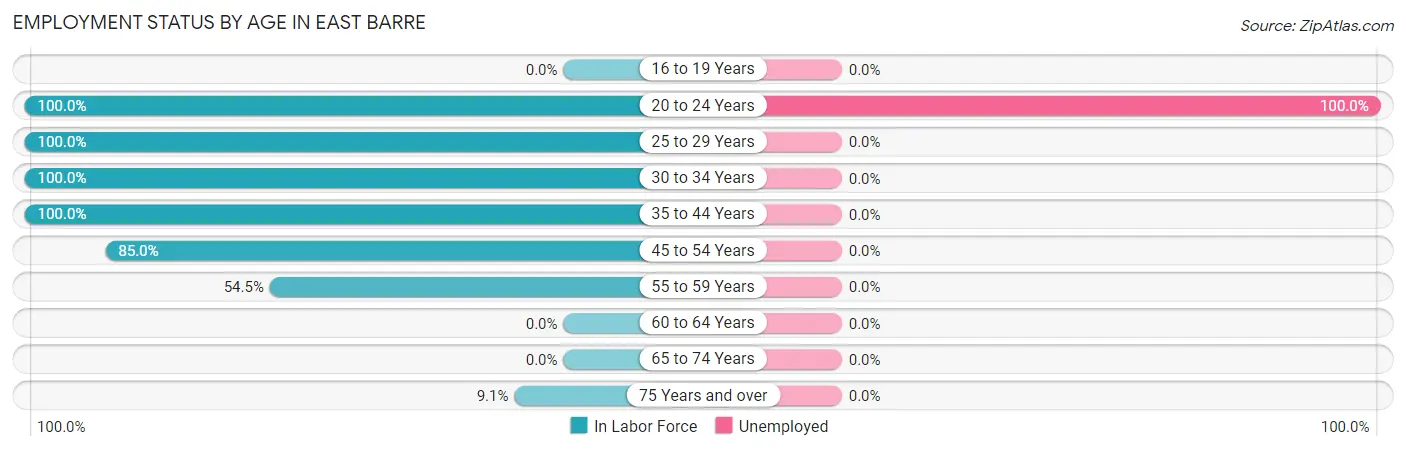
Employment Status by Age in East Barre
According to the labor force statistics for East Barre, out of the total population over 16 years of age (745), 70.6% or 526 individuals are in the labor force, with 11.2% or 59 of them unemployed. The age group with the highest labor force participation rate is 20 to 24 years, with 100.0% or 59 individuals in the labor force. Within the labor force, the 20 to 24 years age range has the highest percentage of unemployed individuals, with 100.0% or 59 of them being unemployed.
| Age Bracket | In Labor Force | Unemployed |
| 16 to 19 Years | 0 (0.0%) | 0 (0.0%) |
| 20 to 24 Years | 59 (100.0%) | 59 (100.0%) |
| 25 to 29 Years | 46 (100.0%) | 0 (0.0%) |
| 30 to 34 Years | 52 (100.0%) | 0 (0.0%) |
| 35 to 44 Years | 174 (100.0%) | 0 (0.0%) |
| 45 to 54 Years | 175 (85.0%) | 0 (0.0%) |
| 55 to 59 Years | 12 (54.5%) | 0 (0.0%) |
| 60 to 64 Years | 0 (0.0%) | 0 (0.0%) |
| 65 to 74 Years | 0 (0.0%) | 0 (0.0%) |
| 75 Years and over | 8 (9.1%) | 0 (0.0%) |
| Total | 526 (70.6%) | 59 (11.2%) |
Employment Status by Educational Attainment in East Barre

| Educational Attainment | In Labor Force | Unemployed |
| Less than High School | 64 (86.5%) | 0 (0.0%) |
| High School Diploma | 154 (100.0%) | 0 (0.0%) |
| College / Associate Degree | 138 (81.7%) | 0 (0.0%) |
| Bachelor's Degree or higher | 103 (100.0%) | 0 (0.0%) |
| Total | 459 (91.8%) | 0 (0.0%) |
Employment Occupations by Sex in East Barre
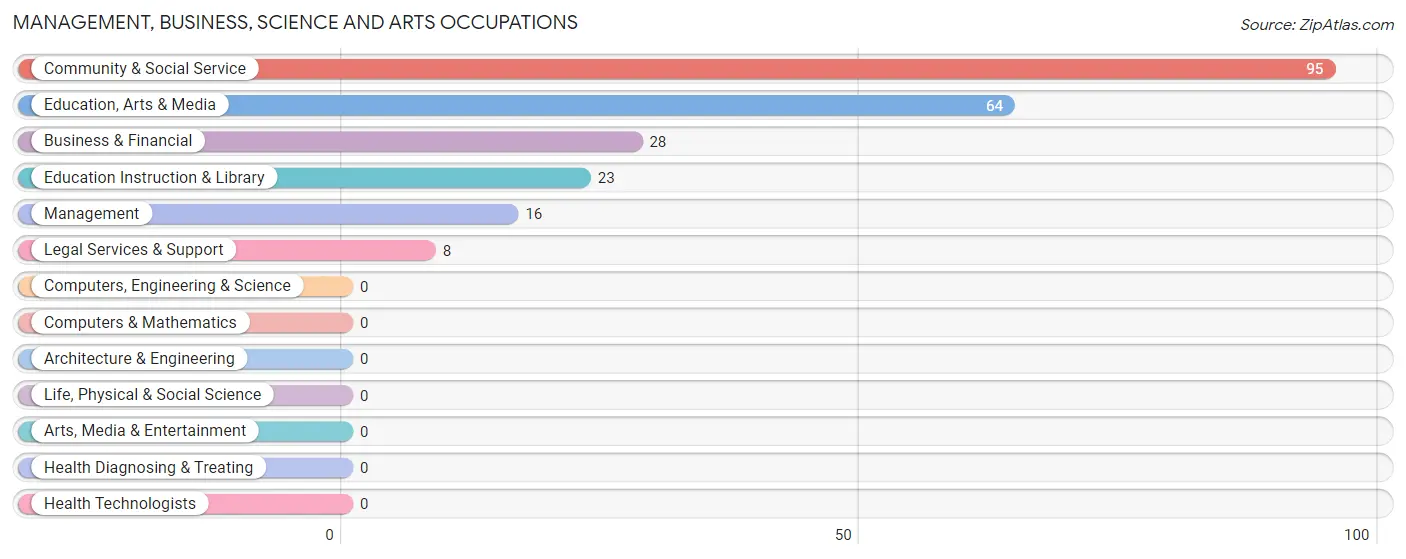
Management, Business, Science and Arts Occupations
The most common Management, Business, Science and Arts occupations in East Barre are Community & Social Service (95 | 20.3%), Education, Arts & Media (64 | 13.7%), Business & Financial (28 | 6.0%), Education Instruction & Library (23 | 4.9%), and Management (16 | 3.4%).
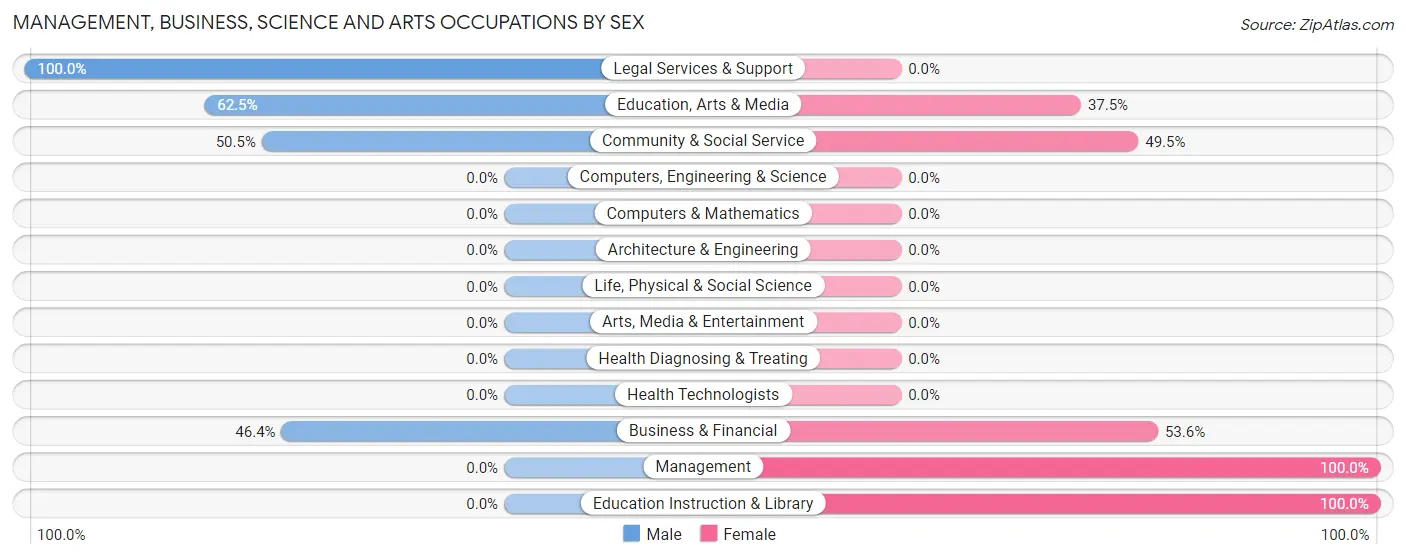
Management, Business, Science and Arts Occupations by Sex
Within the Management, Business, Science and Arts occupations in East Barre, the most male-oriented occupations are Legal Services & Support (100.0%), Education, Arts & Media (62.5%), and Community & Social Service (50.5%), while the most female-oriented occupations are Management (100.0%), Education Instruction & Library (100.0%), and Business & Financial (53.6%).
| Occupation | Male | Female |
| Management | 0 (0.0%) | 16 (100.0%) |
| Business & Financial | 13 (46.4%) | 15 (53.6%) |
| Computers, Engineering & Science | 0 (0.0%) | 0 (0.0%) |
| Computers & Mathematics | 0 (0.0%) | 0 (0.0%) |
| Architecture & Engineering | 0 (0.0%) | 0 (0.0%) |
| Life, Physical & Social Science | 0 (0.0%) | 0 (0.0%) |
| Community & Social Service | 48 (50.5%) | 47 (49.5%) |
| Education, Arts & Media | 40 (62.5%) | 24 (37.5%) |
| Legal Services & Support | 8 (100.0%) | 0 (0.0%) |
| Education Instruction & Library | 0 (0.0%) | 23 (100.0%) |
| Arts, Media & Entertainment | 0 (0.0%) | 0 (0.0%) |
| Health Diagnosing & Treating | 0 (0.0%) | 0 (0.0%) |
| Health Technologists | 0 (0.0%) | 0 (0.0%) |
| Total (Category) | 61 (43.9%) | 78 (56.1%) |
| Total (Overall) | 244 (52.2%) | 223 (47.7%) |
Services Occupations
The most common Services occupations in East Barre are Cleaning & Maintenance (105 | 22.5%), and Food Preparation & Serving (44 | 9.4%).
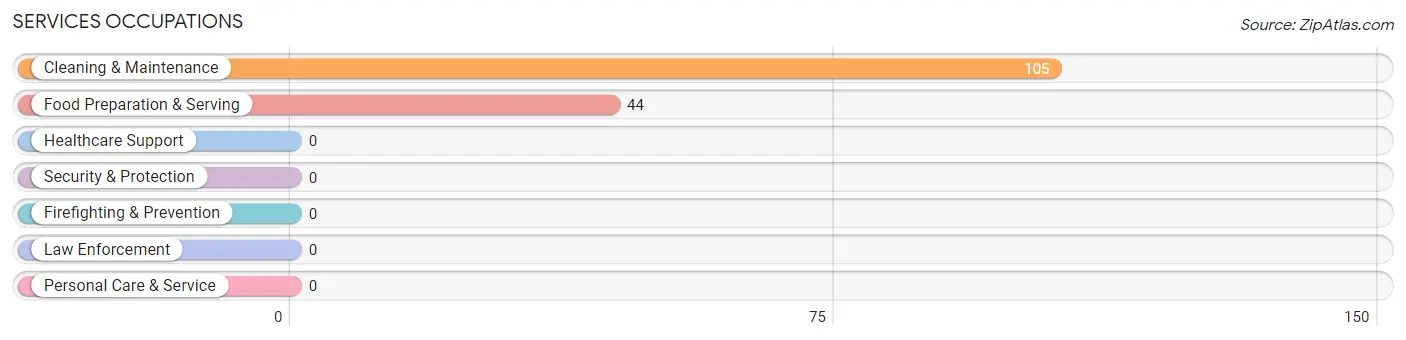
Services Occupations by Sex
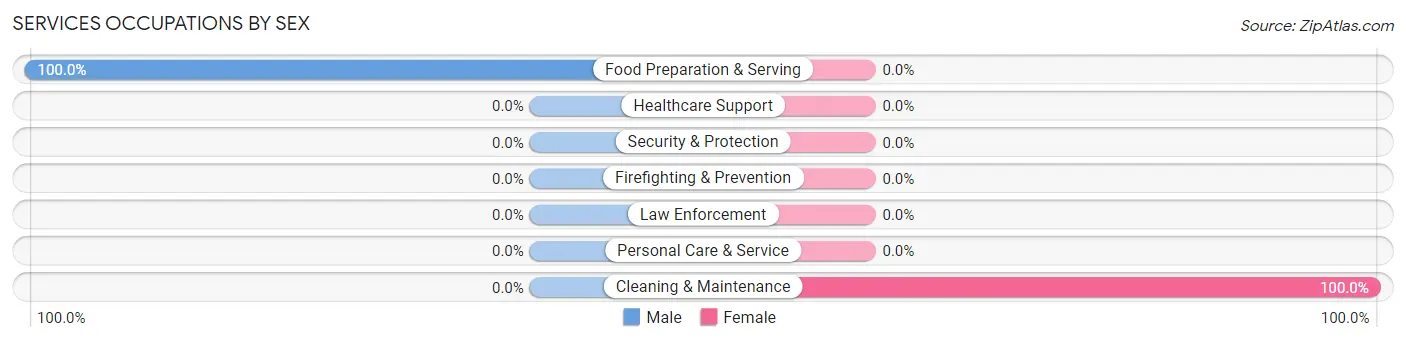
| Occupation | Male | Female |
| Healthcare Support | 0 (0.0%) | 0 (0.0%) |
| Security & Protection | 0 (0.0%) | 0 (0.0%) |
| Firefighting & Prevention | 0 (0.0%) | 0 (0.0%) |
| Law Enforcement | 0 (0.0%) | 0 (0.0%) |
| Food Preparation & Serving | 44 (100.0%) | 0 (0.0%) |
| Cleaning & Maintenance | 0 (0.0%) | 105 (100.0%) |
| Personal Care & Service | 0 (0.0%) | 0 (0.0%) |
| Total (Category) | 44 (29.5%) | 105 (70.5%) |
| Total (Overall) | 244 (52.2%) | 223 (47.7%) |
Sales and Office Occupations
The most common Sales and Office occupations in East Barre are Sales & Related (65 | 13.9%), and Office & Administration (7 | 1.5%).
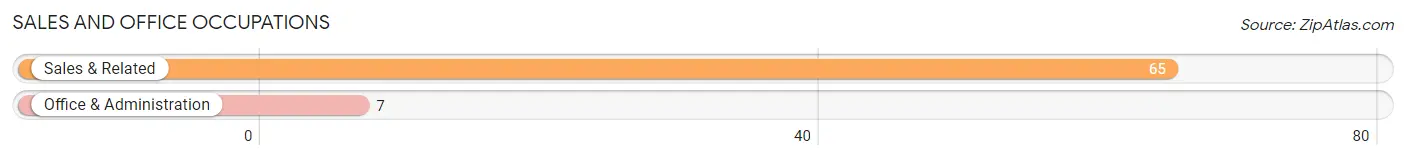
Sales and Office Occupations by Sex
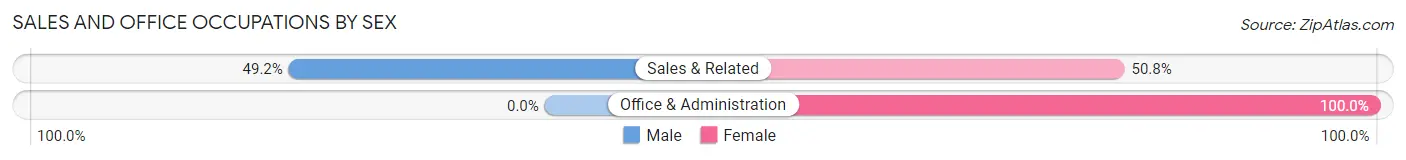
| Occupation | Male | Female |
| Sales & Related | 32 (49.2%) | 33 (50.8%) |
| Office & Administration | 0 (0.0%) | 7 (100.0%) |
| Total (Category) | 32 (44.4%) | 40 (55.6%) |
| Total (Overall) | 244 (52.2%) | 223 (47.7%) |
Natural Resources, Construction and Maintenance Occupations
The most common Natural Resources, Construction and Maintenance occupations in East Barre are , and Construction & Extraction (79 | 16.9%).
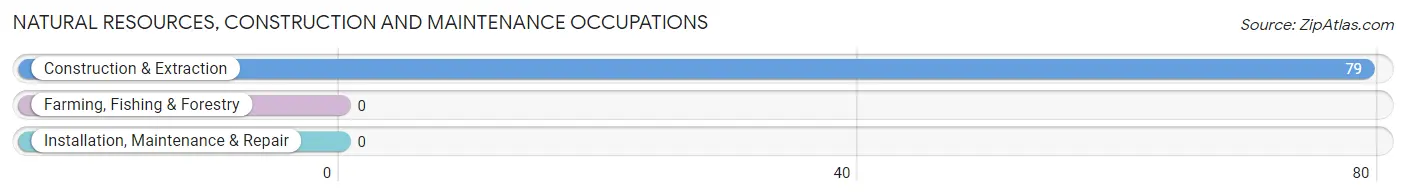
Natural Resources, Construction and Maintenance Occupations by Sex
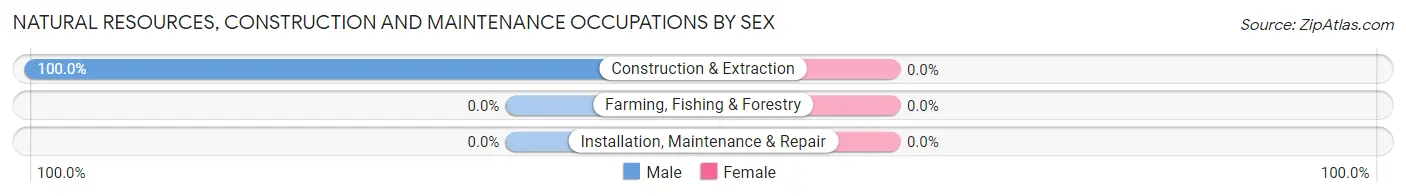
| Occupation | Male | Female |
| Farming, Fishing & Forestry | 0 (0.0%) | 0 (0.0%) |
| Construction & Extraction | 79 (100.0%) | 0 (0.0%) |
| Installation, Maintenance & Repair | 0 (0.0%) | 0 (0.0%) |
| Total (Category) | 79 (100.0%) | 0 (0.0%) |
| Total (Overall) | 244 (52.2%) | 223 (47.7%) |
Production, Transportation and Moving Occupations
The most common Production, Transportation and Moving occupations in East Barre are , and Transportation (28 | 6.0%).
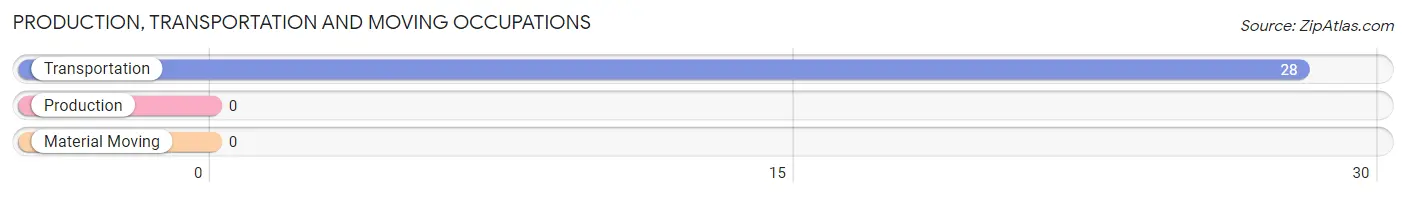
Production, Transportation and Moving Occupations by Sex
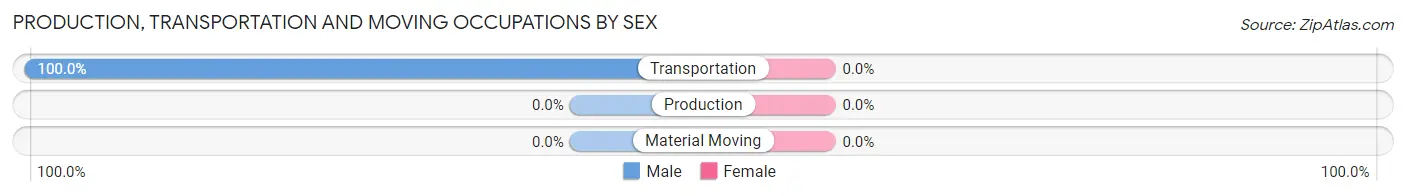
| Occupation | Male | Female |
| Production | 0 (0.0%) | 0 (0.0%) |
| Transportation | 28 (100.0%) | 0 (0.0%) |
| Material Moving | 0 (0.0%) | 0 (0.0%) |
| Total (Category) | 28 (100.0%) | 0 (0.0%) |
| Total (Overall) | 244 (52.2%) | 223 (47.7%) |
Employment Industries by Sex in East Barre
Employment Industries in East Barre
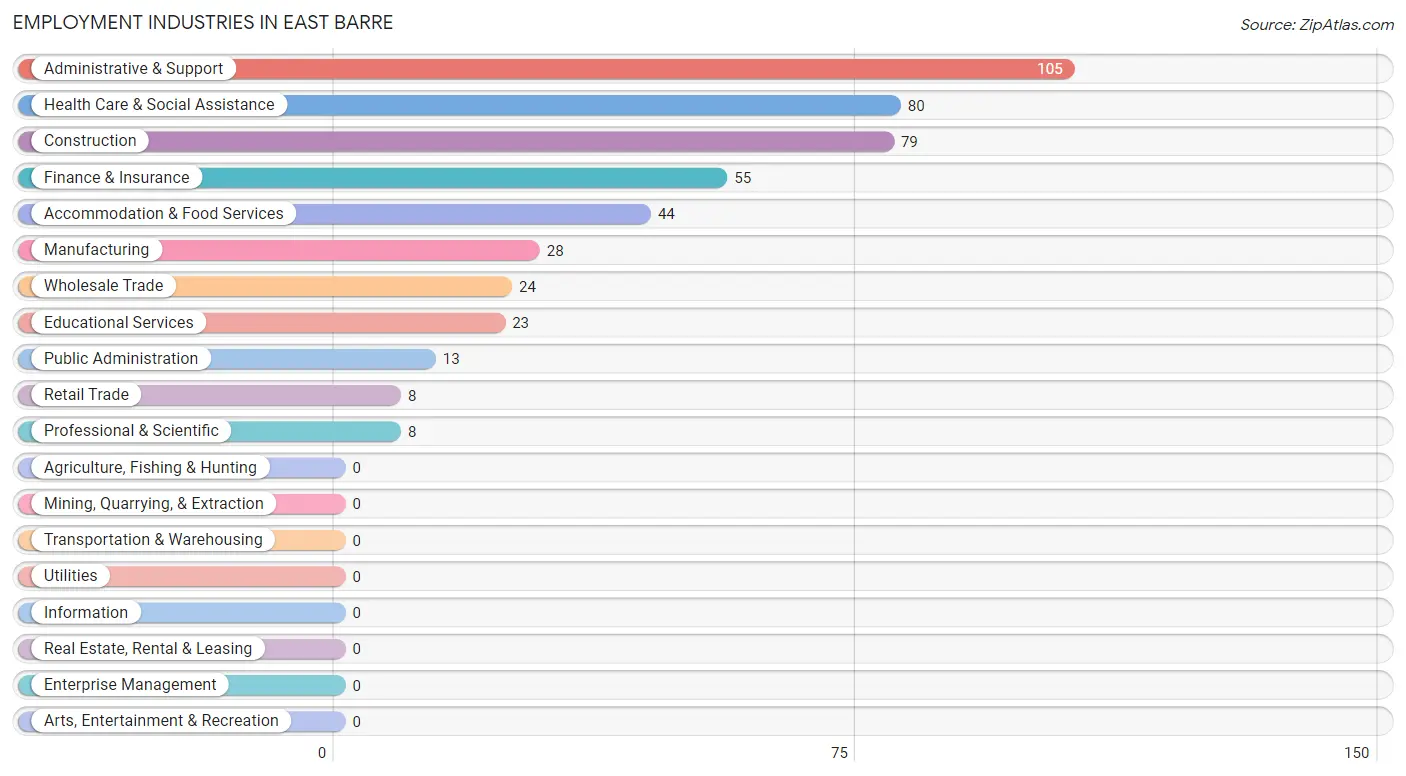
The major employment industries in East Barre include Administrative & Support (105 | 22.5%), Health Care & Social Assistance (80 | 17.1%), Construction (79 | 16.9%), Finance & Insurance (55 | 11.8%), and Accommodation & Food Services (44 | 9.4%).
Employment Industries by Sex in East Barre
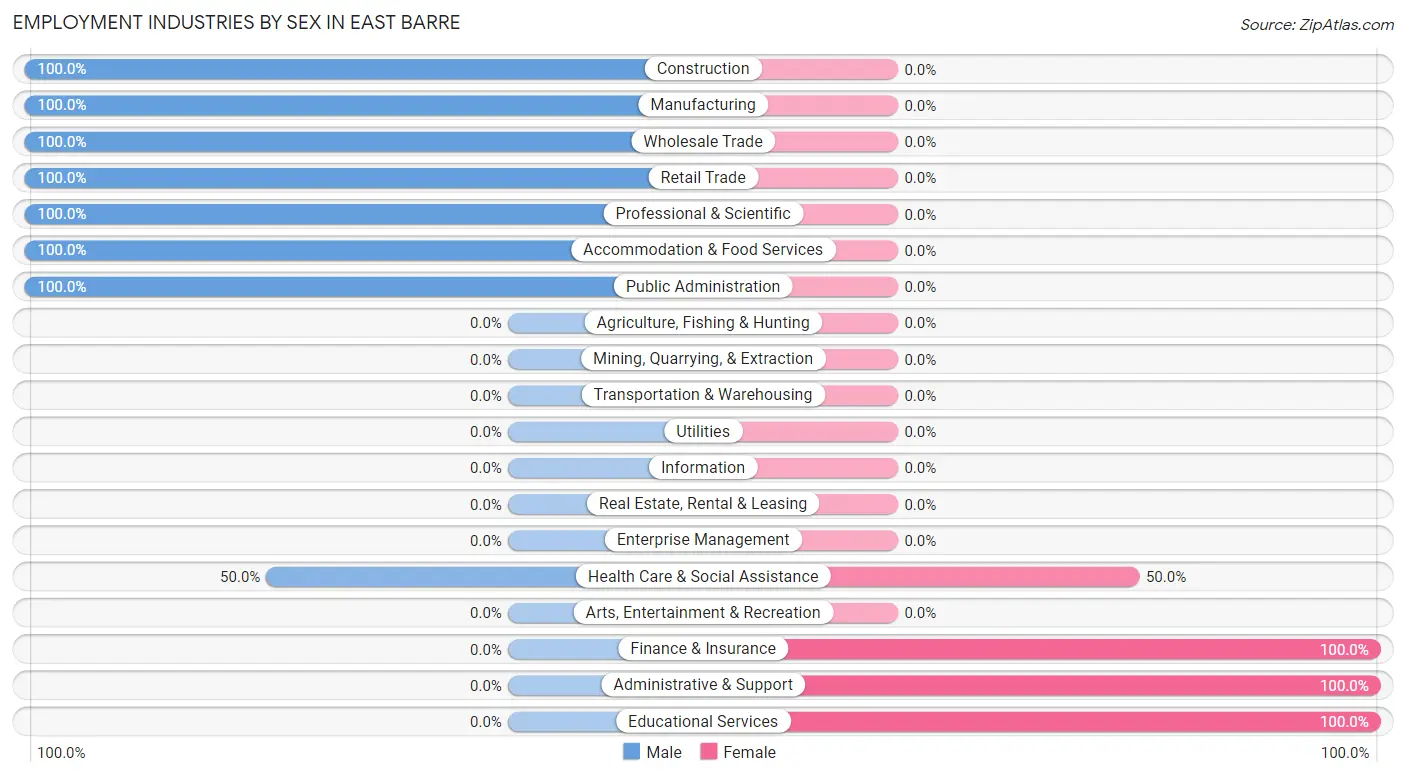
The East Barre industries that see more men than women are Construction (100.0%), Manufacturing (100.0%), and Wholesale Trade (100.0%), whereas the industries that tend to have a higher number of women are Finance & Insurance (100.0%), Administrative & Support (100.0%), and Educational Services (100.0%).
| Industry | Male | Female |
| Agriculture, Fishing & Hunting | 0 (0.0%) | 0 (0.0%) |
| Mining, Quarrying, & Extraction | 0 (0.0%) | 0 (0.0%) |
| Construction | 79 (100.0%) | 0 (0.0%) |
| Manufacturing | 28 (100.0%) | 0 (0.0%) |
| Wholesale Trade | 24 (100.0%) | 0 (0.0%) |
| Retail Trade | 8 (100.0%) | 0 (0.0%) |
| Transportation & Warehousing | 0 (0.0%) | 0 (0.0%) |
| Utilities | 0 (0.0%) | 0 (0.0%) |
| Information | 0 (0.0%) | 0 (0.0%) |
| Finance & Insurance | 0 (0.0%) | 55 (100.0%) |
| Real Estate, Rental & Leasing | 0 (0.0%) | 0 (0.0%) |
| Professional & Scientific | 8 (100.0%) | 0 (0.0%) |
| Enterprise Management | 0 (0.0%) | 0 (0.0%) |
| Administrative & Support | 0 (0.0%) | 105 (100.0%) |
| Educational Services | 0 (0.0%) | 23 (100.0%) |
| Health Care & Social Assistance | 40 (50.0%) | 40 (50.0%) |
| Arts, Entertainment & Recreation | 0 (0.0%) | 0 (0.0%) |
| Accommodation & Food Services | 44 (100.0%) | 0 (0.0%) |
| Public Administration | 13 (100.0%) | 0 (0.0%) |
| Total | 244 (52.2%) | 223 (47.7%) |
Education in East Barre
School Enrollment in East Barre
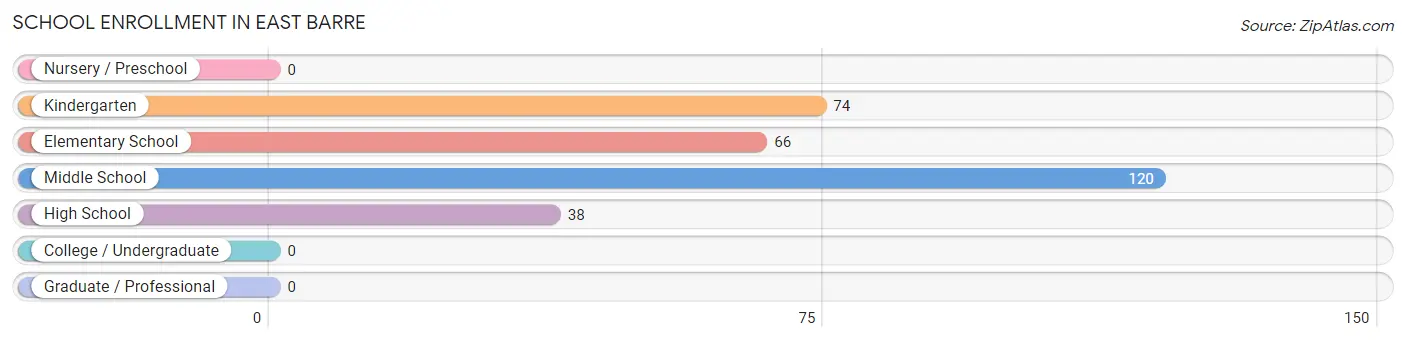
The most common levels of schooling among the 298 students in East Barre are middle school (120 | 40.3%), kindergarten (74 | 24.8%), and elementary school (66 | 22.2%).
| School Level | # Students | % Students |
| Nursery / Preschool | 0 | 0.0% |
| Kindergarten | 74 | 24.8% |
| Elementary School | 66 | 22.2% |
| Middle School | 120 | 40.3% |
| High School | 38 | 12.8% |
| College / Undergraduate | 0 | 0.0% |
| Graduate / Professional | 0 | 0.0% |
| Total | 298 | 100.0% |
School Enrollment by Age by Funding Source in East Barre
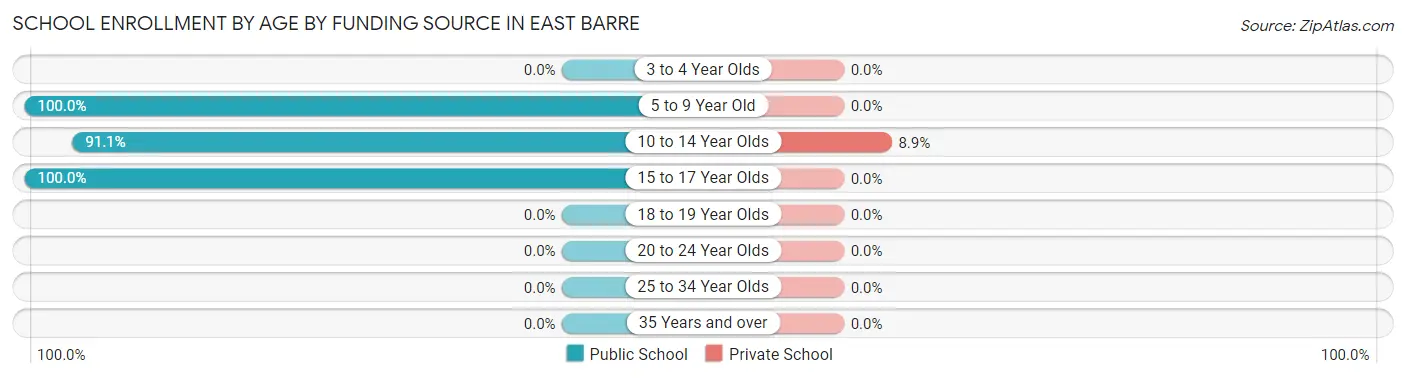
Out of a total of 298 students who are enrolled in schools in East Barre, 13 (4.4%) attend a private institution, while the remaining 285 (95.6%) are enrolled in public schools. The age group of 10 to 14 year olds has the highest likelihood of being enrolled in private schools, with 13 (8.9% in the age bracket) enrolled. Conversely, the age group of 5 to 9 year old has the lowest likelihood of being enrolled in a private school, with 122 (100.0% in the age bracket) attending a public institution.
| Age Bracket | Public School | Private School |
| 3 to 4 Year Olds | 0 (0.0%) | 0 (0.0%) |
| 5 to 9 Year Old | 122 (100.0%) | 0 (0.0%) |
| 10 to 14 Year Olds | 133 (91.1%) | 13 (8.9%) |
| 15 to 17 Year Olds | 30 (100.0%) | 0 (0.0%) |
| 18 to 19 Year Olds | 0 (0.0%) | 0 (0.0%) |
| 20 to 24 Year Olds | 0 (0.0%) | 0 (0.0%) |
| 25 to 34 Year Olds | 0 (0.0%) | 0 (0.0%) |
| 35 Years and over | 0 (0.0%) | 0 (0.0%) |
| Total | 285 (95.6%) | 13 (4.4%) |
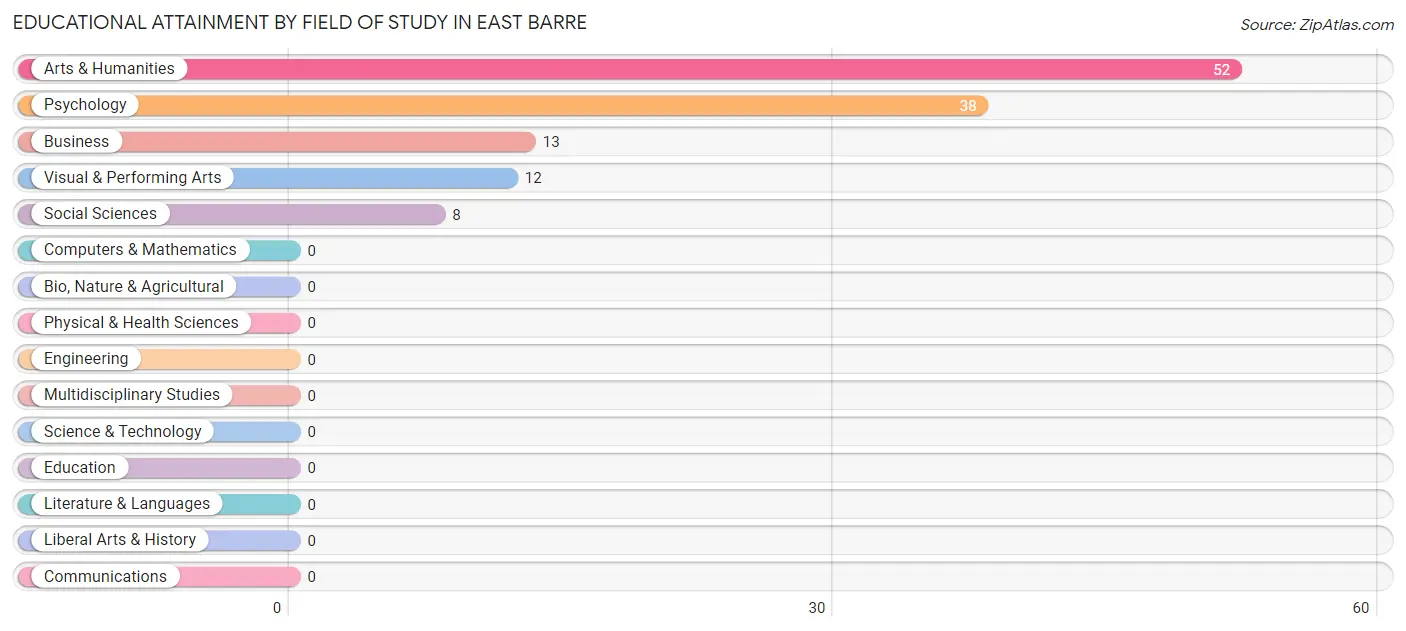
Educational Attainment by Field of Study in East Barre
Arts & humanities (52 | 42.3%), psychology (38 | 30.9%), business (13 | 10.6%), visual & performing arts (12 | 9.8%), and social sciences (8 | 6.5%) are the most common fields of study among 123 individuals in East Barre who have obtained a bachelor's degree or higher.
| Field of Study | # Graduates | % Graduates |
| Computers & Mathematics | 0 | 0.0% |
| Bio, Nature & Agricultural | 0 | 0.0% |
| Physical & Health Sciences | 0 | 0.0% |
| Psychology | 38 | 30.9% |
| Social Sciences | 8 | 6.5% |
| Engineering | 0 | 0.0% |
| Multidisciplinary Studies | 0 | 0.0% |
| Science & Technology | 0 | 0.0% |
| Business | 13 | 10.6% |
| Education | 0 | 0.0% |
| Literature & Languages | 0 | 0.0% |
| Liberal Arts & History | 0 | 0.0% |
| Visual & Performing Arts | 12 | 9.8% |
| Communications | 0 | 0.0% |
| Arts & Humanities | 52 | 42.3% |
| Total | 123 | 100.0% |
Transportation & Commute in East Barre
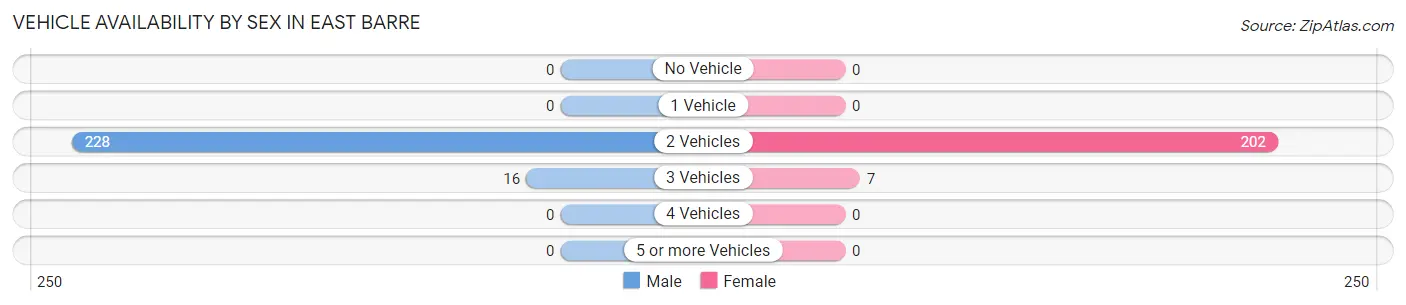
Vehicle Availability by Sex in East Barre
The most prevalent vehicle ownership categories in East Barre are males with 2 vehicles (228, accounting for 93.4%) and females with 2 vehicles (202, making up 109.1%).
| Vehicles Available | Male | Female |
| No Vehicle | 0 (0.0%) | 0 (0.0%) |
| 1 Vehicle | 0 (0.0%) | 0 (0.0%) |
| 2 Vehicles | 228 (93.4%) | 202 (96.7%) |
| 3 Vehicles | 16 (6.6%) | 7 (3.4%) |
| 4 Vehicles | 0 (0.0%) | 0 (0.0%) |
| 5 or more Vehicles | 0 (0.0%) | 0 (0.0%) |
| Total | 244 (100.0%) | 209 (100.0%) |
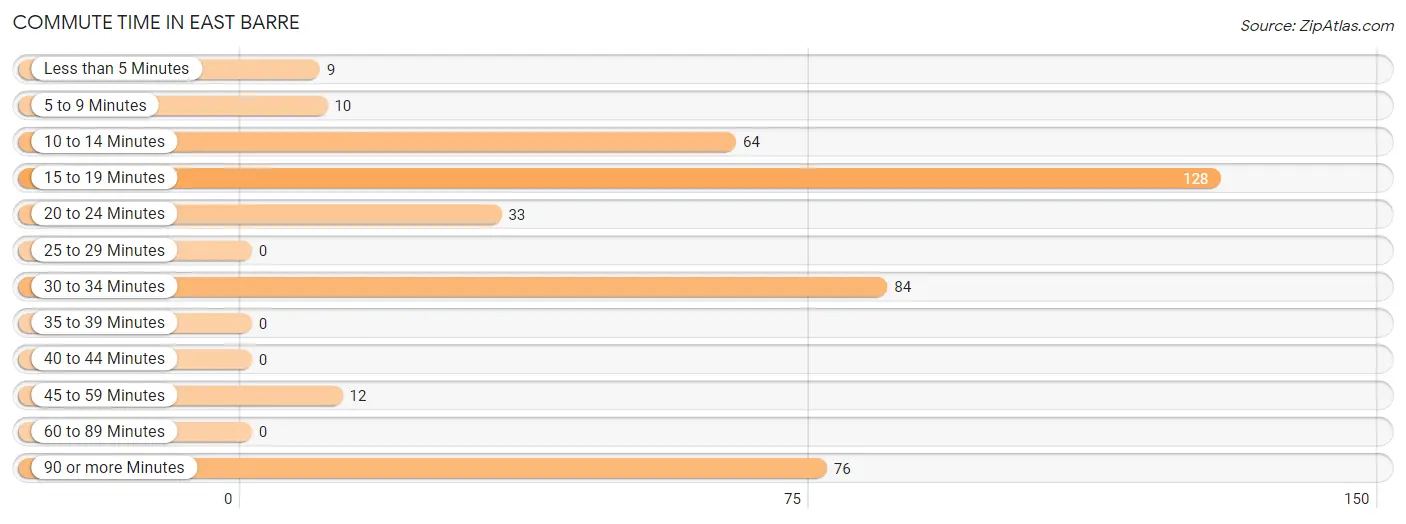
Commute Time in East Barre
The most frequently occuring commute durations in East Barre are 15 to 19 minutes (128 commuters, 30.8%), 30 to 34 minutes (84 commuters, 20.2%), and 90 or more minutes (76 commuters, 18.3%).
| Commute Time | # Commuters | % Commuters |
| Less than 5 Minutes | 9 | 2.2% |
| 5 to 9 Minutes | 10 | 2.4% |
| 10 to 14 Minutes | 64 | 15.4% |
| 15 to 19 Minutes | 128 | 30.8% |
| 20 to 24 Minutes | 33 | 7.9% |
| 25 to 29 Minutes | 0 | 0.0% |
| 30 to 34 Minutes | 84 | 20.2% |
| 35 to 39 Minutes | 0 | 0.0% |
| 40 to 44 Minutes | 0 | 0.0% |
| 45 to 59 Minutes | 12 | 2.9% |
| 60 to 89 Minutes | 0 | 0.0% |
| 90 or more Minutes | 76 | 18.3% |
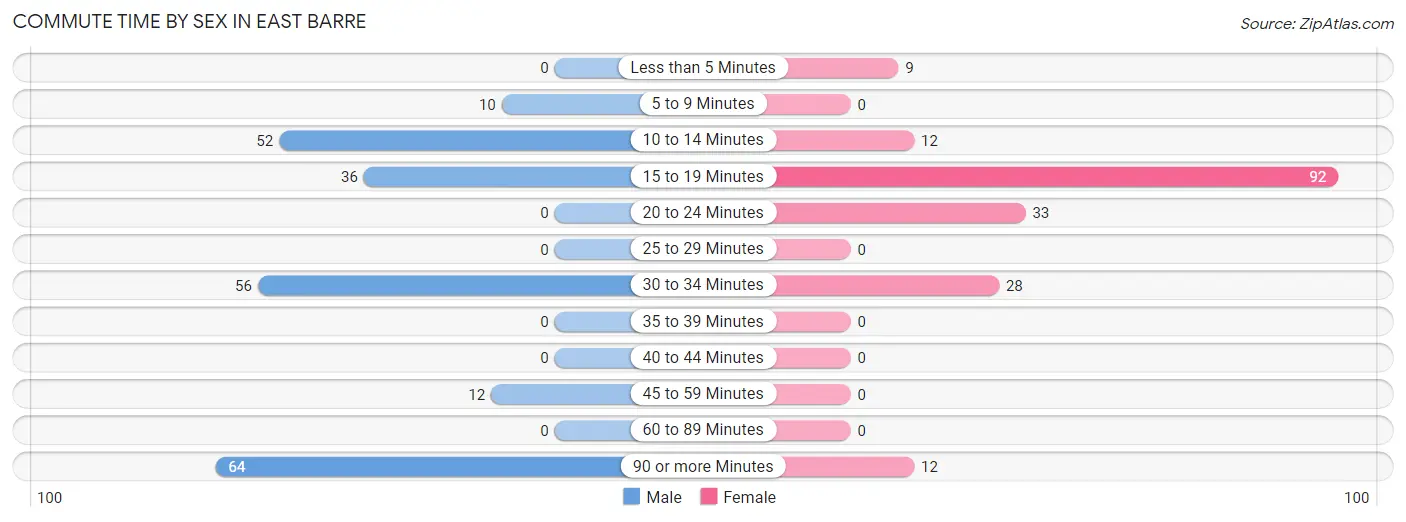
Commute Time by Sex in East Barre
The most common commute times in East Barre are 90 or more minutes (64 commuters, 27.8%) for males and 15 to 19 minutes (92 commuters, 49.5%) for females.
| Commute Time | Male | Female |
| Less than 5 Minutes | 0 (0.0%) | 9 (4.8%) |
| 5 to 9 Minutes | 10 (4.3%) | 0 (0.0%) |
| 10 to 14 Minutes | 52 (22.6%) | 12 (6.5%) |
| 15 to 19 Minutes | 36 (15.7%) | 92 (49.5%) |
| 20 to 24 Minutes | 0 (0.0%) | 33 (17.7%) |
| 25 to 29 Minutes | 0 (0.0%) | 0 (0.0%) |
| 30 to 34 Minutes | 56 (24.3%) | 28 (15.0%) |
| 35 to 39 Minutes | 0 (0.0%) | 0 (0.0%) |
| 40 to 44 Minutes | 0 (0.0%) | 0 (0.0%) |
| 45 to 59 Minutes | 12 (5.2%) | 0 (0.0%) |
| 60 to 89 Minutes | 0 (0.0%) | 0 (0.0%) |
| 90 or more Minutes | 64 (27.8%) | 12 (6.5%) |
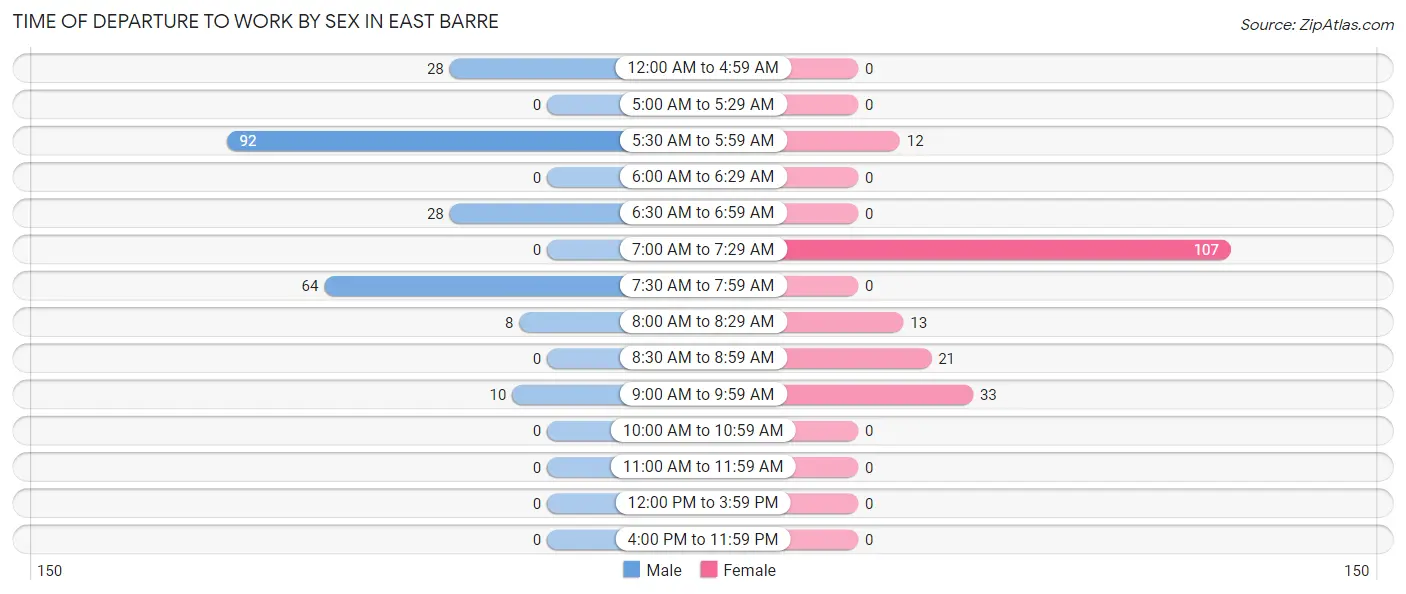
Time of Departure to Work by Sex in East Barre
The most frequent times of departure to work in East Barre are 5:30 AM to 5:59 AM (92, 40.0%) for males and 7:00 AM to 7:29 AM (107, 57.5%) for females.
| Time of Departure | Male | Female |
| 12:00 AM to 4:59 AM | 28 (12.2%) | 0 (0.0%) |
| 5:00 AM to 5:29 AM | 0 (0.0%) | 0 (0.0%) |
| 5:30 AM to 5:59 AM | 92 (40.0%) | 12 (6.5%) |
| 6:00 AM to 6:29 AM | 0 (0.0%) | 0 (0.0%) |
| 6:30 AM to 6:59 AM | 28 (12.2%) | 0 (0.0%) |
| 7:00 AM to 7:29 AM | 0 (0.0%) | 107 (57.5%) |
| 7:30 AM to 7:59 AM | 64 (27.8%) | 0 (0.0%) |
| 8:00 AM to 8:29 AM | 8 (3.5%) | 13 (7.0%) |
| 8:30 AM to 8:59 AM | 0 (0.0%) | 21 (11.3%) |
| 9:00 AM to 9:59 AM | 10 (4.3%) | 33 (17.7%) |
| 10:00 AM to 10:59 AM | 0 (0.0%) | 0 (0.0%) |
| 11:00 AM to 11:59 AM | 0 (0.0%) | 0 (0.0%) |
| 12:00 PM to 3:59 PM | 0 (0.0%) | 0 (0.0%) |
| 4:00 PM to 11:59 PM | 0 (0.0%) | 0 (0.0%) |
| Total | 230 (100.0%) | 186 (100.0%) |
Housing Occupancy in East Barre
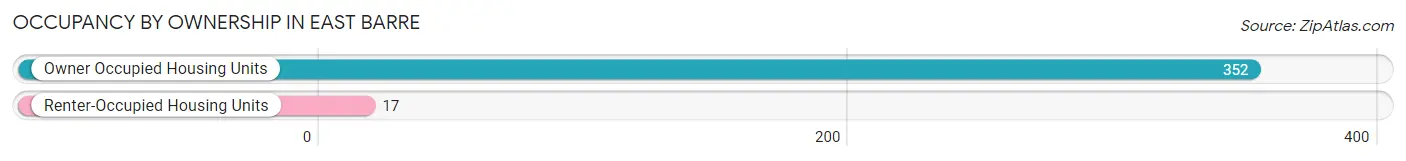
Occupancy by Ownership in East Barre
Of the total 369 dwellings in East Barre, owner-occupied units account for 352 (95.4%), while renter-occupied units make up 17 (4.6%).
| Occupancy | # Housing Units | % Housing Units |
| Owner Occupied Housing Units | 352 | 95.4% |
| Renter-Occupied Housing Units | 17 | 4.6% |
| Total Occupied Housing Units | 369 | 100.0% |
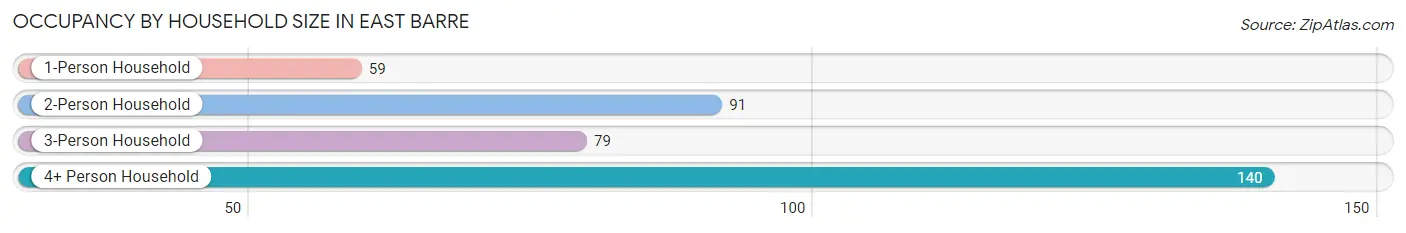
Occupancy by Household Size in East Barre
| Household Size | # Housing Units | % Housing Units |
| 1-Person Household | 59 | 16.0% |
| 2-Person Household | 91 | 24.7% |
| 3-Person Household | 79 | 21.4% |
| 4+ Person Household | 140 | 37.9% |
| Total Housing Units | 369 | 100.0% |
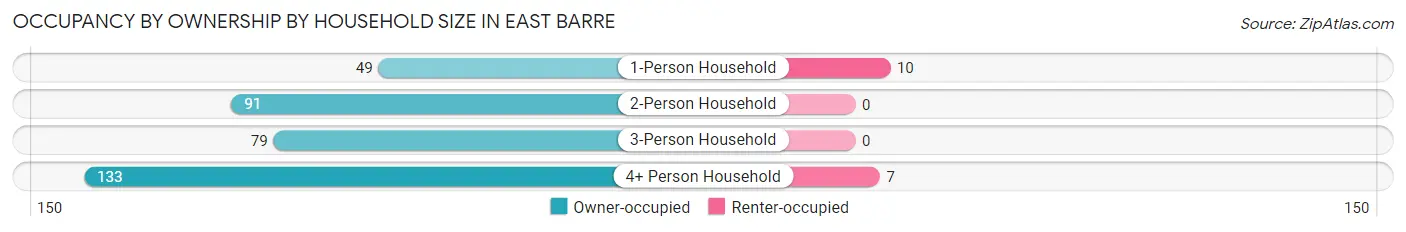
Occupancy by Ownership by Household Size in East Barre
| Household Size | Owner-occupied | Renter-occupied |
| 1-Person Household | 49 (83.1%) | 10 (17.0%) |
| 2-Person Household | 91 (100.0%) | 0 (0.0%) |
| 3-Person Household | 79 (100.0%) | 0 (0.0%) |
| 4+ Person Household | 133 (95.0%) | 7 (5.0%) |
| Total Housing Units | 352 (95.4%) | 17 (4.6%) |
Occupancy by Educational Attainment in East Barre
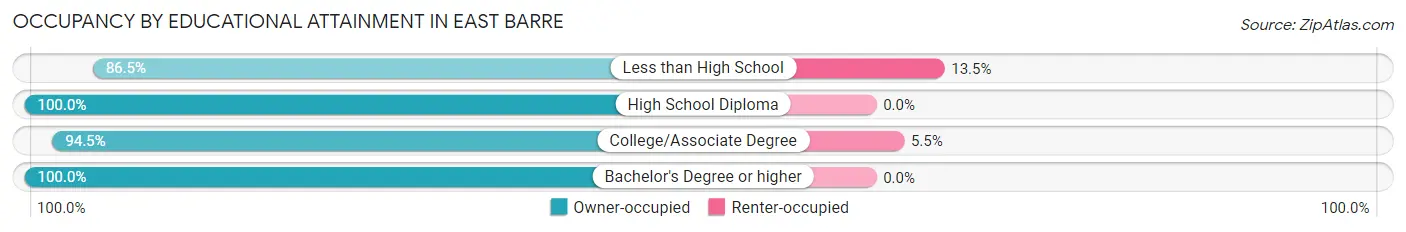
| Household Size | Owner-occupied | Renter-occupied |
| Less than High School | 64 (86.5%) | 10 (13.5%) |
| High School Diploma | 81 (100.0%) | 0 (0.0%) |
| College/Associate Degree | 120 (94.5%) | 7 (5.5%) |
| Bachelor's Degree or higher | 87 (100.0%) | 0 (0.0%) |
Occupancy by Age of Householder in East Barre
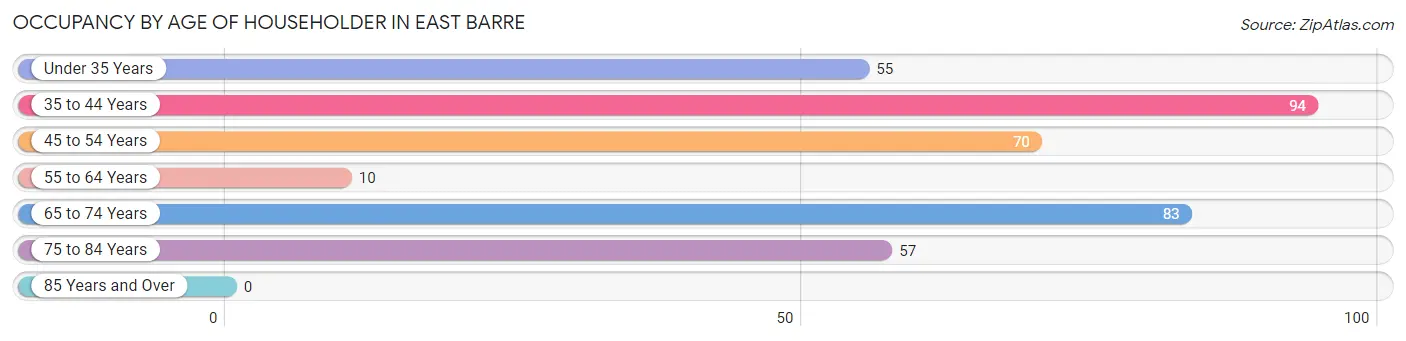
| Age Bracket | # Households | % Households |
| Under 35 Years | 55 | 14.9% |
| 35 to 44 Years | 94 | 25.5% |
| 45 to 54 Years | 70 | 19.0% |
| 55 to 64 Years | 10 | 2.7% |
| 65 to 74 Years | 83 | 22.5% |
| 75 to 84 Years | 57 | 15.4% |
| 85 Years and Over | 0 | 0.0% |
| Total | 369 | 100.0% |
Housing Finances in East Barre
Median Income by Occupancy in East Barre
| Occupancy Type | # Households | Median Income |
| Owner-Occupied | 352 (95.4%) | $0 |
| Renter-Occupied | 17 (4.6%) | $0 |
| Average | 369 (100.0%) | $0 |
Occupancy by Householder Income Bracket in East Barre
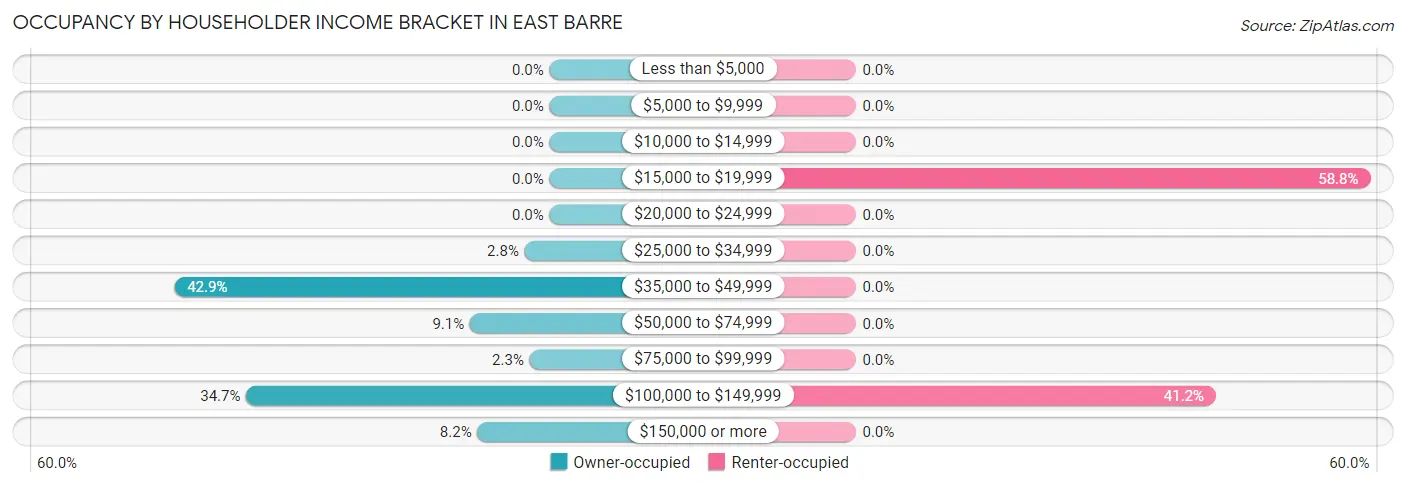
| Income Bracket | Owner-occupied | Renter-occupied |
| Less than $5,000 | 0 (0.0%) | 0 (0.0%) |
| $5,000 to $9,999 | 0 (0.0%) | 0 (0.0%) |
| $10,000 to $14,999 | 0 (0.0%) | 0 (0.0%) |
| $15,000 to $19,999 | 0 (0.0%) | 10 (58.8%) |
| $20,000 to $24,999 | 0 (0.0%) | 0 (0.0%) |
| $25,000 to $34,999 | 10 (2.8%) | 0 (0.0%) |
| $35,000 to $49,999 | 151 (42.9%) | 0 (0.0%) |
| $50,000 to $74,999 | 32 (9.1%) | 0 (0.0%) |
| $75,000 to $99,999 | 8 (2.3%) | 0 (0.0%) |
| $100,000 to $149,999 | 122 (34.7%) | 7 (41.2%) |
| $150,000 or more | 29 (8.2%) | 0 (0.0%) |
| Total | 352 (100.0%) | 17 (100.0%) |
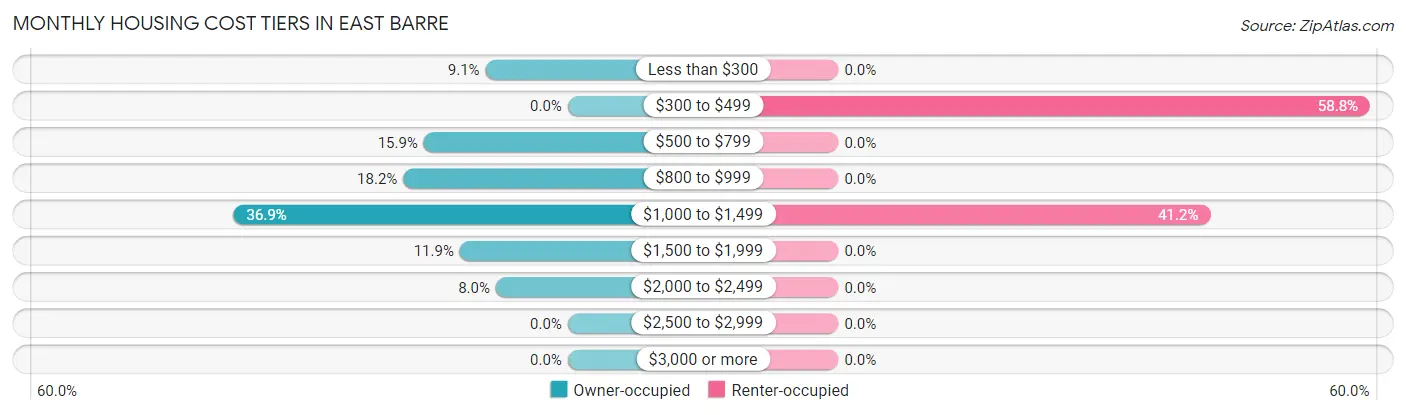
Monthly Housing Cost Tiers in East Barre
| Monthly Cost | Owner-occupied | Renter-occupied |
| Less than $300 | 32 (9.1%) | 0 (0.0%) |
| $300 to $499 | 0 (0.0%) | 10 (58.8%) |
| $500 to $799 | 56 (15.9%) | 0 (0.0%) |
| $800 to $999 | 64 (18.2%) | 0 (0.0%) |
| $1,000 to $1,499 | 130 (36.9%) | 7 (41.2%) |
| $1,500 to $1,999 | 42 (11.9%) | 0 (0.0%) |
| $2,000 to $2,499 | 28 (8.0%) | 0 (0.0%) |
| $2,500 to $2,999 | 0 (0.0%) | 0 (0.0%) |
| $3,000 or more | 0 (0.0%) | 0 (0.0%) |
| Total | 352 (100.0%) | 17 (100.0%) |
Physical Housing Characteristics in East Barre
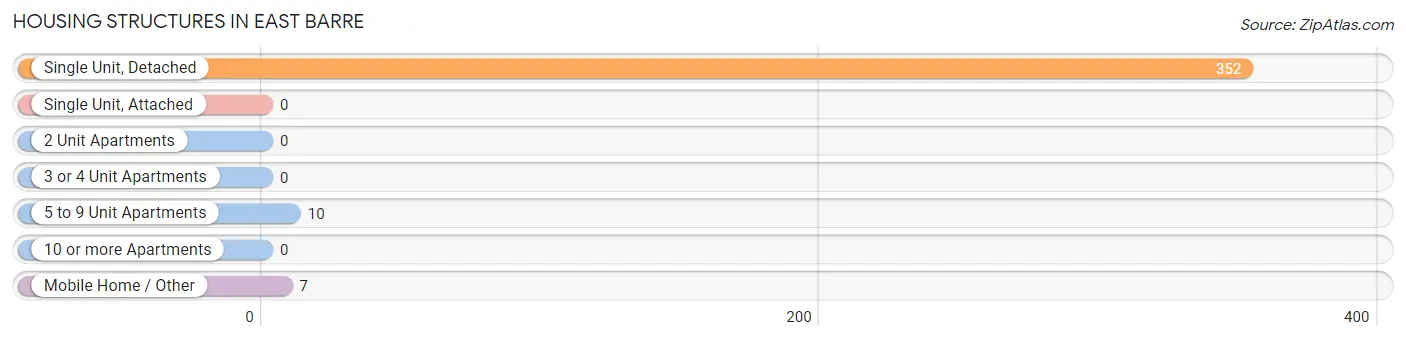
Housing Structures in East Barre
| Structure Type | # Housing Units | % Housing Units |
| Single Unit, Detached | 352 | 95.4% |
| Single Unit, Attached | 0 | 0.0% |
| 2 Unit Apartments | 0 | 0.0% |
| 3 or 4 Unit Apartments | 0 | 0.0% |
| 5 to 9 Unit Apartments | 10 | 2.7% |
| 10 or more Apartments | 0 | 0.0% |
| Mobile Home / Other | 7 | 1.9% |
| Total | 369 | 100.0% |
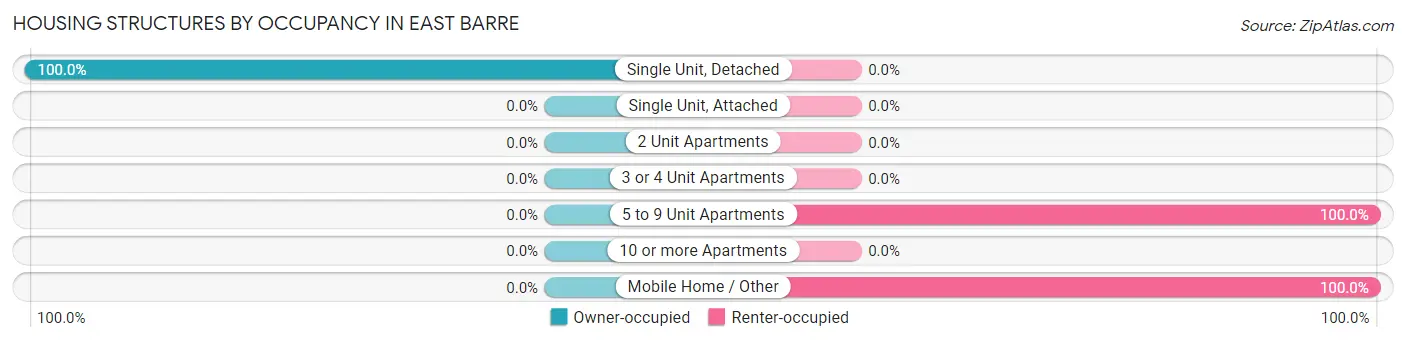
Housing Structures by Occupancy in East Barre
| Structure Type | Owner-occupied | Renter-occupied |
| Single Unit, Detached | 352 (100.0%) | 0 (0.0%) |
| Single Unit, Attached | 0 (0.0%) | 0 (0.0%) |
| 2 Unit Apartments | 0 (0.0%) | 0 (0.0%) |
| 3 or 4 Unit Apartments | 0 (0.0%) | 0 (0.0%) |
| 5 to 9 Unit Apartments | 0 (0.0%) | 10 (100.0%) |
| 10 or more Apartments | 0 (0.0%) | 0 (0.0%) |
| Mobile Home / Other | 0 (0.0%) | 7 (100.0%) |
| Total | 352 (95.4%) | 17 (4.6%) |
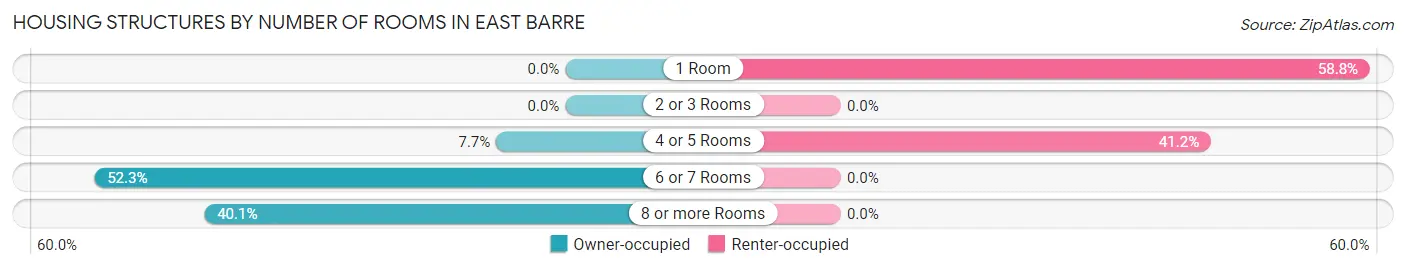
Housing Structures by Number of Rooms in East Barre
| Number of Rooms | Owner-occupied | Renter-occupied |
| 1 Room | 0 (0.0%) | 10 (58.8%) |
| 2 or 3 Rooms | 0 (0.0%) | 0 (0.0%) |
| 4 or 5 Rooms | 27 (7.7%) | 7 (41.2%) |
| 6 or 7 Rooms | 184 (52.3%) | 0 (0.0%) |
| 8 or more Rooms | 141 (40.1%) | 0 (0.0%) |
| Total | 352 (100.0%) | 17 (100.0%) |
Housing Structure by Heating Type in East Barre
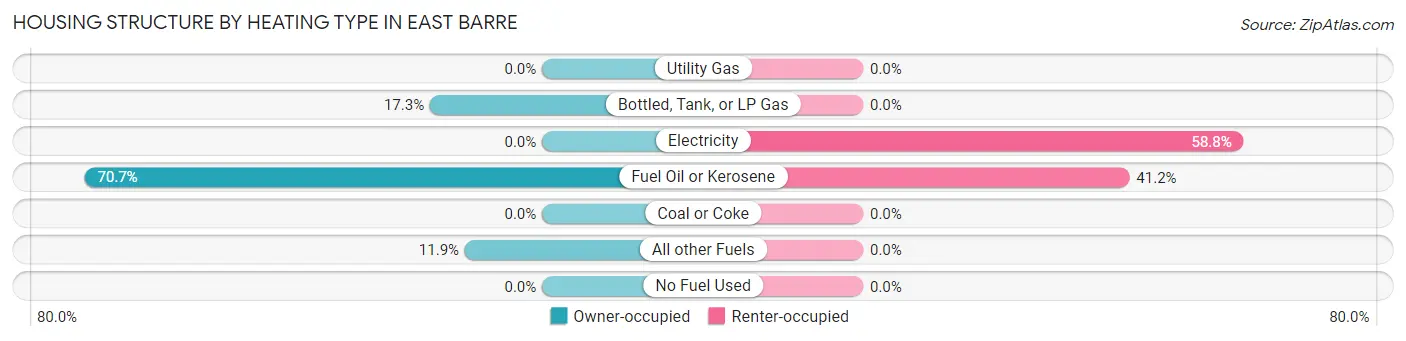
| Heating Type | Owner-occupied | Renter-occupied |
| Utility Gas | 0 (0.0%) | 0 (0.0%) |
| Bottled, Tank, or LP Gas | 61 (17.3%) | 0 (0.0%) |
| Electricity | 0 (0.0%) | 10 (58.8%) |
| Fuel Oil or Kerosene | 249 (70.7%) | 7 (41.2%) |
| Coal or Coke | 0 (0.0%) | 0 (0.0%) |
| All other Fuels | 42 (11.9%) | 0 (0.0%) |
| No Fuel Used | 0 (0.0%) | 0 (0.0%) |
| Total | 352 (100.0%) | 17 (100.0%) |
Household Vehicle Usage in East Barre
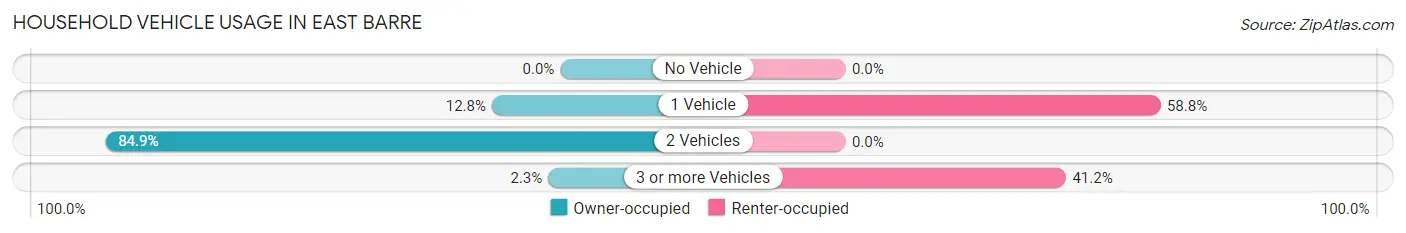
| Vehicles per Household | Owner-occupied | Renter-occupied |
| No Vehicle | 0 (0.0%) | 0 (0.0%) |
| 1 Vehicle | 45 (12.8%) | 10 (58.8%) |
| 2 Vehicles | 299 (84.9%) | 0 (0.0%) |
| 3 or more Vehicles | 8 (2.3%) | 7 (41.2%) |
| Total | 352 (100.0%) | 17 (100.0%) |
Real Estate & Mortgages in East Barre
Real Estate and Mortgage Overview in East Barre
| Characteristic | Without Mortgage | With Mortgage |
| Housing Units | 149 | 203 |
| Median Property Value | - | - |
| Median Household Income | $46,397 | $29 |
| Monthly Housing Costs | $685 | $0 |
| Real Estate Taxes | $6,224 | $0 |
Property Value by Mortgage Status in East Barre
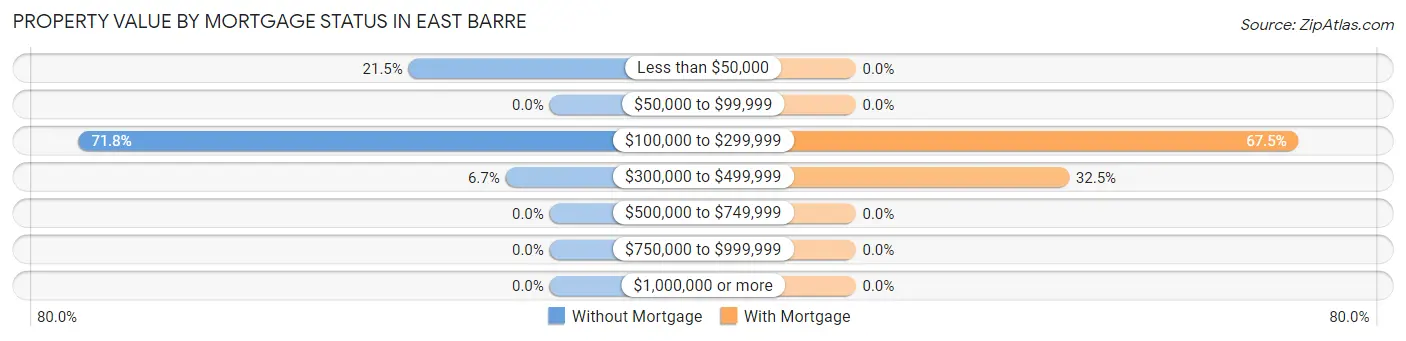
| Property Value | Without Mortgage | With Mortgage |
| Less than $50,000 | 32 (21.5%) | 0 (0.0%) |
| $50,000 to $99,999 | 0 (0.0%) | 0 (0.0%) |
| $100,000 to $299,999 | 107 (71.8%) | 137 (67.5%) |
| $300,000 to $499,999 | 10 (6.7%) | 66 (32.5%) |
| $500,000 to $749,999 | 0 (0.0%) | 0 (0.0%) |
| $750,000 to $999,999 | 0 (0.0%) | 0 (0.0%) |
| $1,000,000 or more | 0 (0.0%) | 0 (0.0%) |
| Total | 149 (100.0%) | 203 (100.0%) |
Household Income by Mortgage Status in East Barre
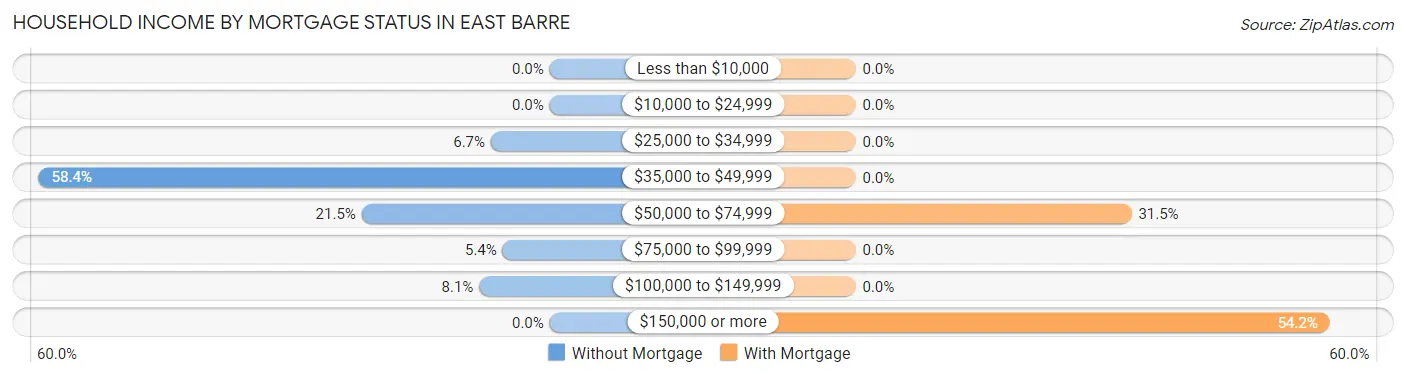
| Household Income | Without Mortgage | With Mortgage |
| Less than $10,000 | 0 (0.0%) | 0 (0.0%) |
| $10,000 to $24,999 | 0 (0.0%) | 0 (0.0%) |
| $25,000 to $34,999 | 10 (6.7%) | 0 (0.0%) |
| $35,000 to $49,999 | 87 (58.4%) | 0 (0.0%) |
| $50,000 to $74,999 | 32 (21.5%) | 64 (31.5%) |
| $75,000 to $99,999 | 8 (5.4%) | 0 (0.0%) |
| $100,000 to $149,999 | 12 (8.1%) | 0 (0.0%) |
| $150,000 or more | 0 (0.0%) | 110 (54.2%) |
| Total | 149 (100.0%) | 203 (100.0%) |
Property Value to Household Income Ratio in East Barre
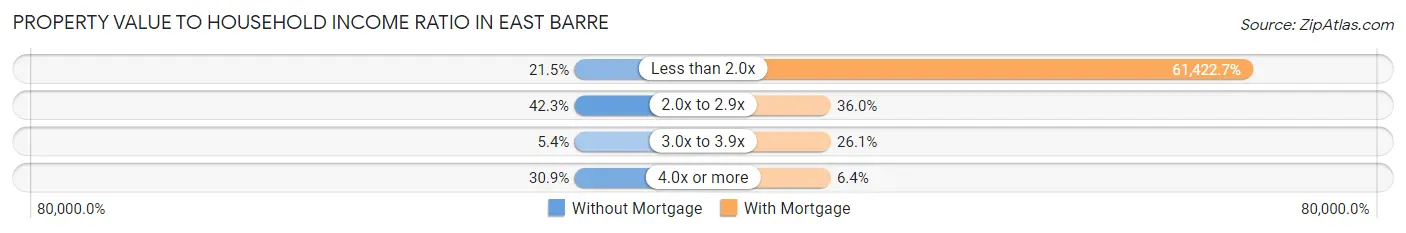
| Value-to-Income Ratio | Without Mortgage | With Mortgage |
| Less than 2.0x | 32 (21.5%) | 124,688 (61,422.7%) |
| 2.0x to 2.9x | 63 (42.3%) | 73 (36.0%) |
| 3.0x to 3.9x | 8 (5.4%) | 53 (26.1%) |
| 4.0x or more | 46 (30.9%) | 13 (6.4%) |
| Total | 149 (100.0%) | 203 (100.0%) |
Real Estate Taxes by Mortgage Status in East Barre
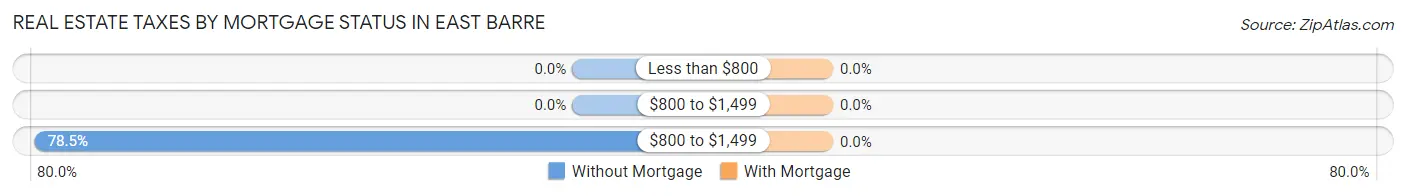
| Property Taxes | Without Mortgage | With Mortgage |
| Less than $800 | 0 (0.0%) | 0 (0.0%) |
| $800 to $1,499 | 0 (0.0%) | 0 (0.0%) |
| $800 to $1,499 | 117 (78.5%) | 0 (0.0%) |
| Total | 149 (100.0%) | 203 (100.0%) |
Health & Disability in East Barre
Health Insurance Coverage by Age in East Barre
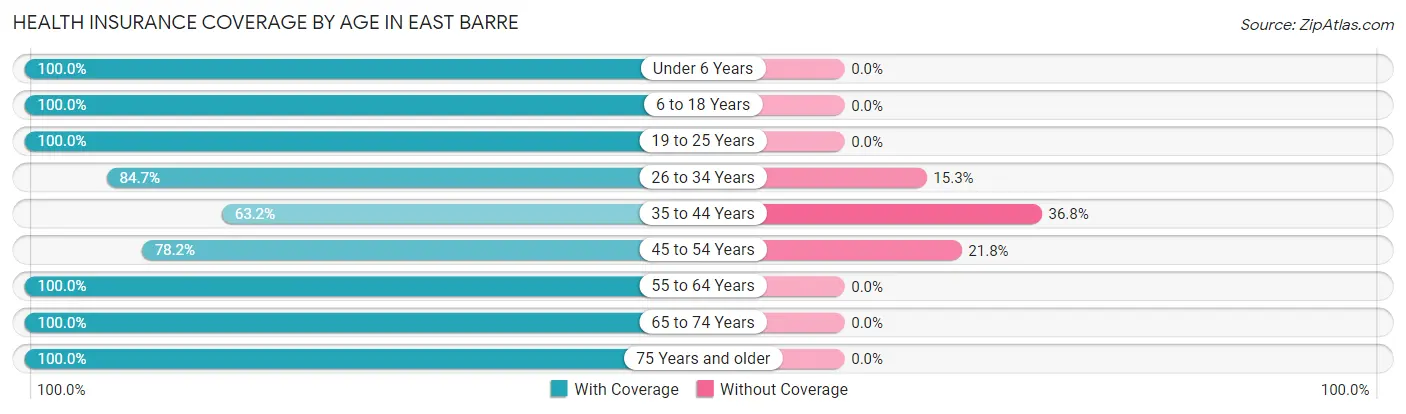
| Age Bracket | With Coverage | Without Coverage |
| Under 6 Years | 163 (100.0%) | 0 (0.0%) |
| 6 to 18 Years | 235 (100.0%) | 0 (0.0%) |
| 19 to 25 Years | 59 (100.0%) | 0 (0.0%) |
| 26 to 34 Years | 83 (84.7%) | 15 (15.3%) |
| 35 to 44 Years | 110 (63.2%) | 64 (36.8%) |
| 45 to 54 Years | 161 (78.2%) | 45 (21.8%) |
| 55 to 64 Years | 22 (100.0%) | 0 (0.0%) |
| 65 to 74 Years | 91 (100.0%) | 0 (0.0%) |
| 75 Years and older | 88 (100.0%) | 0 (0.0%) |
| Total | 1,012 (89.1%) | 124 (10.9%) |
Health Insurance Coverage by Citizenship Status in East Barre
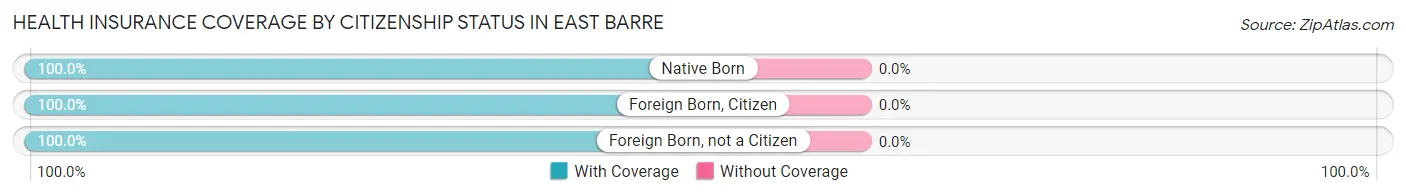
| Citizenship Status | With Coverage | Without Coverage |
| Native Born | 163 (100.0%) | 0 (0.0%) |
| Foreign Born, Citizen | 235 (100.0%) | 0 (0.0%) |
| Foreign Born, not a Citizen | 59 (100.0%) | 0 (0.0%) |
Health Insurance Coverage by Household Income in East Barre
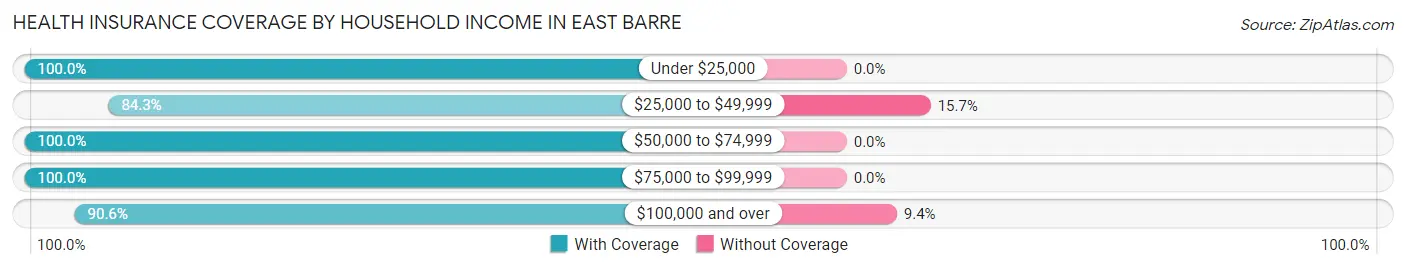
| Household Income | With Coverage | Without Coverage |
| Under $25,000 | 10 (100.0%) | 0 (0.0%) |
| $25,000 to $49,999 | 343 (84.3%) | 64 (15.7%) |
| $50,000 to $74,999 | 63 (100.0%) | 0 (0.0%) |
| $75,000 to $99,999 | 16 (100.0%) | 0 (0.0%) |
| $100,000 and over | 580 (90.6%) | 60 (9.4%) |
Public vs Private Health Insurance Coverage by Age in East Barre
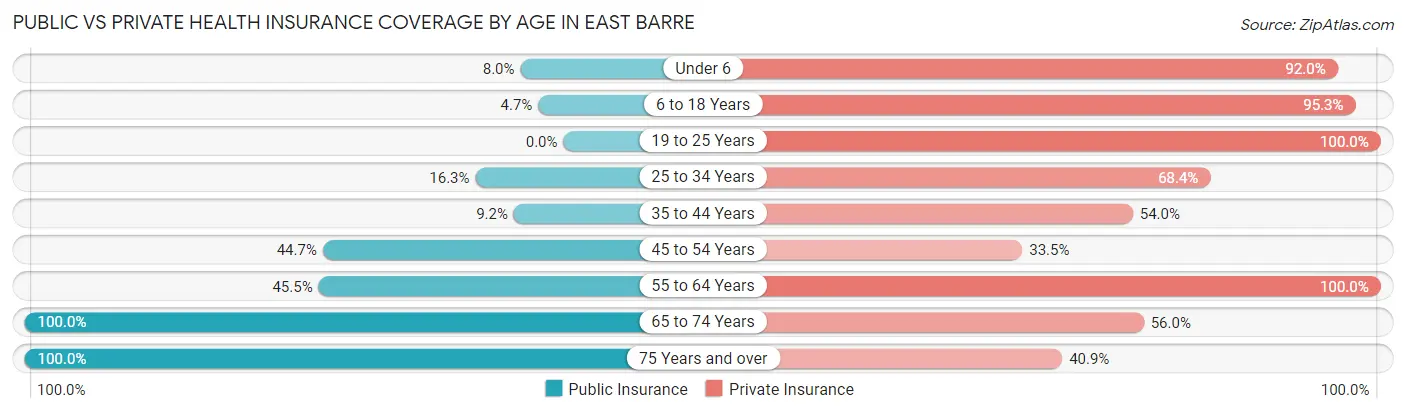
| Age Bracket | Public Insurance | Private Insurance |
| Under 6 | 13 (8.0%) | 150 (92.0%) |
| 6 to 18 Years | 11 (4.7%) | 224 (95.3%) |
| 19 to 25 Years | 0 (0.0%) | 59 (100.0%) |
| 25 to 34 Years | 16 (16.3%) | 67 (68.4%) |
| 35 to 44 Years | 16 (9.2%) | 94 (54.0%) |
| 45 to 54 Years | 92 (44.7%) | 69 (33.5%) |
| 55 to 64 Years | 10 (45.5%) | 22 (100.0%) |
| 65 to 74 Years | 91 (100.0%) | 51 (56.0%) |
| 75 Years and over | 88 (100.0%) | 36 (40.9%) |
| Total | 337 (29.7%) | 772 (68.0%) |
Disability Status by Sex by Age in East Barre
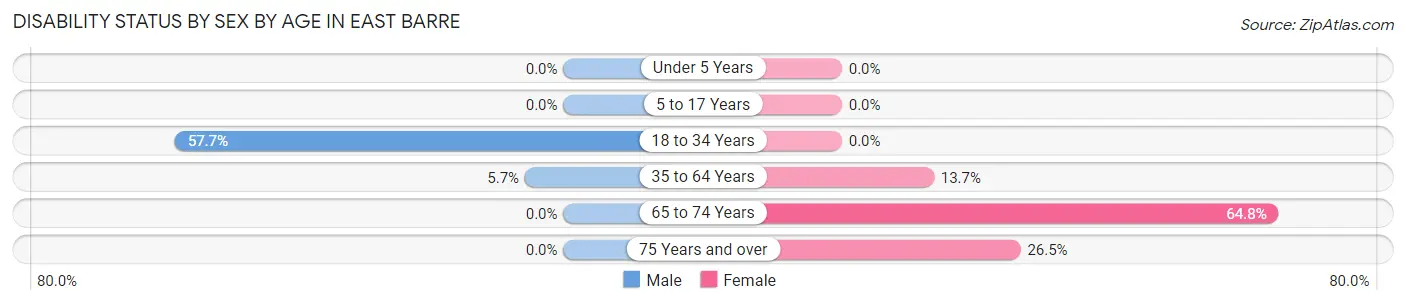
| Age Bracket | Male | Female |
| Under 5 Years | 0 (0.0%) | 0 (0.0%) |
| 5 to 17 Years | 0 (0.0%) | 0 (0.0%) |
| 18 to 34 Years | 75 (57.7%) | 0 (0.0%) |
| 35 to 64 Years | 10 (5.7%) | 31 (13.7%) |
| 65 to 74 Years | 0 (0.0%) | 59 (64.8%) |
| 75 Years and over | 0 (0.0%) | 13 (26.5%) |
Disability Class by Sex by Age in East Barre
Disability Class: Hearing Difficulty
| Age Bracket | Male | Female |
| Under 5 Years | 0 (0.0%) | 0 (0.0%) |
| 5 to 17 Years | 0 (0.0%) | 0 (0.0%) |
| 18 to 34 Years | 0 (0.0%) | 0 (0.0%) |
| 35 to 64 Years | 0 (0.0%) | 0 (0.0%) |
| 65 to 74 Years | 0 (0.0%) | 0 (0.0%) |
| 75 Years and over | 0 (0.0%) | 0 (0.0%) |
Disability Class: Vision Difficulty
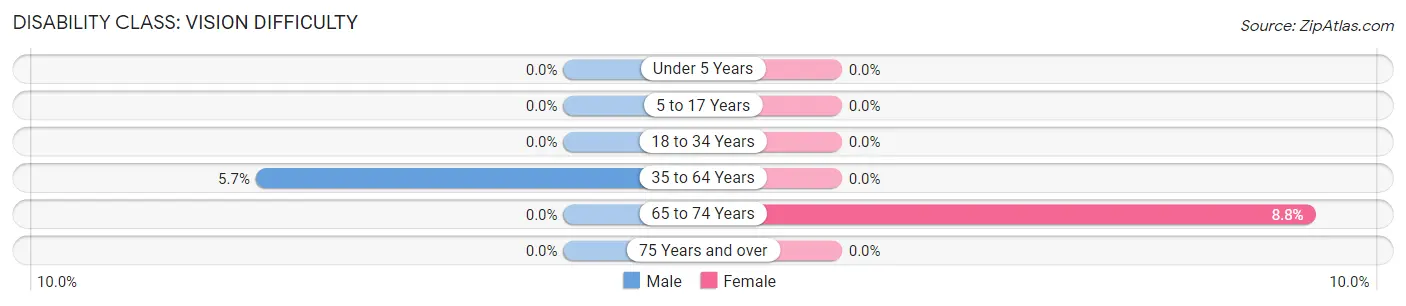
| Age Bracket | Male | Female |
| Under 5 Years | 0 (0.0%) | 0 (0.0%) |
| 5 to 17 Years | 0 (0.0%) | 0 (0.0%) |
| 18 to 34 Years | 0 (0.0%) | 0 (0.0%) |
| 35 to 64 Years | 10 (5.7%) | 0 (0.0%) |
| 65 to 74 Years | 0 (0.0%) | 8 (8.8%) |
| 75 Years and over | 0 (0.0%) | 0 (0.0%) |
Disability Class: Cognitive Difficulty
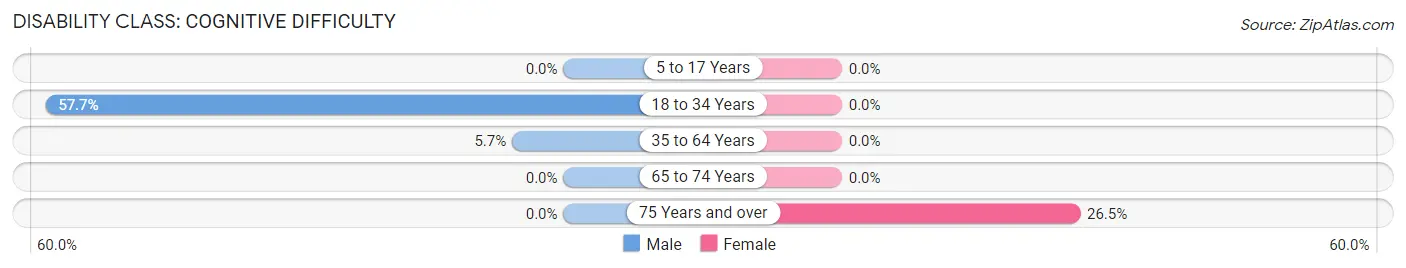
| Age Bracket | Male | Female |
| 5 to 17 Years | 0 (0.0%) | 0 (0.0%) |
| 18 to 34 Years | 75 (57.7%) | 0 (0.0%) |
| 35 to 64 Years | 10 (5.7%) | 0 (0.0%) |
| 65 to 74 Years | 0 (0.0%) | 0 (0.0%) |
| 75 Years and over | 0 (0.0%) | 13 (26.5%) |
Disability Class: Ambulatory Difficulty
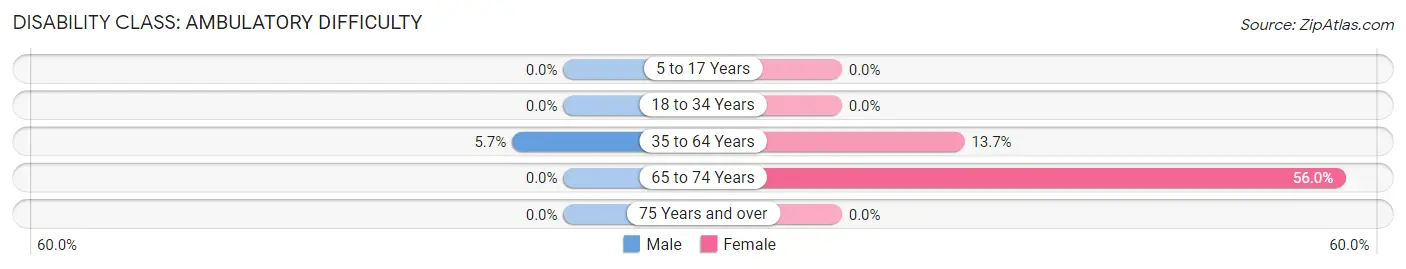
| Age Bracket | Male | Female |
| 5 to 17 Years | 0 (0.0%) | 0 (0.0%) |
| 18 to 34 Years | 0 (0.0%) | 0 (0.0%) |
| 35 to 64 Years | 10 (5.7%) | 31 (13.7%) |
| 65 to 74 Years | 0 (0.0%) | 51 (56.0%) |
| 75 Years and over | 0 (0.0%) | 0 (0.0%) |
Disability Class: Self-Care Difficulty
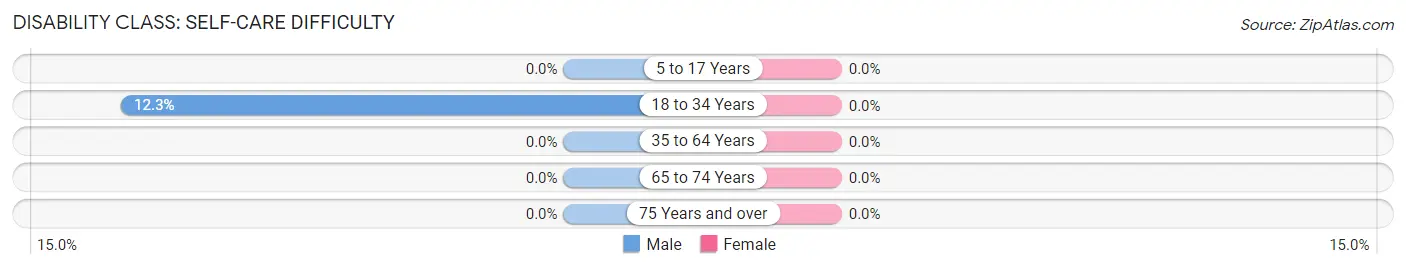
| Age Bracket | Male | Female |
| 5 to 17 Years | 0 (0.0%) | 0 (0.0%) |
| 18 to 34 Years | 16 (12.3%) | 0 (0.0%) |
| 35 to 64 Years | 0 (0.0%) | 0 (0.0%) |
| 65 to 74 Years | 0 (0.0%) | 0 (0.0%) |
| 75 Years and over | 0 (0.0%) | 0 (0.0%) |
Technology Access in East Barre
Computing Device Access in East Barre
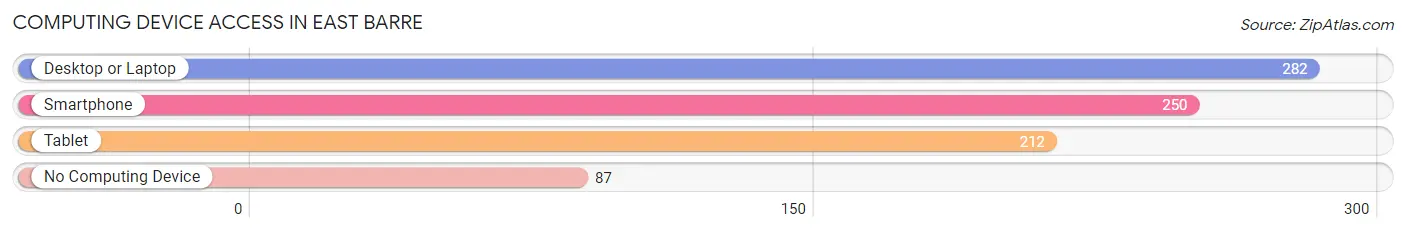
| Device Type | # Households | % Households |
| Desktop or Laptop | 282 | 76.4% |
| Smartphone | 250 | 67.7% |
| Tablet | 212 | 57.5% |
| No Computing Device | 87 | 23.6% |
| Total | 369 | 100.0% |
Internet Access in East Barre
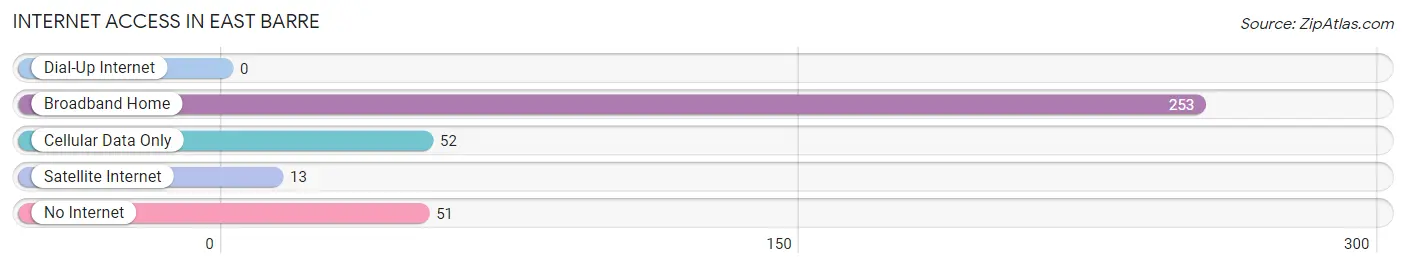
| Internet Type | # Households | % Households |
| Dial-Up Internet | 0 | 0.0% |
| Broadband Home | 253 | 68.6% |
| Cellular Data Only | 52 | 14.1% |
| Satellite Internet | 13 | 3.5% |
| No Internet | 51 | 13.8% |
| Total | 369 | 100.0% |
East Barre Summary
History
East Barre is a small town located in Washington County, Vermont. It is situated in the heart of the Green Mountains, and is part of the Barre-Montpelier metropolitan area. The town was first settled in 1790 by a group of settlers from Massachusetts. The town was originally known as East Montpelier, but was later changed to East Barre in 1820.
The town was an important center of industry in the 19th century, with several granite quarries and a number of factories. The quarries provided the granite for many of the buildings in the area, including the State House in Montpelier. The factories produced a variety of products, including furniture, tools, and textiles.
The town was also home to a number of prominent figures in Vermont history. The most famous of these was General William Wells, who served as a Union general during the Civil War. He was born in East Barre in 1825, and is buried in the town cemetery.
Geography
East Barre is located in the heart of the Green Mountains, and is part of the Barre-Montpelier metropolitan area. The town is situated on the Winooski River, and is bordered by the towns of Berlin, Calais, and Montpelier. The town is located at an elevation of 1,000 feet, and has a total area of 8.2 square miles.
The town is located in a rural area, and is surrounded by forests and rolling hills. The town is home to several small lakes, including Lake Elmore and Lake Elmore State Park. The town is also home to several small streams, including the Winooski River.
Economy
East Barre is a small town with a population of just over 1,000 people. The town is primarily a bedroom community, with most of its residents commuting to nearby towns and cities for work. The town is home to several small businesses, including a few restaurants, a grocery store, and a few retail stores.
The town is also home to several granite quarries, which provide the granite for many of the buildings in the area. The quarries are also a major source of employment for the town.
Demographics
As of the 2010 census, the population of East Barre was 1,072. The racial makeup of the town was 97.3% White, 0.7% African American, 0.3% Native American, 0.2% Asian, 0.1% Pacific Islander, and 1.4% from other races. The median household income was $45,000, and the median family income was $50,000. The per capita income was $20,000. The town had a poverty rate of 8.3%.
Common Questions
What is the Total Population of East Barre?
Total Population of East Barre is 1,136.
What is the Total Male Population of East Barre?
Total Male Population of East Barre is 605.
What is the Total Female Population of East Barre?
Total Female Population of East Barre is 531.
What is the Ratio of Males per 100 Females in East Barre?
There are 113.94 Males per 100 Females in East Barre.
What is the Ratio of Females per 100 Males in East Barre?
There are 87.77 Females per 100 Males in East Barre.
What is the Median Population Age in East Barre?
Median Population Age in East Barre is 36.2 Years.
What is the Average Family Size in East Barre
Average Family Size in East Barre is 3.4 People.
What is the Average Household Size in East Barre
Average Household Size in East Barre is 3.1 People.
What is Per Capita Income in East Barre?
Per Capita income in East Barre is $27,875.
What is the Median Family Income in East Barre?
Median Family Income in East Barre is $84,417.
What is Inequality or Gini Index in East Barre?
Inequality or Gini Index in East Barre is 0.30.
How Large is the Labor Force in East Barre?
There are 526 People in the Labor Forcein in East Barre.
What is the Percentage of People in the Labor Force in East Barre?
70.6% of People are in the Labor Force in East Barre.
What is the Unemployment Rate in East Barre?
Unemployment Rate in East Barre is 11.2%.