West Rutland, VT
West Rutland Map
West Rutland Overview
2,222
TOTAL POPULATION
982
MALE POPULATION
1,240
FEMALE POPULATION
79.19
MALES / 100 FEMALES
126.27
FEMALES / 100 MALES
43.1
MEDIAN AGE
3.2
AVG FAMILY SIZE
2.3
AVG HOUSEHOLD SIZE
$31,857
PER CAPITA INCOME
$62,321
AVG FAMILY INCOME
$47,381
AVG HOUSEHOLD INCOME
0.8%
WAGE / INCOME GAP [ % ]
99.2¢/ $1
WAGE / INCOME GAP [ $ ]
0.41
INEQUALITY / GINI INDEX
1,106
LABOR FORCE [ PEOPLE ]
61.9%
PERCENT IN LABOR FORCE
1.5%
UNEMPLOYMENT RATE
West Rutland Zip Codes
West Rutland Area Codes
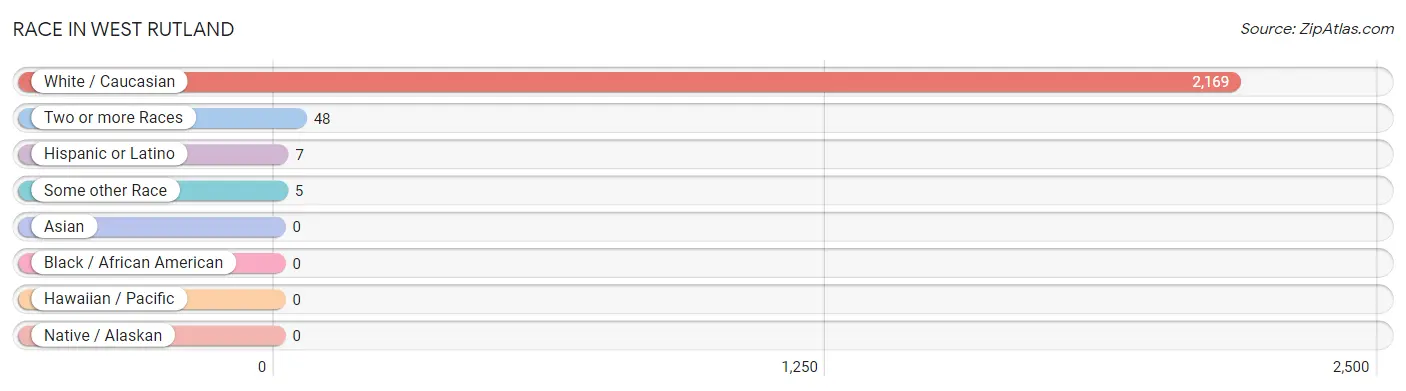
Race in West Rutland
The most populous races in West Rutland are White / Caucasian (2,169 | 97.6%), Two or more Races (48 | 2.2%), and Hispanic or Latino (7 | 0.3%).
| Race | # Population | % Population |
| Asian | 0 | 0.0% |
| Black / African American | 0 | 0.0% |
| Hawaiian / Pacific | 0 | 0.0% |
| Hispanic or Latino | 7 | 0.3% |
| Native / Alaskan | 0 | 0.0% |
| White / Caucasian | 2,169 | 97.6% |
| Two or more Races | 48 | 2.2% |
| Some other Race | 5 | 0.2% |
| Total | 2,222 | 100.0% |
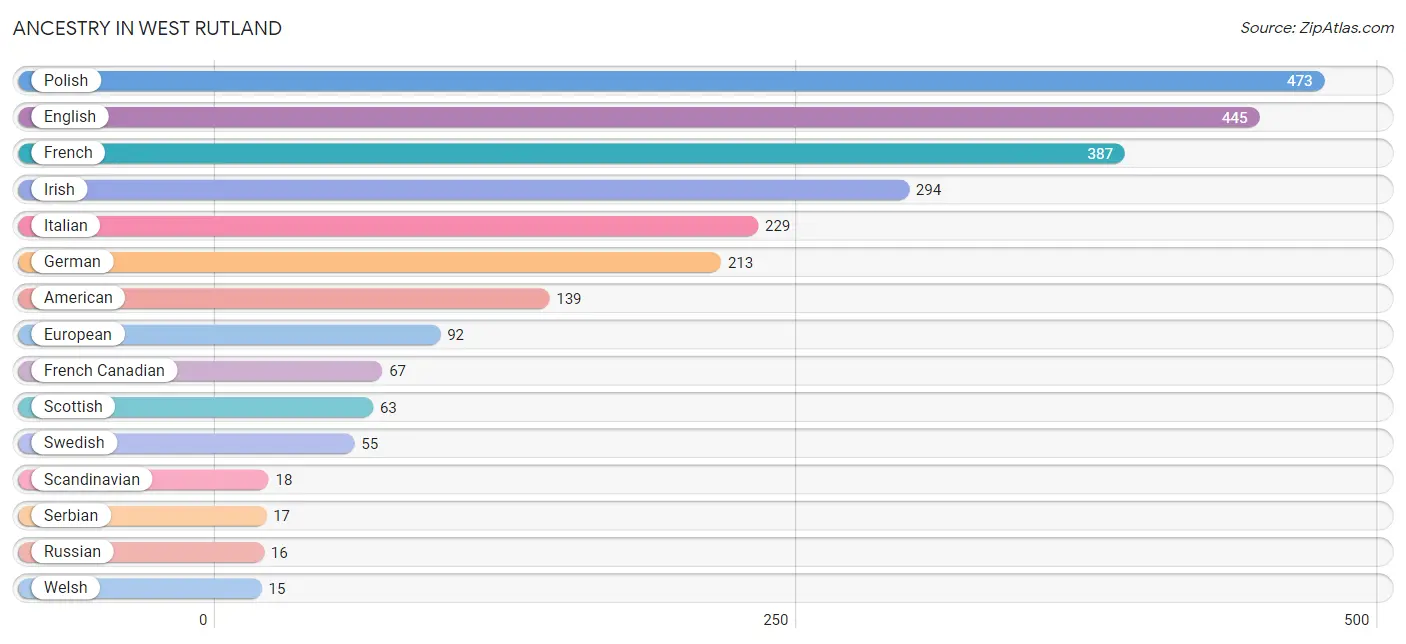
Ancestry in West Rutland
The most populous ancestries reported in West Rutland are Polish (473 | 21.3%), English (445 | 20.0%), French (387 | 17.4%), Irish (294 | 13.2%), and Italian (229 | 10.3%), together accounting for 82.3% of all West Rutland residents.
| Ancestry | # Population | % Population |
| American | 139 | 6.3% |
| Brazilian | 11 | 0.5% |
| Czechoslovakian | 3 | 0.1% |
| English | 445 | 20.0% |
| European | 92 | 4.1% |
| French | 387 | 17.4% |
| French Canadian | 67 | 3.0% |
| German | 213 | 9.6% |
| Irish | 294 | 13.2% |
| Iroquois | 4 | 0.2% |
| Italian | 229 | 10.3% |
| Norwegian | 8 | 0.4% |
| Polish | 473 | 21.3% |
| Portuguese | 6 | 0.3% |
| Russian | 16 | 0.7% |
| Scandinavian | 18 | 0.8% |
| Scotch-Irish | 4 | 0.2% |
| Scottish | 63 | 2.8% |
| Serbian | 17 | 0.8% |
| Spanish | 7 | 0.3% |
| Swedish | 55 | 2.5% |
| Welsh | 15 | 0.7% | View All 22 Rows |
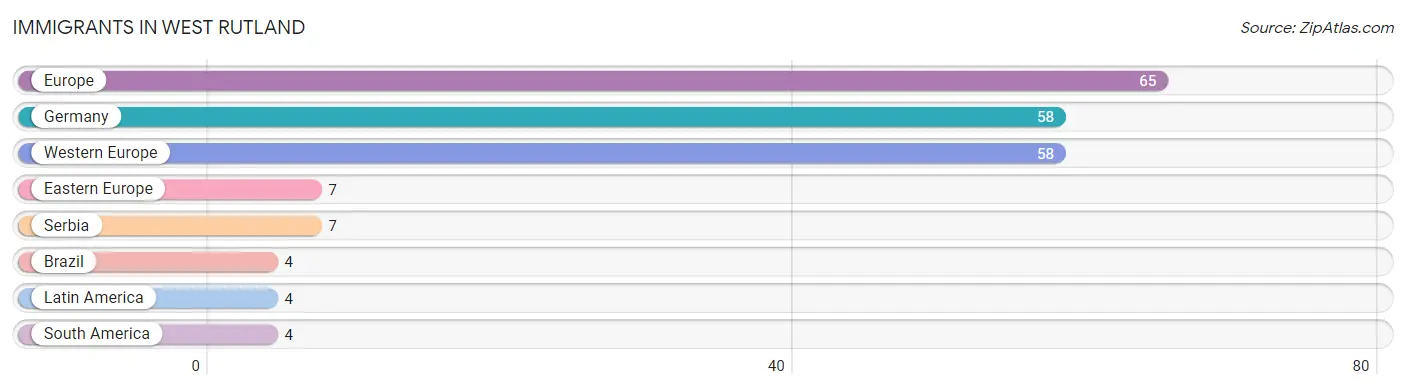
Immigrants in West Rutland
The most numerous immigrant groups reported in West Rutland came from Europe (65 | 2.9%), Germany (58 | 2.6%), Western Europe (58 | 2.6%), Eastern Europe (7 | 0.3%), and Serbia (7 | 0.3%), together accounting for 8.8% of all West Rutland residents.
| Immigration Origin | # Population | % Population |
| Brazil | 4 | 0.2% |
| Eastern Europe | 7 | 0.3% |
| Europe | 65 | 2.9% |
| Germany | 58 | 2.6% |
| Latin America | 4 | 0.2% |
| Serbia | 7 | 0.3% |
| South America | 4 | 0.2% |
| Western Europe | 58 | 2.6% | View All 8 Rows |
Sex and Age in West Rutland
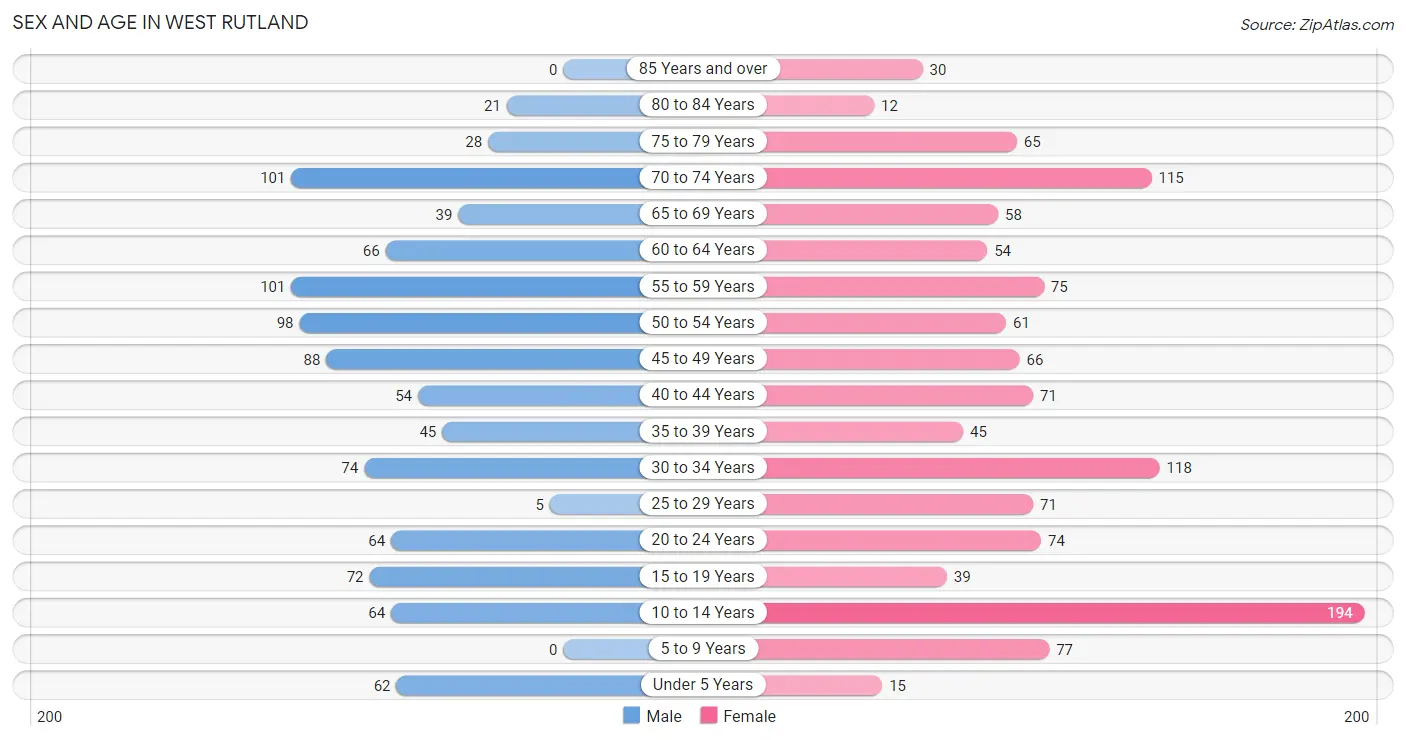
Sex and Age in West Rutland
The most populous age groups in West Rutland are 55 to 59 Years (101 | 10.3%) for men and 10 to 14 Years (194 | 15.7%) for women.
| Age Bracket | Male | Female |
| Under 5 Years | 62 (6.3%) | 15 (1.2%) |
| 5 to 9 Years | 0 (0.0%) | 77 (6.2%) |
| 10 to 14 Years | 64 (6.5%) | 194 (15.7%) |
| 15 to 19 Years | 72 (7.3%) | 39 (3.2%) |
| 20 to 24 Years | 64 (6.5%) | 74 (6.0%) |
| 25 to 29 Years | 5 (0.5%) | 71 (5.7%) |
| 30 to 34 Years | 74 (7.5%) | 118 (9.5%) |
| 35 to 39 Years | 45 (4.6%) | 45 (3.6%) |
| 40 to 44 Years | 54 (5.5%) | 71 (5.7%) |
| 45 to 49 Years | 88 (9.0%) | 66 (5.3%) |
| 50 to 54 Years | 98 (10.0%) | 61 (4.9%) |
| 55 to 59 Years | 101 (10.3%) | 75 (6.0%) |
| 60 to 64 Years | 66 (6.7%) | 54 (4.3%) |
| 65 to 69 Years | 39 (4.0%) | 58 (4.7%) |
| 70 to 74 Years | 101 (10.3%) | 115 (9.3%) |
| 75 to 79 Years | 28 (2.9%) | 65 (5.2%) |
| 80 to 84 Years | 21 (2.1%) | 12 (1.0%) |
| 85 Years and over | 0 (0.0%) | 30 (2.4%) |
| Total | 982 (100.0%) | 1,240 (100.0%) |
Families and Households in West Rutland
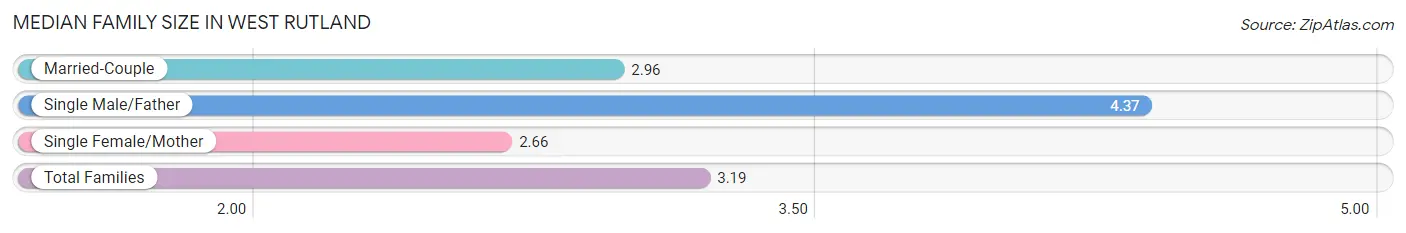
Median Family Size in West Rutland
The median family size in West Rutland is 3.19 persons per family, with single male/father families (101 | 19.0%) accounting for the largest median family size of 4.37 persons per family. On the other hand, single female/mother families (70 | 13.1%) represent the smallest median family size with 2.66 persons per family.
| Family Type | # Families | Family Size |
| Married-Couple | 362 (67.9%) | 2.96 |
| Single Male/Father | 101 (19.0%) | 4.37 |
| Single Female/Mother | 70 (13.1%) | 2.66 |
| Total Families | 533 (100.0%) | 3.19 |
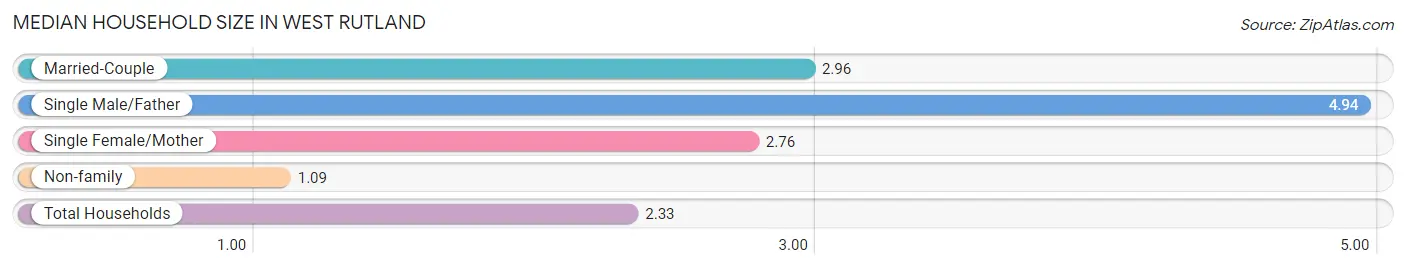
Median Household Size in West Rutland
The median household size in West Rutland is 2.33 persons per household, with single male/father households (101 | 10.6%) accounting for the largest median household size of 4.94 persons per household. non-family households (421 | 44.1%) represent the smallest median household size with 1.09 persons per household.
| Household Type | # Households | Household Size |
| Married-Couple | 362 (38.0%) | 2.96 |
| Single Male/Father | 101 (10.6%) | 4.94 |
| Single Female/Mother | 70 (7.3%) | 2.76 |
| Non-family | 421 (44.1%) | 1.09 |
| Total Households | 954 (100.0%) | 2.33 |
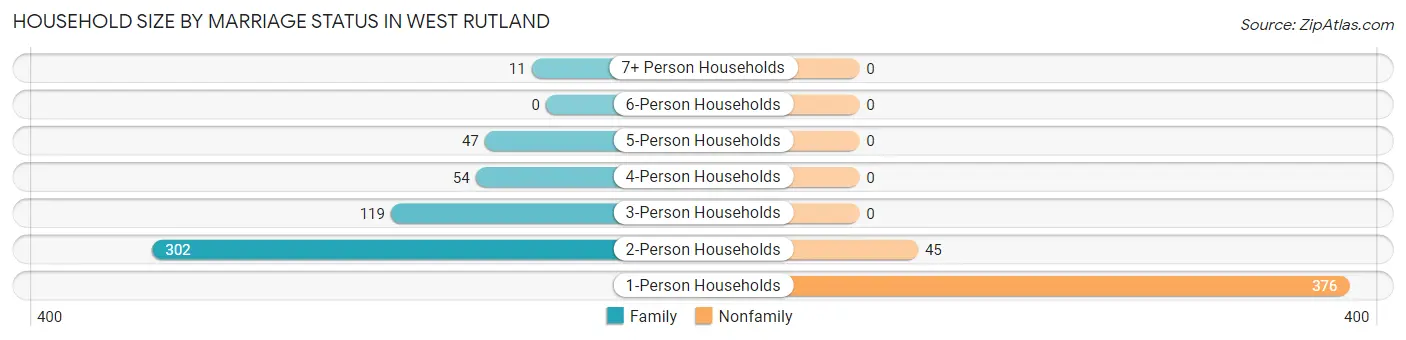
Household Size by Marriage Status in West Rutland
Out of a total of 954 households in West Rutland, 533 (55.9%) are family households, while 421 (44.1%) are nonfamily households. The most numerous type of family households are 2-person households, comprising 302, and the most common type of nonfamily households are 1-person households, comprising 376.
| Household Size | Family Households | Nonfamily Households |
| 1-Person Households | - | 376 (39.4%) |
| 2-Person Households | 302 (31.7%) | 45 (4.7%) |
| 3-Person Households | 119 (12.5%) | 0 (0.0%) |
| 4-Person Households | 54 (5.7%) | 0 (0.0%) |
| 5-Person Households | 47 (4.9%) | 0 (0.0%) |
| 6-Person Households | 0 (0.0%) | 0 (0.0%) |
| 7+ Person Households | 11 (1.1%) | 0 (0.0%) |
| Total | 533 (55.9%) | 421 (44.1%) |
Female Fertility in West Rutland
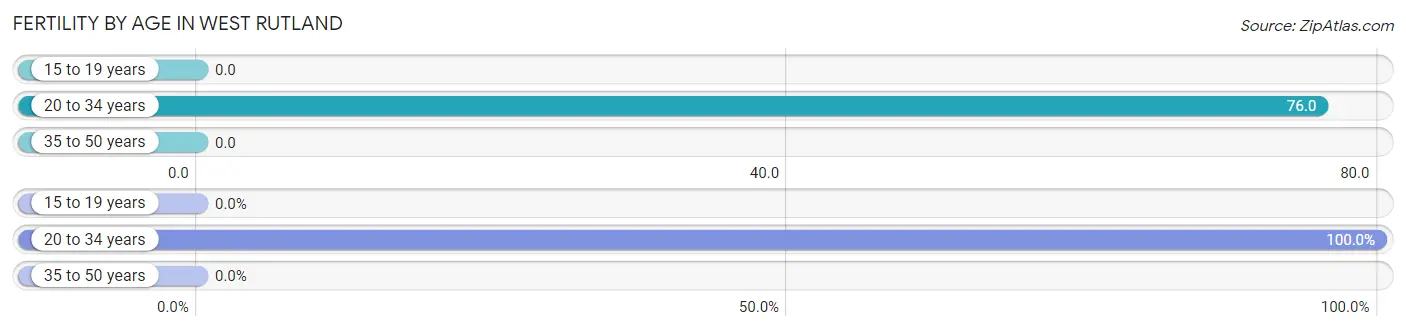
Fertility by Age in West Rutland
Average fertility rate in West Rutland is 38.0 births per 1,000 women. Women in the age bracket of 20 to 34 years have the highest fertility rate with 76.0 births per 1,000 women. Women in the age bracket of 20 to 34 years acount for 100.0% of all women with births.
| Age Bracket | Women with Births | Births / 1,000 Women |
| 15 to 19 years | 0 (0.0%) | 0.0 |
| 20 to 34 years | 20 (100.0%) | 76.0 |
| 35 to 50 years | 0 (0.0%) | 0.0 |
| Total | 20 (100.0%) | 38.0 |
Fertility by Age by Marriage Status in West Rutland
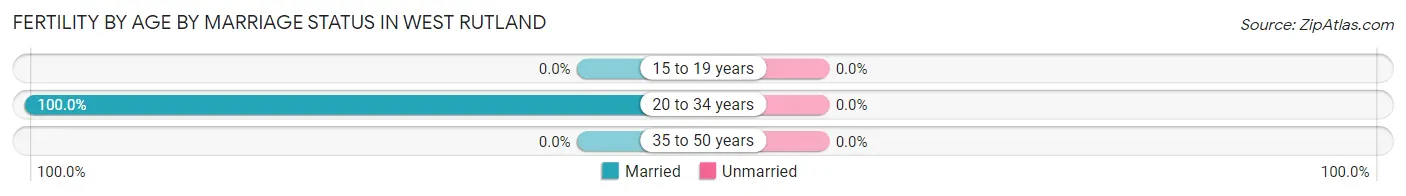
| Age Bracket | Married | Unmarried |
| 15 to 19 years | 0 (0.0%) | 0 (0.0%) |
| 20 to 34 years | 20 (100.0%) | 0 (0.0%) |
| 35 to 50 years | 0 (0.0%) | 0 (0.0%) |
| Total | 20 (100.0%) | 0 (0.0%) |
Fertility by Education in West Rutland
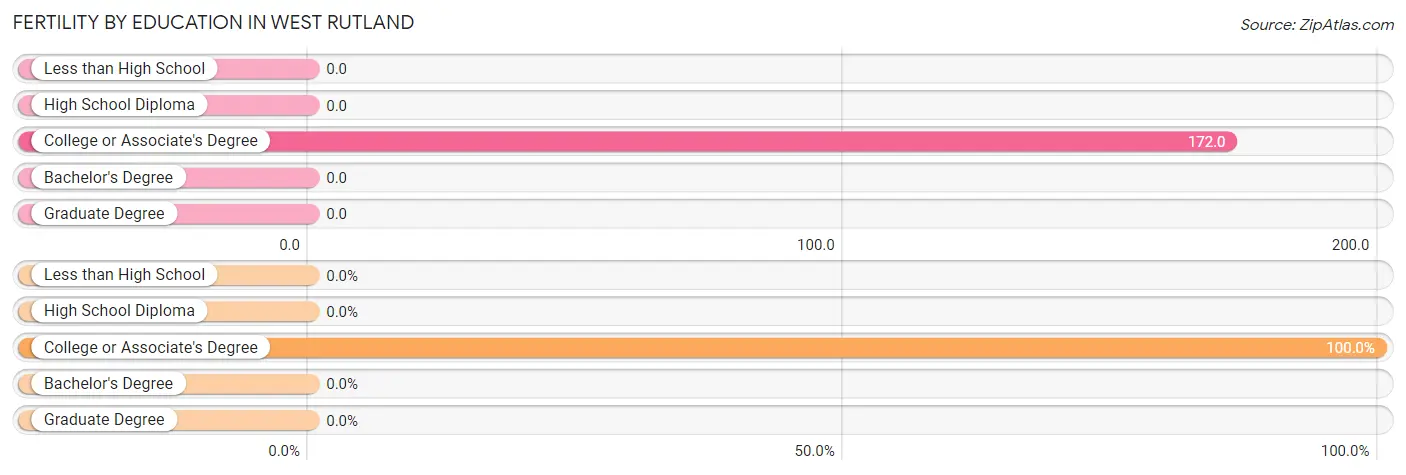
| Educational Attainment | Women with Births | Births / 1,000 Women |
| Less than High School | 0 (0.0%) | 0.0 |
| High School Diploma | 0 (0.0%) | 0.0 |
| College or Associate's Degree | 20 (100.0%) | 172.0 |
| Bachelor's Degree | 0 (0.0%) | 0.0 |
| Graduate Degree | 0 (0.0%) | 0.0 |
| Total | 20 (100.0%) | 38.0 |
Fertility by Education by Marriage Status in West Rutland
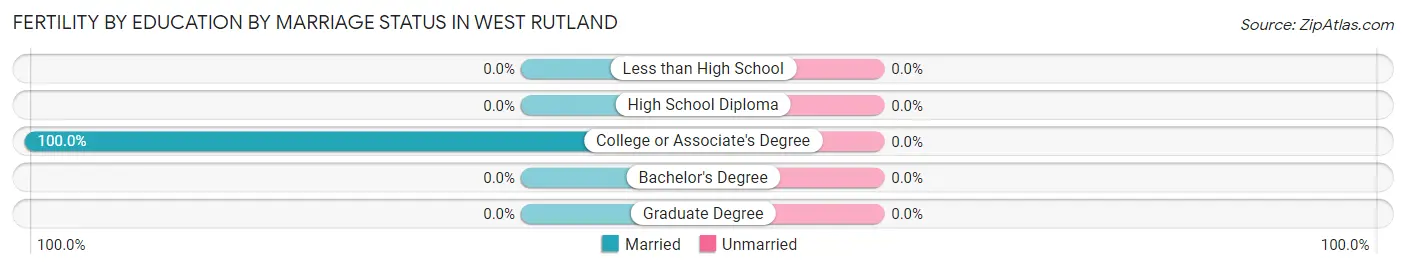
| Educational Attainment | Married | Unmarried |
| Less than High School | 0 (0.0%) | 0 (0.0%) |
| High School Diploma | 0 (0.0%) | 0 (0.0%) |
| College or Associate's Degree | 20 (100.0%) | 0 (0.0%) |
| Bachelor's Degree | 0 (0.0%) | 0 (0.0%) |
| Graduate Degree | 0 (0.0%) | 0 (0.0%) |
| Total | 20 (100.0%) | 0 (0.0%) |
Income in West Rutland
Income Overview in West Rutland
Per Capita Income in West Rutland is $31,857, while median incomes of families and households are $62,321 and $47,381 respectively.
| Characteristic | Number | Measure |
| Per Capita Income | 2,222 | $31,857 |
| Median Family Income | 533 | $62,321 |
| Mean Family Income | 533 | $85,965 |
| Median Household Income | 954 | $47,381 |
| Mean Household Income | 954 | $68,233 |
| Income Deficit | 533 | $0 |
| Wage / Income Gap (%) | 2,222 | 0.77% |
| Wage / Income Gap ($) | 2,222 | 99.23¢ per $1 |
| Gini / Inequality Index | 2,222 | 0.41 |
Earnings by Sex in West Rutland
Average Earnings in West Rutland are $40,577, $40,625 for men and $40,313 for women, a difference of 0.8%.
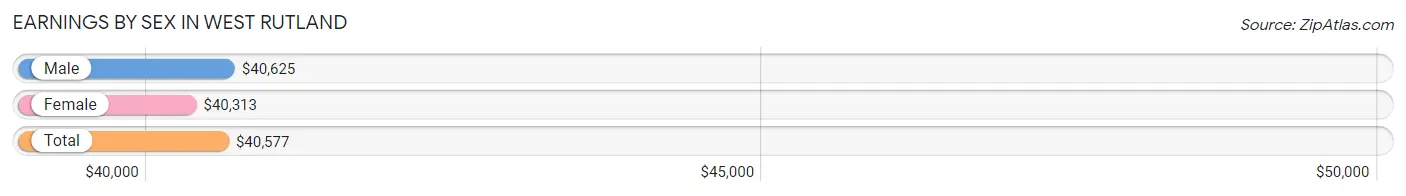
| Sex | Number | Average Earnings |
| Male | 584 (51.9%) | $40,625 |
| Female | 542 (48.1%) | $40,313 |
| Total | 1,126 (100.0%) | $40,577 |
Earnings by Sex by Income Bracket in West Rutland
The most common earnings brackets in West Rutland are $25,000 to $29,999 for men (93 | 15.9%) and $55,000 to $64,999 for women (85 | 15.7%).
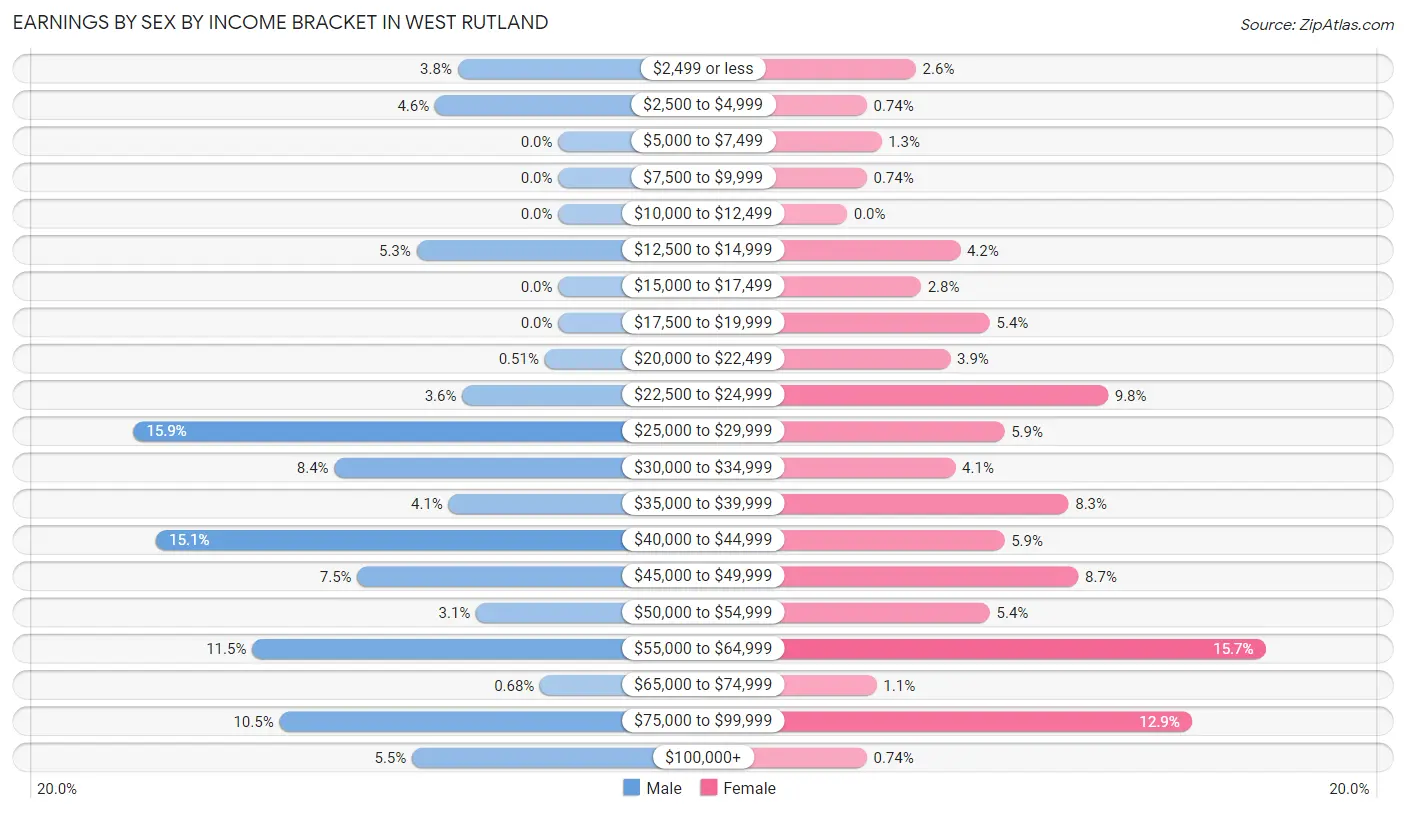
| Income | Male | Female |
| $2,499 or less | 22 (3.8%) | 14 (2.6%) |
| $2,500 to $4,999 | 27 (4.6%) | 4 (0.7%) |
| $5,000 to $7,499 | 0 (0.0%) | 7 (1.3%) |
| $7,500 to $9,999 | 0 (0.0%) | 4 (0.7%) |
| $10,000 to $12,499 | 0 (0.0%) | 0 (0.0%) |
| $12,500 to $14,999 | 31 (5.3%) | 23 (4.2%) |
| $15,000 to $17,499 | 0 (0.0%) | 15 (2.8%) |
| $17,500 to $19,999 | 0 (0.0%) | 29 (5.3%) |
| $20,000 to $22,499 | 3 (0.5%) | 21 (3.9%) |
| $22,500 to $24,999 | 21 (3.6%) | 53 (9.8%) |
| $25,000 to $29,999 | 93 (15.9%) | 32 (5.9%) |
| $30,000 to $34,999 | 49 (8.4%) | 22 (4.1%) |
| $35,000 to $39,999 | 24 (4.1%) | 45 (8.3%) |
| $40,000 to $44,999 | 88 (15.1%) | 32 (5.9%) |
| $45,000 to $49,999 | 44 (7.5%) | 47 (8.7%) |
| $50,000 to $54,999 | 18 (3.1%) | 29 (5.3%) |
| $55,000 to $64,999 | 67 (11.5%) | 85 (15.7%) |
| $65,000 to $74,999 | 4 (0.7%) | 6 (1.1%) |
| $75,000 to $99,999 | 61 (10.4%) | 70 (12.9%) |
| $100,000+ | 32 (5.5%) | 4 (0.7%) |
| Total | 584 (100.0%) | 542 (100.0%) |
Earnings by Sex by Educational Attainment in West Rutland
Average earnings in West Rutland are $41,358 for men and $44,453 for women, a difference of 7.0%. Men with an educational attainment of bachelor's degree enjoy the highest average annual earnings of $55,438, while those with college or associate's degree education earn the least with $29,488. Women with an educational attainment of college or associate's degree earn the most with the average annual earnings of $57,611, while those with high school diploma education have the smallest earnings of $29,375.
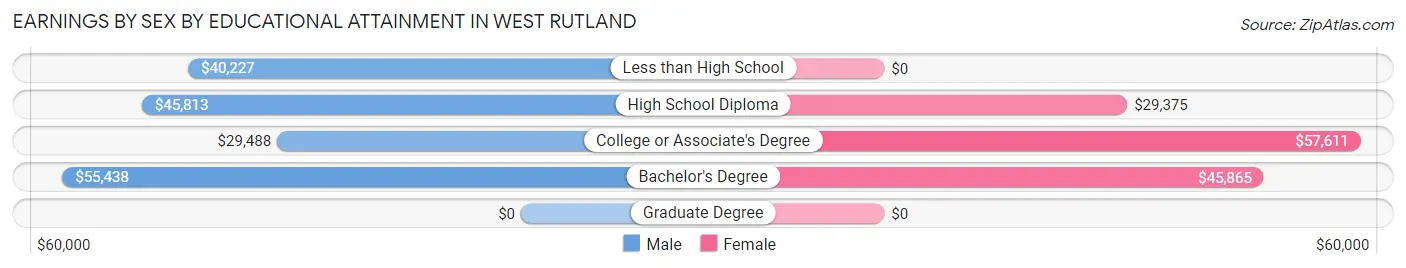
| Educational Attainment | Male Income | Female Income |
| Less than High School | $40,227 | $0 |
| High School Diploma | $45,813 | $29,375 |
| College or Associate's Degree | $29,488 | $57,611 |
| Bachelor's Degree | $55,438 | $45,865 |
| Graduate Degree | - | - |
| Total | $41,358 | $44,453 |
Family Income in West Rutland
Family Income Brackets in West Rutland
According to the West Rutland family income data, there are 137 families falling into the $100,000 to $149,999 income range, which is the most common income bracket and makes up 25.7% of all families.
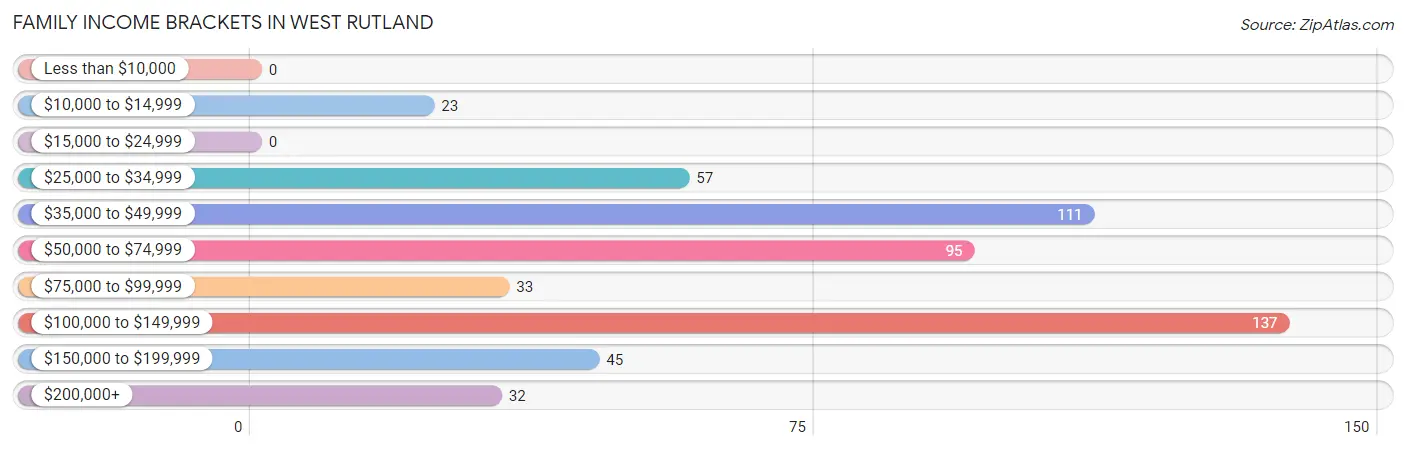
| Income Bracket | # Families | % Families |
| Less than $10,000 | 0 | 0.0% |
| $10,000 to $14,999 | 23 | 4.3% |
| $15,000 to $24,999 | 0 | 0.0% |
| $25,000 to $34,999 | 57 | 10.7% |
| $35,000 to $49,999 | 111 | 20.8% |
| $50,000 to $74,999 | 95 | 17.8% |
| $75,000 to $99,999 | 33 | 6.2% |
| $100,000 to $149,999 | 137 | 25.7% |
| $150,000 to $199,999 | 45 | 8.4% |
| $200,000+ | 32 | 6.0% |
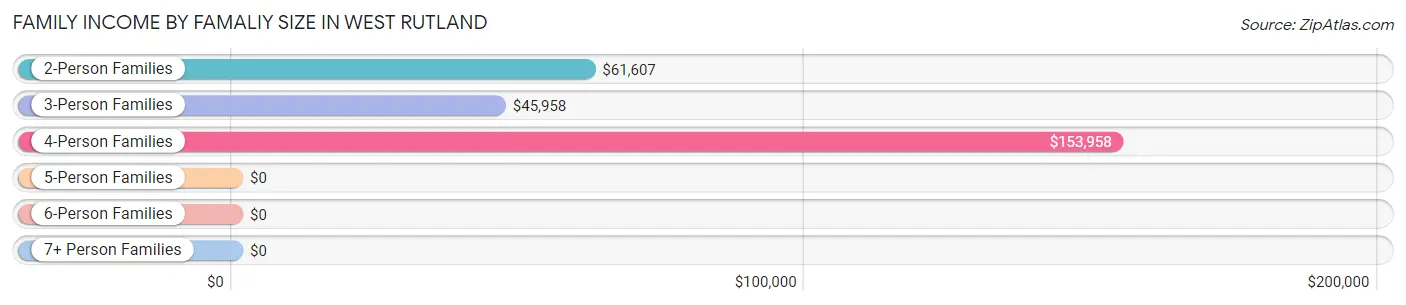
Family Income by Famaliy Size in West Rutland
4-person families (37 | 6.9%) account for the highest median family income in West Rutland with $153,958 per family, while 4-person families (37 | 6.9%) have the highest median income of $38,490 per family member.
| Income Bracket | # Families | Median Income |
| 2-Person Families | 325 (61.0%) | $61,607 |
| 3-Person Families | 113 (21.2%) | $45,958 |
| 4-Person Families | 37 (6.9%) | $153,958 |
| 5-Person Families | 47 (8.8%) | $0 |
| 6-Person Families | 0 (0.0%) | $0 |
| 7+ Person Families | 11 (2.1%) | $0 |
| Total | 533 (100.0%) | $62,321 |
Family Income by Number of Earners in West Rutland
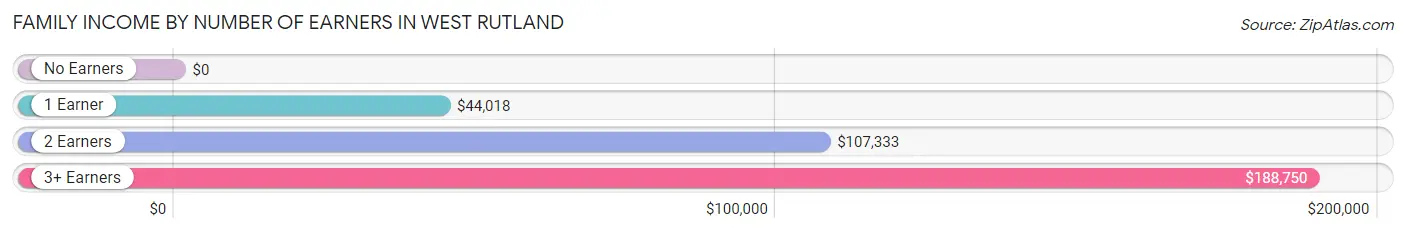
| Number of Earners | # Families | Median Income |
| No Earners | 110 (20.6%) | $0 |
| 1 Earner | 183 (34.3%) | $44,018 |
| 2 Earners | 220 (41.3%) | $107,333 |
| 3+ Earners | 20 (3.7%) | $188,750 |
| Total | 533 (100.0%) | $62,321 |
Household Income in West Rutland
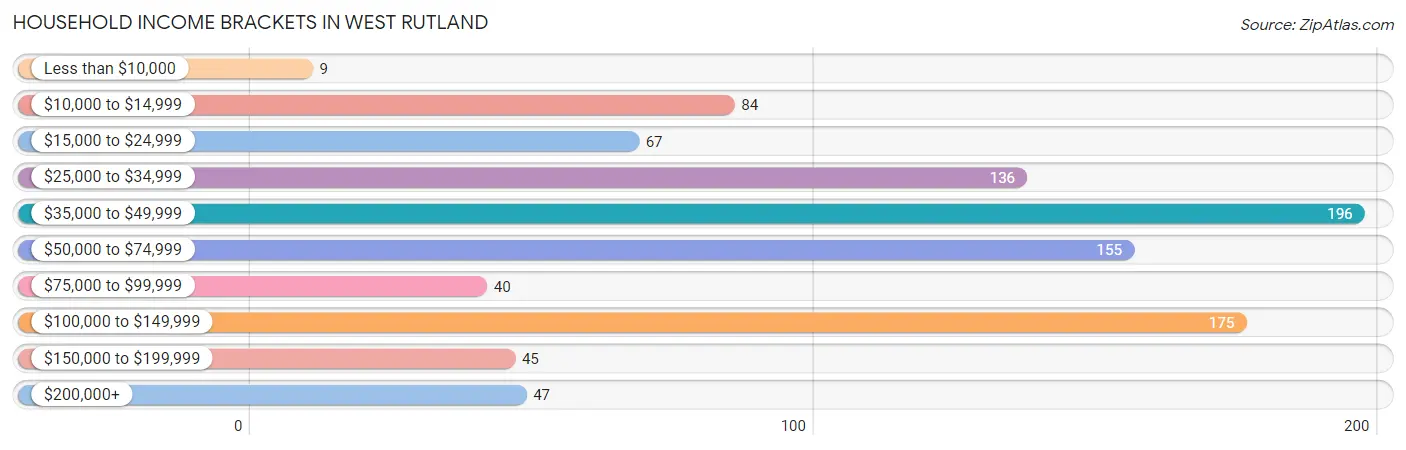
Household Income Brackets in West Rutland
With 196 households falling in the category, the $35,000 to $49,999 income range is the most frequent in West Rutland, accounting for 20.5% of all households. In contrast, only 9 households (0.9%) fall into the less than $10,000 income bracket, making it the least populous group.
| Income Bracket | # Households | % Households |
| Less than $10,000 | 9 | 0.9% |
| $10,000 to $14,999 | 84 | 8.8% |
| $15,000 to $24,999 | 67 | 7.0% |
| $25,000 to $34,999 | 136 | 14.3% |
| $35,000 to $49,999 | 196 | 20.5% |
| $50,000 to $74,999 | 155 | 16.2% |
| $75,000 to $99,999 | 40 | 4.2% |
| $100,000 to $149,999 | 175 | 18.3% |
| $150,000 to $199,999 | 45 | 4.7% |
| $200,000+ | 47 | 4.9% |
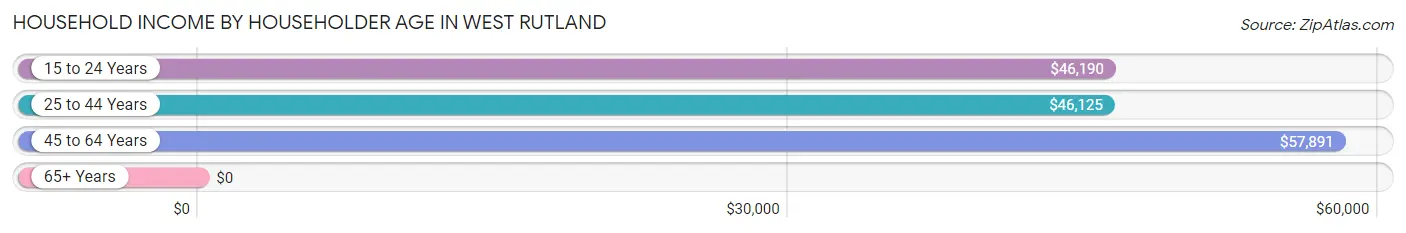
Household Income by Householder Age in West Rutland
The median household income in West Rutland is $47,381, with the highest median household income of $57,891 found in the 45 to 64 years age bracket for the primary householder. A total of 379 households (39.7%) fall into this category. Meanwhile, the 65+ years age bracket for the primary householder has the lowest median household income of $0, with 308 households (32.3%) in this group.
| Income Bracket | # Households | Median Income |
| 15 to 24 Years | 52 (5.4%) | $46,190 |
| 25 to 44 Years | 215 (22.5%) | $46,125 |
| 45 to 64 Years | 379 (39.7%) | $57,891 |
| 65+ Years | 308 (32.3%) | $0 |
| Total | 954 (100.0%) | $47,381 |
Poverty in West Rutland
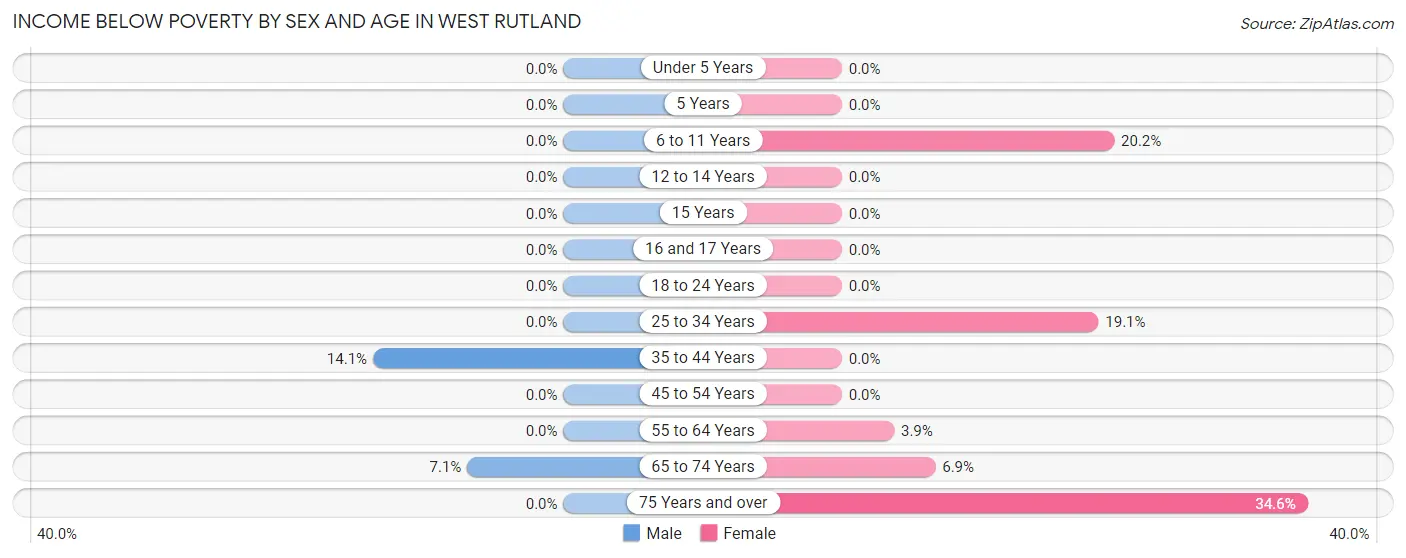
Income Below Poverty by Sex and Age in West Rutland
With 2.4% poverty level for males and 10.2% for females among the residents of West Rutland, 35 to 44 year old males and 75 year old and over females are the most vulnerable to poverty, with 14 males (14.1%) and 37 females (34.6%) in their respective age groups living below the poverty level.
| Age Bracket | Male | Female |
| Under 5 Years | 0 (0.0%) | 0 (0.0%) |
| 5 Years | 0 (0.0%) | 0 (0.0%) |
| 6 to 11 Years | 0 (0.0%) | 36 (20.2%) |
| 12 to 14 Years | 0 (0.0%) | 0 (0.0%) |
| 15 Years | 0 (0.0%) | 0 (0.0%) |
| 16 and 17 Years | 0 (0.0%) | 0 (0.0%) |
| 18 to 24 Years | 0 (0.0%) | 0 (0.0%) |
| 25 to 34 Years | 0 (0.0%) | 36 (19.1%) |
| 35 to 44 Years | 14 (14.1%) | 0 (0.0%) |
| 45 to 54 Years | 0 (0.0%) | 0 (0.0%) |
| 55 to 64 Years | 0 (0.0%) | 5 (3.9%) |
| 65 to 74 Years | 10 (7.1%) | 12 (6.9%) |
| 75 Years and over | 0 (0.0%) | 37 (34.6%) |
| Total | 24 (2.4%) | 126 (10.2%) |
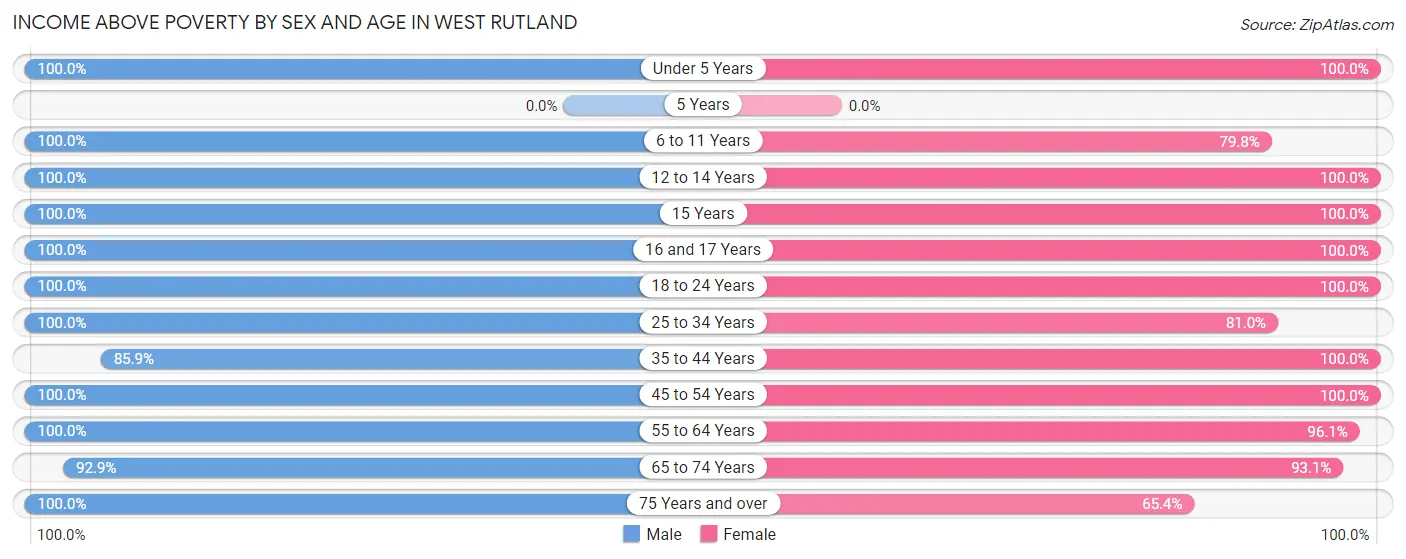
Income Above Poverty by Sex and Age in West Rutland
According to the poverty statistics in West Rutland, males aged under 5 years and females aged under 5 years are the age groups that are most secure financially, with 100.0% of males and 100.0% of females in these age groups living above the poverty line.
| Age Bracket | Male | Female |
| Under 5 Years | 62 (100.0%) | 15 (100.0%) |
| 5 Years | 0 (0.0%) | 0 (0.0%) |
| 6 to 11 Years | 31 (100.0%) | 142 (79.8%) |
| 12 to 14 Years | 33 (100.0%) | 93 (100.0%) |
| 15 Years | 20 (100.0%) | 4 (100.0%) |
| 16 and 17 Years | 28 (100.0%) | 27 (100.0%) |
| 18 to 24 Years | 88 (100.0%) | 82 (100.0%) |
| 25 to 34 Years | 79 (100.0%) | 153 (80.9%) |
| 35 to 44 Years | 85 (85.9%) | 116 (100.0%) |
| 45 to 54 Years | 186 (100.0%) | 127 (100.0%) |
| 55 to 64 Years | 167 (100.0%) | 124 (96.1%) |
| 65 to 74 Years | 130 (92.9%) | 161 (93.1%) |
| 75 Years and over | 49 (100.0%) | 70 (65.4%) |
| Total | 958 (97.6%) | 1,114 (89.8%) |
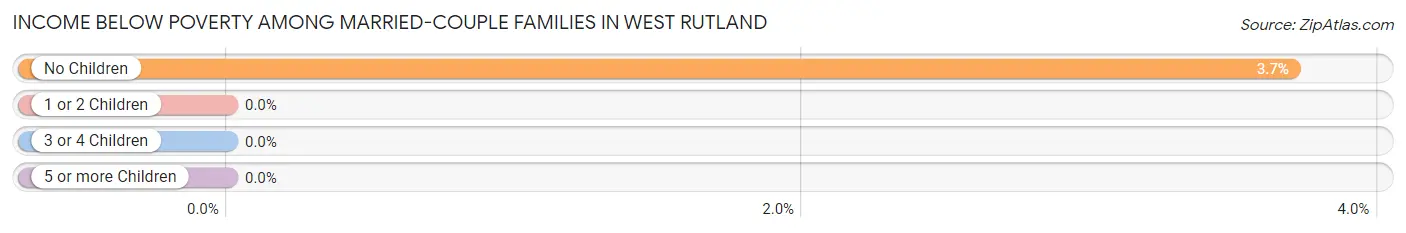
Income Below Poverty Among Married-Couple Families in West Rutland
The poverty statistics for married-couple families in West Rutland show that 2.8% or 10 of the total 362 families live below the poverty line. Families with no children have the highest poverty rate of 3.7%, comprising of 10 families. On the other hand, families with 1 or 2 children have the lowest poverty rate of 0.0%, which includes 0 families.
| Children | Above Poverty | Below Poverty |
| No Children | 260 (96.3%) | 10 (3.7%) |
| 1 or 2 Children | 73 (100.0%) | 0 (0.0%) |
| 3 or 4 Children | 19 (100.0%) | 0 (0.0%) |
| 5 or more Children | 0 (0.0%) | 0 (0.0%) |
| Total | 352 (97.2%) | 10 (2.8%) |
Income Below Poverty Among Single-Parent Households in West Rutland
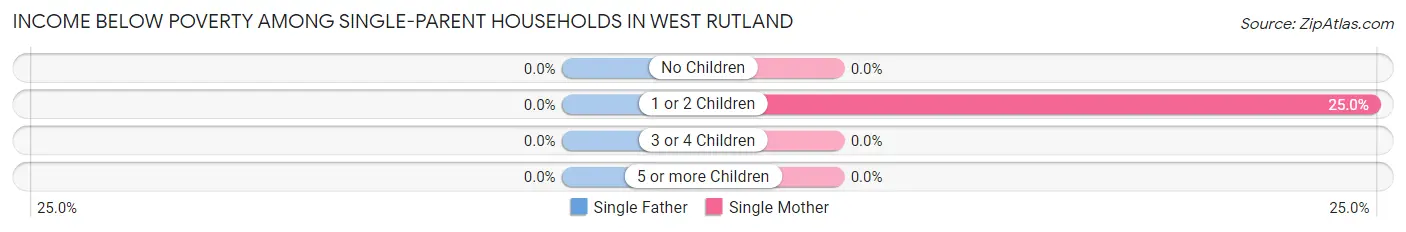
| Children | Single Father | Single Mother |
| No Children | 0 (0.0%) | 0 (0.0%) |
| 1 or 2 Children | 0 (0.0%) | 13 (25.0%) |
| 3 or 4 Children | 0 (0.0%) | 0 (0.0%) |
| 5 or more Children | 0 (0.0%) | 0 (0.0%) |
| Total | 0 (0.0%) | 13 (18.6%) |
Income Below Poverty Among Married-Couple vs Single-Parent Households in West Rutland
The poverty data for West Rutland shows that 10 of the married-couple family households (2.8%) and 13 of the single-parent households (7.6%) are living below the poverty level. Within the married-couple family households, those with no children have the highest poverty rate, with 10 households (3.7%) falling below the poverty line. Among the single-parent households, those with 1 or 2 children have the highest poverty rate, with 13 household (10.5%) living below poverty.
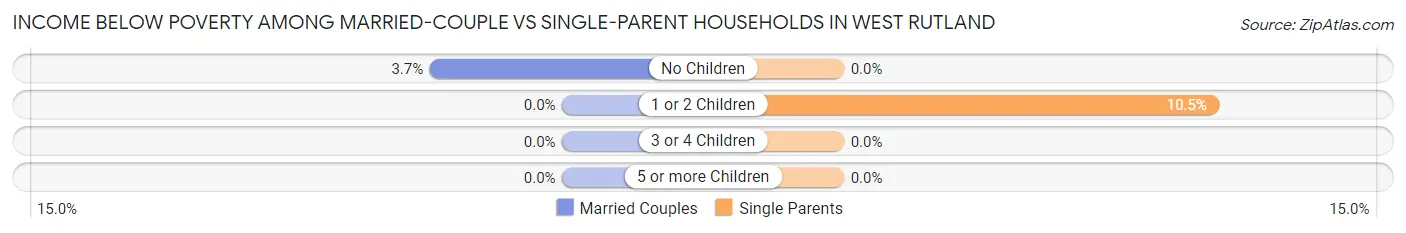
| Children | Married-Couple Families | Single-Parent Households |
| No Children | 10 (3.7%) | 0 (0.0%) |
| 1 or 2 Children | 0 (0.0%) | 13 (10.5%) |
| 3 or 4 Children | 0 (0.0%) | 0 (0.0%) |
| 5 or more Children | 0 (0.0%) | 0 (0.0%) |
| Total | 10 (2.8%) | 13 (7.6%) |
Employment Characteristics in West Rutland
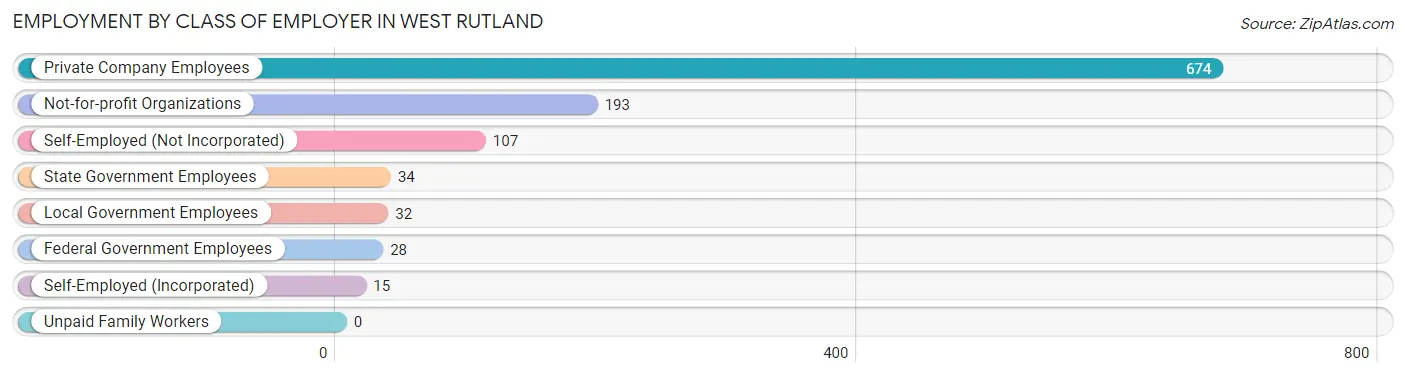
Employment by Class of Employer in West Rutland
Among the 1,083 employed individuals in West Rutland, private company employees (674 | 62.2%), not-for-profit organizations (193 | 17.8%), and self-employed (not incorporated) (107 | 9.9%) make up the most common classes of employment.
| Employer Class | # Employees | % Employees |
| Private Company Employees | 674 | 62.2% |
| Self-Employed (Incorporated) | 15 | 1.4% |
| Self-Employed (Not Incorporated) | 107 | 9.9% |
| Not-for-profit Organizations | 193 | 17.8% |
| Local Government Employees | 32 | 2.9% |
| State Government Employees | 34 | 3.1% |
| Federal Government Employees | 28 | 2.6% |
| Unpaid Family Workers | 0 | 0.0% |
| Total | 1,083 | 100.0% |
Employment Status by Age in West Rutland
According to the labor force statistics for West Rutland, out of the total population over 16 years of age (1,786), 61.9% or 1,106 individuals are in the labor force, with 1.5% or 17 of them unemployed. The age group with the highest labor force participation rate is 35 to 44 years, with 92.1% or 198 individuals in the labor force. Within the labor force, the 16 to 19 years age range has the highest percentage of unemployed individuals, with 100.0% or 10 of them being unemployed.
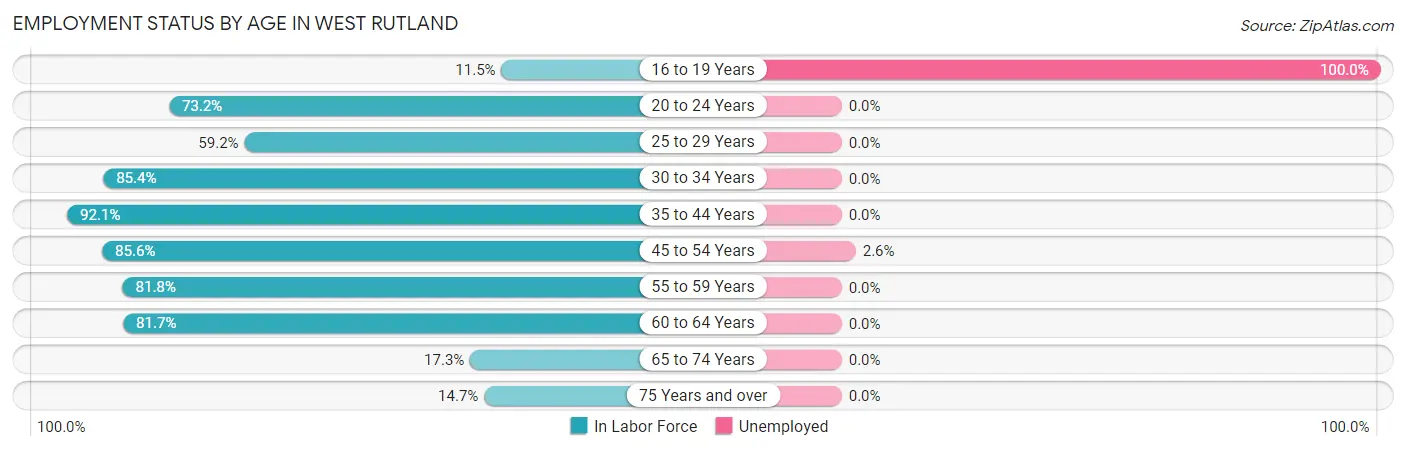
| Age Bracket | In Labor Force | Unemployed |
| 16 to 19 Years | 10 (11.5%) | 10 (100.0%) |
| 20 to 24 Years | 101 (73.2%) | 0 (0.0%) |
| 25 to 29 Years | 45 (59.2%) | 0 (0.0%) |
| 30 to 34 Years | 164 (85.4%) | 0 (0.0%) |
| 35 to 44 Years | 198 (92.1%) | 0 (0.0%) |
| 45 to 54 Years | 268 (85.6%) | 7 (2.6%) |
| 55 to 59 Years | 144 (81.8%) | 0 (0.0%) |
| 60 to 64 Years | 98 (81.7%) | 0 (0.0%) |
| 65 to 74 Years | 54 (17.3%) | 0 (0.0%) |
| 75 Years and over | 23 (14.7%) | 0 (0.0%) |
| Total | 1,106 (61.9%) | 17 (1.5%) |
Employment Status by Educational Attainment in West Rutland
According to labor force statistics for West Rutland, 84.0% of individuals (917) out of the total population between 25 and 64 years of age (1,092) are in the labor force, with 0.8% or 7 of them being unemployed. The group with the highest labor force participation rate are those with the educational attainment of bachelor's degree or higher, with 94.9% or 333 individuals in the labor force. Within the labor force, individuals with college / associate degree education have the highest percentage of unemployment, with 2.8% or 7 of them being unemployed.
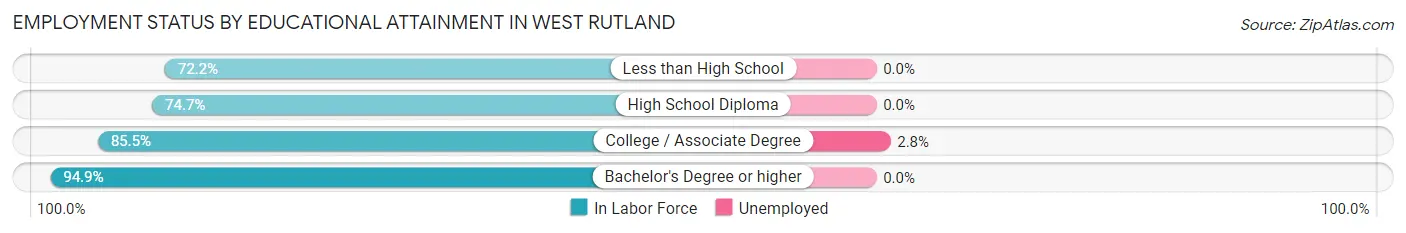
| Educational Attainment | In Labor Force | Unemployed |
| Less than High School | 52 (72.2%) | 0 (0.0%) |
| High School Diploma | 278 (74.7%) | 0 (0.0%) |
| College / Associate Degree | 254 (85.5%) | 8 (2.8%) |
| Bachelor's Degree or higher | 333 (94.9%) | 0 (0.0%) |
| Total | 917 (84.0%) | 9 (0.8%) |
Employment Occupations by Sex in West Rutland
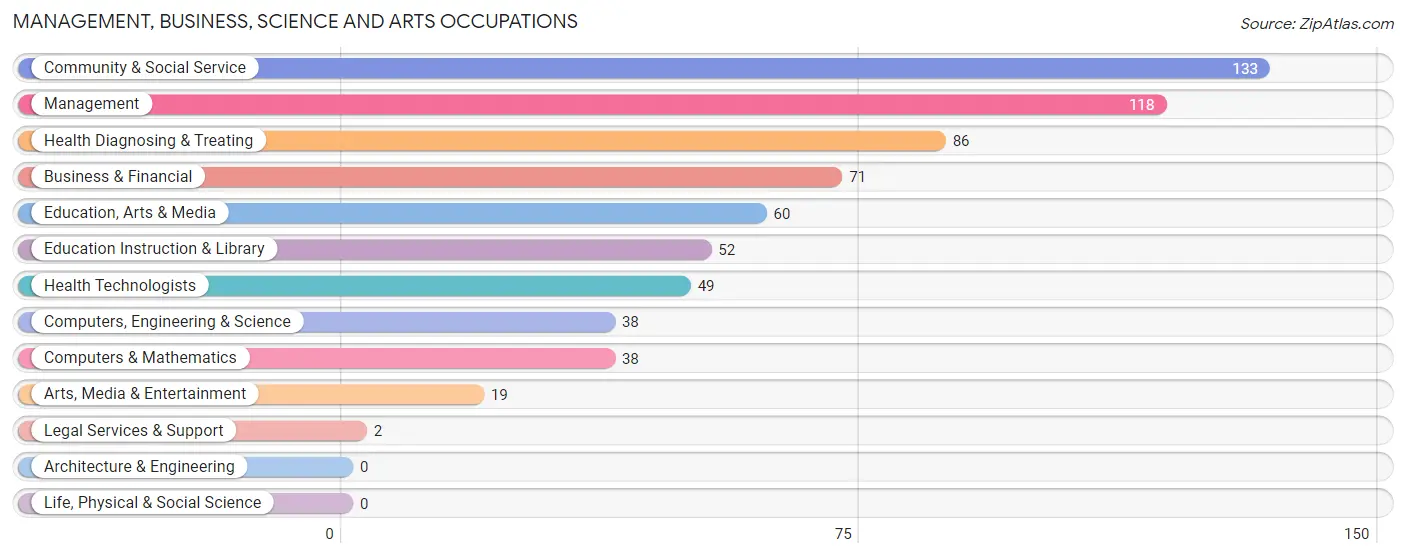
Management, Business, Science and Arts Occupations
The most common Management, Business, Science and Arts occupations in West Rutland are Community & Social Service (133 | 12.2%), Management (118 | 10.8%), Health Diagnosing & Treating (86 | 7.9%), Business & Financial (71 | 6.5%), and Education, Arts & Media (60 | 5.5%).
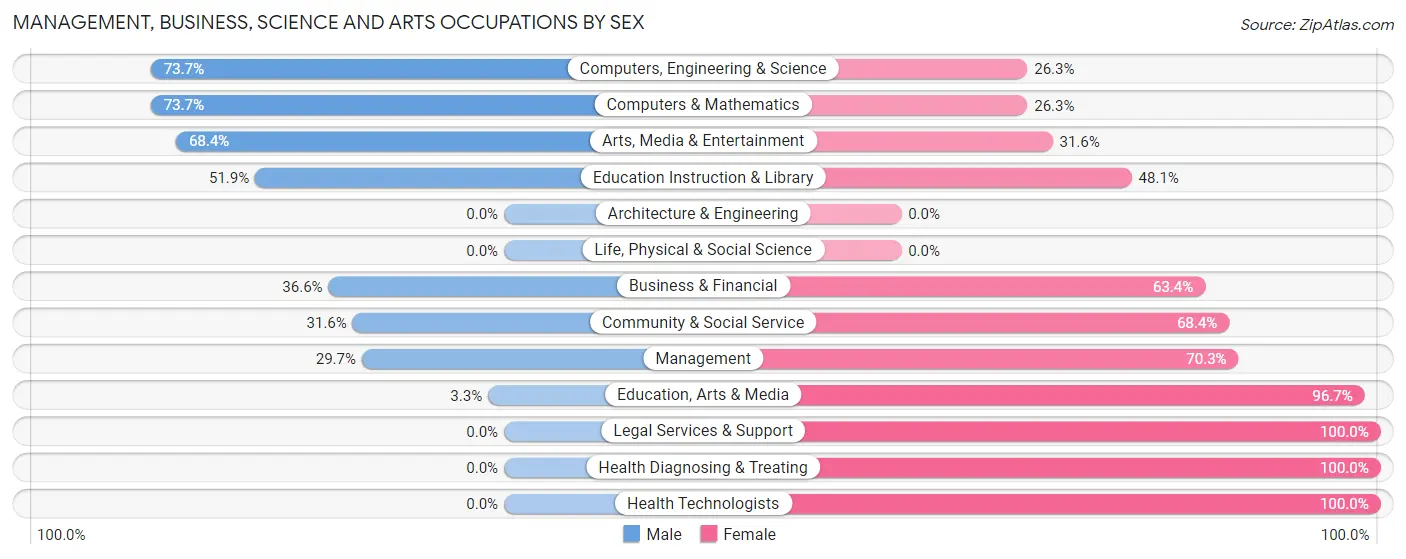
Management, Business, Science and Arts Occupations by Sex
Within the Management, Business, Science and Arts occupations in West Rutland, the most male-oriented occupations are Computers, Engineering & Science (73.7%), Computers & Mathematics (73.7%), and Arts, Media & Entertainment (68.4%), while the most female-oriented occupations are Legal Services & Support (100.0%), Health Diagnosing & Treating (100.0%), and Health Technologists (100.0%).
| Occupation | Male | Female |
| Management | 35 (29.7%) | 83 (70.3%) |
| Business & Financial | 26 (36.6%) | 45 (63.4%) |
| Computers, Engineering & Science | 28 (73.7%) | 10 (26.3%) |
| Computers & Mathematics | 28 (73.7%) | 10 (26.3%) |
| Architecture & Engineering | 0 (0.0%) | 0 (0.0%) |
| Life, Physical & Social Science | 0 (0.0%) | 0 (0.0%) |
| Community & Social Service | 42 (31.6%) | 91 (68.4%) |
| Education, Arts & Media | 2 (3.3%) | 58 (96.7%) |
| Legal Services & Support | 0 (0.0%) | 2 (100.0%) |
| Education Instruction & Library | 27 (51.9%) | 25 (48.1%) |
| Arts, Media & Entertainment | 13 (68.4%) | 6 (31.6%) |
| Health Diagnosing & Treating | 0 (0.0%) | 86 (100.0%) |
| Health Technologists | 0 (0.0%) | 49 (100.0%) |
| Total (Category) | 131 (29.4%) | 315 (70.6%) |
| Total (Overall) | 557 (51.2%) | 531 (48.8%) |
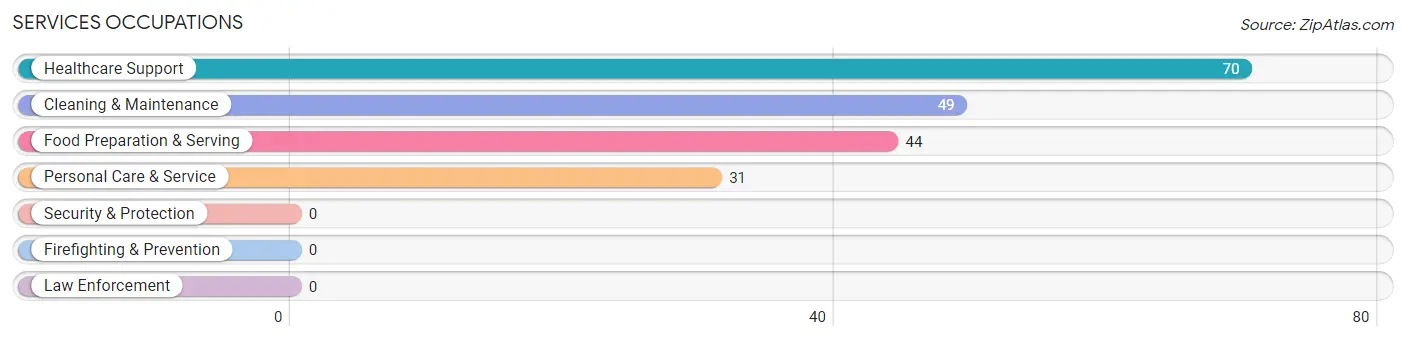
Services Occupations
The most common Services occupations in West Rutland are Healthcare Support (70 | 6.4%), Cleaning & Maintenance (49 | 4.5%), Food Preparation & Serving (44 | 4.0%), and Personal Care & Service (31 | 2.9%).
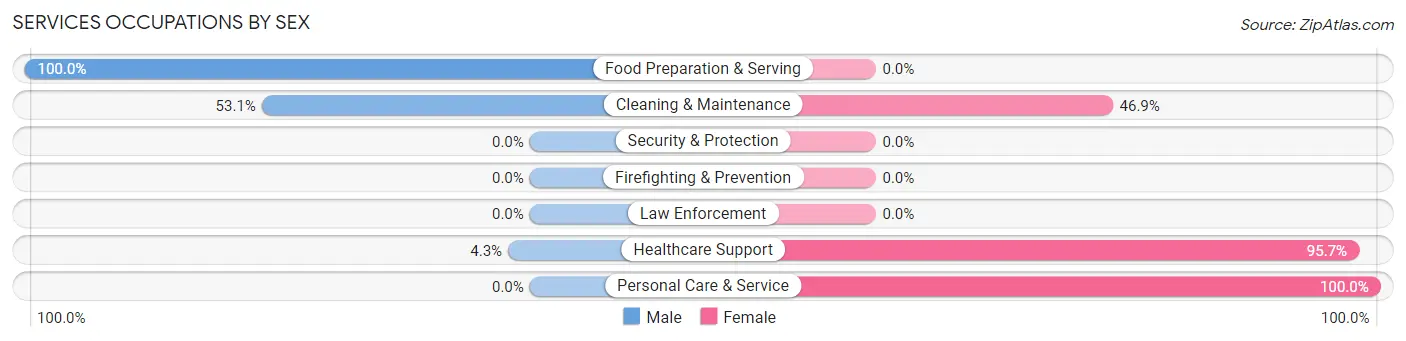
Services Occupations by Sex
Within the Services occupations in West Rutland, the most male-oriented occupations are Food Preparation & Serving (100.0%), Cleaning & Maintenance (53.1%), and Healthcare Support (4.3%), while the most female-oriented occupations are Personal Care & Service (100.0%), Healthcare Support (95.7%), and Cleaning & Maintenance (46.9%).
| Occupation | Male | Female |
| Healthcare Support | 3 (4.3%) | 67 (95.7%) |
| Security & Protection | 0 (0.0%) | 0 (0.0%) |
| Firefighting & Prevention | 0 (0.0%) | 0 (0.0%) |
| Law Enforcement | 0 (0.0%) | 0 (0.0%) |
| Food Preparation & Serving | 44 (100.0%) | 0 (0.0%) |
| Cleaning & Maintenance | 26 (53.1%) | 23 (46.9%) |
| Personal Care & Service | 0 (0.0%) | 31 (100.0%) |
| Total (Category) | 73 (37.6%) | 121 (62.4%) |
| Total (Overall) | 557 (51.2%) | 531 (48.8%) |
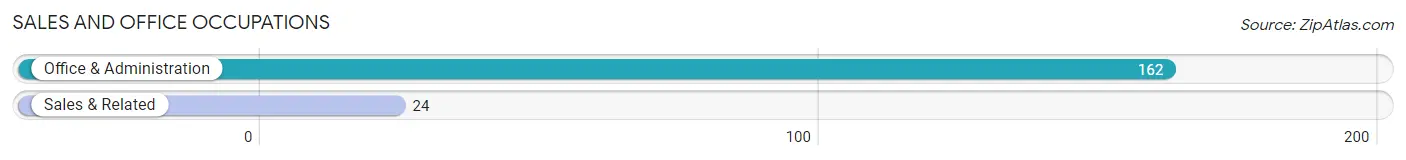
Sales and Office Occupations
The most common Sales and Office occupations in West Rutland are Office & Administration (162 | 14.9%), and Sales & Related (24 | 2.2%).
Sales and Office Occupations by Sex
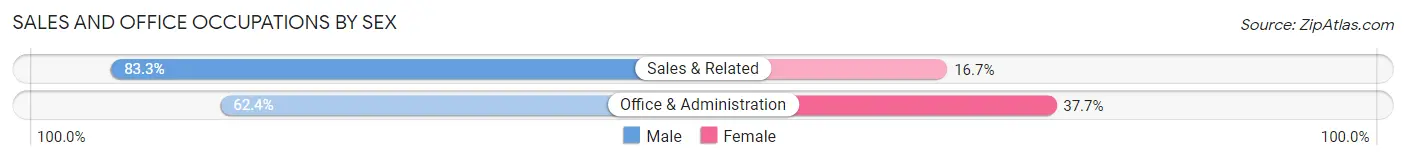
| Occupation | Male | Female |
| Sales & Related | 20 (83.3%) | 4 (16.7%) |
| Office & Administration | 101 (62.4%) | 61 (37.7%) |
| Total (Category) | 121 (65.0%) | 65 (34.9%) |
| Total (Overall) | 557 (51.2%) | 531 (48.8%) |
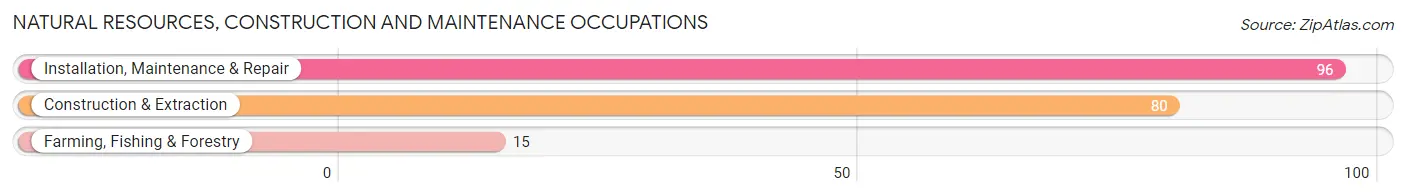
Natural Resources, Construction and Maintenance Occupations
The most common Natural Resources, Construction and Maintenance occupations in West Rutland are Installation, Maintenance & Repair (96 | 8.8%), Construction & Extraction (80 | 7.3%), and Farming, Fishing & Forestry (15 | 1.4%).
Natural Resources, Construction and Maintenance Occupations by Sex
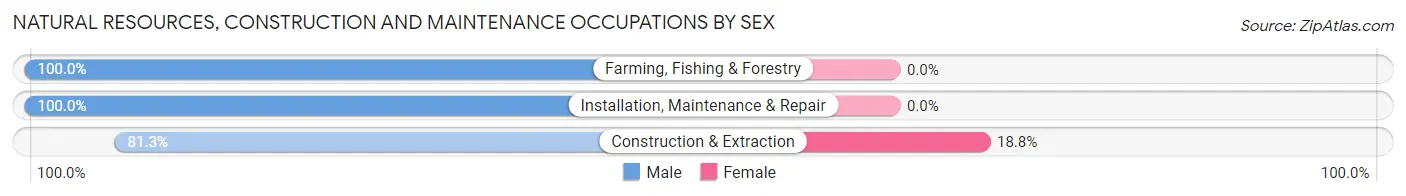
| Occupation | Male | Female |
| Farming, Fishing & Forestry | 15 (100.0%) | 0 (0.0%) |
| Construction & Extraction | 65 (81.2%) | 15 (18.8%) |
| Installation, Maintenance & Repair | 96 (100.0%) | 0 (0.0%) |
| Total (Category) | 176 (92.1%) | 15 (7.9%) |
| Total (Overall) | 557 (51.2%) | 531 (48.8%) |
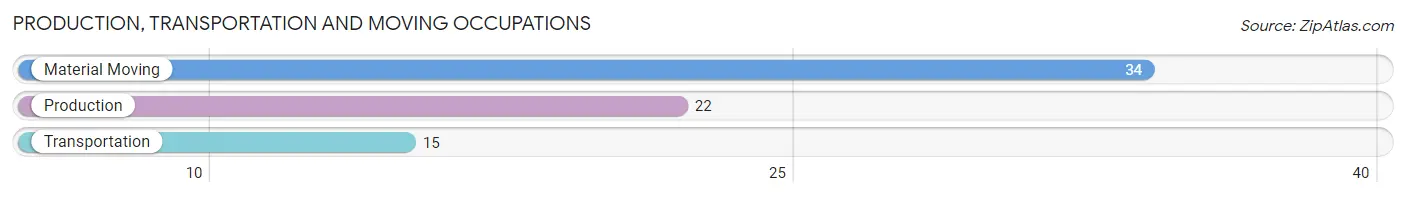
Production, Transportation and Moving Occupations
The most common Production, Transportation and Moving occupations in West Rutland are Material Moving (34 | 3.1%), Production (22 | 2.0%), and Transportation (15 | 1.4%).
Production, Transportation and Moving Occupations by Sex
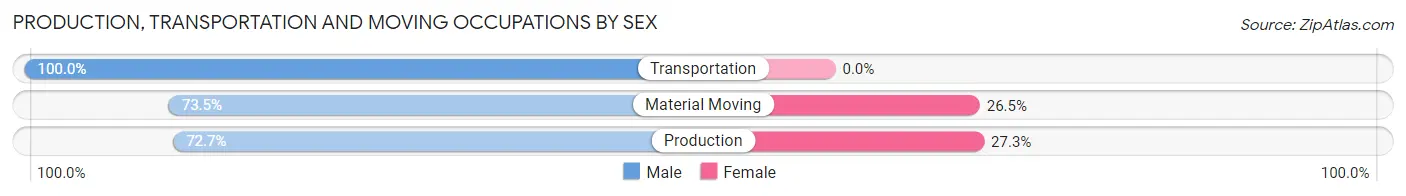
| Occupation | Male | Female |
| Production | 16 (72.7%) | 6 (27.3%) |
| Transportation | 15 (100.0%) | 0 (0.0%) |
| Material Moving | 25 (73.5%) | 9 (26.5%) |
| Total (Category) | 56 (78.9%) | 15 (21.1%) |
| Total (Overall) | 557 (51.2%) | 531 (48.8%) |
Employment Industries by Sex in West Rutland
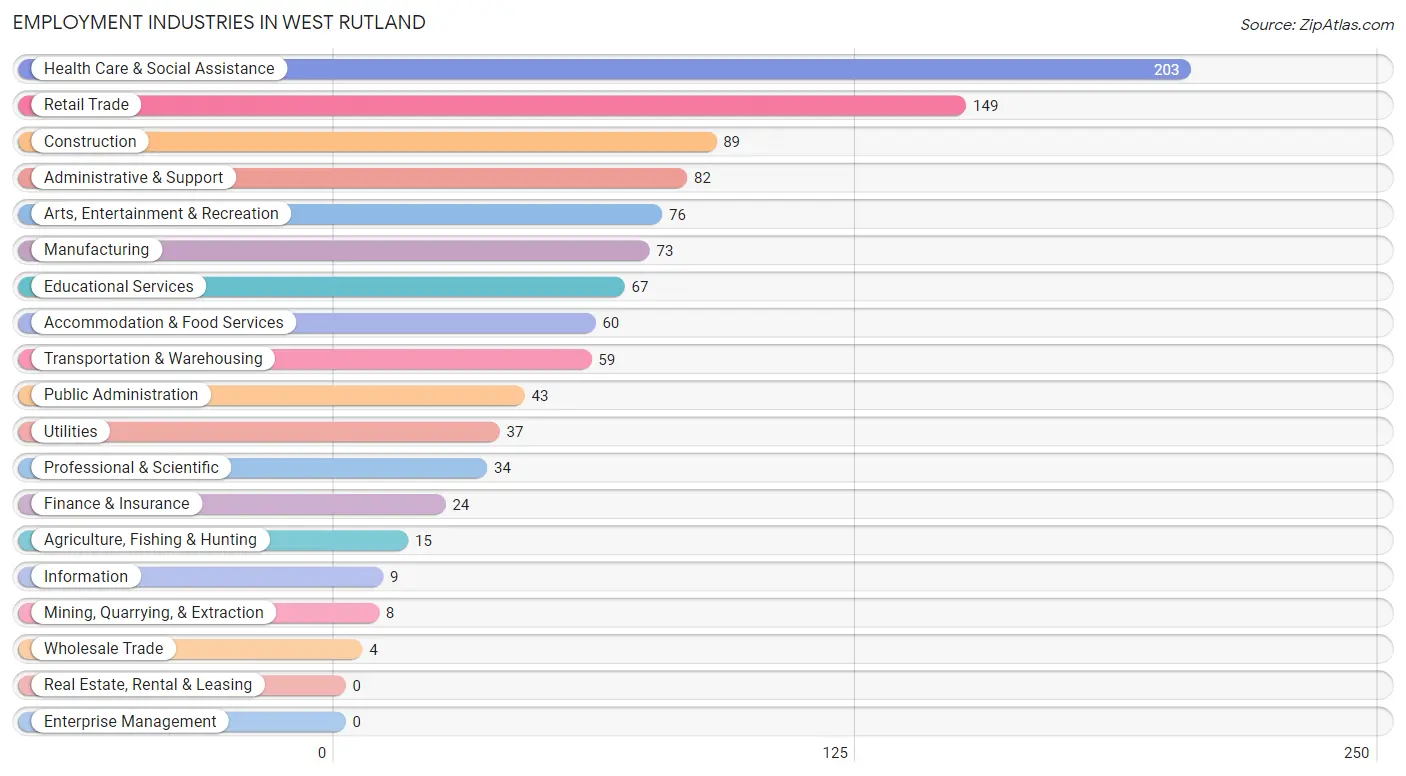
Employment Industries in West Rutland
The major employment industries in West Rutland include Health Care & Social Assistance (203 | 18.7%), Retail Trade (149 | 13.7%), Construction (89 | 8.2%), Administrative & Support (82 | 7.5%), and Arts, Entertainment & Recreation (76 | 7.0%).
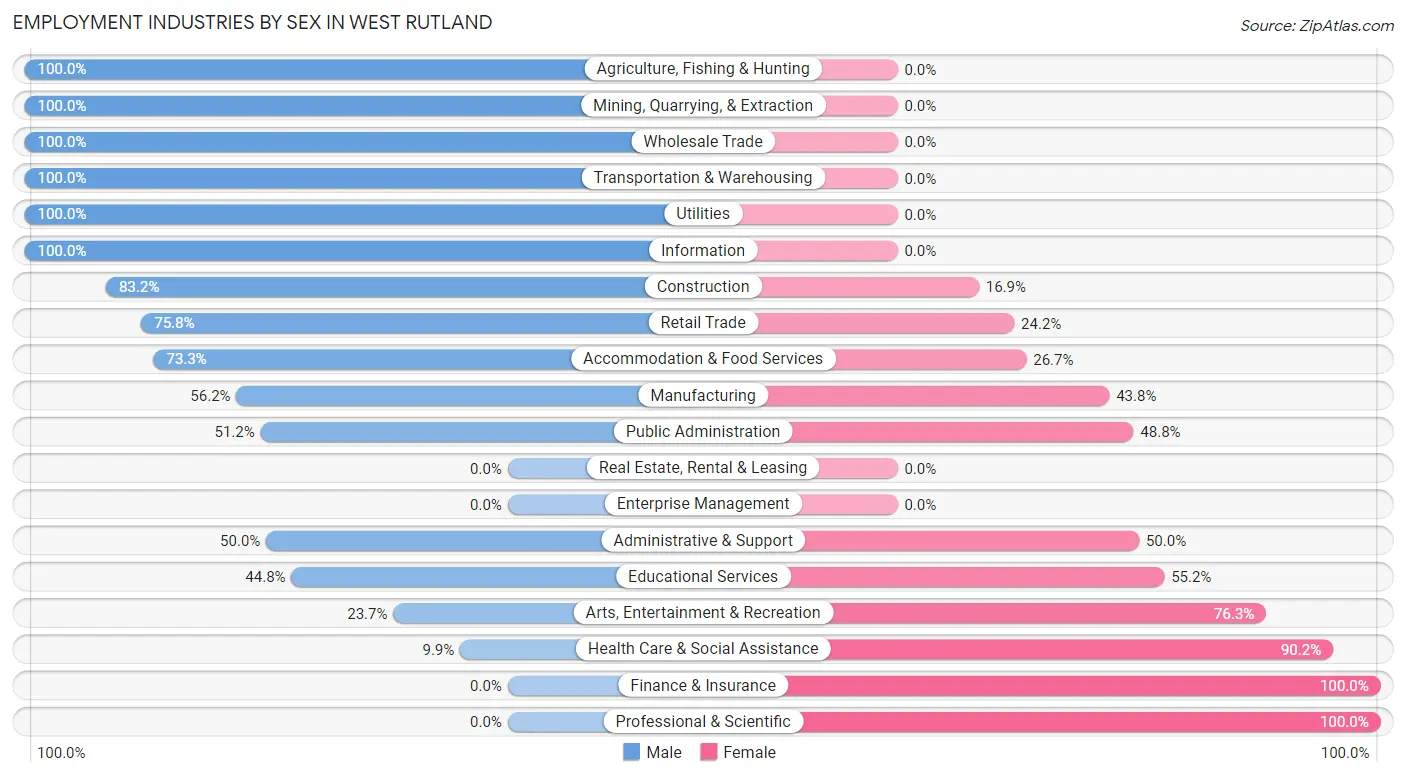
Employment Industries by Sex in West Rutland
The West Rutland industries that see more men than women are Agriculture, Fishing & Hunting (100.0%), Mining, Quarrying, & Extraction (100.0%), and Wholesale Trade (100.0%), whereas the industries that tend to have a higher number of women are Finance & Insurance (100.0%), Professional & Scientific (100.0%), and Health Care & Social Assistance (90.1%).
| Industry | Male | Female |
| Agriculture, Fishing & Hunting | 15 (100.0%) | 0 (0.0%) |
| Mining, Quarrying, & Extraction | 8 (100.0%) | 0 (0.0%) |
| Construction | 74 (83.2%) | 15 (16.9%) |
| Manufacturing | 41 (56.2%) | 32 (43.8%) |
| Wholesale Trade | 4 (100.0%) | 0 (0.0%) |
| Retail Trade | 113 (75.8%) | 36 (24.2%) |
| Transportation & Warehousing | 59 (100.0%) | 0 (0.0%) |
| Utilities | 37 (100.0%) | 0 (0.0%) |
| Information | 9 (100.0%) | 0 (0.0%) |
| Finance & Insurance | 0 (0.0%) | 24 (100.0%) |
| Real Estate, Rental & Leasing | 0 (0.0%) | 0 (0.0%) |
| Professional & Scientific | 0 (0.0%) | 34 (100.0%) |
| Enterprise Management | 0 (0.0%) | 0 (0.0%) |
| Administrative & Support | 41 (50.0%) | 41 (50.0%) |
| Educational Services | 30 (44.8%) | 37 (55.2%) |
| Health Care & Social Assistance | 20 (9.9%) | 183 (90.1%) |
| Arts, Entertainment & Recreation | 18 (23.7%) | 58 (76.3%) |
| Accommodation & Food Services | 44 (73.3%) | 16 (26.7%) |
| Public Administration | 22 (51.2%) | 21 (48.8%) |
| Total | 557 (51.2%) | 531 (48.8%) |
Education in West Rutland
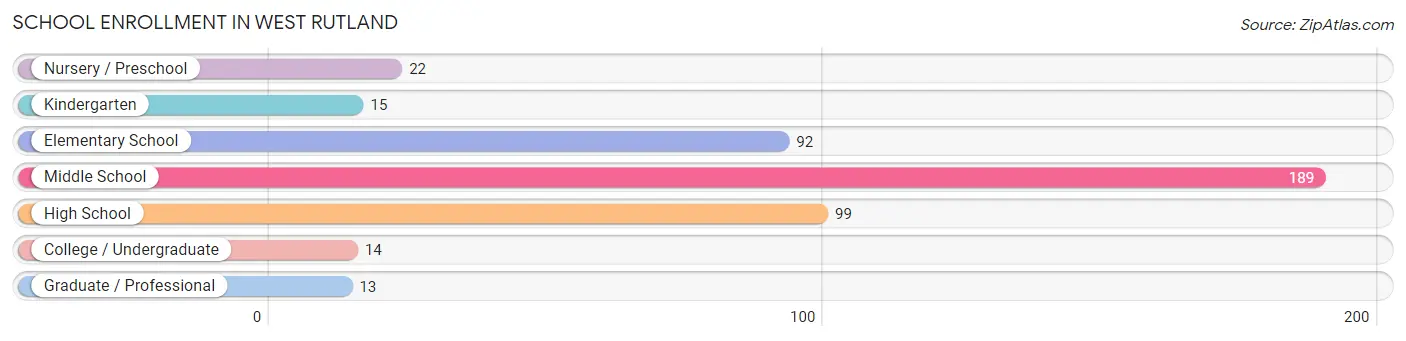
School Enrollment in West Rutland
The most common levels of schooling among the 444 students in West Rutland are middle school (189 | 42.6%), high school (99 | 22.3%), and elementary school (92 | 20.7%).
| School Level | # Students | % Students |
| Nursery / Preschool | 22 | 5.0% |
| Kindergarten | 15 | 3.4% |
| Elementary School | 92 | 20.7% |
| Middle School | 189 | 42.6% |
| High School | 99 | 22.3% |
| College / Undergraduate | 14 | 3.2% |
| Graduate / Professional | 13 | 2.9% |
| Total | 444 | 100.0% |
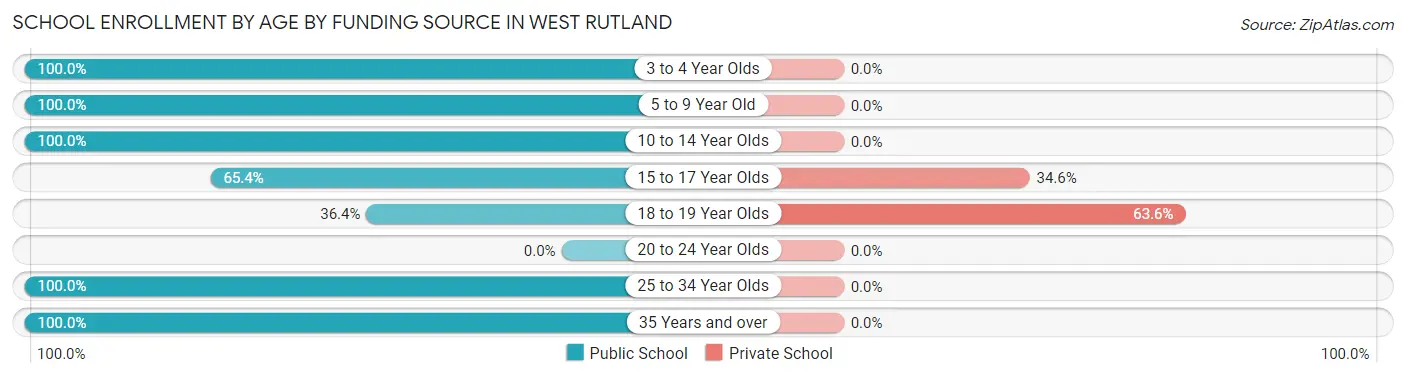
School Enrollment by Age by Funding Source in West Rutland
Out of a total of 444 students who are enrolled in schools in West Rutland, 32 (7.2%) attend a private institution, while the remaining 412 (92.8%) are enrolled in public schools. The age group of 18 to 19 year olds has the highest likelihood of being enrolled in private schools, with 14 (63.6% in the age bracket) enrolled. Conversely, the age group of 3 to 4 year olds has the lowest likelihood of being enrolled in a private school, with 37 (100.0% in the age bracket) attending a public institution.
| Age Bracket | Public School | Private School |
| 3 to 4 Year Olds | 37 (100.0%) | 0 (0.0%) |
| 5 to 9 Year Old | 77 (100.0%) | 0 (0.0%) |
| 10 to 14 Year Olds | 240 (100.0%) | 0 (0.0%) |
| 15 to 17 Year Olds | 34 (65.4%) | 18 (34.6%) |
| 18 to 19 Year Olds | 8 (36.4%) | 14 (63.6%) |
| 20 to 24 Year Olds | 0 (0.0%) | 0 (0.0%) |
| 25 to 34 Year Olds | 13 (100.0%) | 0 (0.0%) |
| 35 Years and over | 3 (100.0%) | 0 (0.0%) |
| Total | 412 (92.8%) | 32 (7.2%) |
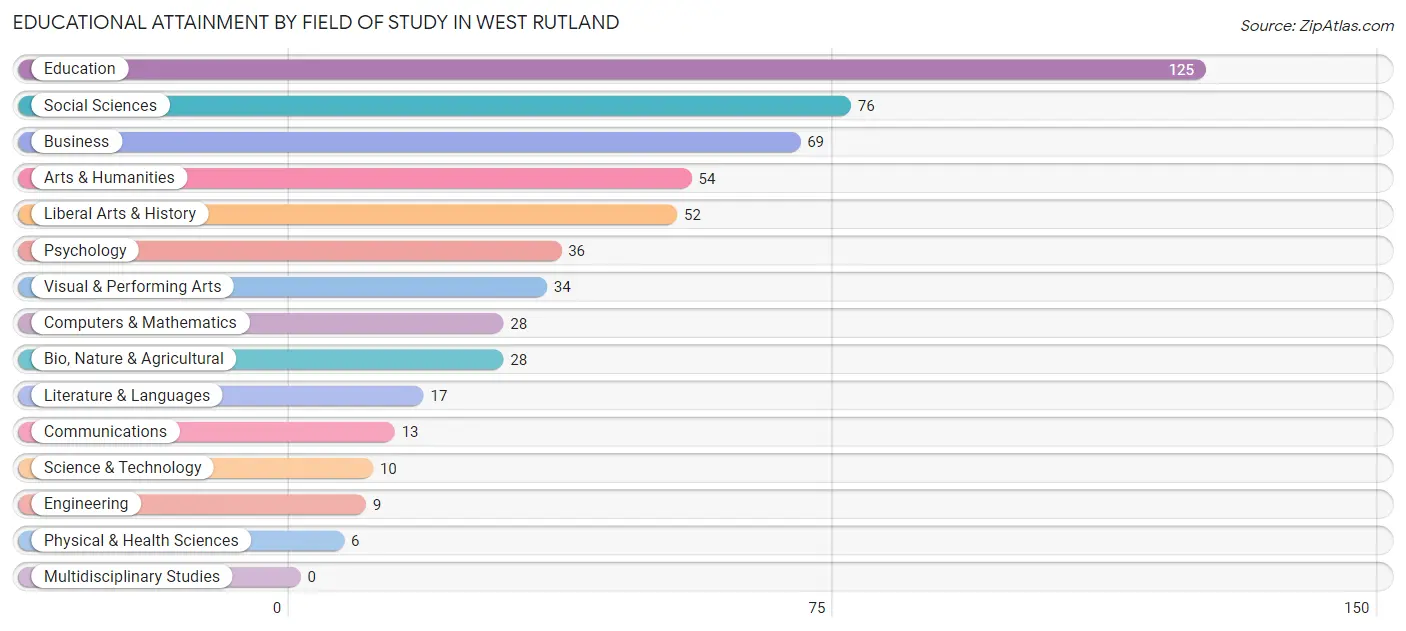
Educational Attainment by Field of Study in West Rutland
Education (125 | 22.4%), social sciences (76 | 13.6%), business (69 | 12.4%), arts & humanities (54 | 9.7%), and liberal arts & history (52 | 9.3%) are the most common fields of study among 557 individuals in West Rutland who have obtained a bachelor's degree or higher.
| Field of Study | # Graduates | % Graduates |
| Computers & Mathematics | 28 | 5.0% |
| Bio, Nature & Agricultural | 28 | 5.0% |
| Physical & Health Sciences | 6 | 1.1% |
| Psychology | 36 | 6.5% |
| Social Sciences | 76 | 13.6% |
| Engineering | 9 | 1.6% |
| Multidisciplinary Studies | 0 | 0.0% |
| Science & Technology | 10 | 1.8% |
| Business | 69 | 12.4% |
| Education | 125 | 22.4% |
| Literature & Languages | 17 | 3.0% |
| Liberal Arts & History | 52 | 9.3% |
| Visual & Performing Arts | 34 | 6.1% |
| Communications | 13 | 2.3% |
| Arts & Humanities | 54 | 9.7% |
| Total | 557 | 100.0% |
Transportation & Commute in West Rutland
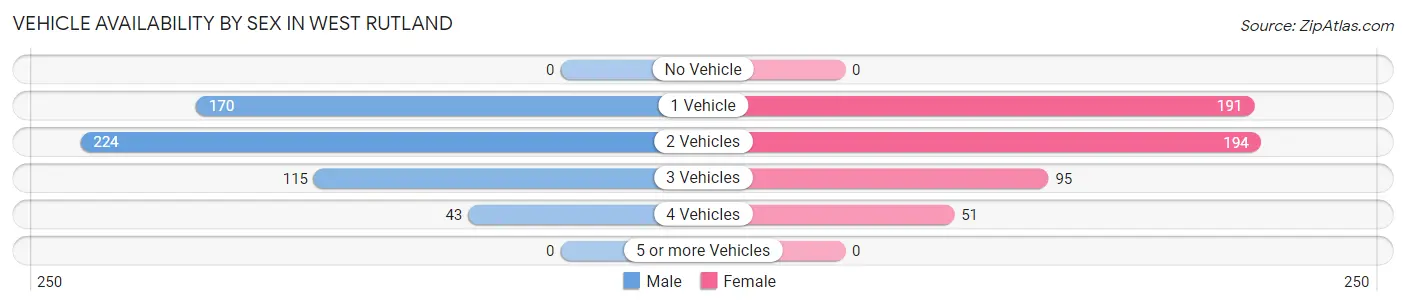
Vehicle Availability by Sex in West Rutland
The most prevalent vehicle ownership categories in West Rutland are males with 2 vehicles (224, accounting for 40.6%) and females with 2 vehicles (194, making up 42.2%).
| Vehicles Available | Male | Female |
| No Vehicle | 0 (0.0%) | 0 (0.0%) |
| 1 Vehicle | 170 (30.8%) | 191 (36.0%) |
| 2 Vehicles | 224 (40.6%) | 194 (36.5%) |
| 3 Vehicles | 115 (20.8%) | 95 (17.9%) |
| 4 Vehicles | 43 (7.8%) | 51 (9.6%) |
| 5 or more Vehicles | 0 (0.0%) | 0 (0.0%) |
| Total | 552 (100.0%) | 531 (100.0%) |
Commute Time in West Rutland
The most frequently occuring commute durations in West Rutland are 15 to 19 minutes (383 commuters, 40.1%), 10 to 14 minutes (197 commuters, 20.6%), and 20 to 24 minutes (108 commuters, 11.3%).
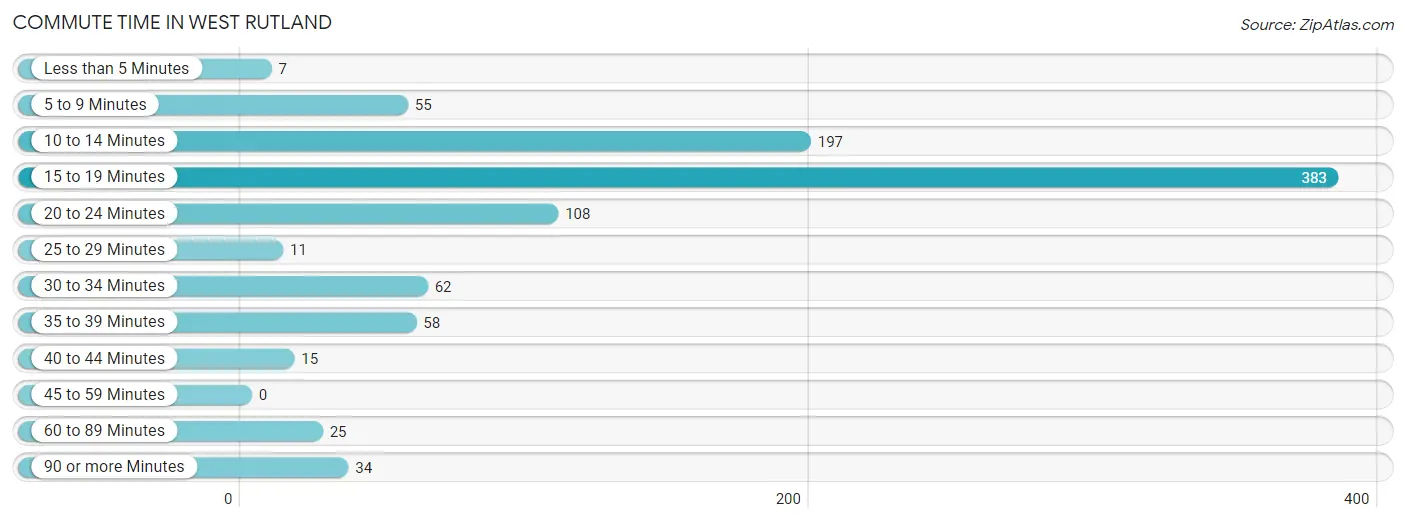
| Commute Time | # Commuters | % Commuters |
| Less than 5 Minutes | 7 | 0.7% |
| 5 to 9 Minutes | 55 | 5.8% |
| 10 to 14 Minutes | 197 | 20.6% |
| 15 to 19 Minutes | 383 | 40.1% |
| 20 to 24 Minutes | 108 | 11.3% |
| 25 to 29 Minutes | 11 | 1.1% |
| 30 to 34 Minutes | 62 | 6.5% |
| 35 to 39 Minutes | 58 | 6.1% |
| 40 to 44 Minutes | 15 | 1.6% |
| 45 to 59 Minutes | 0 | 0.0% |
| 60 to 89 Minutes | 25 | 2.6% |
| 90 or more Minutes | 34 | 3.6% |
Commute Time by Sex in West Rutland
The most common commute times in West Rutland are 15 to 19 minutes (244 commuters, 50.5%) for males and 10 to 14 minutes (141 commuters, 29.9%) for females.
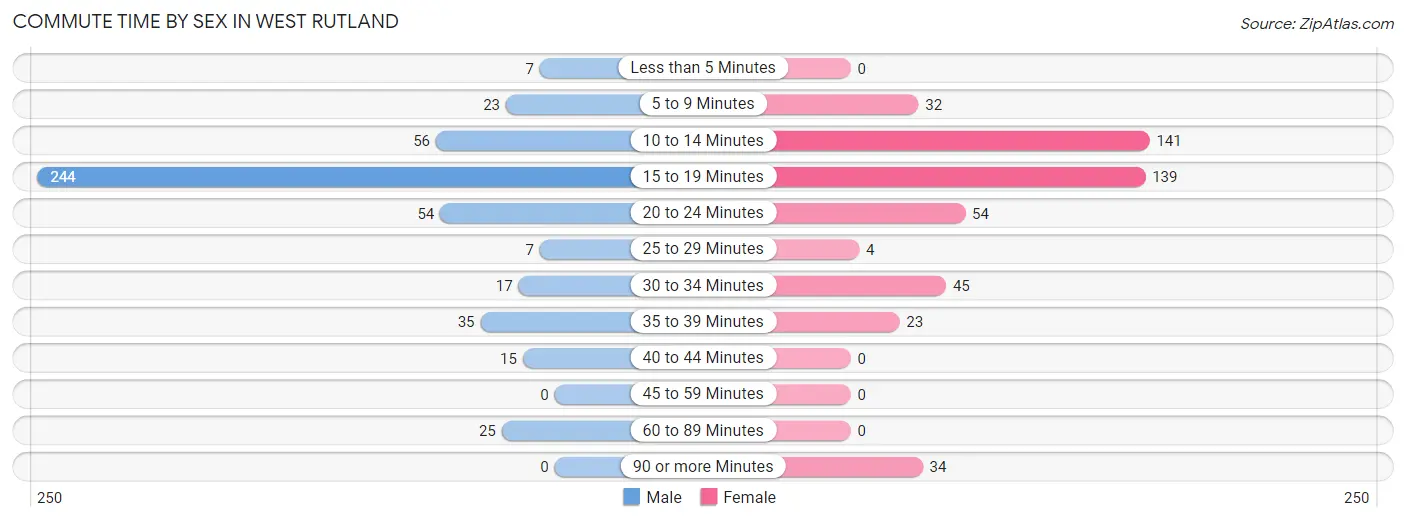
| Commute Time | Male | Female |
| Less than 5 Minutes | 7 (1.5%) | 0 (0.0%) |
| 5 to 9 Minutes | 23 (4.8%) | 32 (6.8%) |
| 10 to 14 Minutes | 56 (11.6%) | 141 (29.9%) |
| 15 to 19 Minutes | 244 (50.5%) | 139 (29.4%) |
| 20 to 24 Minutes | 54 (11.2%) | 54 (11.4%) |
| 25 to 29 Minutes | 7 (1.5%) | 4 (0.9%) |
| 30 to 34 Minutes | 17 (3.5%) | 45 (9.5%) |
| 35 to 39 Minutes | 35 (7.2%) | 23 (4.9%) |
| 40 to 44 Minutes | 15 (3.1%) | 0 (0.0%) |
| 45 to 59 Minutes | 0 (0.0%) | 0 (0.0%) |
| 60 to 89 Minutes | 25 (5.2%) | 0 (0.0%) |
| 90 or more Minutes | 0 (0.0%) | 34 (7.2%) |
Time of Departure to Work by Sex in West Rutland
The most frequent times of departure to work in West Rutland are 6:00 AM to 6:29 AM (128, 26.5%) for males and 7:00 AM to 7:29 AM (97, 20.5%) for females.
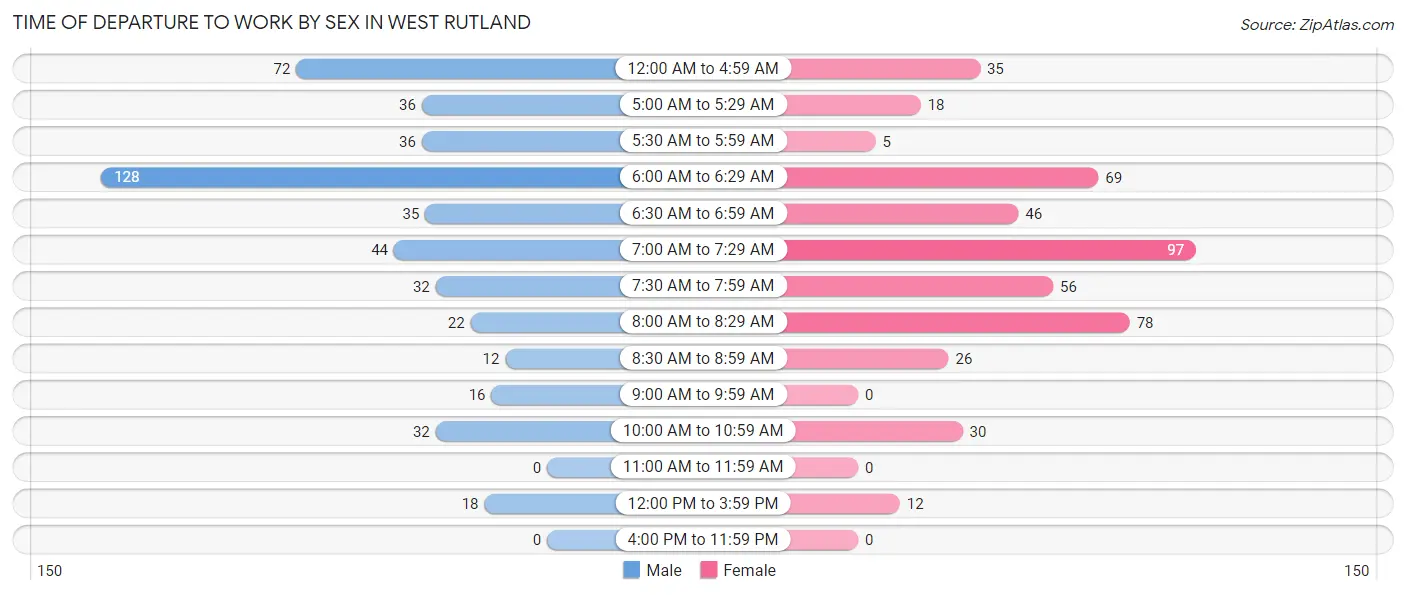
| Time of Departure | Male | Female |
| 12:00 AM to 4:59 AM | 72 (14.9%) | 35 (7.4%) |
| 5:00 AM to 5:29 AM | 36 (7.4%) | 18 (3.8%) |
| 5:30 AM to 5:59 AM | 36 (7.4%) | 5 (1.1%) |
| 6:00 AM to 6:29 AM | 128 (26.5%) | 69 (14.6%) |
| 6:30 AM to 6:59 AM | 35 (7.2%) | 46 (9.8%) |
| 7:00 AM to 7:29 AM | 44 (9.1%) | 97 (20.5%) |
| 7:30 AM to 7:59 AM | 32 (6.6%) | 56 (11.9%) |
| 8:00 AM to 8:29 AM | 22 (4.5%) | 78 (16.5%) |
| 8:30 AM to 8:59 AM | 12 (2.5%) | 26 (5.5%) |
| 9:00 AM to 9:59 AM | 16 (3.3%) | 0 (0.0%) |
| 10:00 AM to 10:59 AM | 32 (6.6%) | 30 (6.4%) |
| 11:00 AM to 11:59 AM | 0 (0.0%) | 0 (0.0%) |
| 12:00 PM to 3:59 PM | 18 (3.7%) | 12 (2.5%) |
| 4:00 PM to 11:59 PM | 0 (0.0%) | 0 (0.0%) |
| Total | 483 (100.0%) | 472 (100.0%) |
Housing Occupancy in West Rutland
Occupancy by Ownership in West Rutland
Of the total 954 dwellings in West Rutland, owner-occupied units account for 687 (72.0%), while renter-occupied units make up 267 (28.0%).
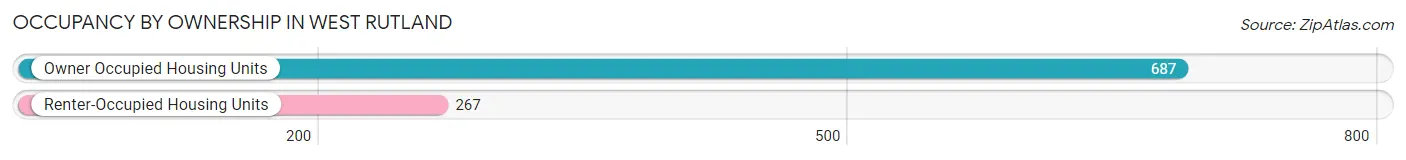
| Occupancy | # Housing Units | % Housing Units |
| Owner Occupied Housing Units | 687 | 72.0% |
| Renter-Occupied Housing Units | 267 | 28.0% |
| Total Occupied Housing Units | 954 | 100.0% |
Occupancy by Household Size in West Rutland
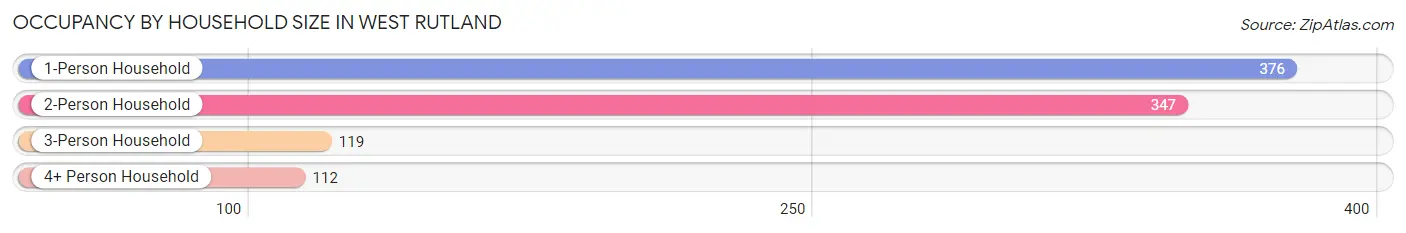
| Household Size | # Housing Units | % Housing Units |
| 1-Person Household | 376 | 39.4% |
| 2-Person Household | 347 | 36.4% |
| 3-Person Household | 119 | 12.5% |
| 4+ Person Household | 112 | 11.7% |
| Total Housing Units | 954 | 100.0% |
Occupancy by Ownership by Household Size in West Rutland
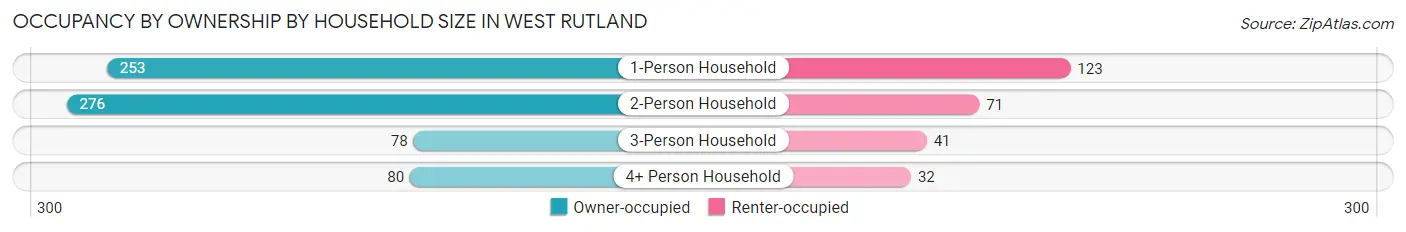
| Household Size | Owner-occupied | Renter-occupied |
| 1-Person Household | 253 (67.3%) | 123 (32.7%) |
| 2-Person Household | 276 (79.5%) | 71 (20.5%) |
| 3-Person Household | 78 (65.5%) | 41 (34.4%) |
| 4+ Person Household | 80 (71.4%) | 32 (28.6%) |
| Total Housing Units | 687 (72.0%) | 267 (28.0%) |
Occupancy by Educational Attainment in West Rutland
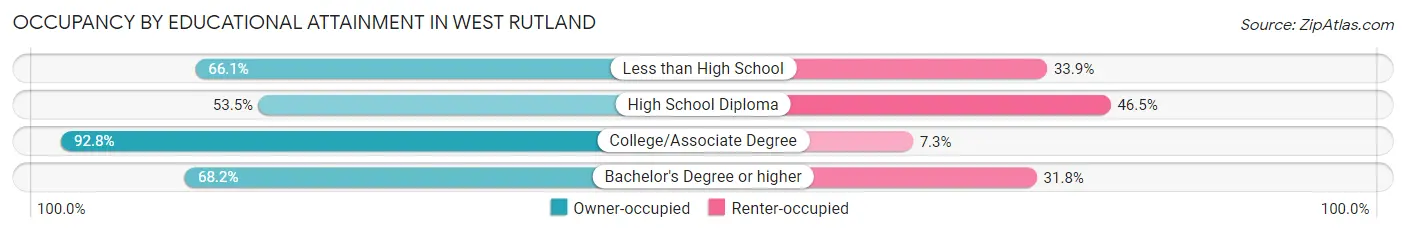
| Household Size | Owner-occupied | Renter-occupied |
| Less than High School | 41 (66.1%) | 21 (33.9%) |
| High School Diploma | 159 (53.5%) | 138 (46.5%) |
| College/Associate Degree | 307 (92.7%) | 24 (7.2%) |
| Bachelor's Degree or higher | 180 (68.2%) | 84 (31.8%) |
Occupancy by Age of Householder in West Rutland
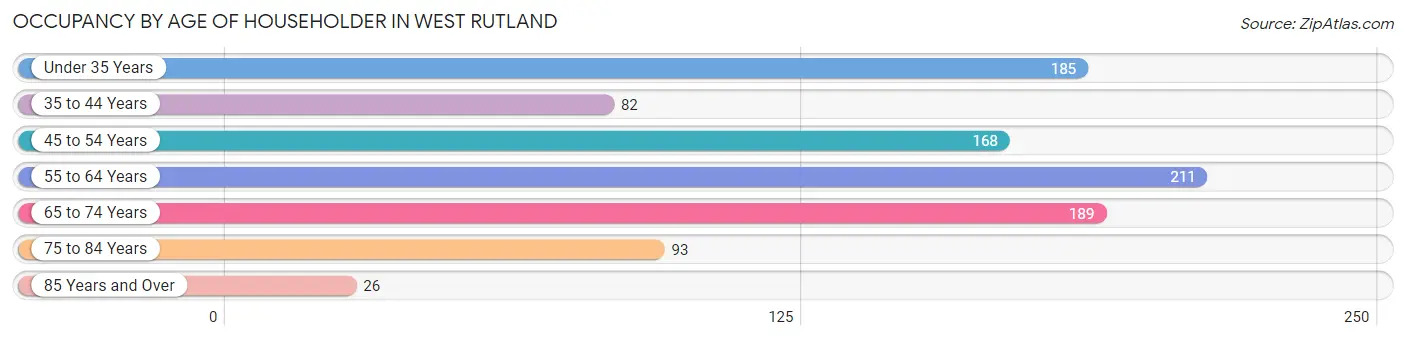
| Age Bracket | # Households | % Households |
| Under 35 Years | 185 | 19.4% |
| 35 to 44 Years | 82 | 8.6% |
| 45 to 54 Years | 168 | 17.6% |
| 55 to 64 Years | 211 | 22.1% |
| 65 to 74 Years | 189 | 19.8% |
| 75 to 84 Years | 93 | 9.8% |
| 85 Years and Over | 26 | 2.7% |
| Total | 954 | 100.0% |
Housing Finances in West Rutland
Median Income by Occupancy in West Rutland
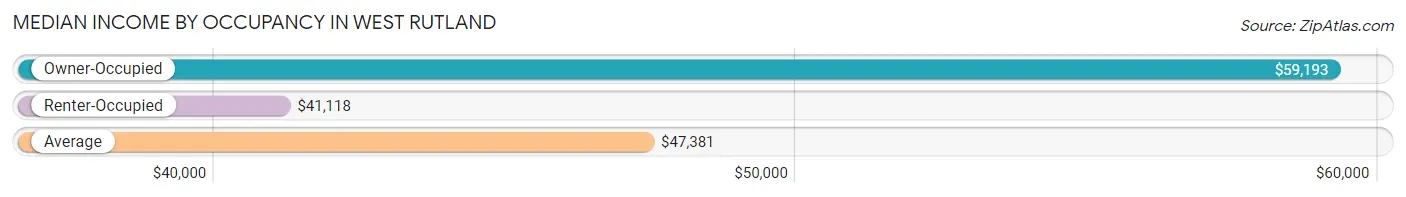
| Occupancy Type | # Households | Median Income |
| Owner-Occupied | 687 (72.0%) | $59,193 |
| Renter-Occupied | 267 (28.0%) | $41,118 |
| Average | 954 (100.0%) | $47,381 |
Occupancy by Householder Income Bracket in West Rutland
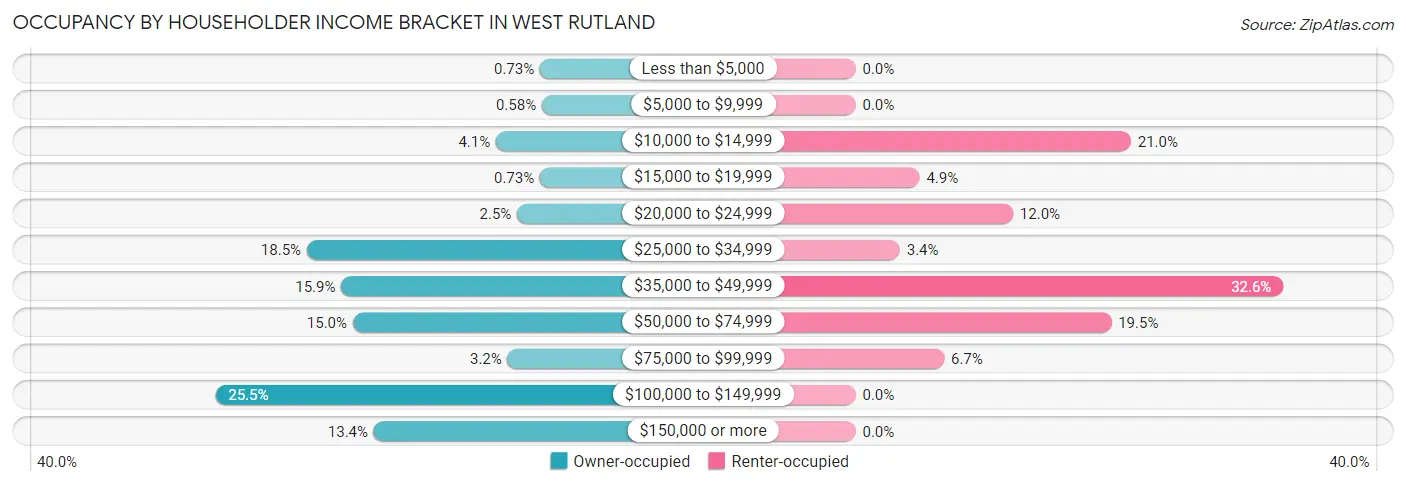
| Income Bracket | Owner-occupied | Renter-occupied |
| Less than $5,000 | 5 (0.7%) | 0 (0.0%) |
| $5,000 to $9,999 | 4 (0.6%) | 0 (0.0%) |
| $10,000 to $14,999 | 28 (4.1%) | 56 (21.0%) |
| $15,000 to $19,999 | 5 (0.7%) | 13 (4.9%) |
| $20,000 to $24,999 | 17 (2.5%) | 32 (12.0%) |
| $25,000 to $34,999 | 127 (18.5%) | 9 (3.4%) |
| $35,000 to $49,999 | 109 (15.9%) | 87 (32.6%) |
| $50,000 to $74,999 | 103 (15.0%) | 52 (19.5%) |
| $75,000 to $99,999 | 22 (3.2%) | 18 (6.7%) |
| $100,000 to $149,999 | 175 (25.5%) | 0 (0.0%) |
| $150,000 or more | 92 (13.4%) | 0 (0.0%) |
| Total | 687 (100.0%) | 267 (100.0%) |
Monthly Housing Cost Tiers in West Rutland
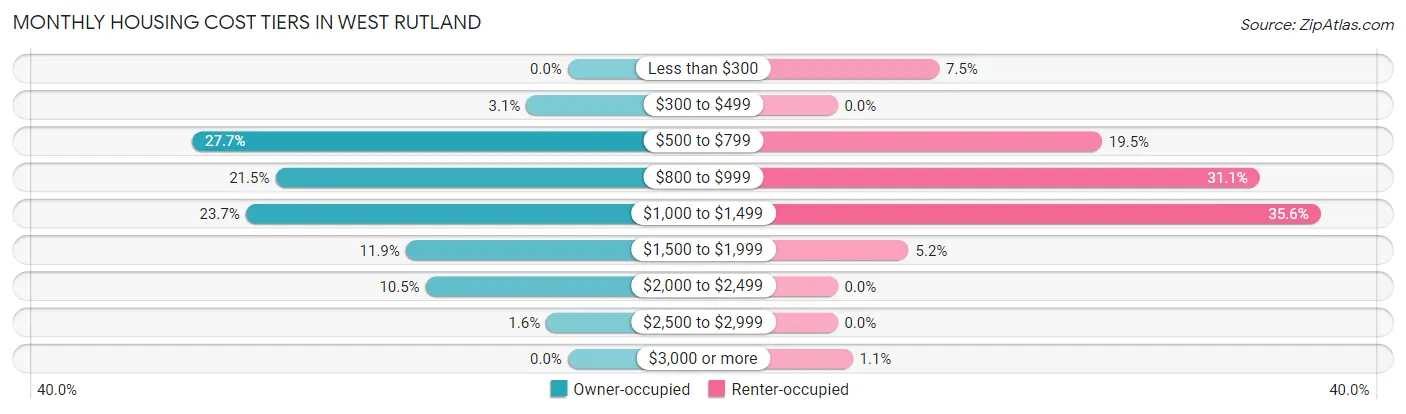
| Monthly Cost | Owner-occupied | Renter-occupied |
| Less than $300 | 0 (0.0%) | 20 (7.5%) |
| $300 to $499 | 21 (3.1%) | 0 (0.0%) |
| $500 to $799 | 190 (27.7%) | 52 (19.5%) |
| $800 to $999 | 148 (21.5%) | 83 (31.1%) |
| $1,000 to $1,499 | 163 (23.7%) | 95 (35.6%) |
| $1,500 to $1,999 | 82 (11.9%) | 14 (5.2%) |
| $2,000 to $2,499 | 72 (10.5%) | 0 (0.0%) |
| $2,500 to $2,999 | 11 (1.6%) | 0 (0.0%) |
| $3,000 or more | 0 (0.0%) | 3 (1.1%) |
| Total | 687 (100.0%) | 267 (100.0%) |
Physical Housing Characteristics in West Rutland
Housing Structures in West Rutland
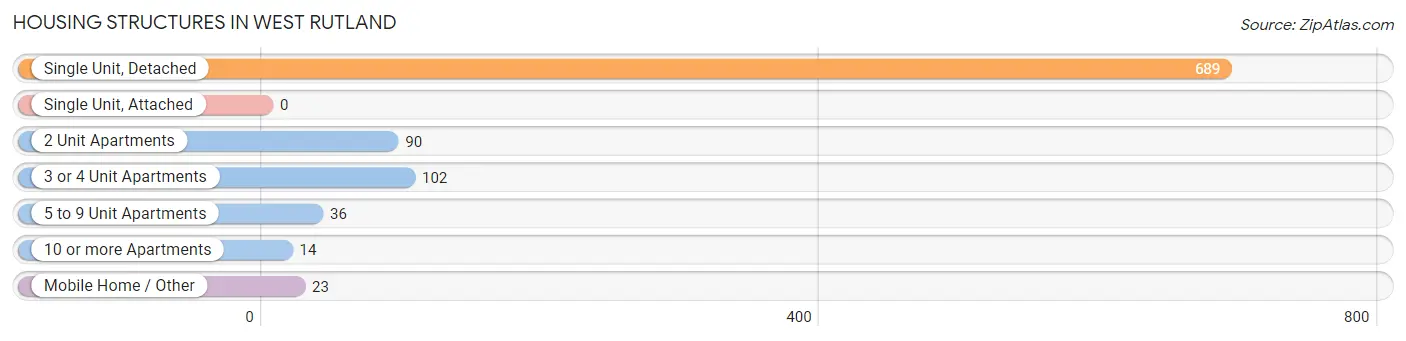
| Structure Type | # Housing Units | % Housing Units |
| Single Unit, Detached | 689 | 72.2% |
| Single Unit, Attached | 0 | 0.0% |
| 2 Unit Apartments | 90 | 9.4% |
| 3 or 4 Unit Apartments | 102 | 10.7% |
| 5 to 9 Unit Apartments | 36 | 3.8% |
| 10 or more Apartments | 14 | 1.5% |
| Mobile Home / Other | 23 | 2.4% |
| Total | 954 | 100.0% |
Housing Structures by Occupancy in West Rutland
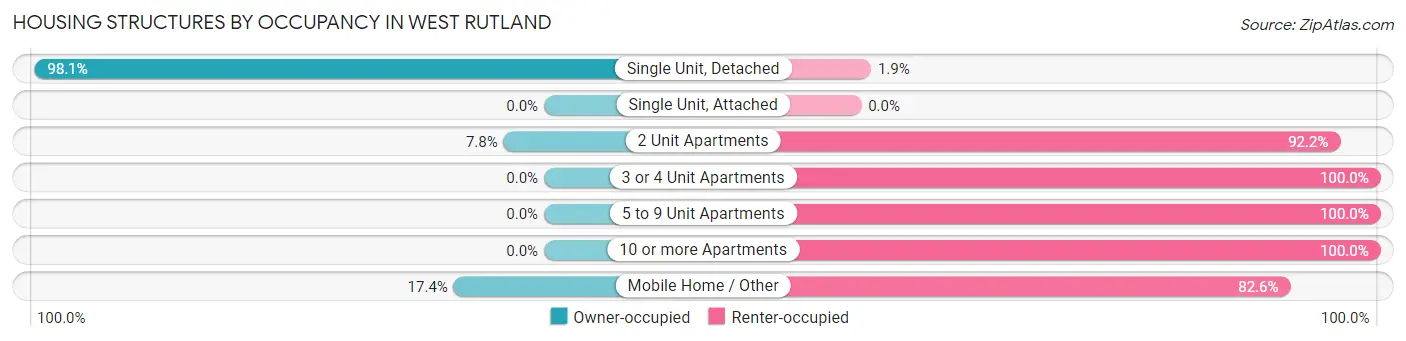
| Structure Type | Owner-occupied | Renter-occupied |
| Single Unit, Detached | 676 (98.1%) | 13 (1.9%) |
| Single Unit, Attached | 0 (0.0%) | 0 (0.0%) |
| 2 Unit Apartments | 7 (7.8%) | 83 (92.2%) |
| 3 or 4 Unit Apartments | 0 (0.0%) | 102 (100.0%) |
| 5 to 9 Unit Apartments | 0 (0.0%) | 36 (100.0%) |
| 10 or more Apartments | 0 (0.0%) | 14 (100.0%) |
| Mobile Home / Other | 4 (17.4%) | 19 (82.6%) |
| Total | 687 (72.0%) | 267 (28.0%) |
Housing Structures by Number of Rooms in West Rutland
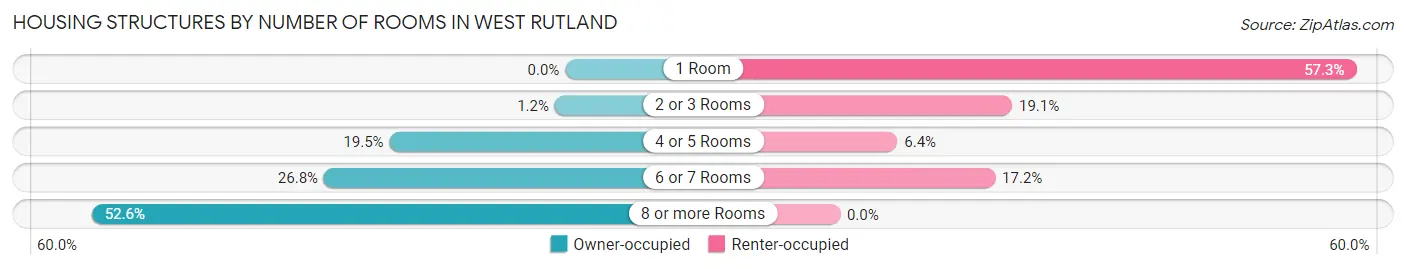
| Number of Rooms | Owner-occupied | Renter-occupied |
| 1 Room | 0 (0.0%) | 153 (57.3%) |
| 2 or 3 Rooms | 8 (1.2%) | 51 (19.1%) |
| 4 or 5 Rooms | 134 (19.5%) | 17 (6.4%) |
| 6 or 7 Rooms | 184 (26.8%) | 46 (17.2%) |
| 8 or more Rooms | 361 (52.5%) | 0 (0.0%) |
| Total | 687 (100.0%) | 267 (100.0%) |
Housing Structure by Heating Type in West Rutland
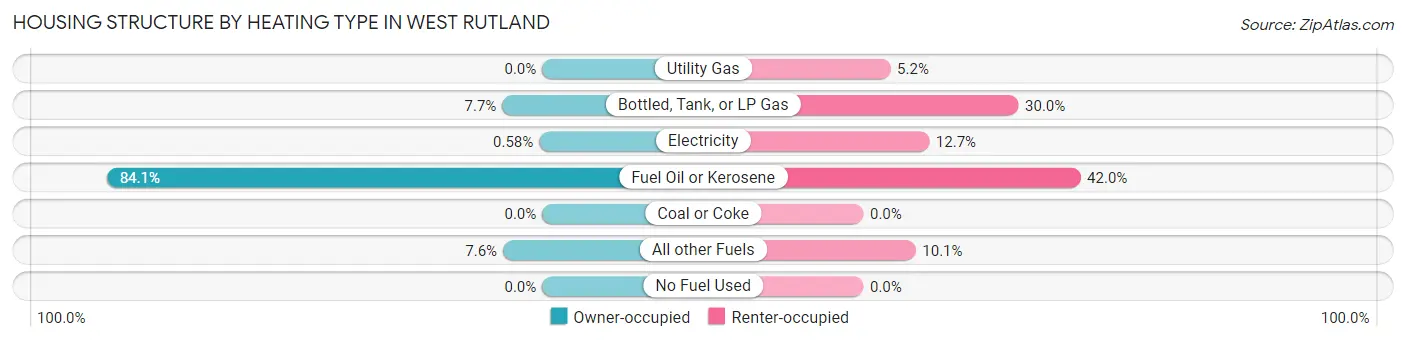
| Heating Type | Owner-occupied | Renter-occupied |
| Utility Gas | 0 (0.0%) | 14 (5.2%) |
| Bottled, Tank, or LP Gas | 53 (7.7%) | 80 (30.0%) |
| Electricity | 4 (0.6%) | 34 (12.7%) |
| Fuel Oil or Kerosene | 578 (84.1%) | 112 (41.9%) |
| Coal or Coke | 0 (0.0%) | 0 (0.0%) |
| All other Fuels | 52 (7.6%) | 27 (10.1%) |
| No Fuel Used | 0 (0.0%) | 0 (0.0%) |
| Total | 687 (100.0%) | 267 (100.0%) |
Household Vehicle Usage in West Rutland
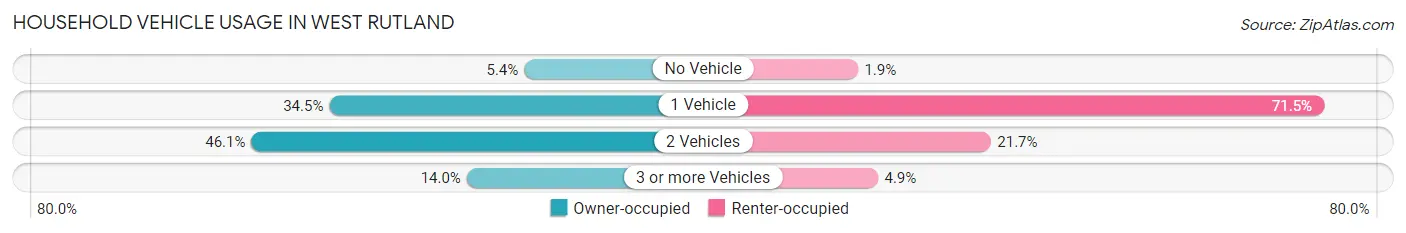
| Vehicles per Household | Owner-occupied | Renter-occupied |
| No Vehicle | 37 (5.4%) | 5 (1.9%) |
| 1 Vehicle | 237 (34.5%) | 191 (71.5%) |
| 2 Vehicles | 317 (46.1%) | 58 (21.7%) |
| 3 or more Vehicles | 96 (14.0%) | 13 (4.9%) |
| Total | 687 (100.0%) | 267 (100.0%) |
Real Estate & Mortgages in West Rutland
Real Estate and Mortgage Overview in West Rutland
| Characteristic | Without Mortgage | With Mortgage |
| Housing Units | 285 | 402 |
| Median Property Value | $184,500 | $158,300 |
| Median Household Income | $81,932 | $70 |
| Monthly Housing Costs | $799 | $0 |
| Real Estate Taxes | $3,541 | $4 |
Property Value by Mortgage Status in West Rutland
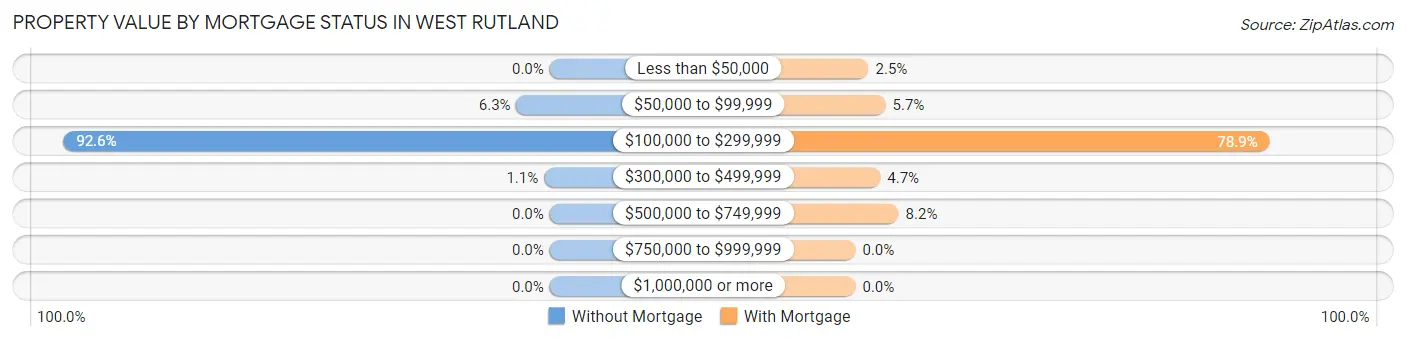
| Property Value | Without Mortgage | With Mortgage |
| Less than $50,000 | 0 (0.0%) | 10 (2.5%) |
| $50,000 to $99,999 | 18 (6.3%) | 23 (5.7%) |
| $100,000 to $299,999 | 264 (92.6%) | 317 (78.9%) |
| $300,000 to $499,999 | 3 (1.1%) | 19 (4.7%) |
| $500,000 to $749,999 | 0 (0.0%) | 33 (8.2%) |
| $750,000 to $999,999 | 0 (0.0%) | 0 (0.0%) |
| $1,000,000 or more | 0 (0.0%) | 0 (0.0%) |
| Total | 285 (100.0%) | 402 (100.0%) |
Household Income by Mortgage Status in West Rutland
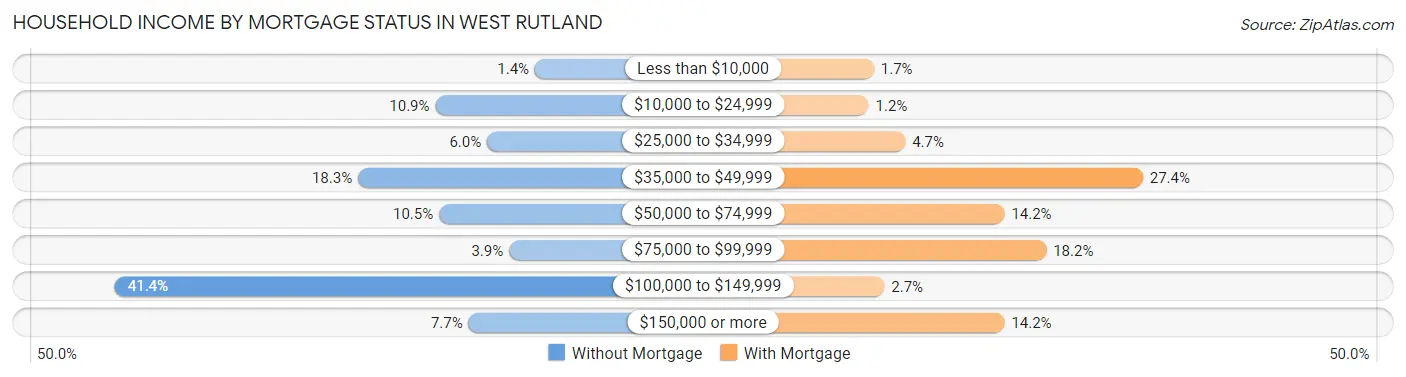
| Household Income | Without Mortgage | With Mortgage |
| Less than $10,000 | 4 (1.4%) | 7 (1.7%) |
| $10,000 to $24,999 | 31 (10.9%) | 5 (1.2%) |
| $25,000 to $34,999 | 17 (6.0%) | 19 (4.7%) |
| $35,000 to $49,999 | 52 (18.2%) | 110 (27.4%) |
| $50,000 to $74,999 | 30 (10.5%) | 57 (14.2%) |
| $75,000 to $99,999 | 11 (3.9%) | 73 (18.2%) |
| $100,000 to $149,999 | 118 (41.4%) | 11 (2.7%) |
| $150,000 or more | 22 (7.7%) | 57 (14.2%) |
| Total | 285 (100.0%) | 402 (100.0%) |
Property Value to Household Income Ratio in West Rutland
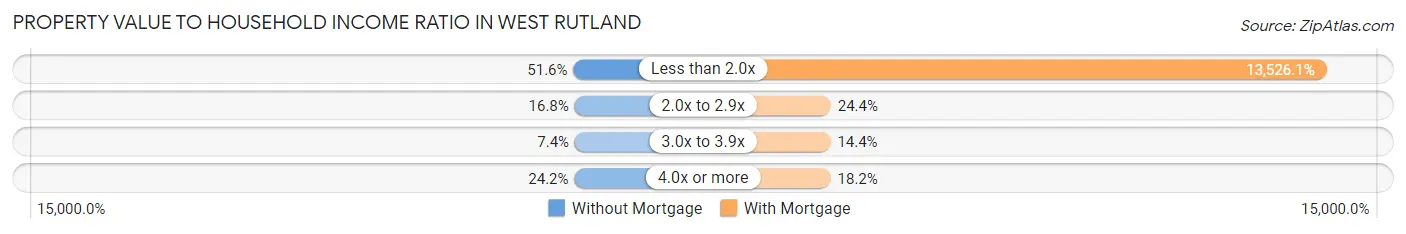
| Value-to-Income Ratio | Without Mortgage | With Mortgage |
| Less than 2.0x | 147 (51.6%) | 54,375 (13,526.1%) |
| 2.0x to 2.9x | 48 (16.8%) | 98 (24.4%) |
| 3.0x to 3.9x | 21 (7.4%) | 58 (14.4%) |
| 4.0x or more | 69 (24.2%) | 73 (18.2%) |
| Total | 285 (100.0%) | 402 (100.0%) |
Real Estate Taxes by Mortgage Status in West Rutland
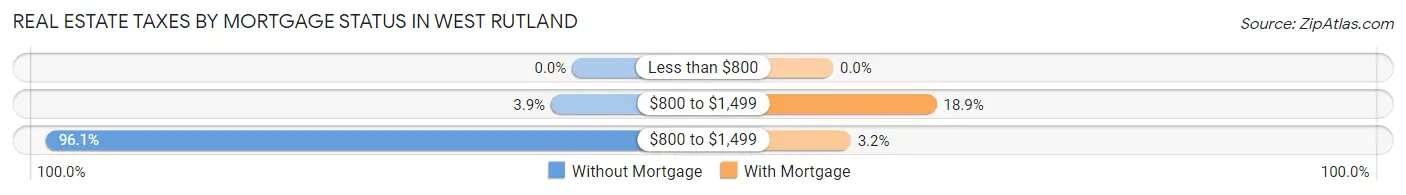
| Property Taxes | Without Mortgage | With Mortgage |
| Less than $800 | 0 (0.0%) | 0 (0.0%) |
| $800 to $1,499 | 11 (3.9%) | 76 (18.9%) |
| $800 to $1,499 | 274 (96.1%) | 13 (3.2%) |
| Total | 285 (100.0%) | 402 (100.0%) |
Health & Disability in West Rutland
Health Insurance Coverage by Age in West Rutland
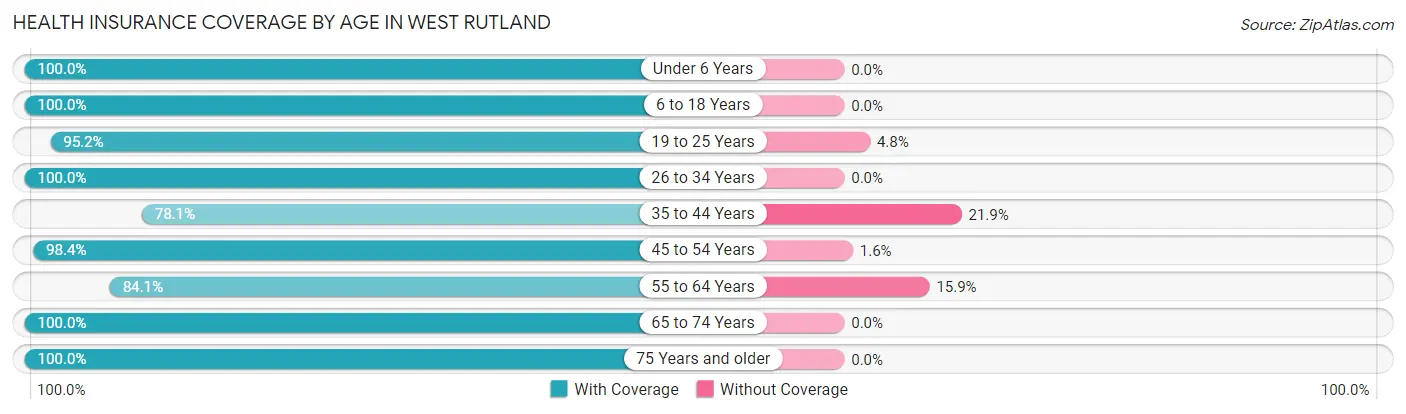
| Age Bracket | With Coverage | Without Coverage |
| Under 6 Years | 77 (100.0%) | 0 (0.0%) |
| 6 to 18 Years | 436 (100.0%) | 0 (0.0%) |
| 19 to 25 Years | 159 (95.2%) | 8 (4.8%) |
| 26 to 34 Years | 249 (100.0%) | 0 (0.0%) |
| 35 to 44 Years | 168 (78.1%) | 47 (21.9%) |
| 45 to 54 Years | 308 (98.4%) | 5 (1.6%) |
| 55 to 64 Years | 249 (84.1%) | 47 (15.9%) |
| 65 to 74 Years | 313 (100.0%) | 0 (0.0%) |
| 75 Years and older | 156 (100.0%) | 0 (0.0%) |
| Total | 2,115 (95.2%) | 107 (4.8%) |
Health Insurance Coverage by Citizenship Status in West Rutland
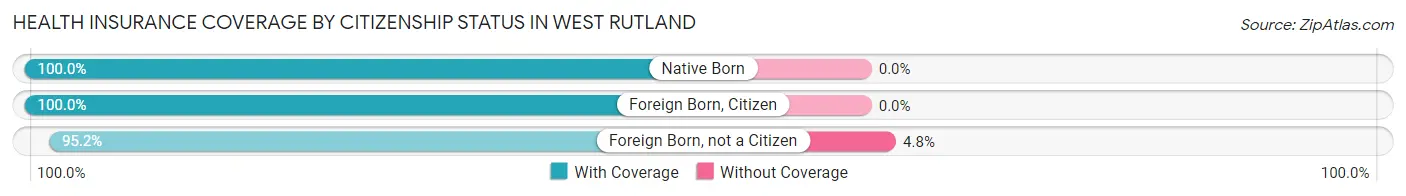
| Citizenship Status | With Coverage | Without Coverage |
| Native Born | 77 (100.0%) | 0 (0.0%) |
| Foreign Born, Citizen | 436 (100.0%) | 0 (0.0%) |
| Foreign Born, not a Citizen | 159 (95.2%) | 8 (4.8%) |
Health Insurance Coverage by Household Income in West Rutland
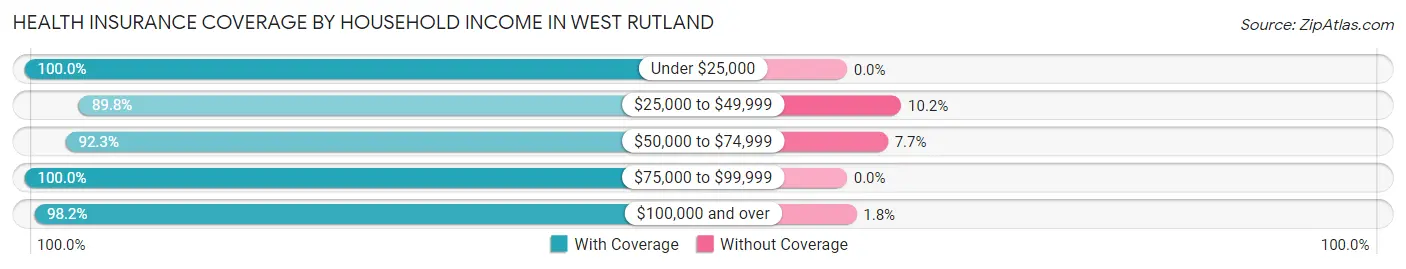
| Household Income | With Coverage | Without Coverage |
| Under $25,000 | 217 (100.0%) | 0 (0.0%) |
| $25,000 to $49,999 | 547 (89.8%) | 62 (10.2%) |
| $50,000 to $74,999 | 349 (92.3%) | 29 (7.7%) |
| $75,000 to $99,999 | 126 (100.0%) | 0 (0.0%) |
| $100,000 and over | 876 (98.2%) | 16 (1.8%) |
Public vs Private Health Insurance Coverage by Age in West Rutland
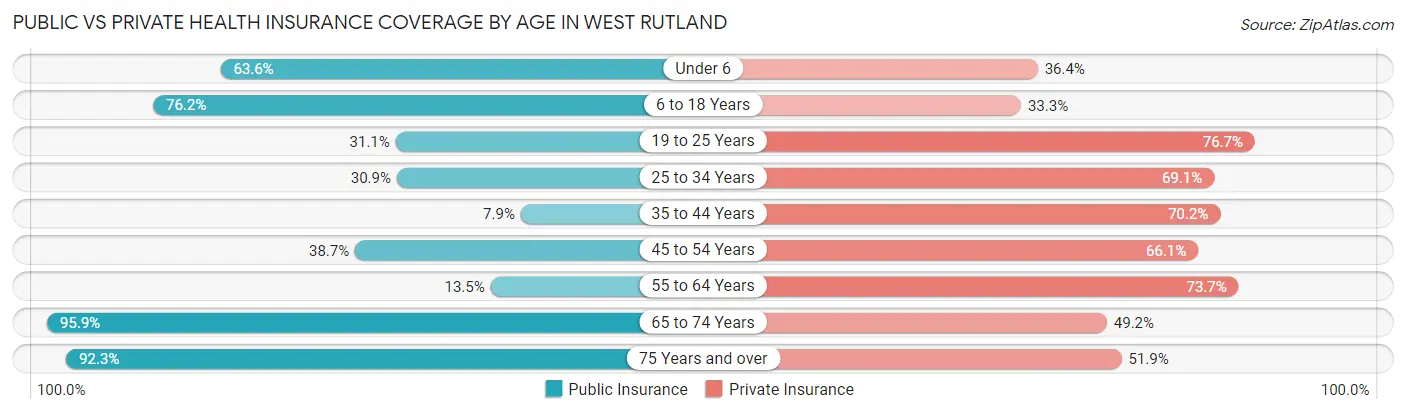
| Age Bracket | Public Insurance | Private Insurance |
| Under 6 | 49 (63.6%) | 28 (36.4%) |
| 6 to 18 Years | 332 (76.1%) | 145 (33.3%) |
| 19 to 25 Years | 52 (31.1%) | 128 (76.6%) |
| 25 to 34 Years | 77 (30.9%) | 172 (69.1%) |
| 35 to 44 Years | 17 (7.9%) | 151 (70.2%) |
| 45 to 54 Years | 121 (38.7%) | 207 (66.1%) |
| 55 to 64 Years | 40 (13.5%) | 218 (73.7%) |
| 65 to 74 Years | 300 (95.9%) | 154 (49.2%) |
| 75 Years and over | 144 (92.3%) | 81 (51.9%) |
| Total | 1,132 (50.9%) | 1,284 (57.8%) |
Disability Status by Sex by Age in West Rutland
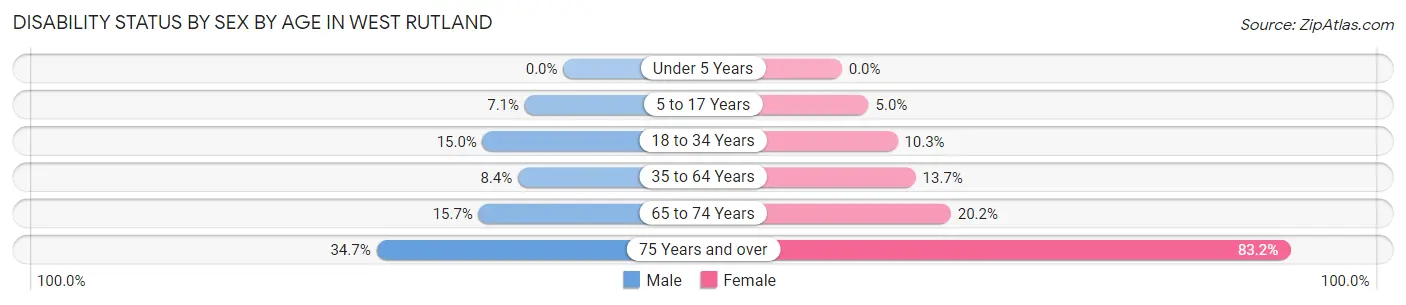
| Age Bracket | Male | Female |
| Under 5 Years | 0 (0.0%) | 0 (0.0%) |
| 5 to 17 Years | 8 (7.1%) | 15 (5.0%) |
| 18 to 34 Years | 25 (15.0%) | 28 (10.3%) |
| 35 to 64 Years | 38 (8.4%) | 51 (13.7%) |
| 65 to 74 Years | 22 (15.7%) | 35 (20.2%) |
| 75 Years and over | 17 (34.7%) | 89 (83.2%) |
Disability Class by Sex by Age in West Rutland
Disability Class: Hearing Difficulty
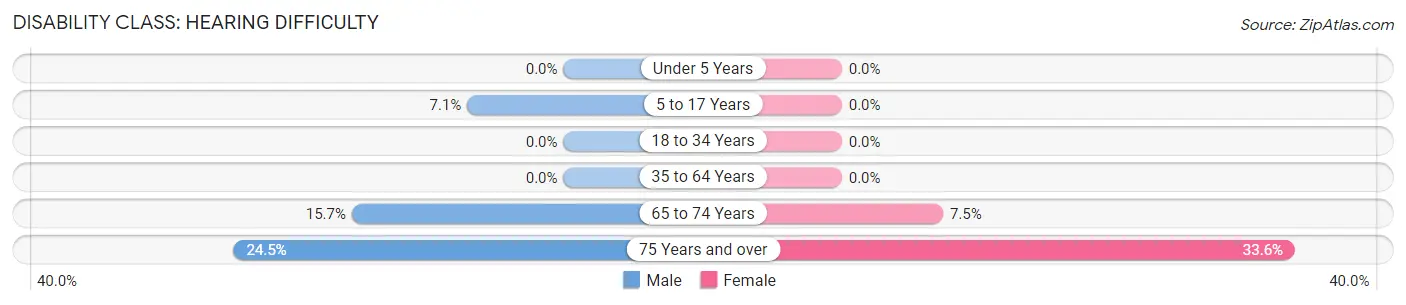
| Age Bracket | Male | Female |
| Under 5 Years | 0 (0.0%) | 0 (0.0%) |
| 5 to 17 Years | 8 (7.1%) | 0 (0.0%) |
| 18 to 34 Years | 0 (0.0%) | 0 (0.0%) |
| 35 to 64 Years | 0 (0.0%) | 0 (0.0%) |
| 65 to 74 Years | 22 (15.7%) | 13 (7.5%) |
| 75 Years and over | 12 (24.5%) | 36 (33.6%) |
Disability Class: Vision Difficulty
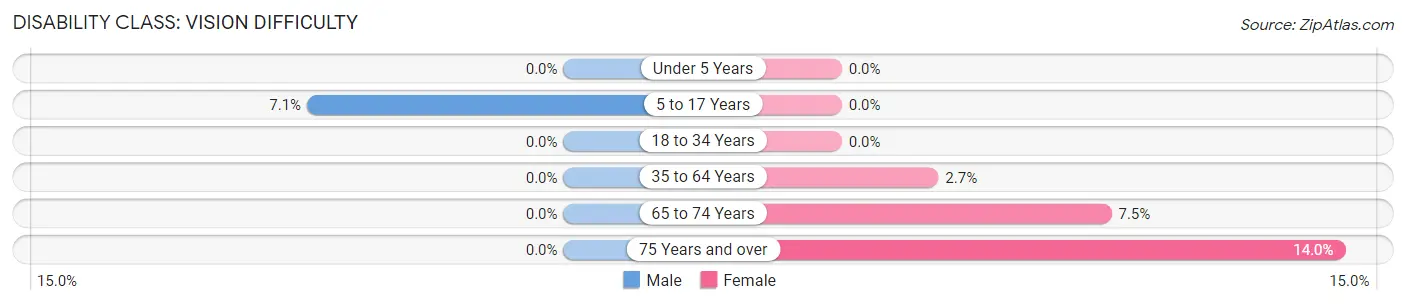
| Age Bracket | Male | Female |
| Under 5 Years | 0 (0.0%) | 0 (0.0%) |
| 5 to 17 Years | 8 (7.1%) | 0 (0.0%) |
| 18 to 34 Years | 0 (0.0%) | 0 (0.0%) |
| 35 to 64 Years | 0 (0.0%) | 10 (2.7%) |
| 65 to 74 Years | 0 (0.0%) | 13 (7.5%) |
| 75 Years and over | 0 (0.0%) | 15 (14.0%) |
Disability Class: Cognitive Difficulty
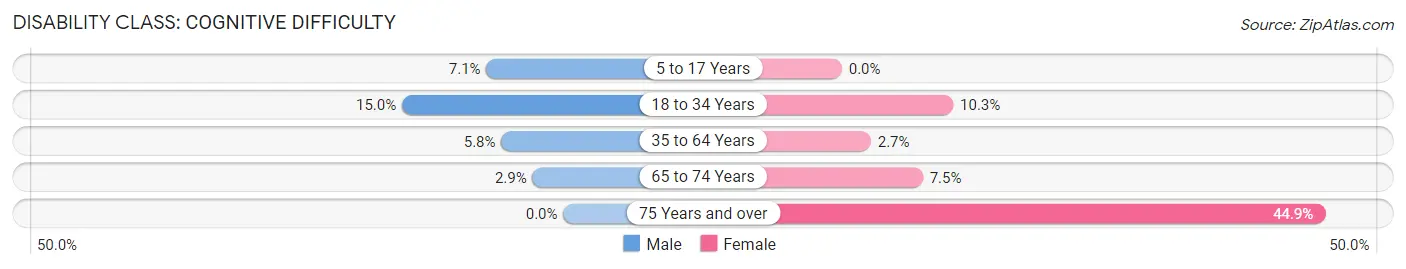
| Age Bracket | Male | Female |
| 5 to 17 Years | 8 (7.1%) | 0 (0.0%) |
| 18 to 34 Years | 25 (15.0%) | 28 (10.3%) |
| 35 to 64 Years | 26 (5.8%) | 10 (2.7%) |
| 65 to 74 Years | 4 (2.9%) | 13 (7.5%) |
| 75 Years and over | 0 (0.0%) | 48 (44.9%) |
Disability Class: Ambulatory Difficulty
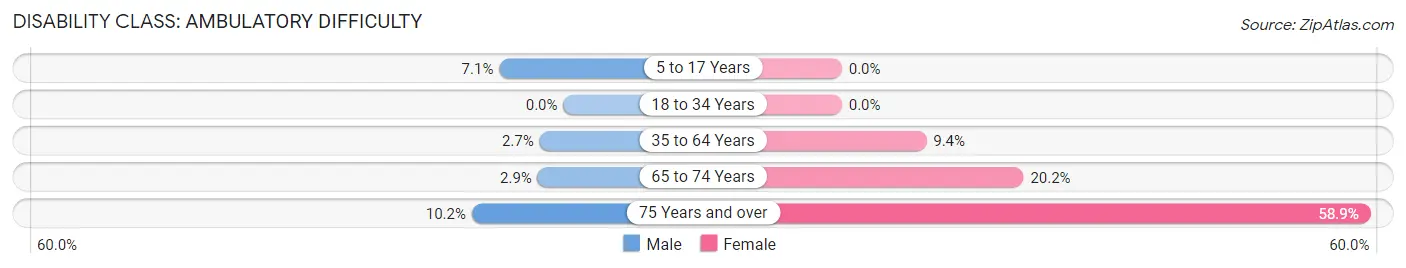
| Age Bracket | Male | Female |
| 5 to 17 Years | 8 (7.1%) | 0 (0.0%) |
| 18 to 34 Years | 0 (0.0%) | 0 (0.0%) |
| 35 to 64 Years | 12 (2.6%) | 35 (9.4%) |
| 65 to 74 Years | 4 (2.9%) | 35 (20.2%) |
| 75 Years and over | 5 (10.2%) | 63 (58.9%) |
Disability Class: Self-Care Difficulty
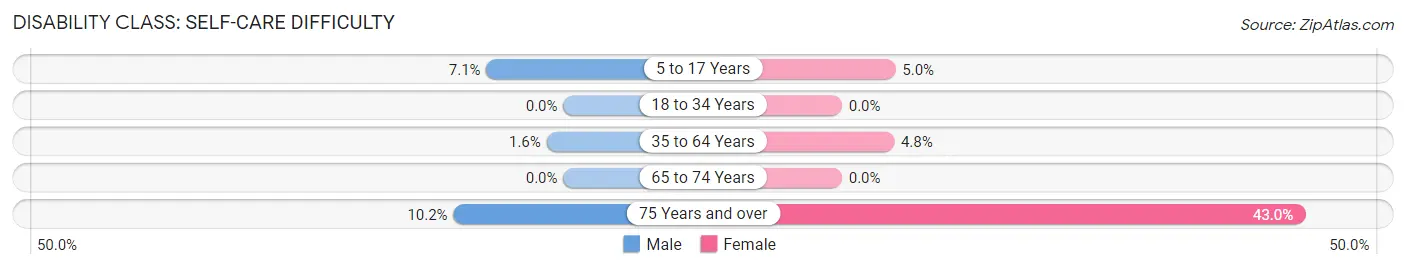
| Age Bracket | Male | Female |
| 5 to 17 Years | 8 (7.1%) | 15 (5.0%) |
| 18 to 34 Years | 0 (0.0%) | 0 (0.0%) |
| 35 to 64 Years | 7 (1.5%) | 18 (4.8%) |
| 65 to 74 Years | 0 (0.0%) | 0 (0.0%) |
| 75 Years and over | 5 (10.2%) | 46 (43.0%) |
Technology Access in West Rutland
Computing Device Access in West Rutland
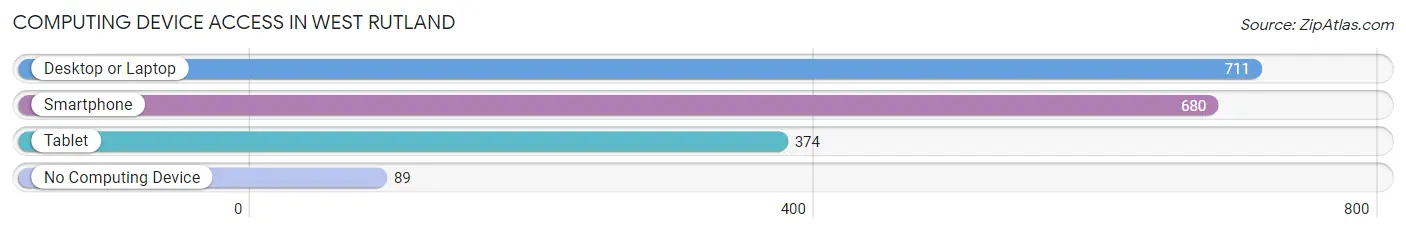
| Device Type | # Households | % Households |
| Desktop or Laptop | 711 | 74.5% |
| Smartphone | 680 | 71.3% |
| Tablet | 374 | 39.2% |
| No Computing Device | 89 | 9.3% |
| Total | 954 | 100.0% |
Internet Access in West Rutland
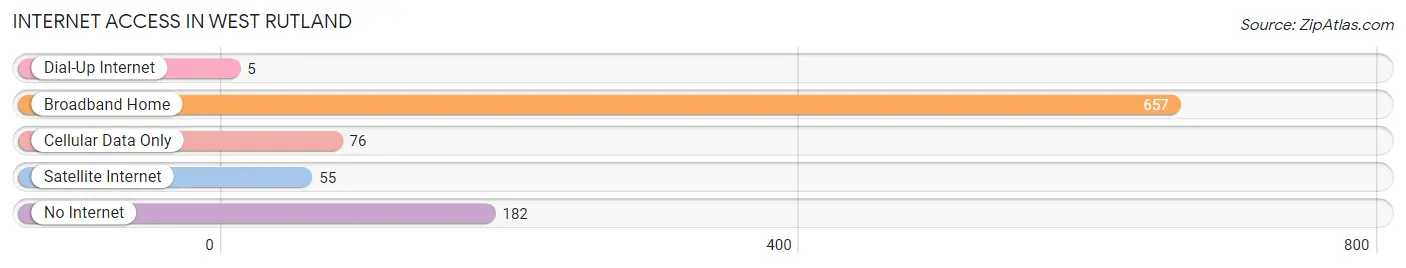
| Internet Type | # Households | % Households |
| Dial-Up Internet | 5 | 0.5% |
| Broadband Home | 657 | 68.9% |
| Cellular Data Only | 76 | 8.0% |
| Satellite Internet | 55 | 5.8% |
| No Internet | 182 | 19.1% |
| Total | 954 | 100.0% |
West Rutland Summary
History
West Rutland is a small town located in Rutland County, Vermont. It was first settled in 1770 by a group of settlers from Massachusetts. The town was originally known as "Westfield" and was part of the town of Rutland. In 1802, the town was officially incorporated as West Rutland.
The town was primarily an agricultural community for much of its history. The town was home to several small farms and a few small businesses. The town was also home to several marble quarries, which provided employment for many of the town's residents. The quarries were in operation until the early 20th century, when the demand for marble declined.
Geography
West Rutland is located in the western part of Rutland County, Vermont. It is bordered by the towns of Proctor to the north, Wallingford to the east, and Clarendon to the south. The town is situated in the Green Mountains and is home to several small mountains, including Mount Tom and Mount Hor. The town is also home to several small streams and ponds, including the West Rutland Marsh.
The town has a total area of 16.2 square miles, of which 16.1 square miles is land and 0.1 square miles is water. The town has a humid continental climate, with cold, snowy winters and warm, humid summers.
Economy
West Rutland is a small, rural town with a population of just over 1,000 people. The town's economy is largely based on agriculture and tourism. The town is home to several small farms, which produce a variety of crops, including corn, hay, and vegetables. The town is also home to several small businesses, including a few restaurants, a grocery store, and a few small shops.
The town is also home to several marble quarries, which are now inactive. The quarries were once a major source of employment for the town's residents, but the demand for marble has declined in recent years.
Demographics
As of the 2010 census, the population of West Rutland was 1,072. The racial makeup of the town was 97.2% White, 0.7% African American, 0.3% Native American, 0.2% Asian, 0.1% from other races, and 1.5% from two or more races. Hispanic or Latino of any race were 0.7% of the population.
The median household income in West Rutland was $45,938, and the median family income was $51,250. The per capita income for the town was $20,945. About 8.3% of families and 10.2% of the population were below the poverty line, including 14.2% of those under age 18 and 5.3% of those age 65 or over.
Common Questions
What is the Total Population of West Rutland?
Total Population of West Rutland is 2,222.
What is the Total Male Population of West Rutland?
Total Male Population of West Rutland is 982.
What is the Total Female Population of West Rutland?
Total Female Population of West Rutland is 1,240.
What is the Ratio of Males per 100 Females in West Rutland?
There are 79.19 Males per 100 Females in West Rutland.
What is the Ratio of Females per 100 Males in West Rutland?
There are 126.27 Females per 100 Males in West Rutland.
What is the Median Population Age in West Rutland?
Median Population Age in West Rutland is 43.1 Years.
What is the Average Family Size in West Rutland
Average Family Size in West Rutland is 3.2 People.
What is the Average Household Size in West Rutland
Average Household Size in West Rutland is 2.3 People.
What is Per Capita Income in West Rutland?
Per Capita income in West Rutland is $31,857.
What is the Median Family Income in West Rutland?
Median Family Income in West Rutland is $62,321.
What is the Median Household income in West Rutland?
Median Household Income in West Rutland is $47,381.
What is Income or Wage Gap in West Rutland?
Income or Wage Gap in West Rutland is 0.8%.
Women in West Rutland earn 99.2 cents for every dollar earned by a man.
What is Inequality or Gini Index in West Rutland?
Inequality or Gini Index in West Rutland is 0.41.
How Large is the Labor Force in West Rutland?
There are 1,106 People in the Labor Forcein in West Rutland.
What is the Percentage of People in the Labor Force in West Rutland?
61.9% of People are in the Labor Force in West Rutland.
What is the Unemployment Rate in West Rutland?
Unemployment Rate in West Rutland is 1.5%.