Vergennes, VT
Vergennes Map
Vergennes Overview
2,561
TOTAL POPULATION
1,149
MALE POPULATION
1,412
FEMALE POPULATION
81.37
MALES / 100 FEMALES
122.89
FEMALES / 100 MALES
45.2
MEDIAN AGE
2.8
AVG FAMILY SIZE
2.4
AVG HOUSEHOLD SIZE
$36,848
PER CAPITA INCOME
$91,154
AVG FAMILY INCOME
$72,171
AVG HOUSEHOLD INCOME
11.8%
WAGE / INCOME GAP [ % ]
88.2¢/ $1
WAGE / INCOME GAP [ $ ]
$11,885
FAMILY INCOME DEFICIT
0.42
INEQUALITY / GINI INDEX
1,575
LABOR FORCE [ PEOPLE ]
71.1%
PERCENT IN LABOR FORCE
2.0%
UNEMPLOYMENT RATE
Vergennes Zip Codes
Vergennes Area Codes
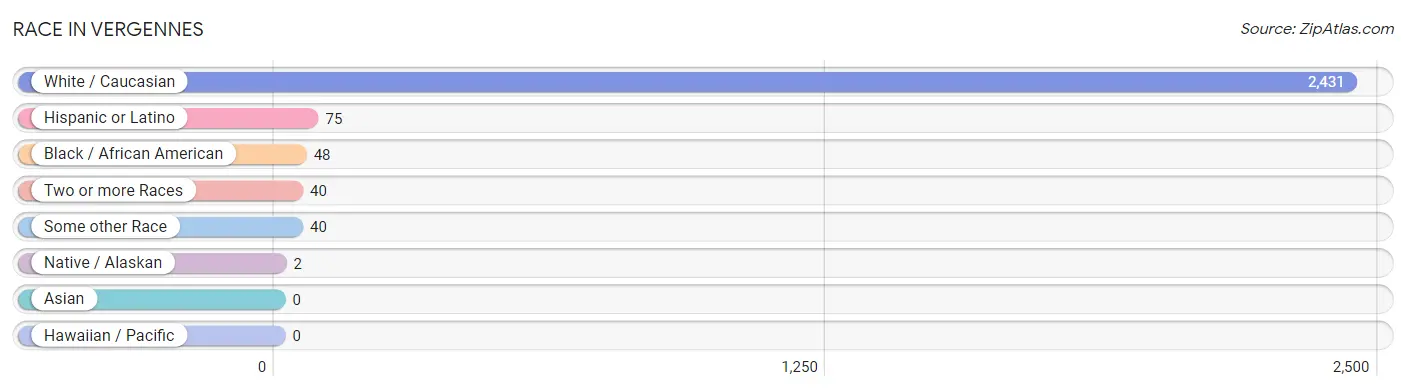
Race in Vergennes
The most populous races in Vergennes are White / Caucasian (2,431 | 94.9%), Hispanic or Latino (75 | 2.9%), and Black / African American (48 | 1.9%).
| Race | # Population | % Population |
| Asian | 0 | 0.0% |
| Black / African American | 48 | 1.9% |
| Hawaiian / Pacific | 0 | 0.0% |
| Hispanic or Latino | 75 | 2.9% |
| Native / Alaskan | 2 | 0.1% |
| White / Caucasian | 2,431 | 94.9% |
| Two or more Races | 40 | 1.6% |
| Some other Race | 40 | 1.6% |
| Total | 2,561 | 100.0% |
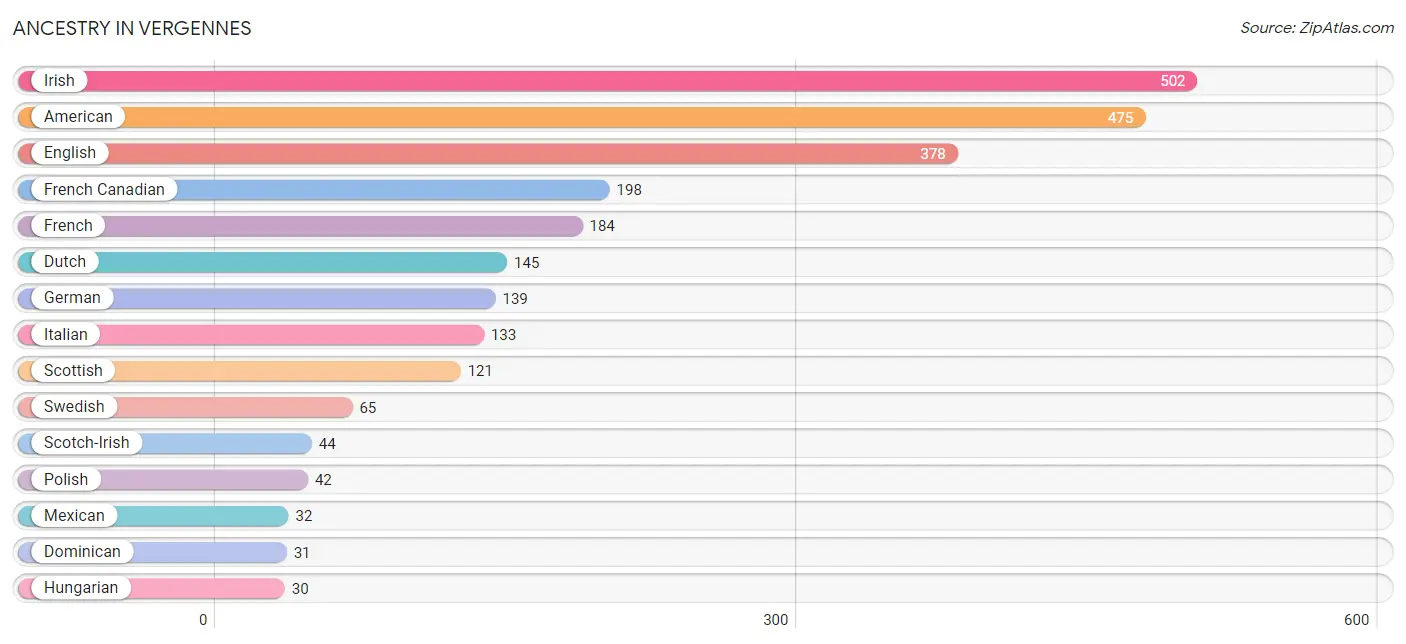
Ancestry in Vergennes
The most populous ancestries reported in Vergennes are Irish (502 | 19.6%), American (475 | 18.5%), English (378 | 14.8%), French Canadian (198 | 7.7%), and French (184 | 7.2%), together accounting for 67.8% of all Vergennes residents.
| Ancestry | # Population | % Population |
| American | 475 | 18.5% |
| Bhutanese | 4 | 0.2% |
| Blackfeet | 6 | 0.2% |
| British | 7 | 0.3% |
| Canadian | 25 | 1.0% |
| Cherokee | 9 | 0.4% |
| Croatian | 21 | 0.8% |
| Czechoslovakian | 16 | 0.6% |
| Danish | 10 | 0.4% |
| Dominican | 31 | 1.2% |
| Dutch | 145 | 5.7% |
| English | 378 | 14.8% |
| European | 22 | 0.9% |
| Finnish | 5 | 0.2% |
| French | 184 | 7.2% |
| French Canadian | 198 | 7.7% |
| German | 139 | 5.4% |
| Ghanaian | 25 | 1.0% |
| Hungarian | 30 | 1.2% |
| Irish | 502 | 19.6% |
| Italian | 133 | 5.2% |
| Jamaican | 15 | 0.6% |
| Korean | 7 | 0.3% |
| Lithuanian | 14 | 0.5% |
| Mexican | 32 | 1.3% |
| Northern European | 8 | 0.3% |
| Norwegian | 22 | 0.9% |
| Peruvian | 3 | 0.1% |
| Polish | 42 | 1.6% |
| Portuguese | 17 | 0.7% |
| Puerto Rican | 7 | 0.3% |
| Romanian | 5 | 0.2% |
| Russian | 14 | 0.5% |
| Scandinavian | 5 | 0.2% |
| Scotch-Irish | 44 | 1.7% |
| Scottish | 121 | 4.7% |
| South American | 3 | 0.1% |
| Spaniard | 2 | 0.1% |
| Subsaharan African | 25 | 1.0% |
| Swedish | 65 | 2.5% |
| Welsh | 24 | 0.9% |
| Yugoslavian | 6 | 0.2% | View All 42 Rows |
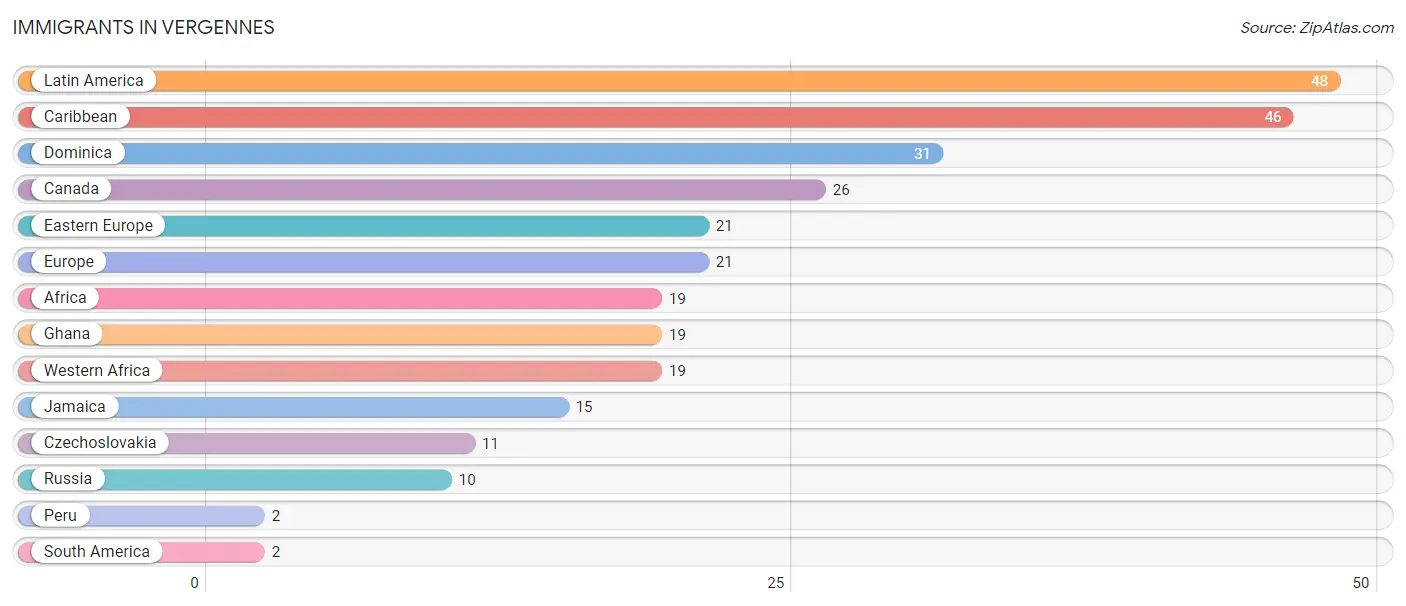
Immigrants in Vergennes
The most numerous immigrant groups reported in Vergennes came from Latin America (48 | 1.9%), Caribbean (46 | 1.8%), Dominica (31 | 1.2%), Canada (26 | 1.0%), and Eastern Europe (21 | 0.8%), together accounting for 6.7% of all Vergennes residents.
| Immigration Origin | # Population | % Population |
| Africa | 19 | 0.7% |
| Canada | 26 | 1.0% |
| Caribbean | 46 | 1.8% |
| Czechoslovakia | 11 | 0.4% |
| Dominica | 31 | 1.2% |
| Eastern Europe | 21 | 0.8% |
| Europe | 21 | 0.8% |
| Ghana | 19 | 0.7% |
| Jamaica | 15 | 0.6% |
| Latin America | 48 | 1.9% |
| Peru | 2 | 0.1% |
| Russia | 10 | 0.4% |
| South America | 2 | 0.1% |
| Western Africa | 19 | 0.7% | View All 14 Rows |
Sex and Age in Vergennes
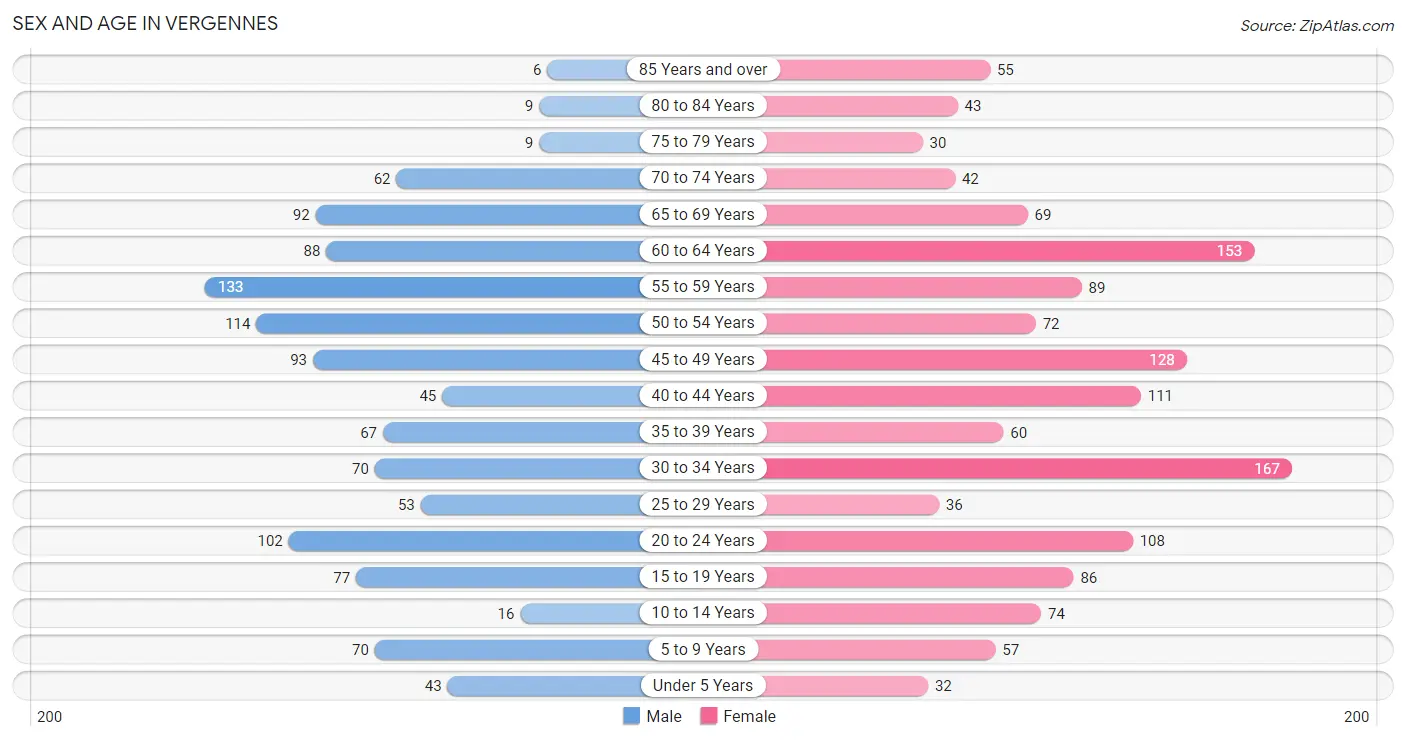
Sex and Age in Vergennes
The most populous age groups in Vergennes are 55 to 59 Years (133 | 11.6%) for men and 30 to 34 Years (167 | 11.8%) for women.
| Age Bracket | Male | Female |
| Under 5 Years | 43 (3.7%) | 32 (2.3%) |
| 5 to 9 Years | 70 (6.1%) | 57 (4.0%) |
| 10 to 14 Years | 16 (1.4%) | 74 (5.2%) |
| 15 to 19 Years | 77 (6.7%) | 86 (6.1%) |
| 20 to 24 Years | 102 (8.9%) | 108 (7.6%) |
| 25 to 29 Years | 53 (4.6%) | 36 (2.5%) |
| 30 to 34 Years | 70 (6.1%) | 167 (11.8%) |
| 35 to 39 Years | 67 (5.8%) | 60 (4.3%) |
| 40 to 44 Years | 45 (3.9%) | 111 (7.9%) |
| 45 to 49 Years | 93 (8.1%) | 128 (9.1%) |
| 50 to 54 Years | 114 (9.9%) | 72 (5.1%) |
| 55 to 59 Years | 133 (11.6%) | 89 (6.3%) |
| 60 to 64 Years | 88 (7.7%) | 153 (10.8%) |
| 65 to 69 Years | 92 (8.0%) | 69 (4.9%) |
| 70 to 74 Years | 62 (5.4%) | 42 (3.0%) |
| 75 to 79 Years | 9 (0.8%) | 30 (2.1%) |
| 80 to 84 Years | 9 (0.8%) | 43 (3.0%) |
| 85 Years and over | 6 (0.5%) | 55 (3.9%) |
| Total | 1,149 (100.0%) | 1,412 (100.0%) |
Families and Households in Vergennes
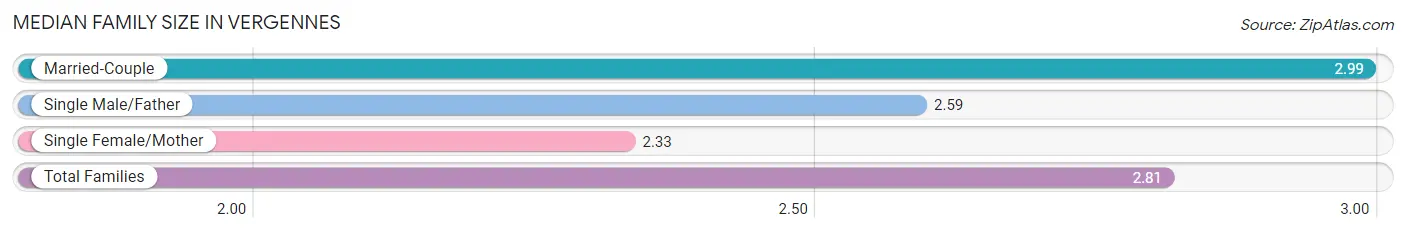
Median Family Size in Vergennes
The median family size in Vergennes is 2.81 persons per family, with married-couple families (463 | 71.2%) accounting for the largest median family size of 2.99 persons per family. On the other hand, single female/mother families (150 | 23.1%) represent the smallest median family size with 2.33 persons per family.
| Family Type | # Families | Family Size |
| Married-Couple | 463 (71.2%) | 2.99 |
| Single Male/Father | 37 (5.7%) | 2.59 |
| Single Female/Mother | 150 (23.1%) | 2.33 |
| Total Families | 650 (100.0%) | 2.81 |
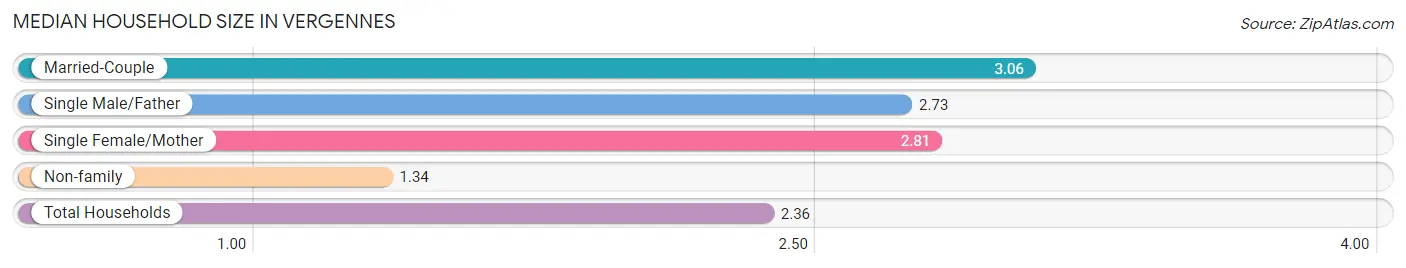
Median Household Size in Vergennes
The median household size in Vergennes is 2.36 persons per household, with married-couple households (463 | 44.2%) accounting for the largest median household size of 3.06 persons per household. non-family households (397 | 37.9%) represent the smallest median household size with 1.34 persons per household.
| Household Type | # Households | Household Size |
| Married-Couple | 463 (44.2%) | 3.06 |
| Single Male/Father | 37 (3.5%) | 2.73 |
| Single Female/Mother | 150 (14.3%) | 2.81 |
| Non-family | 397 (37.9%) | 1.34 |
| Total Households | 1,047 (100.0%) | 2.36 |
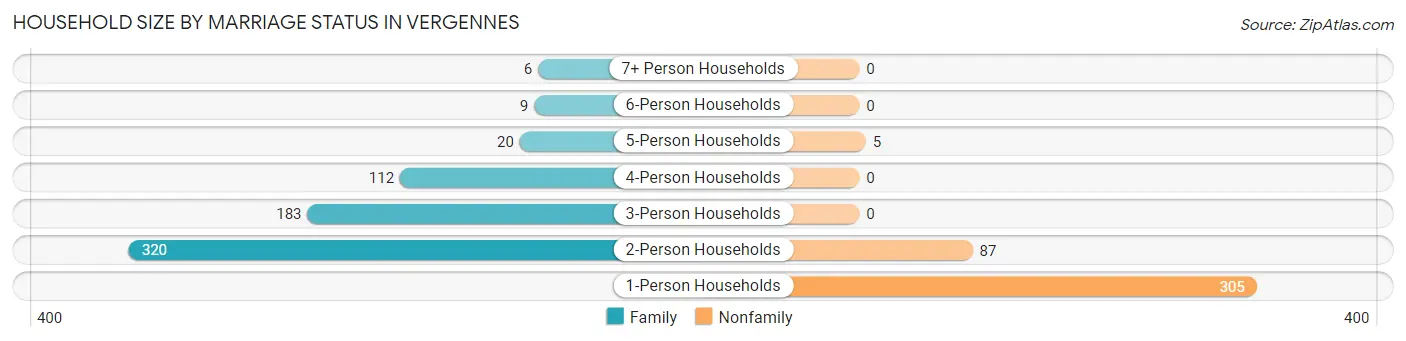
Household Size by Marriage Status in Vergennes
Out of a total of 1,047 households in Vergennes, 650 (62.1%) are family households, while 397 (37.9%) are nonfamily households. The most numerous type of family households are 2-person households, comprising 320, and the most common type of nonfamily households are 1-person households, comprising 305.
| Household Size | Family Households | Nonfamily Households |
| 1-Person Households | - | 305 (29.1%) |
| 2-Person Households | 320 (30.6%) | 87 (8.3%) |
| 3-Person Households | 183 (17.5%) | 0 (0.0%) |
| 4-Person Households | 112 (10.7%) | 0 (0.0%) |
| 5-Person Households | 20 (1.9%) | 5 (0.5%) |
| 6-Person Households | 9 (0.9%) | 0 (0.0%) |
| 7+ Person Households | 6 (0.6%) | 0 (0.0%) |
| Total | 650 (62.1%) | 397 (37.9%) |
Female Fertility in Vergennes
Fertility by Age in Vergennes
Average fertility rate in Vergennes is 46.0 births per 1,000 women. Women in the age bracket of 20 to 34 years have the highest fertility rate with 68.0 births per 1,000 women. Women in the age bracket of 20 to 34 years acount for 65.6% of all women with births.
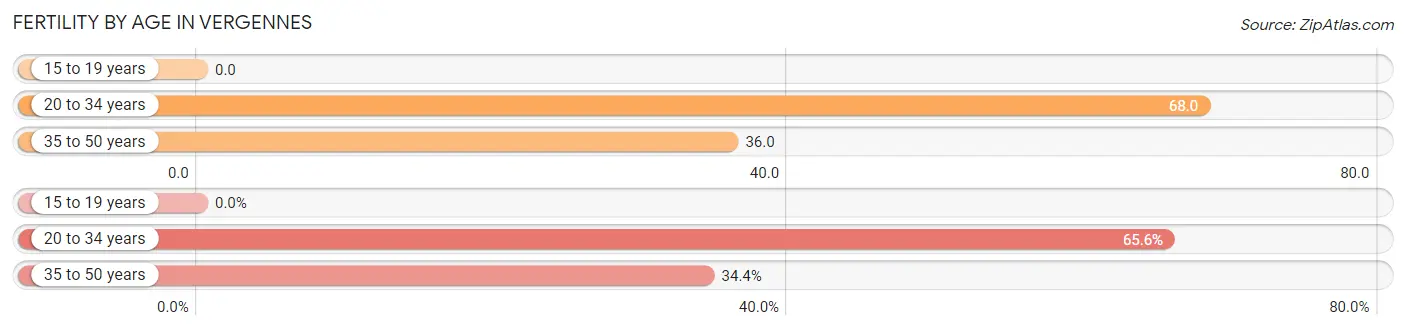
| Age Bracket | Women with Births | Births / 1,000 Women |
| 15 to 19 years | 0 (0.0%) | 0.0 |
| 20 to 34 years | 21 (65.6%) | 68.0 |
| 35 to 50 years | 11 (34.4%) | 36.0 |
| Total | 32 (100.0%) | 46.0 |
Fertility by Age by Marriage Status in Vergennes
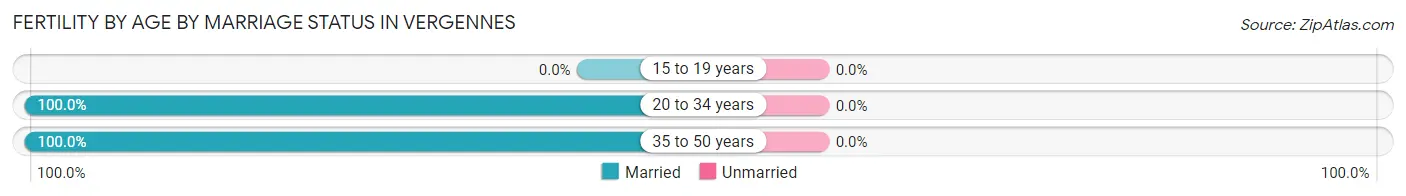
| Age Bracket | Married | Unmarried |
| 15 to 19 years | 0 (0.0%) | 0 (0.0%) |
| 20 to 34 years | 21 (100.0%) | 0 (0.0%) |
| 35 to 50 years | 11 (100.0%) | 0 (0.0%) |
| Total | 32 (100.0%) | 0 (0.0%) |
Fertility by Education in Vergennes
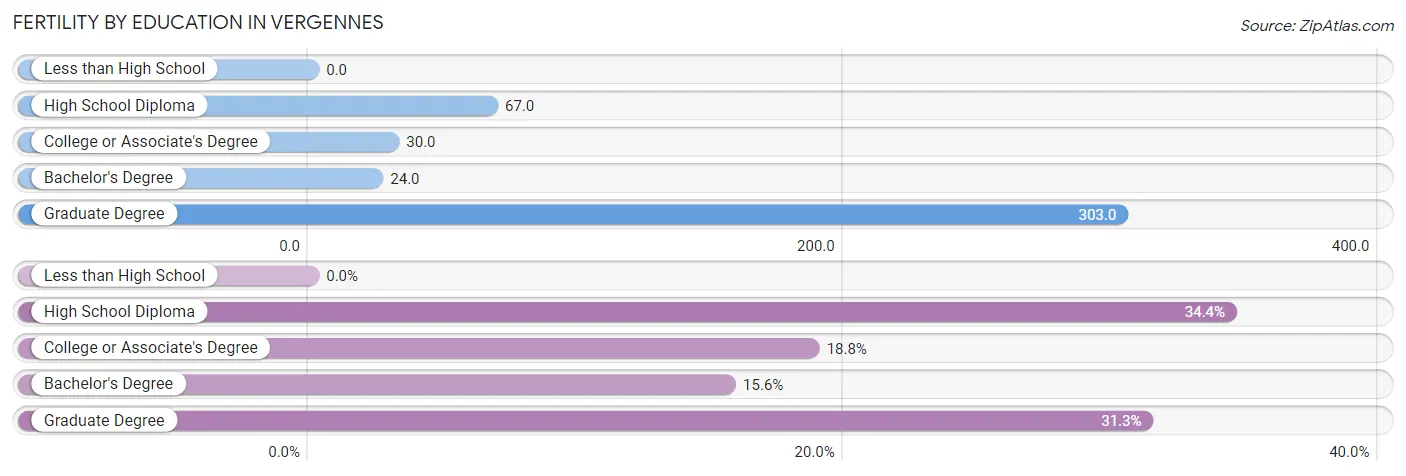
| Educational Attainment | Women with Births | Births / 1,000 Women |
| Less than High School | 0 (0.0%) | 0.0 |
| High School Diploma | 11 (34.4%) | 67.0 |
| College or Associate's Degree | 6 (18.8%) | 30.0 |
| Bachelor's Degree | 5 (15.6%) | 24.0 |
| Graduate Degree | 10 (31.2%) | 303.0 |
| Total | 32 (100.0%) | 46.0 |
Fertility by Education by Marriage Status in Vergennes
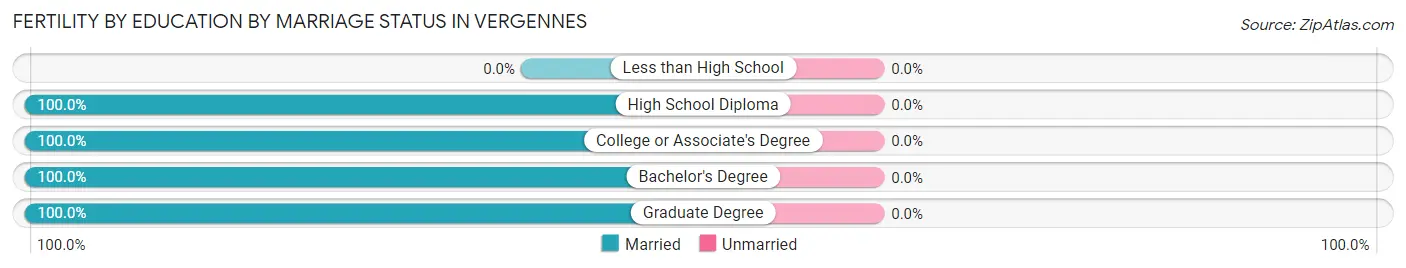
| Educational Attainment | Married | Unmarried |
| Less than High School | 0 (0.0%) | 0 (0.0%) |
| High School Diploma | 11 (100.0%) | 0 (0.0%) |
| College or Associate's Degree | 6 (100.0%) | 0 (0.0%) |
| Bachelor's Degree | 5 (100.0%) | 0 (0.0%) |
| Graduate Degree | 10 (100.0%) | 0 (0.0%) |
| Total | 32 (100.0%) | 0 (0.0%) |
Income in Vergennes
Income Overview in Vergennes
Per Capita Income in Vergennes is $36,848, while median incomes of families and households are $91,154 and $72,171 respectively.
| Characteristic | Number | Measure |
| Per Capita Income | 2,561 | $36,848 |
| Median Family Income | 650 | $91,154 |
| Mean Family Income | 650 | $101,490 |
| Median Household Income | 1,047 | $72,171 |
| Mean Household Income | 1,047 | $86,174 |
| Income Deficit | 650 | $11,885 |
| Wage / Income Gap (%) | 2,561 | 11.82% |
| Wage / Income Gap ($) | 2,561 | 88.18¢ per $1 |
| Gini / Inequality Index | 2,561 | 0.42 |
Earnings by Sex in Vergennes
Average Earnings in Vergennes are $40,757, $42,292 for men and $37,292 for women, a difference of 11.8%.
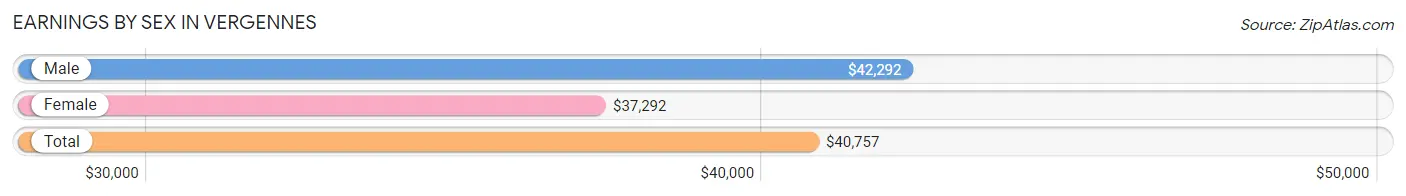
| Sex | Number | Average Earnings |
| Male | 760 (46.3%) | $42,292 |
| Female | 883 (53.7%) | $37,292 |
| Total | 1,643 (100.0%) | $40,757 |
Earnings by Sex by Income Bracket in Vergennes
The most common earnings brackets in Vergennes are $75,000 to $99,999 for men (94 | 12.4%) and $45,000 to $49,999 for women (98 | 11.1%).
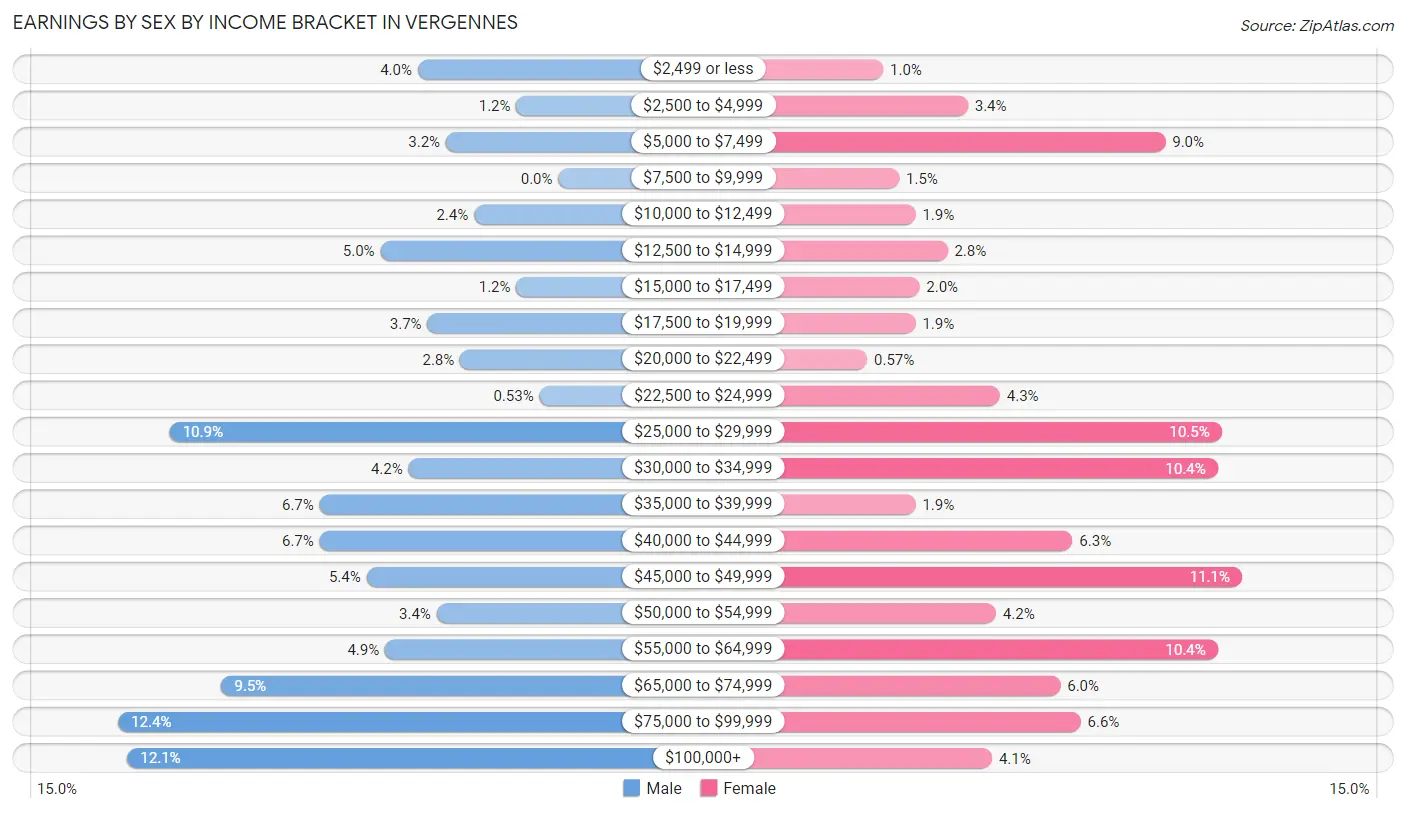
| Income | Male | Female |
| $2,499 or less | 30 (4.0%) | 9 (1.0%) |
| $2,500 to $4,999 | 9 (1.2%) | 30 (3.4%) |
| $5,000 to $7,499 | 24 (3.2%) | 79 (8.9%) |
| $7,500 to $9,999 | 0 (0.0%) | 13 (1.5%) |
| $10,000 to $12,499 | 18 (2.4%) | 17 (1.9%) |
| $12,500 to $14,999 | 38 (5.0%) | 25 (2.8%) |
| $15,000 to $17,499 | 9 (1.2%) | 18 (2.0%) |
| $17,500 to $19,999 | 28 (3.7%) | 17 (1.9%) |
| $20,000 to $22,499 | 21 (2.8%) | 5 (0.6%) |
| $22,500 to $24,999 | 4 (0.5%) | 38 (4.3%) |
| $25,000 to $29,999 | 83 (10.9%) | 93 (10.5%) |
| $30,000 to $34,999 | 32 (4.2%) | 92 (10.4%) |
| $35,000 to $39,999 | 51 (6.7%) | 17 (1.9%) |
| $40,000 to $44,999 | 51 (6.7%) | 56 (6.3%) |
| $45,000 to $49,999 | 41 (5.4%) | 98 (11.1%) |
| $50,000 to $54,999 | 26 (3.4%) | 37 (4.2%) |
| $55,000 to $64,999 | 37 (4.9%) | 92 (10.4%) |
| $65,000 to $74,999 | 72 (9.5%) | 53 (6.0%) |
| $75,000 to $99,999 | 94 (12.4%) | 58 (6.6%) |
| $100,000+ | 92 (12.1%) | 36 (4.1%) |
| Total | 760 (100.0%) | 883 (100.0%) |
Earnings by Sex by Educational Attainment in Vergennes
Average earnings in Vergennes are $50,167 for men and $42,036 for women, a difference of 16.2%. Men with an educational attainment of graduate degree enjoy the highest average annual earnings of $80,250, while those with bachelor's degree education earn the least with $46,477. Women with an educational attainment of graduate degree earn the most with the average annual earnings of $70,268, while those with high school diploma education have the smallest earnings of $28,125.
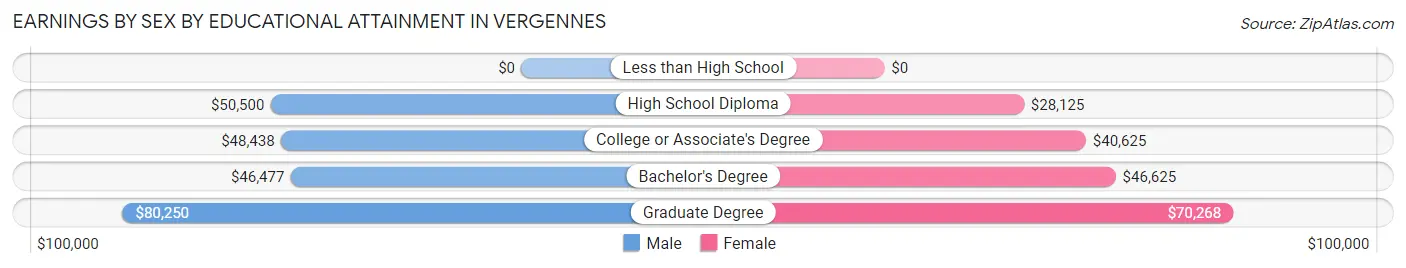
| Educational Attainment | Male Income | Female Income |
| Less than High School | - | - |
| High School Diploma | $50,500 | $28,125 |
| College or Associate's Degree | $48,438 | $40,625 |
| Bachelor's Degree | $46,477 | $46,625 |
| Graduate Degree | $80,250 | $70,268 |
| Total | $50,167 | $42,036 |
Family Income in Vergennes
Family Income Brackets in Vergennes
According to the Vergennes family income data, there are 161 families falling into the $75,000 to $99,999 income range, which is the most common income bracket and makes up 24.8% of all families. Conversely, the $15,000 to $24,999 income bracket is the least frequent group with only 5 families (0.8%) belonging to this category.
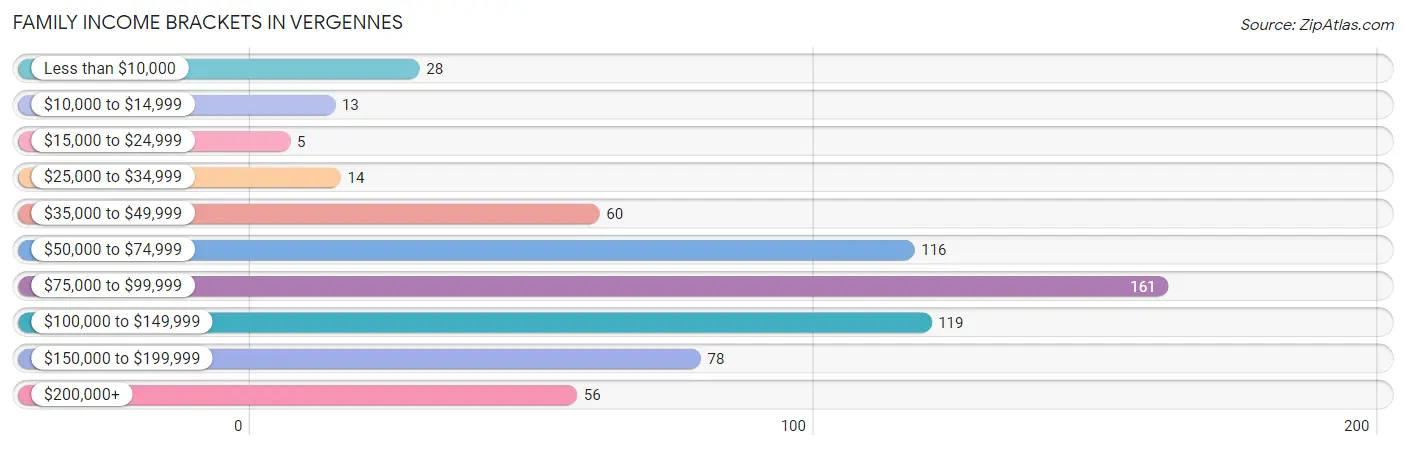
| Income Bracket | # Families | % Families |
| Less than $10,000 | 28 | 4.3% |
| $10,000 to $14,999 | 13 | 2.0% |
| $15,000 to $24,999 | 5 | 0.8% |
| $25,000 to $34,999 | 14 | 2.2% |
| $35,000 to $49,999 | 60 | 9.2% |
| $50,000 to $74,999 | 116 | 17.8% |
| $75,000 to $99,999 | 161 | 24.8% |
| $100,000 to $149,999 | 119 | 18.3% |
| $150,000 to $199,999 | 78 | 12.0% |
| $200,000+ | 56 | 8.6% |
Family Income by Famaliy Size in Vergennes
4-person families (88 | 13.5%) account for the highest median family income in Vergennes with $104,167 per family, while 2-person families (369 | 56.8%) have the highest median income of $45,048 per family member.
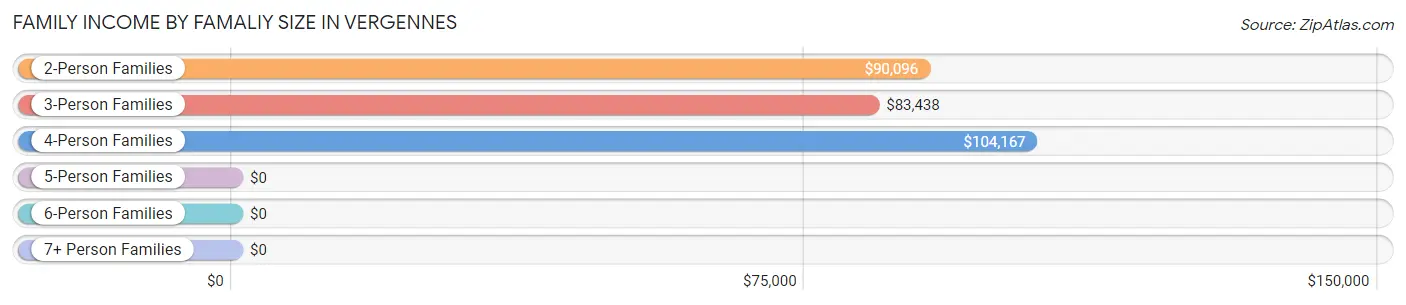
| Income Bracket | # Families | Median Income |
| 2-Person Families | 369 (56.8%) | $90,096 |
| 3-Person Families | 171 (26.3%) | $83,438 |
| 4-Person Families | 88 (13.5%) | $104,167 |
| 5-Person Families | 10 (1.5%) | $0 |
| 6-Person Families | 6 (0.9%) | $0 |
| 7+ Person Families | 6 (0.9%) | $0 |
| Total | 650 (100.0%) | $91,154 |
Family Income by Number of Earners in Vergennes
The median family income in Vergennes is $91,154, with families comprising 3+ earners (69) having the highest median family income of $160,625, while families with no earners (76) have the lowest median family income of $48,125, accounting for 10.6% and 11.7% of families, respectively.
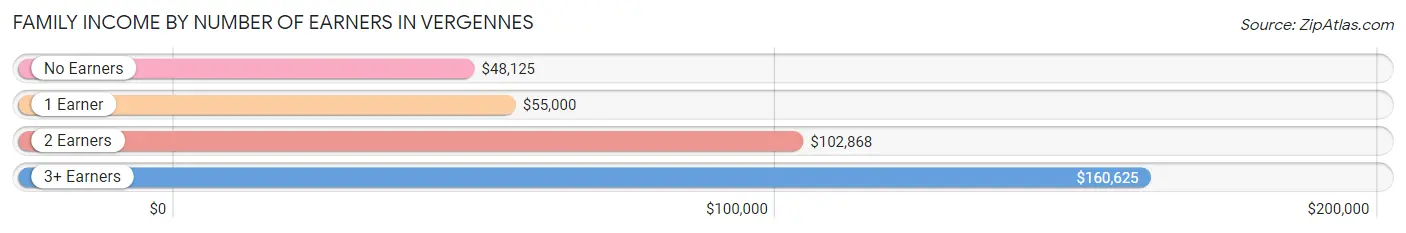
| Number of Earners | # Families | Median Income |
| No Earners | 76 (11.7%) | $48,125 |
| 1 Earner | 146 (22.5%) | $55,000 |
| 2 Earners | 359 (55.2%) | $102,868 |
| 3+ Earners | 69 (10.6%) | $160,625 |
| Total | 650 (100.0%) | $91,154 |
Household Income in Vergennes
Household Income Brackets in Vergennes
With 188 households falling in the category, the $100,000 to $149,999 income range is the most frequent in Vergennes, accounting for 18.0% of all households. In contrast, only 41 households (3.9%) fall into the less than $10,000 income bracket, making it the least populous group.
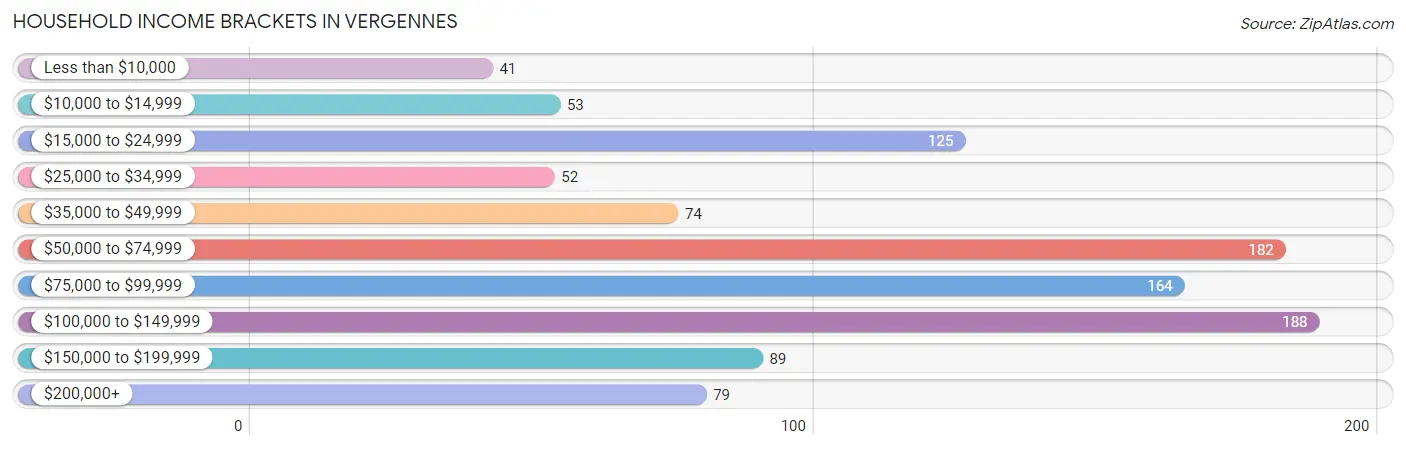
| Income Bracket | # Households | % Households |
| Less than $10,000 | 41 | 3.9% |
| $10,000 to $14,999 | 53 | 5.1% |
| $15,000 to $24,999 | 125 | 11.9% |
| $25,000 to $34,999 | 52 | 5.0% |
| $35,000 to $49,999 | 74 | 7.1% |
| $50,000 to $74,999 | 182 | 17.4% |
| $75,000 to $99,999 | 164 | 15.7% |
| $100,000 to $149,999 | 188 | 18.0% |
| $150,000 to $199,999 | 89 | 8.5% |
| $200,000+ | 79 | 7.5% |
Household Income by Householder Age in Vergennes
The median household income in Vergennes is $72,171, with the highest median household income of $98,021 found in the 45 to 64 years age bracket for the primary householder. A total of 438 households (41.8%) fall into this category. Meanwhile, the 65+ years age bracket for the primary householder has the lowest median household income of $25,375, with 285 households (27.2%) in this group.
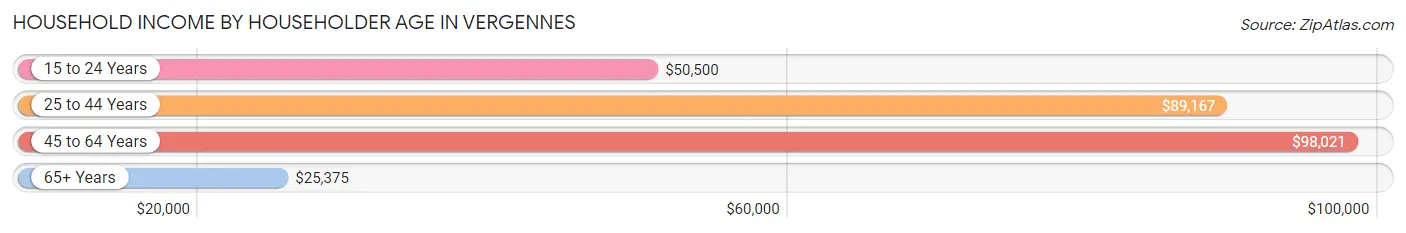
| Income Bracket | # Households | Median Income |
| 15 to 24 Years | 50 (4.8%) | $50,500 |
| 25 to 44 Years | 274 (26.2%) | $89,167 |
| 45 to 64 Years | 438 (41.8%) | $98,021 |
| 65+ Years | 285 (27.2%) | $25,375 |
| Total | 1,047 (100.0%) | $72,171 |
Poverty in Vergennes
Income Below Poverty by Sex and Age in Vergennes
With 9.3% poverty level for males and 12.2% for females among the residents of Vergennes, 5 year old males and 5 year old females are the most vulnerable to poverty, with 6 males (50.0%) and 6 females (50.0%) in their respective age groups living below the poverty level.
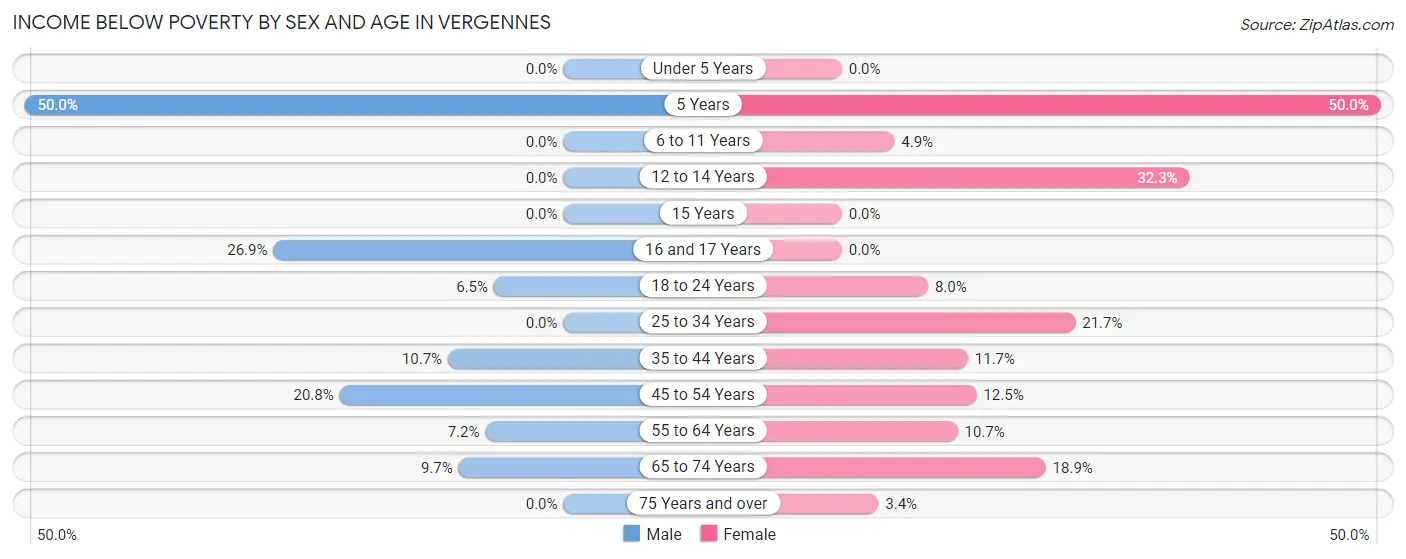
| Age Bracket | Male | Female |
| Under 5 Years | 0 (0.0%) | 0 (0.0%) |
| 5 Years | 6 (50.0%) | 6 (50.0%) |
| 6 to 11 Years | 0 (0.0%) | 4 (4.9%) |
| 12 to 14 Years | 0 (0.0%) | 10 (32.3%) |
| 15 Years | 0 (0.0%) | 0 (0.0%) |
| 16 and 17 Years | 7 (26.9%) | 0 (0.0%) |
| 18 to 24 Years | 8 (6.5%) | 10 (8.0%) |
| 25 to 34 Years | 0 (0.0%) | 44 (21.7%) |
| 35 to 44 Years | 12 (10.7%) | 20 (11.7%) |
| 45 to 54 Years | 43 (20.8%) | 25 (12.5%) |
| 55 to 64 Years | 16 (7.2%) | 26 (10.7%) |
| 65 to 74 Years | 14 (9.7%) | 21 (18.9%) |
| 75 Years and over | 0 (0.0%) | 4 (3.4%) |
| Total | 106 (9.3%) | 170 (12.2%) |
Income Above Poverty by Sex and Age in Vergennes
According to the poverty statistics in Vergennes, males aged under 5 years and females aged under 5 years are the age groups that are most secure financially, with 100.0% of males and 100.0% of females in these age groups living above the poverty line.
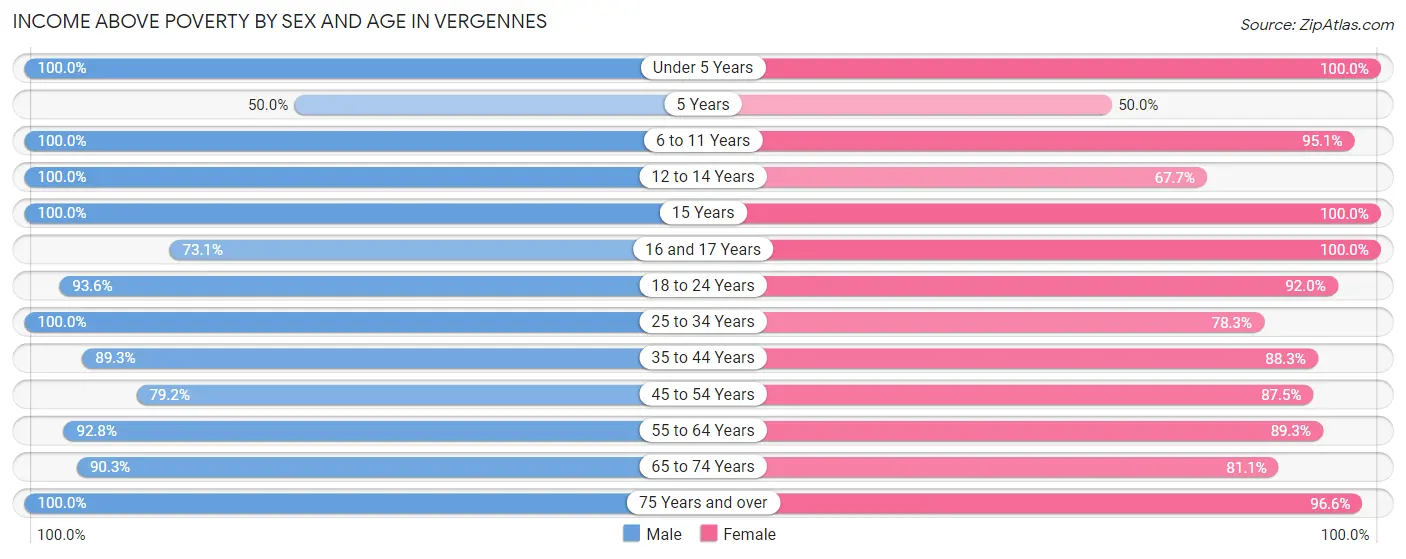
| Age Bracket | Male | Female |
| Under 5 Years | 43 (100.0%) | 32 (100.0%) |
| 5 Years | 6 (50.0%) | 6 (50.0%) |
| 6 to 11 Years | 69 (100.0%) | 78 (95.1%) |
| 12 to 14 Years | 5 (100.0%) | 21 (67.7%) |
| 15 Years | 29 (100.0%) | 25 (100.0%) |
| 16 and 17 Years | 19 (73.1%) | 44 (100.0%) |
| 18 to 24 Years | 116 (93.5%) | 115 (92.0%) |
| 25 to 34 Years | 123 (100.0%) | 159 (78.3%) |
| 35 to 44 Years | 100 (89.3%) | 151 (88.3%) |
| 45 to 54 Years | 164 (79.2%) | 175 (87.5%) |
| 55 to 64 Years | 205 (92.8%) | 216 (89.3%) |
| 65 to 74 Years | 130 (90.3%) | 90 (81.1%) |
| 75 Years and over | 24 (100.0%) | 114 (96.6%) |
| Total | 1,033 (90.7%) | 1,226 (87.8%) |
Income Below Poverty Among Married-Couple Families in Vergennes
The poverty statistics for married-couple families in Vergennes show that 5.4% or 25 of the total 463 families live below the poverty line. Families with 1 or 2 children have the highest poverty rate of 7.7%, comprising of 13 families. On the other hand, families with 3 or 4 children have the lowest poverty rate of 0.0%, which includes 0 families.
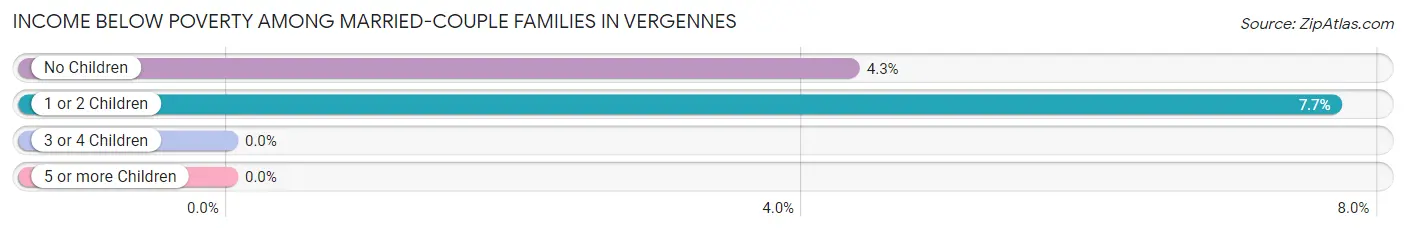
| Children | Above Poverty | Below Poverty |
| No Children | 265 (95.7%) | 12 (4.3%) |
| 1 or 2 Children | 156 (92.3%) | 13 (7.7%) |
| 3 or 4 Children | 17 (100.0%) | 0 (0.0%) |
| 5 or more Children | 0 (0.0%) | 0 (0.0%) |
| Total | 438 (94.6%) | 25 (5.4%) |
Income Below Poverty Among Single-Parent Households in Vergennes
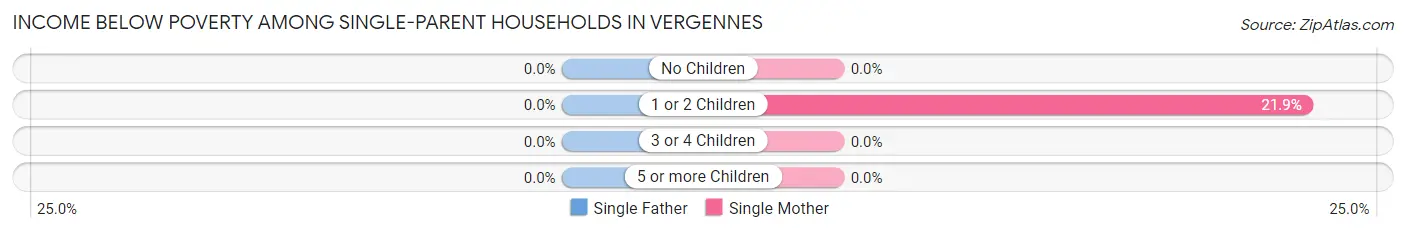
| Children | Single Father | Single Mother |
| No Children | 0 (0.0%) | 0 (0.0%) |
| 1 or 2 Children | 0 (0.0%) | 21 (21.9%) |
| 3 or 4 Children | 0 (0.0%) | 0 (0.0%) |
| 5 or more Children | 0 (0.0%) | 0 (0.0%) |
| Total | 0 (0.0%) | 21 (14.0%) |
Income Below Poverty Among Married-Couple vs Single-Parent Households in Vergennes
The poverty data for Vergennes shows that 25 of the married-couple family households (5.4%) and 21 of the single-parent households (11.2%) are living below the poverty level. Within the married-couple family households, those with 1 or 2 children have the highest poverty rate, with 13 households (7.7%) falling below the poverty line. Among the single-parent households, those with 1 or 2 children have the highest poverty rate, with 21 household (17.9%) living below poverty.
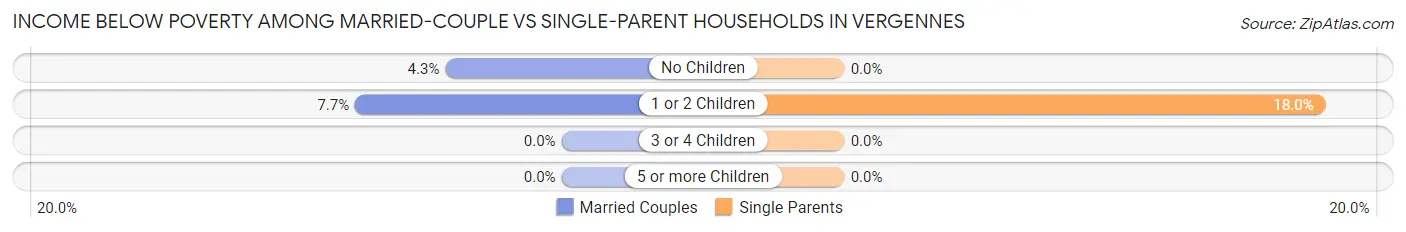
| Children | Married-Couple Families | Single-Parent Households |
| No Children | 12 (4.3%) | 0 (0.0%) |
| 1 or 2 Children | 13 (7.7%) | 21 (17.9%) |
| 3 or 4 Children | 0 (0.0%) | 0 (0.0%) |
| 5 or more Children | 0 (0.0%) | 0 (0.0%) |
| Total | 25 (5.4%) | 21 (11.2%) |
Employment Characteristics in Vergennes
Employment by Class of Employer in Vergennes
Among the 1,529 employed individuals in Vergennes, private company employees (943 | 61.7%), not-for-profit organizations (295 | 19.3%), and local government employees (111 | 7.3%) make up the most common classes of employment.
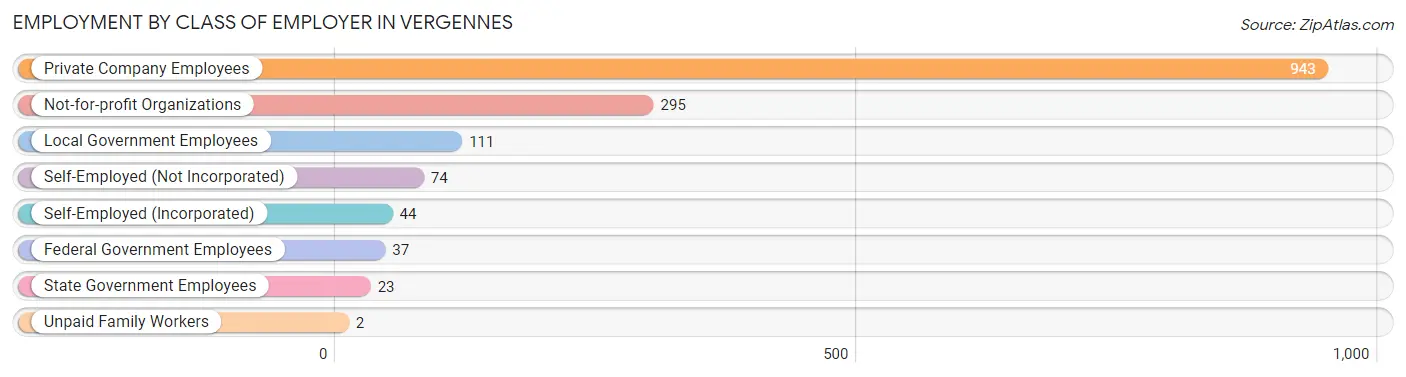
| Employer Class | # Employees | % Employees |
| Private Company Employees | 943 | 61.7% |
| Self-Employed (Incorporated) | 44 | 2.9% |
| Self-Employed (Not Incorporated) | 74 | 4.8% |
| Not-for-profit Organizations | 295 | 19.3% |
| Local Government Employees | 111 | 7.3% |
| State Government Employees | 23 | 1.5% |
| Federal Government Employees | 37 | 2.4% |
| Unpaid Family Workers | 2 | 0.1% |
| Total | 1,529 | 100.0% |
Employment Status by Age in Vergennes
According to the labor force statistics for Vergennes, out of the total population over 16 years of age (2,215), 71.1% or 1,575 individuals are in the labor force, with 2.0% or 32 of them unemployed. The age group with the highest labor force participation rate is 25 to 29 years, with 100.0% or 89 individuals in the labor force. Within the labor force, the 65 to 74 years age range has the highest percentage of unemployed individuals, with 15.0% or 12 of them being unemployed.
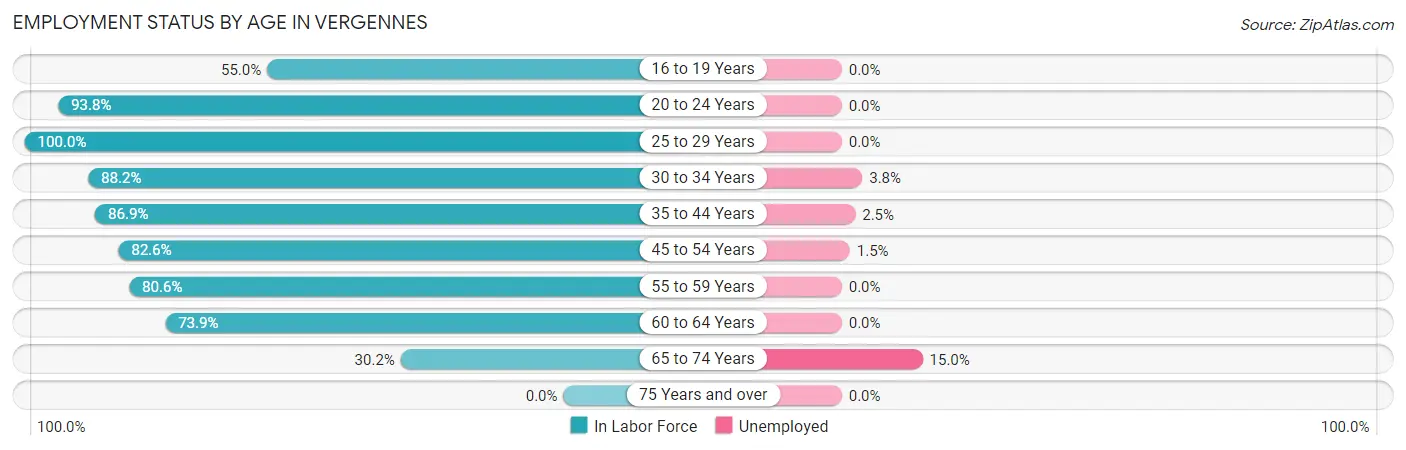
| Age Bracket | In Labor Force | Unemployed |
| 16 to 19 Years | 60 (55.0%) | 0 (0.0%) |
| 20 to 24 Years | 197 (93.8%) | 0 (0.0%) |
| 25 to 29 Years | 89 (100.0%) | 0 (0.0%) |
| 30 to 34 Years | 209 (88.2%) | 8 (3.8%) |
| 35 to 44 Years | 246 (86.9%) | 6 (2.5%) |
| 45 to 54 Years | 336 (82.6%) | 5 (1.5%) |
| 55 to 59 Years | 179 (80.6%) | 0 (0.0%) |
| 60 to 64 Years | 178 (73.9%) | 0 (0.0%) |
| 65 to 74 Years | 80 (30.2%) | 12 (15.0%) |
| 75 Years and over | 0 (0.0%) | 0 (0.0%) |
| Total | 1,575 (71.1%) | 32 (2.0%) |
Employment Status by Educational Attainment in Vergennes
According to labor force statistics for Vergennes, 83.6% of individuals (1,236) out of the total population between 25 and 64 years of age (1,479) are in the labor force, with 1.5% or 19 of them being unemployed. The group with the highest labor force participation rate are those with the educational attainment of bachelor's degree or higher, with 94.1% or 496 individuals in the labor force. Within the labor force, individuals with college / associate degree education have the highest percentage of unemployment, with 3.0% or 11 of them being unemployed.
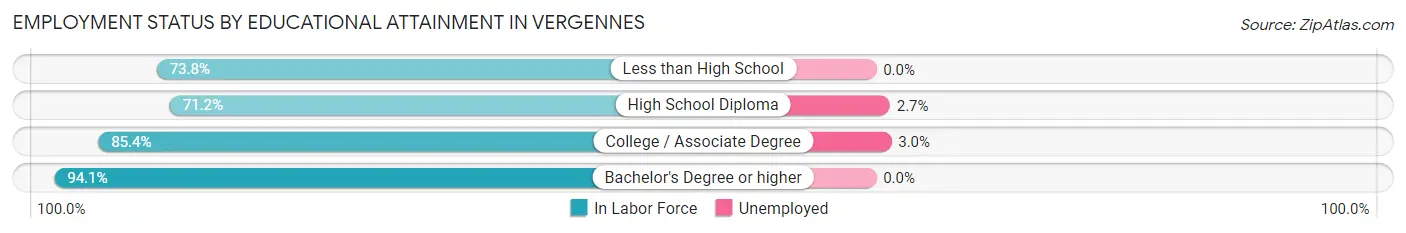
| Educational Attainment | In Labor Force | Unemployed |
| Less than High School | 76 (73.8%) | 0 (0.0%) |
| High School Diploma | 301 (71.2%) | 11 (2.7%) |
| College / Associate Degree | 364 (85.4%) | 13 (3.0%) |
| Bachelor's Degree or higher | 496 (94.1%) | 0 (0.0%) |
| Total | 1,236 (83.6%) | 22 (1.5%) |
Employment Occupations by Sex in Vergennes
Management, Business, Science and Arts Occupations
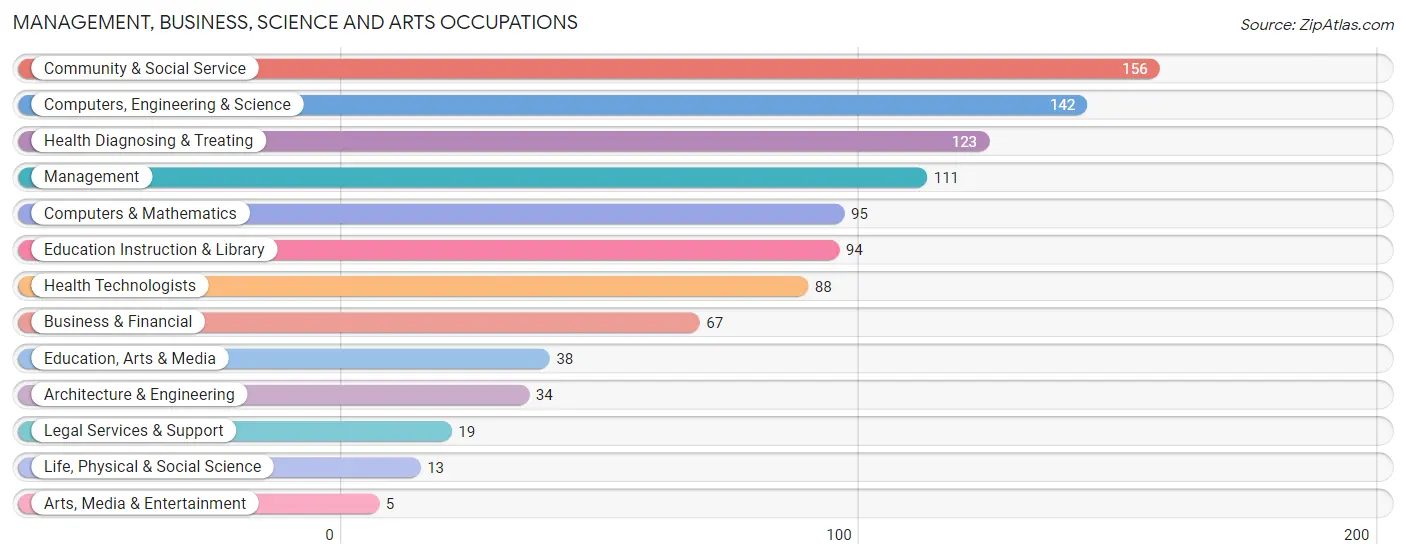
The most common Management, Business, Science and Arts occupations in Vergennes are Community & Social Service (156 | 10.2%), Computers, Engineering & Science (142 | 9.3%), Health Diagnosing & Treating (123 | 8.0%), Management (111 | 7.2%), and Computers & Mathematics (95 | 6.2%).
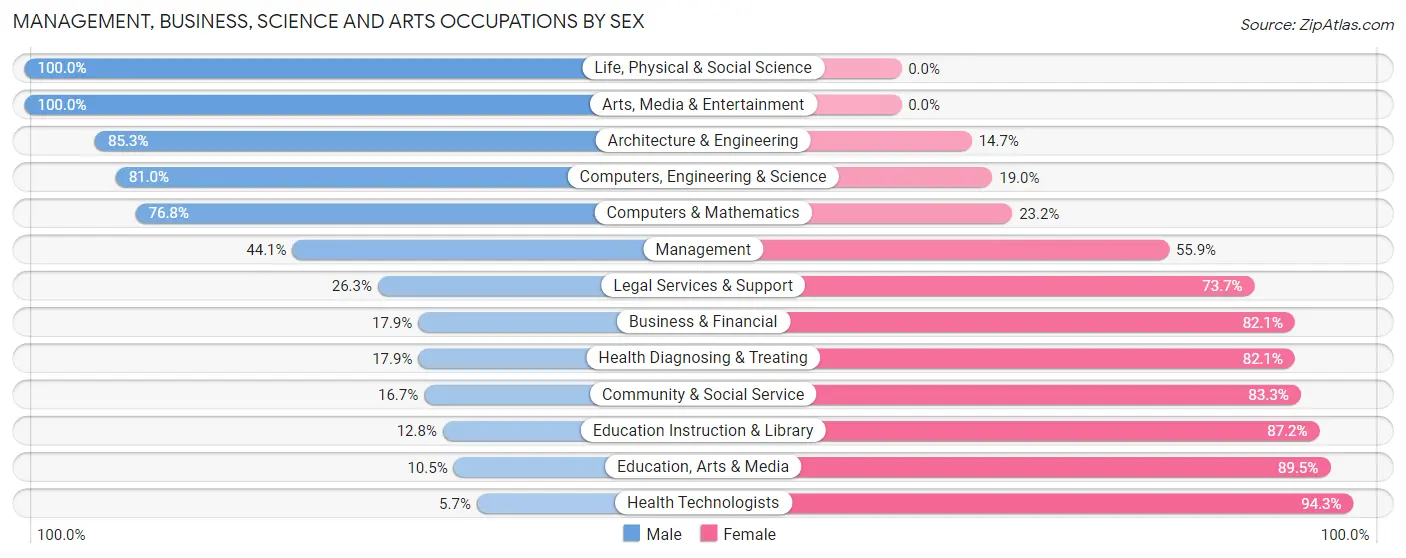
Management, Business, Science and Arts Occupations by Sex
Within the Management, Business, Science and Arts occupations in Vergennes, the most male-oriented occupations are Life, Physical & Social Science (100.0%), Arts, Media & Entertainment (100.0%), and Architecture & Engineering (85.3%), while the most female-oriented occupations are Health Technologists (94.3%), Education, Arts & Media (89.5%), and Education Instruction & Library (87.2%).
| Occupation | Male | Female |
| Management | 49 (44.1%) | 62 (55.9%) |
| Business & Financial | 12 (17.9%) | 55 (82.1%) |
| Computers, Engineering & Science | 115 (81.0%) | 27 (19.0%) |
| Computers & Mathematics | 73 (76.8%) | 22 (23.2%) |
| Architecture & Engineering | 29 (85.3%) | 5 (14.7%) |
| Life, Physical & Social Science | 13 (100.0%) | 0 (0.0%) |
| Community & Social Service | 26 (16.7%) | 130 (83.3%) |
| Education, Arts & Media | 4 (10.5%) | 34 (89.5%) |
| Legal Services & Support | 5 (26.3%) | 14 (73.7%) |
| Education Instruction & Library | 12 (12.8%) | 82 (87.2%) |
| Arts, Media & Entertainment | 5 (100.0%) | 0 (0.0%) |
| Health Diagnosing & Treating | 22 (17.9%) | 101 (82.1%) |
| Health Technologists | 5 (5.7%) | 83 (94.3%) |
| Total (Category) | 224 (37.4%) | 375 (62.6%) |
| Total (Overall) | 687 (44.8%) | 845 (55.2%) |
Services Occupations
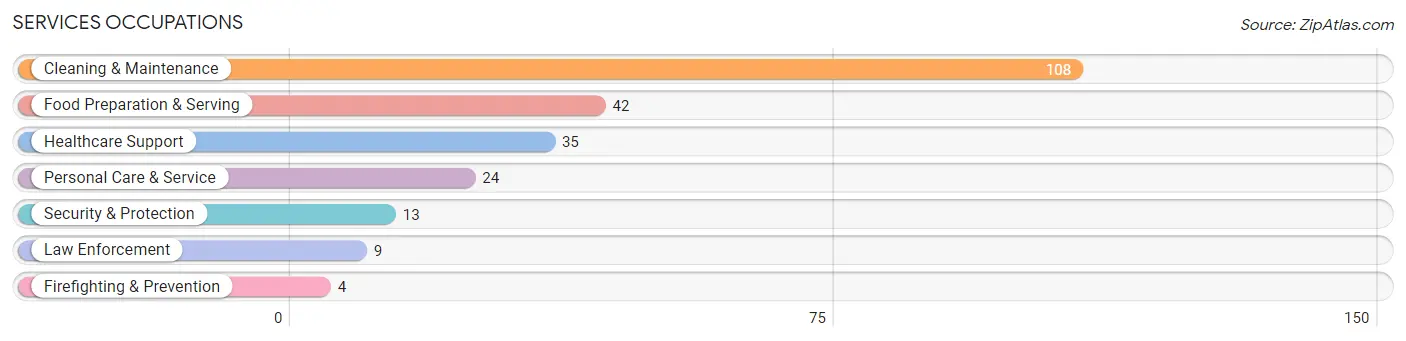
The most common Services occupations in Vergennes are Cleaning & Maintenance (108 | 7.0%), Food Preparation & Serving (42 | 2.7%), Healthcare Support (35 | 2.3%), Personal Care & Service (24 | 1.6%), and Security & Protection (13 | 0.9%).
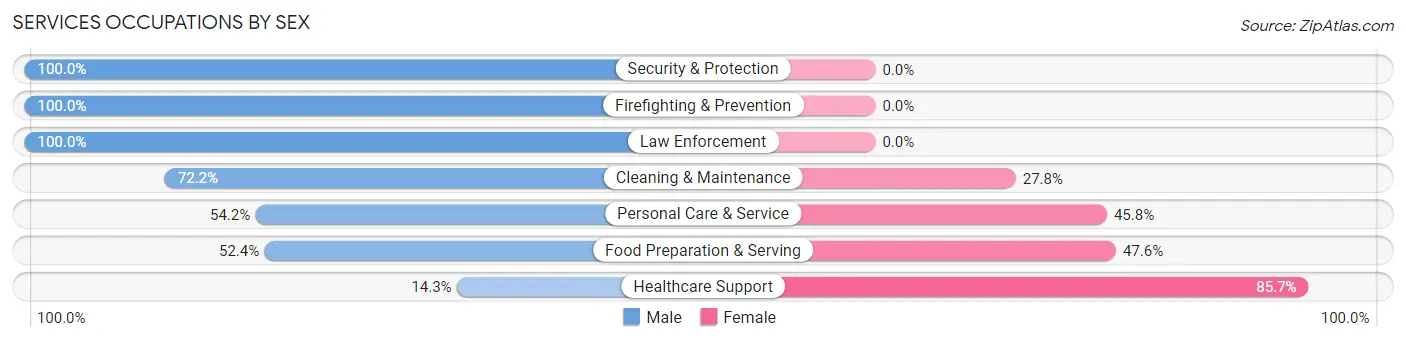
Services Occupations by Sex
Within the Services occupations in Vergennes, the most male-oriented occupations are Security & Protection (100.0%), Firefighting & Prevention (100.0%), and Law Enforcement (100.0%), while the most female-oriented occupations are Healthcare Support (85.7%), Food Preparation & Serving (47.6%), and Personal Care & Service (45.8%).
| Occupation | Male | Female |
| Healthcare Support | 5 (14.3%) | 30 (85.7%) |
| Security & Protection | 13 (100.0%) | 0 (0.0%) |
| Firefighting & Prevention | 4 (100.0%) | 0 (0.0%) |
| Law Enforcement | 9 (100.0%) | 0 (0.0%) |
| Food Preparation & Serving | 22 (52.4%) | 20 (47.6%) |
| Cleaning & Maintenance | 78 (72.2%) | 30 (27.8%) |
| Personal Care & Service | 13 (54.2%) | 11 (45.8%) |
| Total (Category) | 131 (59.0%) | 91 (41.0%) |
| Total (Overall) | 687 (44.8%) | 845 (55.2%) |
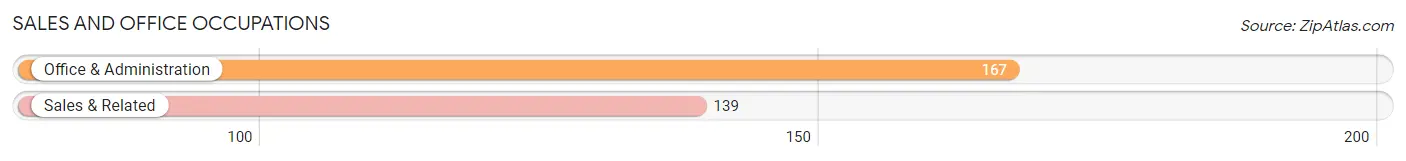
Sales and Office Occupations
The most common Sales and Office occupations in Vergennes are Office & Administration (167 | 10.9%), and Sales & Related (139 | 9.1%).
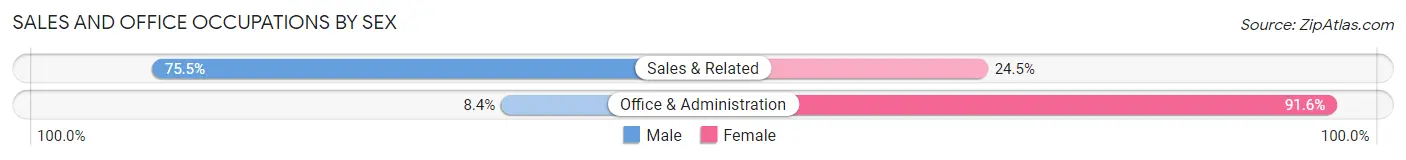
Sales and Office Occupations by Sex
| Occupation | Male | Female |
| Sales & Related | 105 (75.5%) | 34 (24.5%) |
| Office & Administration | 14 (8.4%) | 153 (91.6%) |
| Total (Category) | 119 (38.9%) | 187 (61.1%) |
| Total (Overall) | 687 (44.8%) | 845 (55.2%) |
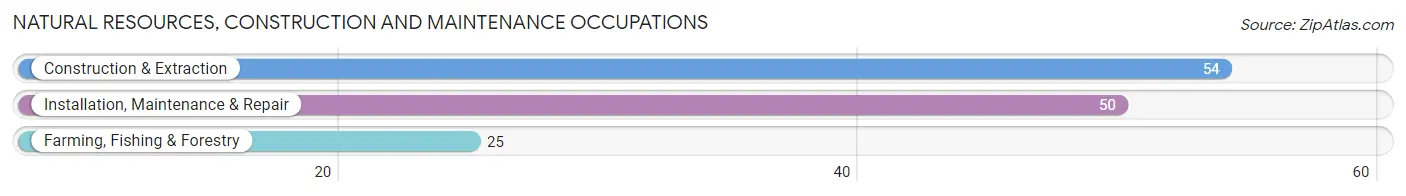
Natural Resources, Construction and Maintenance Occupations
The most common Natural Resources, Construction and Maintenance occupations in Vergennes are Construction & Extraction (54 | 3.5%), Installation, Maintenance & Repair (50 | 3.3%), and Farming, Fishing & Forestry (25 | 1.6%).
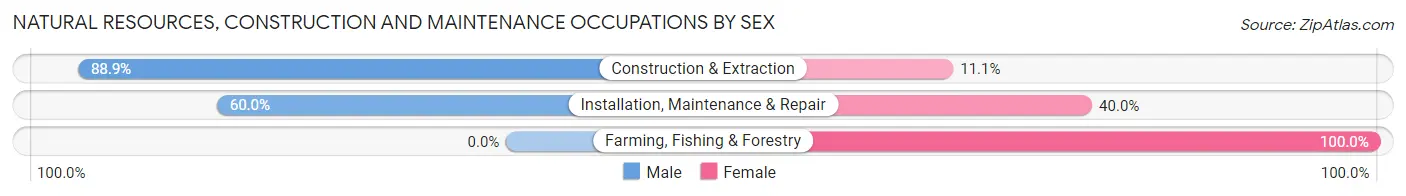
Natural Resources, Construction and Maintenance Occupations by Sex
| Occupation | Male | Female |
| Farming, Fishing & Forestry | 0 (0.0%) | 25 (100.0%) |
| Construction & Extraction | 48 (88.9%) | 6 (11.1%) |
| Installation, Maintenance & Repair | 30 (60.0%) | 20 (40.0%) |
| Total (Category) | 78 (60.5%) | 51 (39.5%) |
| Total (Overall) | 687 (44.8%) | 845 (55.2%) |
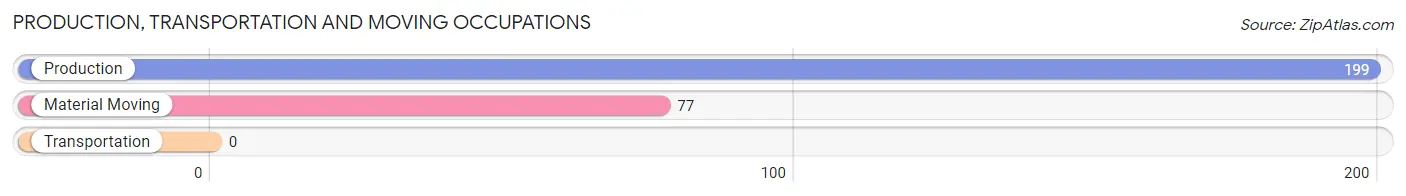
Production, Transportation and Moving Occupations
The most common Production, Transportation and Moving occupations in Vergennes are Production (199 | 13.0%), and Material Moving (77 | 5.0%).
Production, Transportation and Moving Occupations by Sex
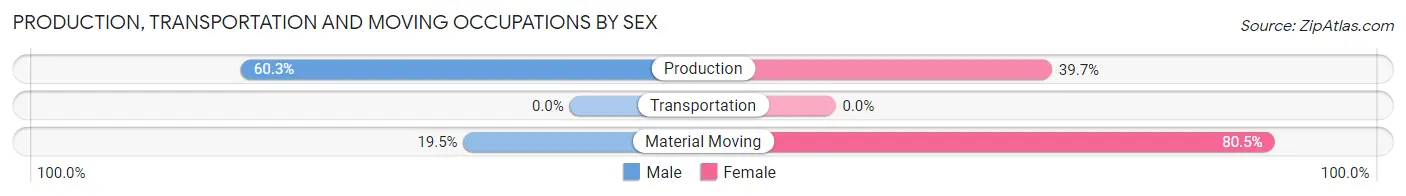
| Occupation | Male | Female |
| Production | 120 (60.3%) | 79 (39.7%) |
| Transportation | 0 (0.0%) | 0 (0.0%) |
| Material Moving | 15 (19.5%) | 62 (80.5%) |
| Total (Category) | 135 (48.9%) | 141 (51.1%) |
| Total (Overall) | 687 (44.8%) | 845 (55.2%) |
Employment Industries by Sex in Vergennes
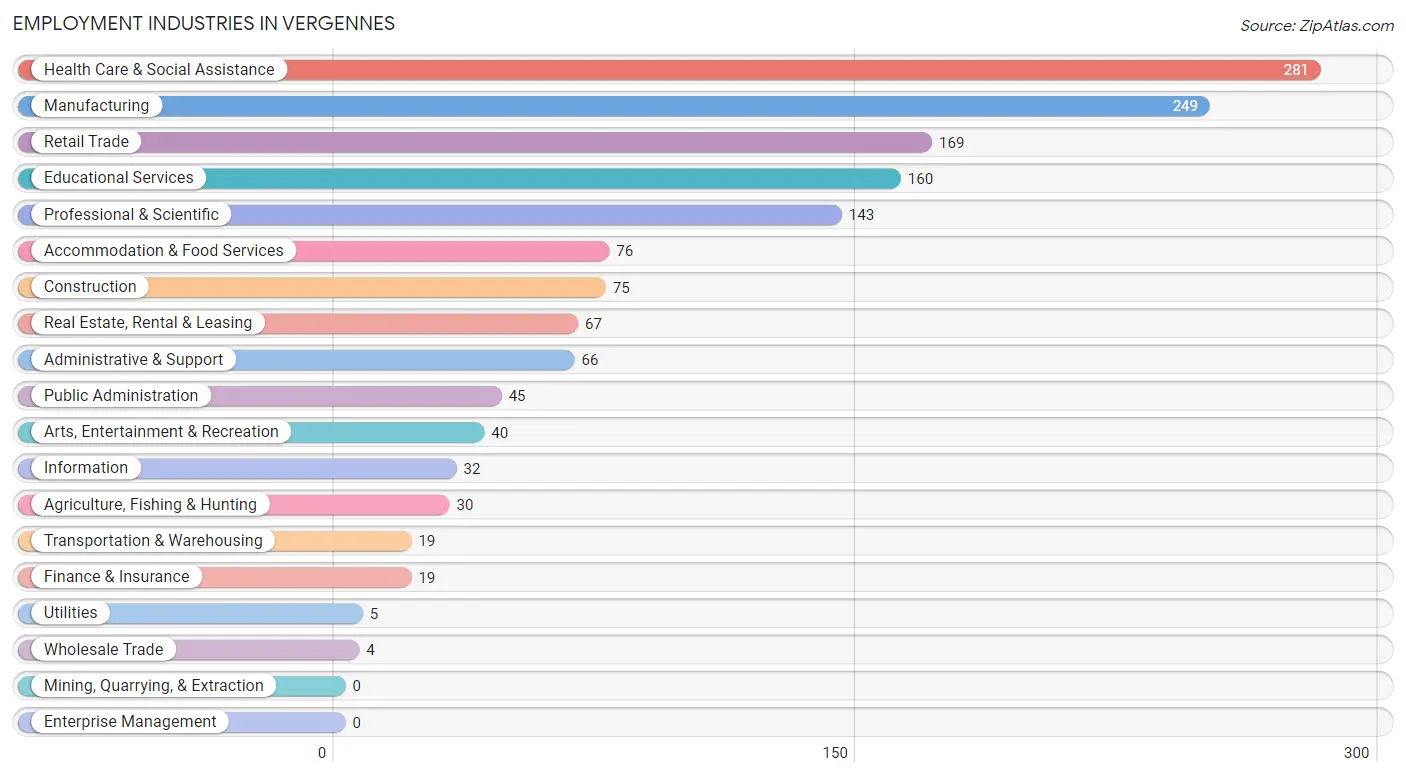
Employment Industries in Vergennes
The major employment industries in Vergennes include Health Care & Social Assistance (281 | 18.3%), Manufacturing (249 | 16.3%), Retail Trade (169 | 11.0%), Educational Services (160 | 10.4%), and Professional & Scientific (143 | 9.3%).
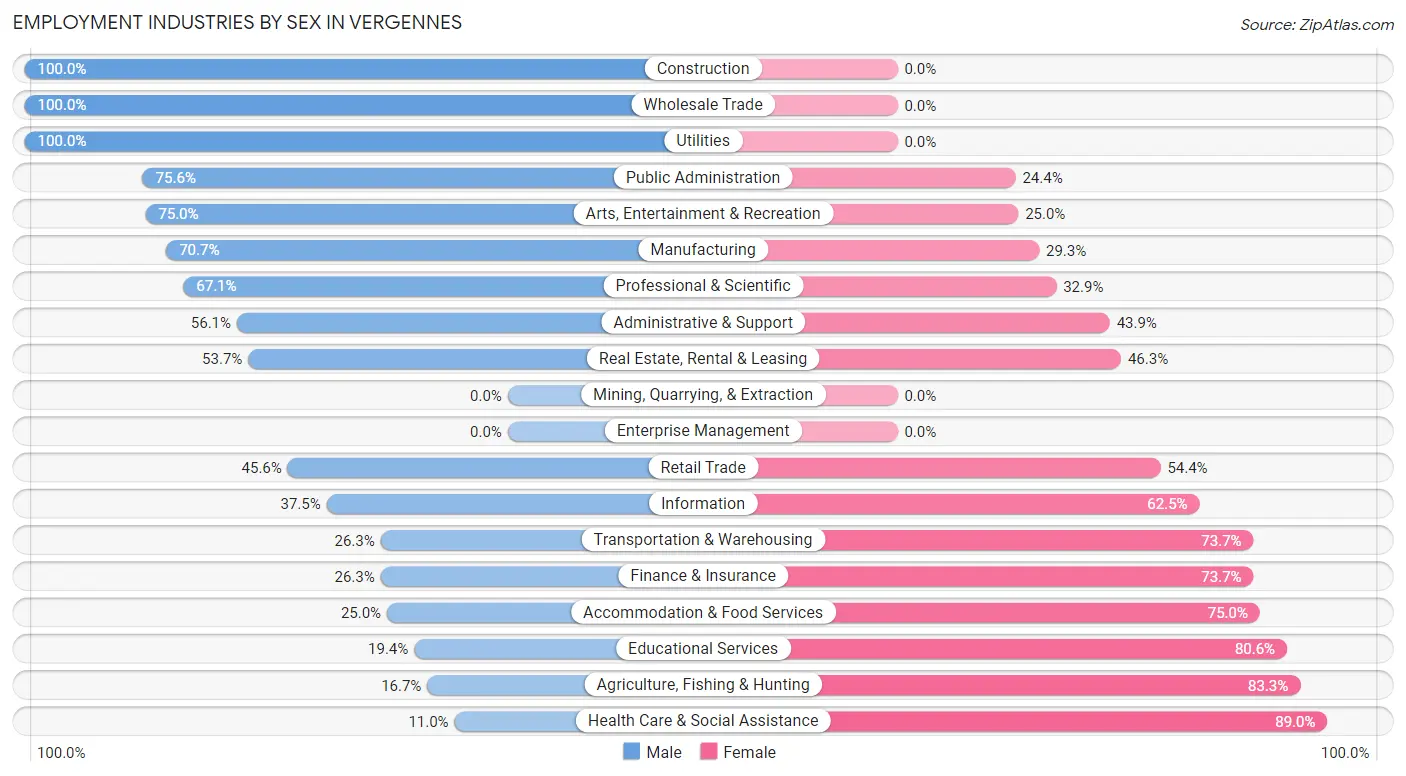
Employment Industries by Sex in Vergennes
The Vergennes industries that see more men than women are Construction (100.0%), Wholesale Trade (100.0%), and Utilities (100.0%), whereas the industries that tend to have a higher number of women are Health Care & Social Assistance (89.0%), Agriculture, Fishing & Hunting (83.3%), and Educational Services (80.6%).
| Industry | Male | Female |
| Agriculture, Fishing & Hunting | 5 (16.7%) | 25 (83.3%) |
| Mining, Quarrying, & Extraction | 0 (0.0%) | 0 (0.0%) |
| Construction | 75 (100.0%) | 0 (0.0%) |
| Manufacturing | 176 (70.7%) | 73 (29.3%) |
| Wholesale Trade | 4 (100.0%) | 0 (0.0%) |
| Retail Trade | 77 (45.6%) | 92 (54.4%) |
| Transportation & Warehousing | 5 (26.3%) | 14 (73.7%) |
| Utilities | 5 (100.0%) | 0 (0.0%) |
| Information | 12 (37.5%) | 20 (62.5%) |
| Finance & Insurance | 5 (26.3%) | 14 (73.7%) |
| Real Estate, Rental & Leasing | 36 (53.7%) | 31 (46.3%) |
| Professional & Scientific | 96 (67.1%) | 47 (32.9%) |
| Enterprise Management | 0 (0.0%) | 0 (0.0%) |
| Administrative & Support | 37 (56.1%) | 29 (43.9%) |
| Educational Services | 31 (19.4%) | 129 (80.6%) |
| Health Care & Social Assistance | 31 (11.0%) | 250 (89.0%) |
| Arts, Entertainment & Recreation | 30 (75.0%) | 10 (25.0%) |
| Accommodation & Food Services | 19 (25.0%) | 57 (75.0%) |
| Public Administration | 34 (75.6%) | 11 (24.4%) |
| Total | 687 (44.8%) | 845 (55.2%) |
Education in Vergennes
School Enrollment in Vergennes
The most common levels of schooling among the 488 students in Vergennes are college / undergraduate (114 | 23.4%), high school (110 | 22.5%), and elementary school (88 | 18.0%).
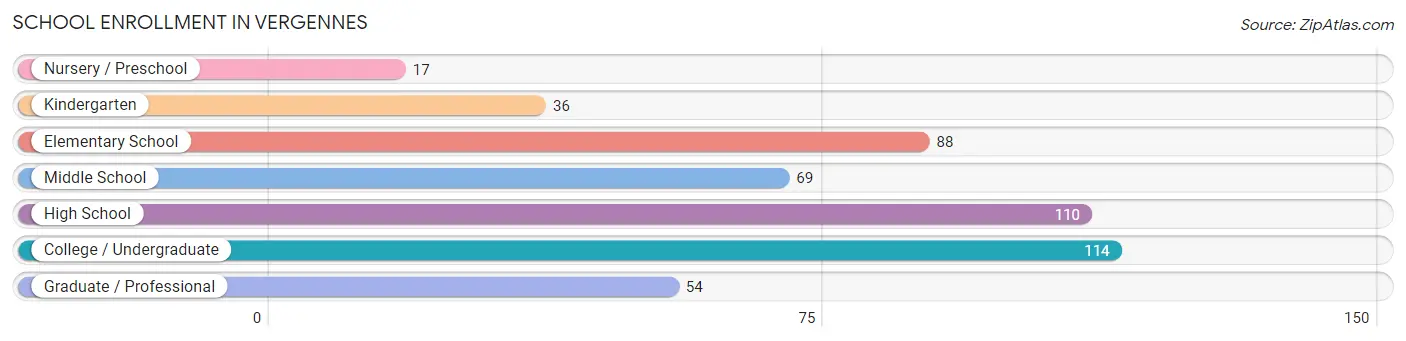
| School Level | # Students | % Students |
| Nursery / Preschool | 17 | 3.5% |
| Kindergarten | 36 | 7.4% |
| Elementary School | 88 | 18.0% |
| Middle School | 69 | 14.1% |
| High School | 110 | 22.5% |
| College / Undergraduate | 114 | 23.4% |
| Graduate / Professional | 54 | 11.1% |
| Total | 488 | 100.0% |
School Enrollment by Age by Funding Source in Vergennes
Out of a total of 488 students who are enrolled in schools in Vergennes, 80 (16.4%) attend a private institution, while the remaining 408 (83.6%) are enrolled in public schools. The age group of 3 to 4 year olds has the highest likelihood of being enrolled in private schools, with 5 (100.0% in the age bracket) enrolled. Conversely, the age group of 20 to 24 year olds has the lowest likelihood of being enrolled in a private school, with 37 (100.0% in the age bracket) attending a public institution.
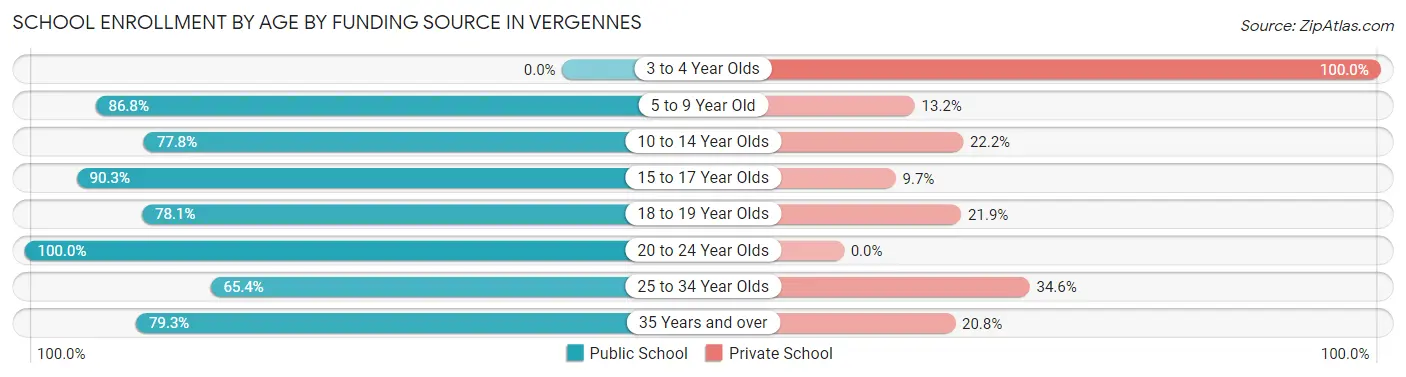
| Age Bracket | Public School | Private School |
| 3 to 4 Year Olds | 0 (0.0%) | 5 (100.0%) |
| 5 to 9 Year Old | 105 (86.8%) | 16 (13.2%) |
| 10 to 14 Year Olds | 70 (77.8%) | 20 (22.2%) |
| 15 to 17 Year Olds | 112 (90.3%) | 12 (9.7%) |
| 18 to 19 Year Olds | 25 (78.1%) | 7 (21.9%) |
| 20 to 24 Year Olds | 37 (100.0%) | 0 (0.0%) |
| 25 to 34 Year Olds | 17 (65.4%) | 9 (34.6%) |
| 35 Years and over | 42 (79.2%) | 11 (20.7%) |
| Total | 408 (83.6%) | 80 (16.4%) |
Educational Attainment by Field of Study in Vergennes
Visual & performing arts (114 | 17.1%), business (109 | 16.3%), social sciences (88 | 13.2%), bio, nature & agricultural (84 | 12.6%), and liberal arts & history (61 | 9.1%) are the most common fields of study among 667 individuals in Vergennes who have obtained a bachelor's degree or higher.
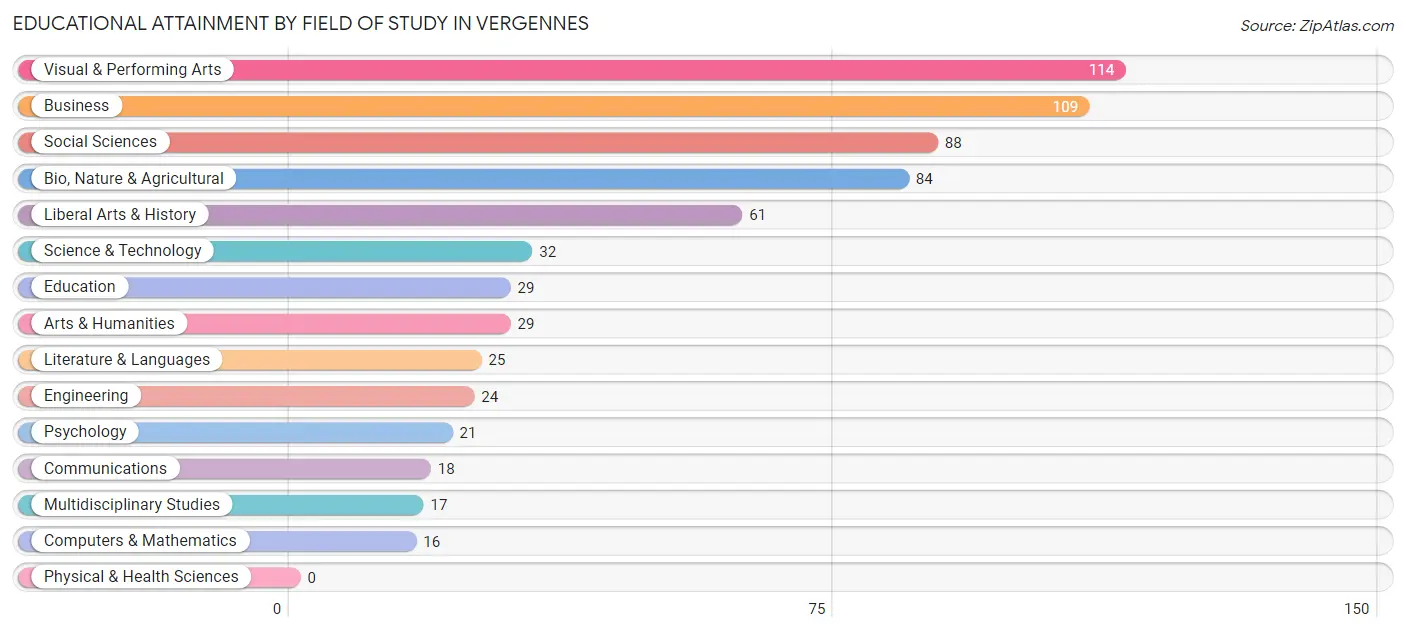
| Field of Study | # Graduates | % Graduates |
| Computers & Mathematics | 16 | 2.4% |
| Bio, Nature & Agricultural | 84 | 12.6% |
| Physical & Health Sciences | 0 | 0.0% |
| Psychology | 21 | 3.2% |
| Social Sciences | 88 | 13.2% |
| Engineering | 24 | 3.6% |
| Multidisciplinary Studies | 17 | 2.5% |
| Science & Technology | 32 | 4.8% |
| Business | 109 | 16.3% |
| Education | 29 | 4.3% |
| Literature & Languages | 25 | 3.7% |
| Liberal Arts & History | 61 | 9.1% |
| Visual & Performing Arts | 114 | 17.1% |
| Communications | 18 | 2.7% |
| Arts & Humanities | 29 | 4.3% |
| Total | 667 | 100.0% |
Transportation & Commute in Vergennes
Vehicle Availability by Sex in Vergennes
The most prevalent vehicle ownership categories in Vergennes are males with 2 vehicles (283, accounting for 40.5%) and females with 2 vehicles (296, making up 35.4%).
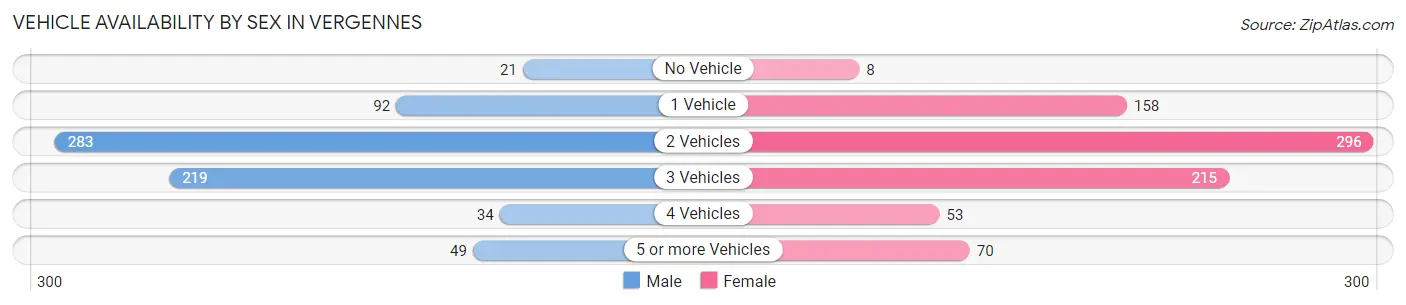
| Vehicles Available | Male | Female |
| No Vehicle | 21 (3.0%) | 8 (1.0%) |
| 1 Vehicle | 92 (13.2%) | 158 (19.8%) |
| 2 Vehicles | 283 (40.5%) | 296 (37.0%) |
| 3 Vehicles | 219 (31.4%) | 215 (26.9%) |
| 4 Vehicles | 34 (4.9%) | 53 (6.6%) |
| 5 or more Vehicles | 49 (7.0%) | 70 (8.7%) |
| Total | 698 (100.0%) | 800 (100.0%) |
Commute Time in Vergennes
The most frequently occuring commute durations in Vergennes are 5 to 9 minutes (230 commuters, 17.1%), 20 to 24 minutes (188 commuters, 14.0%), and 15 to 19 minutes (150 commuters, 11.2%).
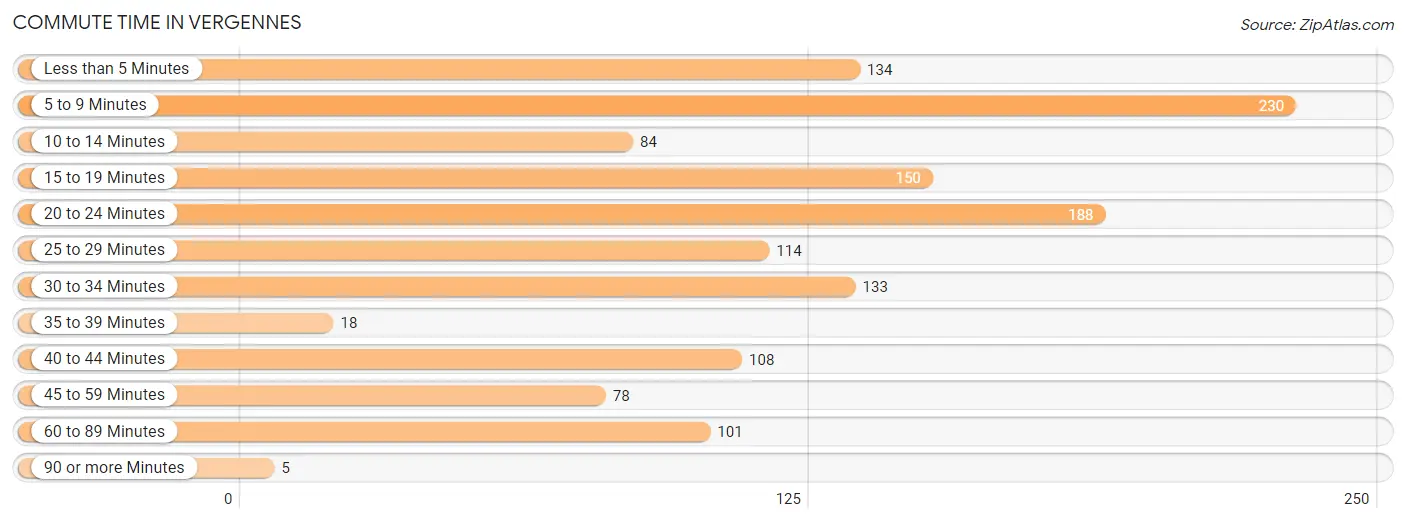
| Commute Time | # Commuters | % Commuters |
| Less than 5 Minutes | 134 | 10.0% |
| 5 to 9 Minutes | 230 | 17.1% |
| 10 to 14 Minutes | 84 | 6.2% |
| 15 to 19 Minutes | 150 | 11.2% |
| 20 to 24 Minutes | 188 | 14.0% |
| 25 to 29 Minutes | 114 | 8.5% |
| 30 to 34 Minutes | 133 | 9.9% |
| 35 to 39 Minutes | 18 | 1.3% |
| 40 to 44 Minutes | 108 | 8.0% |
| 45 to 59 Minutes | 78 | 5.8% |
| 60 to 89 Minutes | 101 | 7.5% |
| 90 or more Minutes | 5 | 0.4% |
Commute Time by Sex in Vergennes
The most common commute times in Vergennes are 5 to 9 minutes (82 commuters, 13.8%) for males and 5 to 9 minutes (148 commuters, 19.8%) for females.
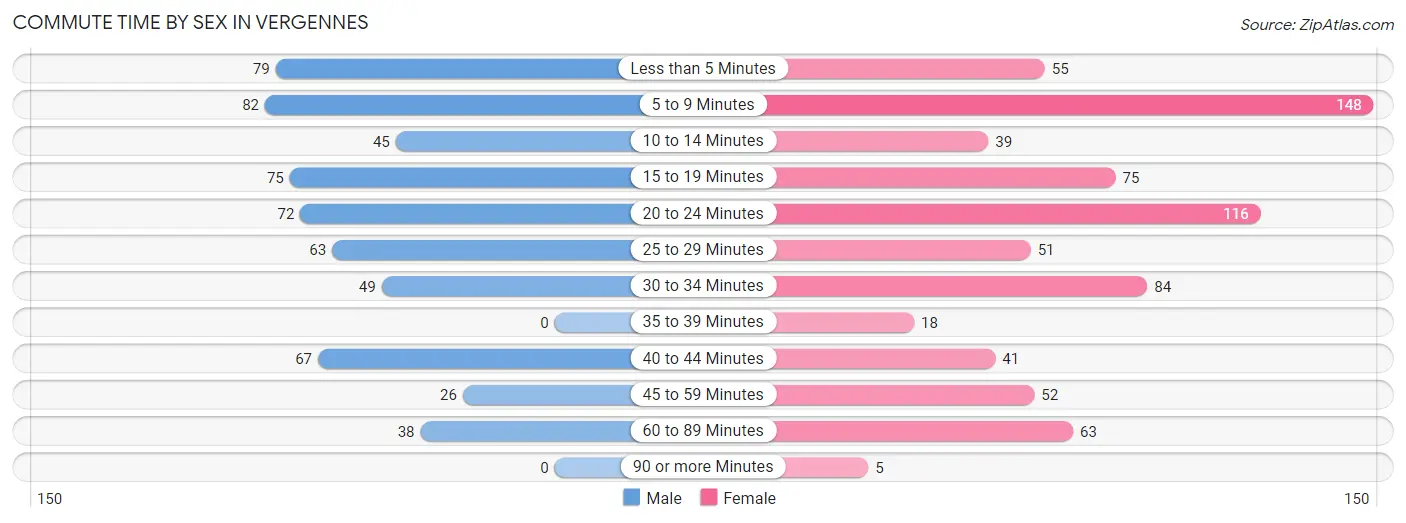
| Commute Time | Male | Female |
| Less than 5 Minutes | 79 (13.3%) | 55 (7.4%) |
| 5 to 9 Minutes | 82 (13.8%) | 148 (19.8%) |
| 10 to 14 Minutes | 45 (7.5%) | 39 (5.2%) |
| 15 to 19 Minutes | 75 (12.6%) | 75 (10.0%) |
| 20 to 24 Minutes | 72 (12.1%) | 116 (15.5%) |
| 25 to 29 Minutes | 63 (10.6%) | 51 (6.8%) |
| 30 to 34 Minutes | 49 (8.2%) | 84 (11.2%) |
| 35 to 39 Minutes | 0 (0.0%) | 18 (2.4%) |
| 40 to 44 Minutes | 67 (11.2%) | 41 (5.5%) |
| 45 to 59 Minutes | 26 (4.4%) | 52 (7.0%) |
| 60 to 89 Minutes | 38 (6.4%) | 63 (8.4%) |
| 90 or more Minutes | 0 (0.0%) | 5 (0.7%) |
Time of Departure to Work by Sex in Vergennes
The most frequent times of departure to work in Vergennes are 8:00 AM to 8:29 AM (110, 18.5%) for males and 7:00 AM to 7:29 AM (149, 20.0%) for females.
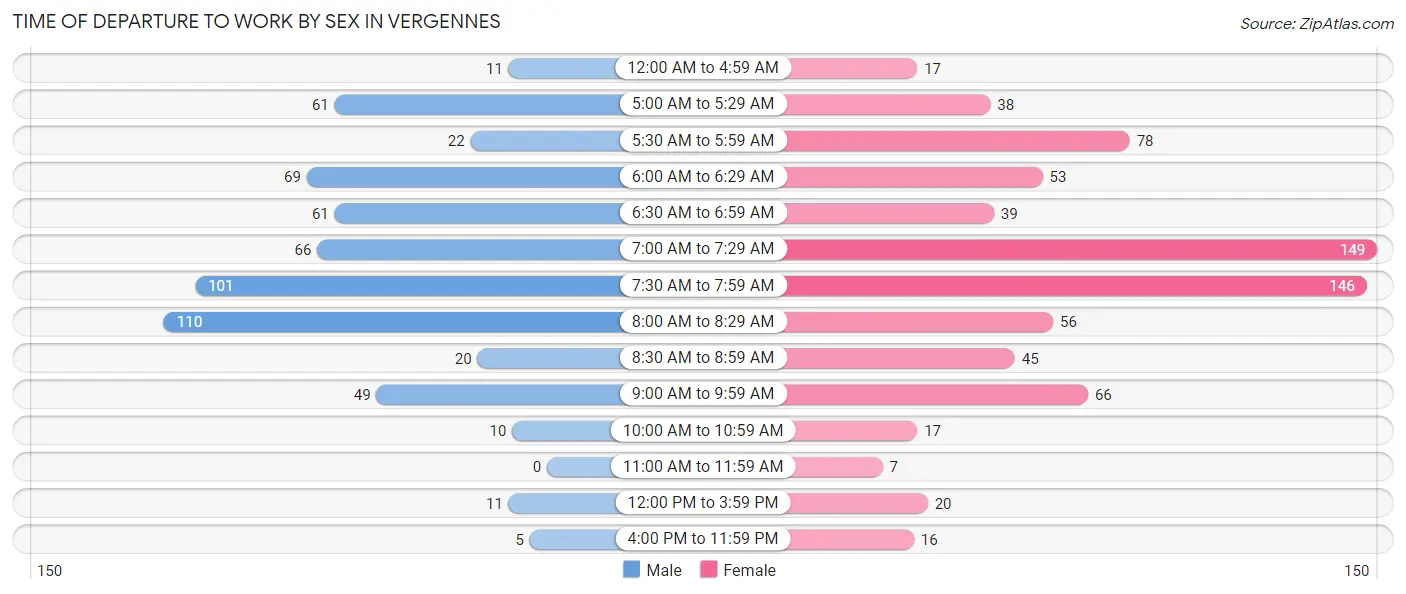
| Time of Departure | Male | Female |
| 12:00 AM to 4:59 AM | 11 (1.8%) | 17 (2.3%) |
| 5:00 AM to 5:29 AM | 61 (10.2%) | 38 (5.1%) |
| 5:30 AM to 5:59 AM | 22 (3.7%) | 78 (10.4%) |
| 6:00 AM to 6:29 AM | 69 (11.6%) | 53 (7.1%) |
| 6:30 AM to 6:59 AM | 61 (10.2%) | 39 (5.2%) |
| 7:00 AM to 7:29 AM | 66 (11.1%) | 149 (20.0%) |
| 7:30 AM to 7:59 AM | 101 (17.0%) | 146 (19.5%) |
| 8:00 AM to 8:29 AM | 110 (18.5%) | 56 (7.5%) |
| 8:30 AM to 8:59 AM | 20 (3.4%) | 45 (6.0%) |
| 9:00 AM to 9:59 AM | 49 (8.2%) | 66 (8.8%) |
| 10:00 AM to 10:59 AM | 10 (1.7%) | 17 (2.3%) |
| 11:00 AM to 11:59 AM | 0 (0.0%) | 7 (0.9%) |
| 12:00 PM to 3:59 PM | 11 (1.8%) | 20 (2.7%) |
| 4:00 PM to 11:59 PM | 5 (0.8%) | 16 (2.1%) |
| Total | 596 (100.0%) | 747 (100.0%) |
Housing Occupancy in Vergennes
Occupancy by Ownership in Vergennes
Of the total 1,047 dwellings in Vergennes, owner-occupied units account for 670 (64.0%), while renter-occupied units make up 377 (36.0%).
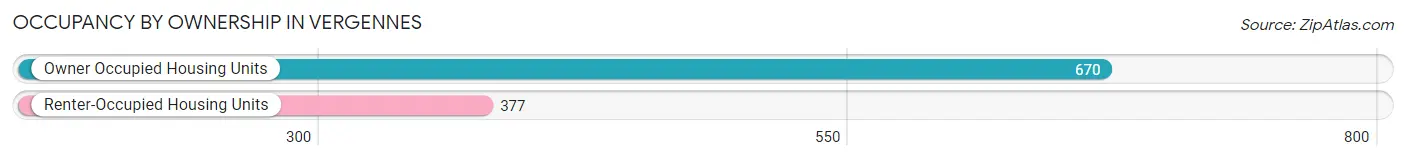
| Occupancy | # Housing Units | % Housing Units |
| Owner Occupied Housing Units | 670 | 64.0% |
| Renter-Occupied Housing Units | 377 | 36.0% |
| Total Occupied Housing Units | 1,047 | 100.0% |
Occupancy by Household Size in Vergennes
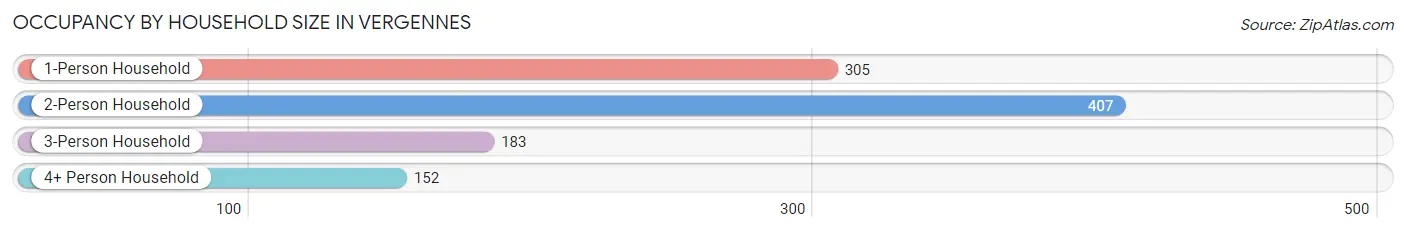
| Household Size | # Housing Units | % Housing Units |
| 1-Person Household | 305 | 29.1% |
| 2-Person Household | 407 | 38.9% |
| 3-Person Household | 183 | 17.5% |
| 4+ Person Household | 152 | 14.5% |
| Total Housing Units | 1,047 | 100.0% |
Occupancy by Ownership by Household Size in Vergennes
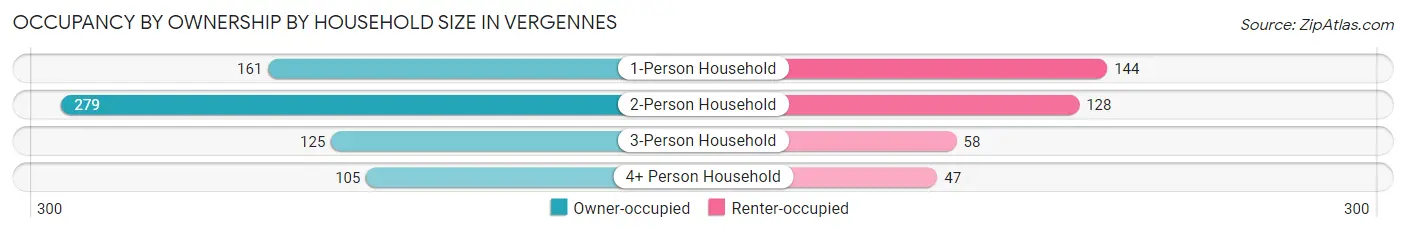
| Household Size | Owner-occupied | Renter-occupied |
| 1-Person Household | 161 (52.8%) | 144 (47.2%) |
| 2-Person Household | 279 (68.5%) | 128 (31.5%) |
| 3-Person Household | 125 (68.3%) | 58 (31.7%) |
| 4+ Person Household | 105 (69.1%) | 47 (30.9%) |
| Total Housing Units | 670 (64.0%) | 377 (36.0%) |
Occupancy by Educational Attainment in Vergennes
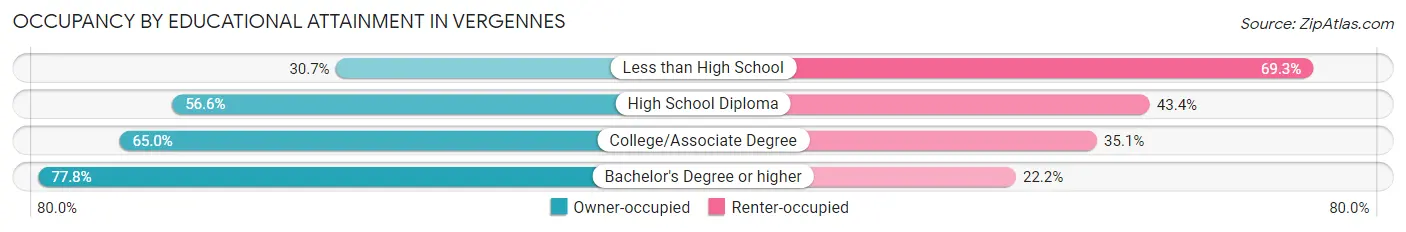
| Household Size | Owner-occupied | Renter-occupied |
| Less than High School | 35 (30.7%) | 79 (69.3%) |
| High School Diploma | 129 (56.6%) | 99 (43.4%) |
| College/Associate Degree | 215 (64.9%) | 116 (35.0%) |
| Bachelor's Degree or higher | 291 (77.8%) | 83 (22.2%) |
Occupancy by Age of Householder in Vergennes
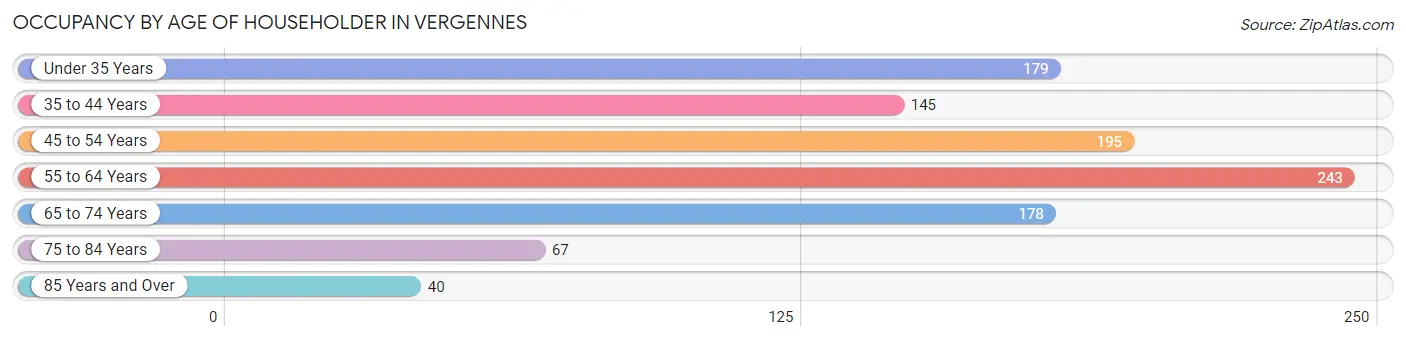
| Age Bracket | # Households | % Households |
| Under 35 Years | 179 | 17.1% |
| 35 to 44 Years | 145 | 13.9% |
| 45 to 54 Years | 195 | 18.6% |
| 55 to 64 Years | 243 | 23.2% |
| 65 to 74 Years | 178 | 17.0% |
| 75 to 84 Years | 67 | 6.4% |
| 85 Years and Over | 40 | 3.8% |
| Total | 1,047 | 100.0% |
Housing Finances in Vergennes
Median Income by Occupancy in Vergennes
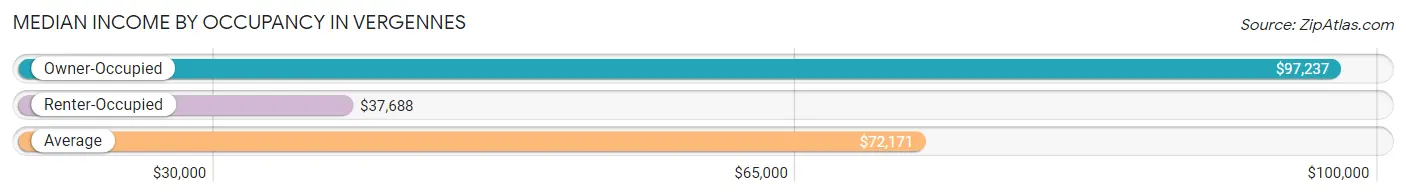
| Occupancy Type | # Households | Median Income |
| Owner-Occupied | 670 (64.0%) | $97,237 |
| Renter-Occupied | 377 (36.0%) | $37,688 |
| Average | 1,047 (100.0%) | $72,171 |
Occupancy by Householder Income Bracket in Vergennes
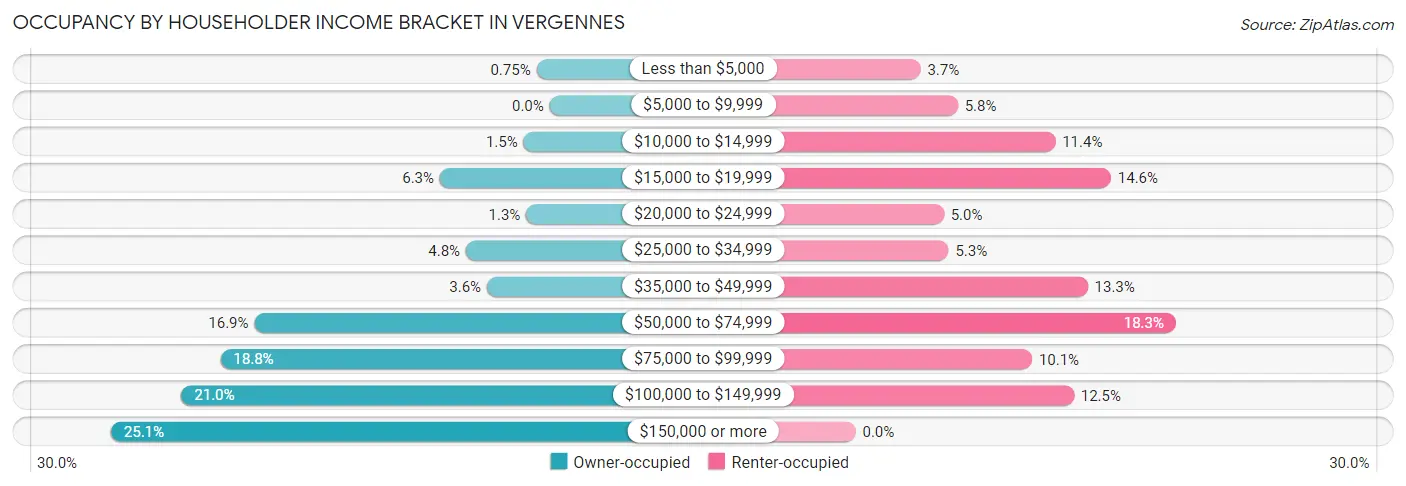
| Income Bracket | Owner-occupied | Renter-occupied |
| Less than $5,000 | 5 (0.7%) | 14 (3.7%) |
| $5,000 to $9,999 | 0 (0.0%) | 22 (5.8%) |
| $10,000 to $14,999 | 10 (1.5%) | 43 (11.4%) |
| $15,000 to $19,999 | 42 (6.3%) | 55 (14.6%) |
| $20,000 to $24,999 | 9 (1.3%) | 19 (5.0%) |
| $25,000 to $34,999 | 32 (4.8%) | 20 (5.3%) |
| $35,000 to $49,999 | 24 (3.6%) | 50 (13.3%) |
| $50,000 to $74,999 | 113 (16.9%) | 69 (18.3%) |
| $75,000 to $99,999 | 126 (18.8%) | 38 (10.1%) |
| $100,000 to $149,999 | 141 (21.0%) | 47 (12.5%) |
| $150,000 or more | 168 (25.1%) | 0 (0.0%) |
| Total | 670 (100.0%) | 377 (100.0%) |
Monthly Housing Cost Tiers in Vergennes
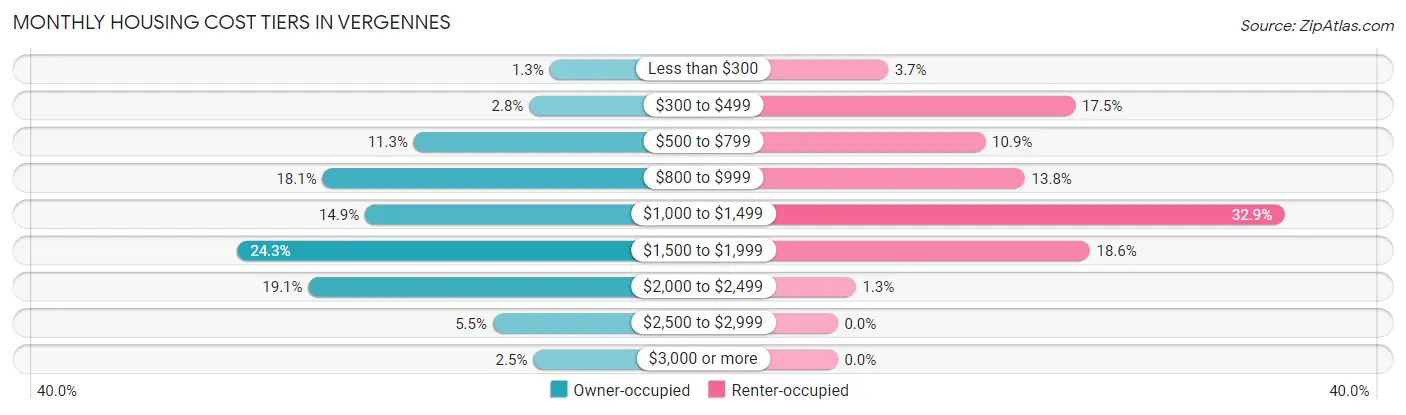
| Monthly Cost | Owner-occupied | Renter-occupied |
| Less than $300 | 9 (1.3%) | 14 (3.7%) |
| $300 to $499 | 19 (2.8%) | 66 (17.5%) |
| $500 to $799 | 76 (11.3%) | 41 (10.9%) |
| $800 to $999 | 121 (18.1%) | 52 (13.8%) |
| $1,000 to $1,499 | 100 (14.9%) | 124 (32.9%) |
| $1,500 to $1,999 | 163 (24.3%) | 70 (18.6%) |
| $2,000 to $2,499 | 128 (19.1%) | 5 (1.3%) |
| $2,500 to $2,999 | 37 (5.5%) | 0 (0.0%) |
| $3,000 or more | 17 (2.5%) | 0 (0.0%) |
| Total | 670 (100.0%) | 377 (100.0%) |
Physical Housing Characteristics in Vergennes
Housing Structures in Vergennes
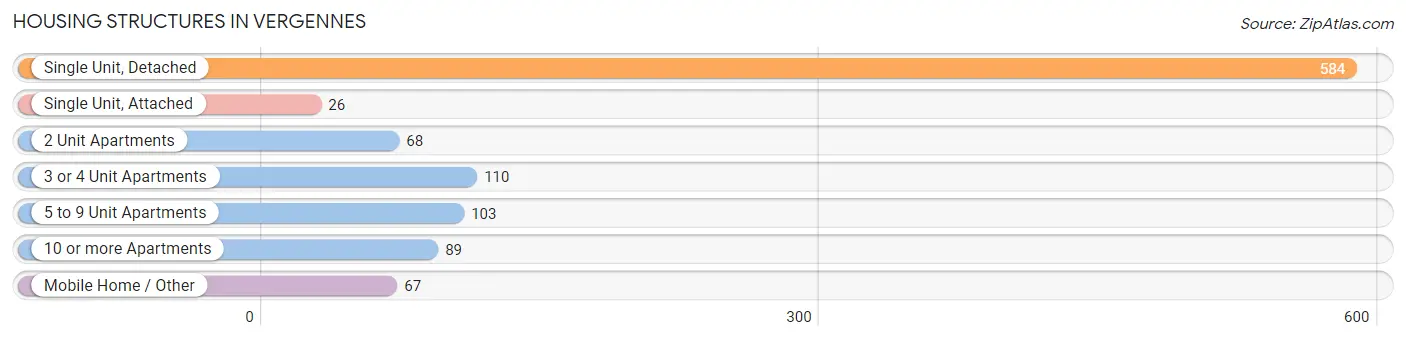
| Structure Type | # Housing Units | % Housing Units |
| Single Unit, Detached | 584 | 55.8% |
| Single Unit, Attached | 26 | 2.5% |
| 2 Unit Apartments | 68 | 6.5% |
| 3 or 4 Unit Apartments | 110 | 10.5% |
| 5 to 9 Unit Apartments | 103 | 9.8% |
| 10 or more Apartments | 89 | 8.5% |
| Mobile Home / Other | 67 | 6.4% |
| Total | 1,047 | 100.0% |
Housing Structures by Occupancy in Vergennes
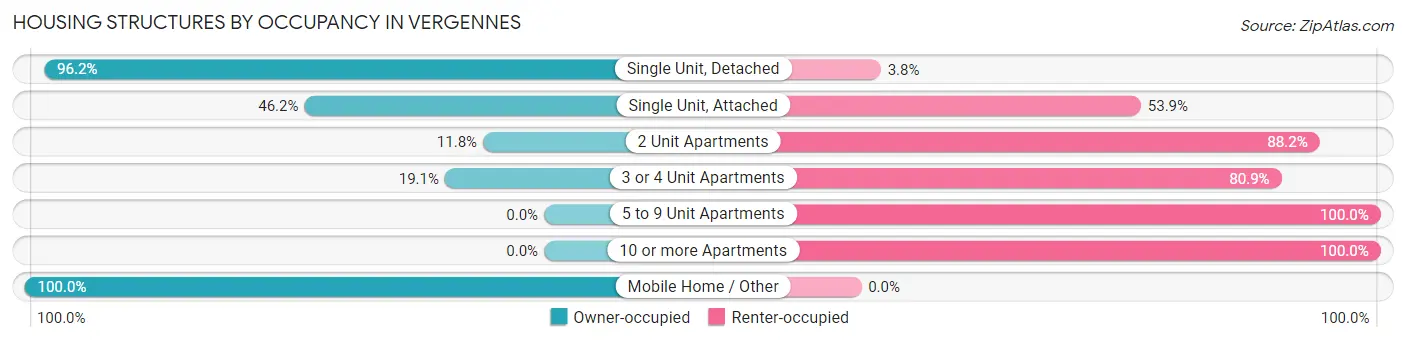
| Structure Type | Owner-occupied | Renter-occupied |
| Single Unit, Detached | 562 (96.2%) | 22 (3.8%) |
| Single Unit, Attached | 12 (46.2%) | 14 (53.8%) |
| 2 Unit Apartments | 8 (11.8%) | 60 (88.2%) |
| 3 or 4 Unit Apartments | 21 (19.1%) | 89 (80.9%) |
| 5 to 9 Unit Apartments | 0 (0.0%) | 103 (100.0%) |
| 10 or more Apartments | 0 (0.0%) | 89 (100.0%) |
| Mobile Home / Other | 67 (100.0%) | 0 (0.0%) |
| Total | 670 (64.0%) | 377 (36.0%) |
Housing Structures by Number of Rooms in Vergennes
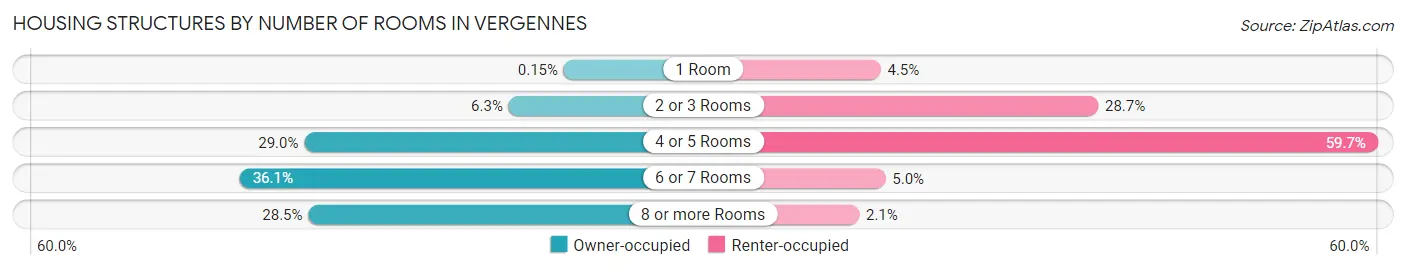
| Number of Rooms | Owner-occupied | Renter-occupied |
| 1 Room | 1 (0.2%) | 17 (4.5%) |
| 2 or 3 Rooms | 42 (6.3%) | 108 (28.6%) |
| 4 or 5 Rooms | 194 (29.0%) | 225 (59.7%) |
| 6 or 7 Rooms | 242 (36.1%) | 19 (5.0%) |
| 8 or more Rooms | 191 (28.5%) | 8 (2.1%) |
| Total | 670 (100.0%) | 377 (100.0%) |
Housing Structure by Heating Type in Vergennes
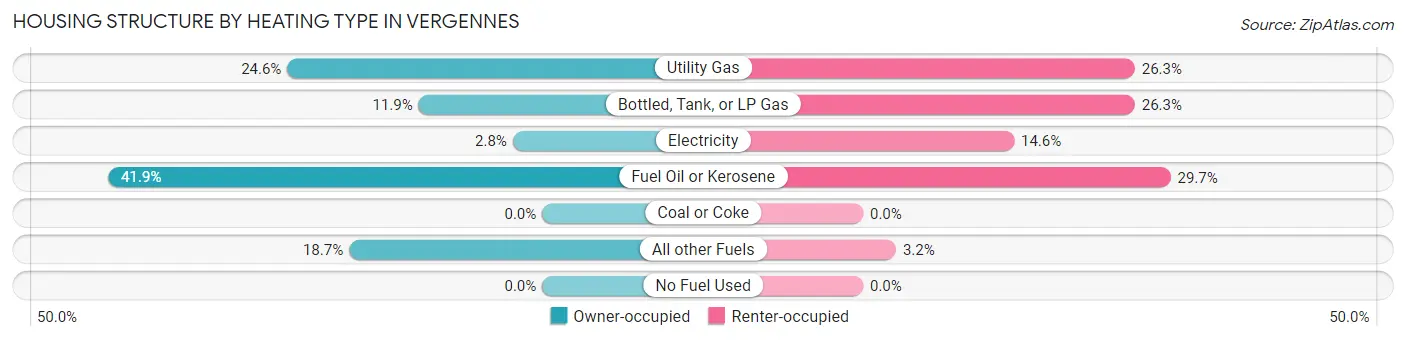
| Heating Type | Owner-occupied | Renter-occupied |
| Utility Gas | 165 (24.6%) | 99 (26.3%) |
| Bottled, Tank, or LP Gas | 80 (11.9%) | 99 (26.3%) |
| Electricity | 19 (2.8%) | 55 (14.6%) |
| Fuel Oil or Kerosene | 281 (41.9%) | 112 (29.7%) |
| Coal or Coke | 0 (0.0%) | 0 (0.0%) |
| All other Fuels | 125 (18.7%) | 12 (3.2%) |
| No Fuel Used | 0 (0.0%) | 0 (0.0%) |
| Total | 670 (100.0%) | 377 (100.0%) |
Household Vehicle Usage in Vergennes
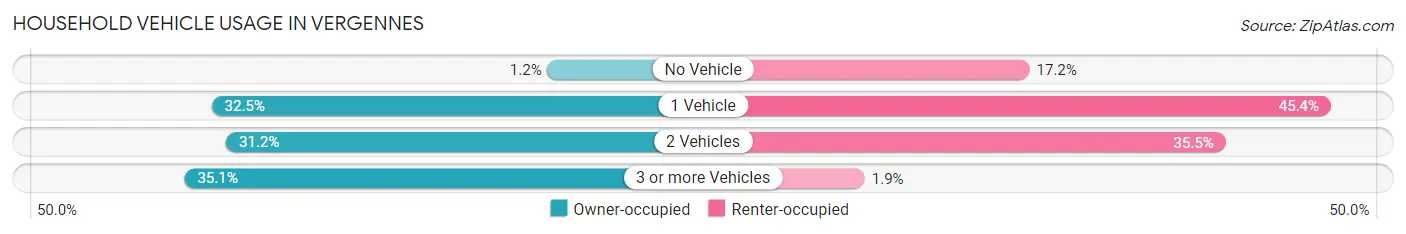
| Vehicles per Household | Owner-occupied | Renter-occupied |
| No Vehicle | 8 (1.2%) | 65 (17.2%) |
| 1 Vehicle | 218 (32.5%) | 171 (45.4%) |
| 2 Vehicles | 209 (31.2%) | 134 (35.5%) |
| 3 or more Vehicles | 235 (35.1%) | 7 (1.9%) |
| Total | 670 (100.0%) | 377 (100.0%) |
Real Estate & Mortgages in Vergennes
Real Estate and Mortgage Overview in Vergennes
| Characteristic | Without Mortgage | With Mortgage |
| Housing Units | 239 | 431 |
| Median Property Value | $209,900 | $256,800 |
| Median Household Income | $58,125 | $134 |
| Monthly Housing Costs | $837 | $17 |
| Real Estate Taxes | $4,603 | $0 |
Property Value by Mortgage Status in Vergennes
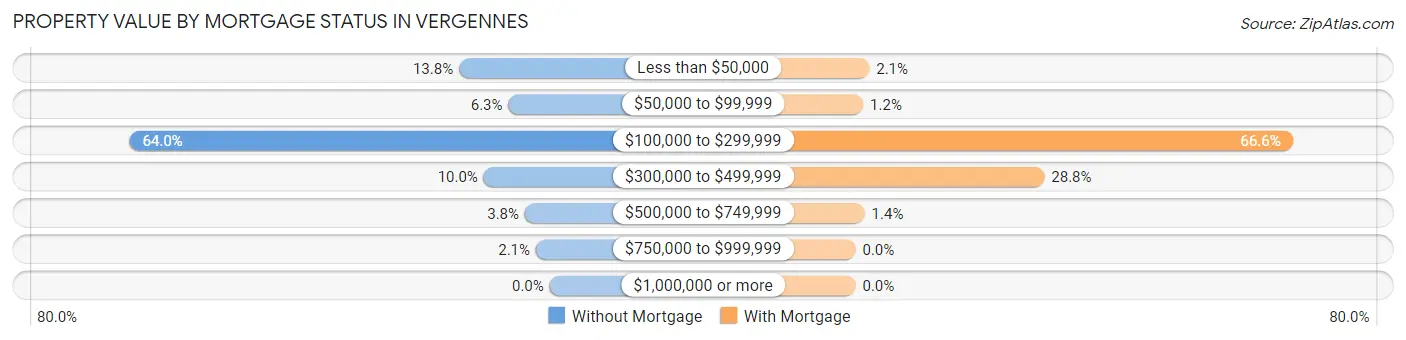
| Property Value | Without Mortgage | With Mortgage |
| Less than $50,000 | 33 (13.8%) | 9 (2.1%) |
| $50,000 to $99,999 | 15 (6.3%) | 5 (1.2%) |
| $100,000 to $299,999 | 153 (64.0%) | 287 (66.6%) |
| $300,000 to $499,999 | 24 (10.0%) | 124 (28.8%) |
| $500,000 to $749,999 | 9 (3.8%) | 6 (1.4%) |
| $750,000 to $999,999 | 5 (2.1%) | 0 (0.0%) |
| $1,000,000 or more | 0 (0.0%) | 0 (0.0%) |
| Total | 239 (100.0%) | 431 (100.0%) |
Household Income by Mortgage Status in Vergennes
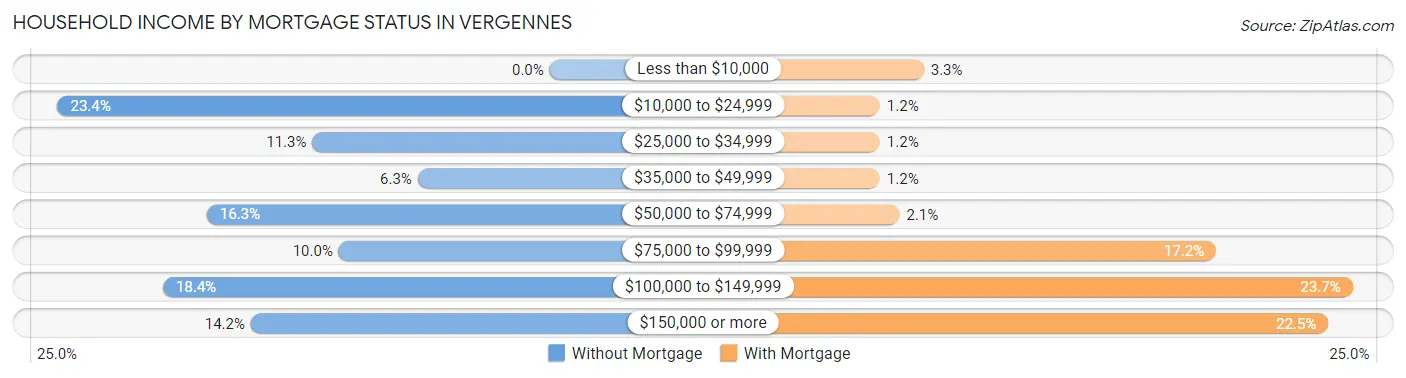
| Household Income | Without Mortgage | With Mortgage |
| Less than $10,000 | 0 (0.0%) | 14 (3.3%) |
| $10,000 to $24,999 | 56 (23.4%) | 5 (1.2%) |
| $25,000 to $34,999 | 27 (11.3%) | 5 (1.2%) |
| $35,000 to $49,999 | 15 (6.3%) | 5 (1.2%) |
| $50,000 to $74,999 | 39 (16.3%) | 9 (2.1%) |
| $75,000 to $99,999 | 24 (10.0%) | 74 (17.2%) |
| $100,000 to $149,999 | 44 (18.4%) | 102 (23.7%) |
| $150,000 or more | 34 (14.2%) | 97 (22.5%) |
| Total | 239 (100.0%) | 431 (100.0%) |
Property Value to Household Income Ratio in Vergennes
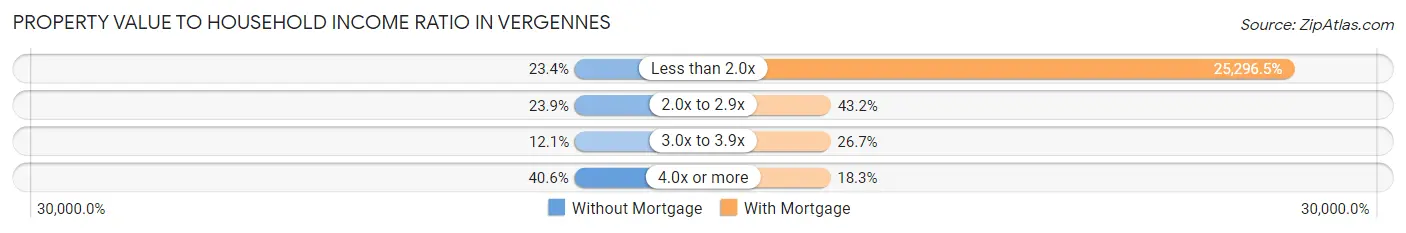
| Value-to-Income Ratio | Without Mortgage | With Mortgage |
| Less than 2.0x | 56 (23.4%) | 109,028 (25,296.5%) |
| 2.0x to 2.9x | 57 (23.8%) | 186 (43.2%) |
| 3.0x to 3.9x | 29 (12.1%) | 115 (26.7%) |
| 4.0x or more | 97 (40.6%) | 79 (18.3%) |
| Total | 239 (100.0%) | 431 (100.0%) |
Real Estate Taxes by Mortgage Status in Vergennes
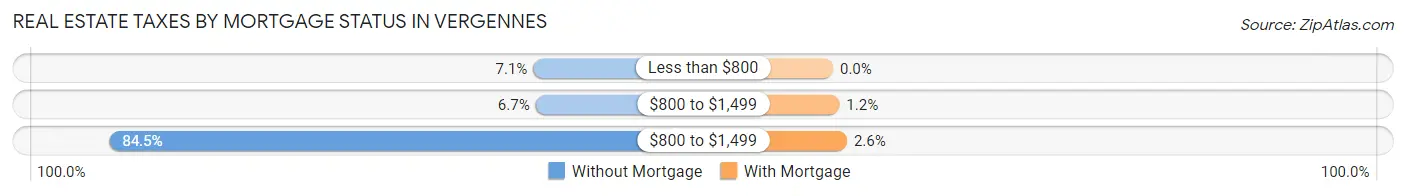
| Property Taxes | Without Mortgage | With Mortgage |
| Less than $800 | 17 (7.1%) | 0 (0.0%) |
| $800 to $1,499 | 16 (6.7%) | 5 (1.2%) |
| $800 to $1,499 | 202 (84.5%) | 11 (2.5%) |
| Total | 239 (100.0%) | 431 (100.0%) |
Health & Disability in Vergennes
Health Insurance Coverage by Age in Vergennes
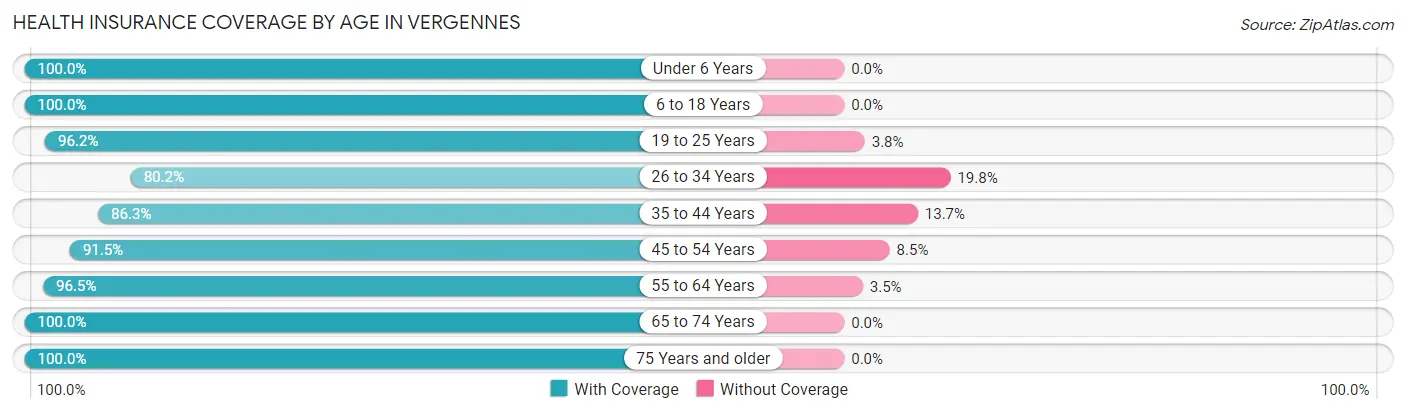
| Age Bracket | With Coverage | Without Coverage |
| Under 6 Years | 99 (100.0%) | 0 (0.0%) |
| 6 to 18 Years | 332 (100.0%) | 0 (0.0%) |
| 19 to 25 Years | 252 (96.2%) | 10 (3.8%) |
| 26 to 34 Years | 239 (80.2%) | 59 (19.8%) |
| 35 to 44 Years | 239 (86.3%) | 38 (13.7%) |
| 45 to 54 Years | 368 (91.5%) | 34 (8.5%) |
| 55 to 64 Years | 447 (96.5%) | 16 (3.5%) |
| 65 to 74 Years | 255 (100.0%) | 0 (0.0%) |
| 75 Years and older | 142 (100.0%) | 0 (0.0%) |
| Total | 2,373 (93.8%) | 157 (6.2%) |
Health Insurance Coverage by Citizenship Status in Vergennes
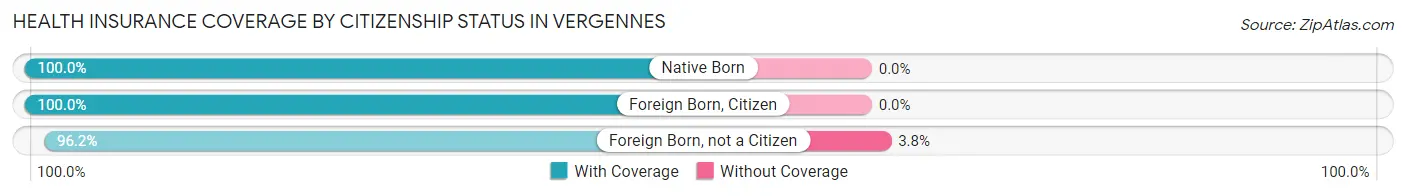
| Citizenship Status | With Coverage | Without Coverage |
| Native Born | 99 (100.0%) | 0 (0.0%) |
| Foreign Born, Citizen | 332 (100.0%) | 0 (0.0%) |
| Foreign Born, not a Citizen | 252 (96.2%) | 10 (3.8%) |
Health Insurance Coverage by Household Income in Vergennes
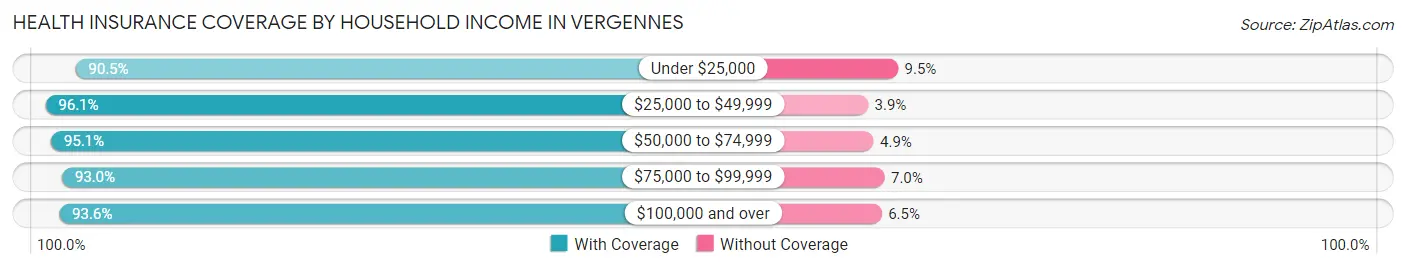
| Household Income | With Coverage | Without Coverage |
| Under $25,000 | 247 (90.5%) | 26 (9.5%) |
| $25,000 to $49,999 | 247 (96.1%) | 10 (3.9%) |
| $50,000 to $74,999 | 347 (95.1%) | 18 (4.9%) |
| $75,000 to $99,999 | 373 (93.0%) | 28 (7.0%) |
| $100,000 and over | 1,087 (93.5%) | 75 (6.5%) |
Public vs Private Health Insurance Coverage by Age in Vergennes
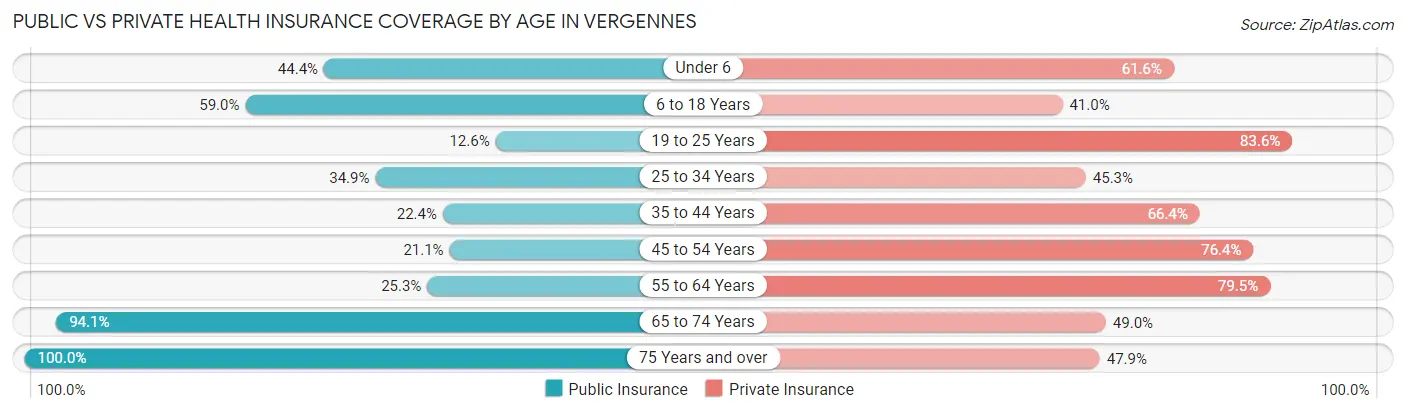
| Age Bracket | Public Insurance | Private Insurance |
| Under 6 | 44 (44.4%) | 61 (61.6%) |
| 6 to 18 Years | 196 (59.0%) | 136 (41.0%) |
| 19 to 25 Years | 33 (12.6%) | 219 (83.6%) |
| 25 to 34 Years | 104 (34.9%) | 135 (45.3%) |
| 35 to 44 Years | 62 (22.4%) | 184 (66.4%) |
| 45 to 54 Years | 85 (21.1%) | 307 (76.4%) |
| 55 to 64 Years | 117 (25.3%) | 368 (79.5%) |
| 65 to 74 Years | 240 (94.1%) | 125 (49.0%) |
| 75 Years and over | 142 (100.0%) | 68 (47.9%) |
| Total | 1,023 (40.4%) | 1,603 (63.4%) |
Disability Status by Sex by Age in Vergennes
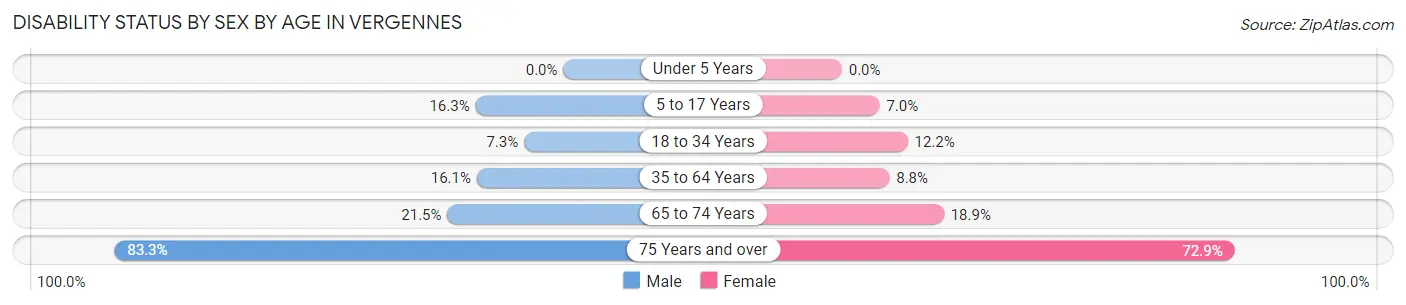
| Age Bracket | Male | Female |
| Under 5 Years | 0 (0.0%) | 0 (0.0%) |
| 5 to 17 Years | 23 (16.3%) | 14 (7.0%) |
| 18 to 34 Years | 18 (7.3%) | 40 (12.2%) |
| 35 to 64 Years | 85 (16.1%) | 54 (8.8%) |
| 65 to 74 Years | 31 (21.5%) | 21 (18.9%) |
| 75 Years and over | 20 (83.3%) | 86 (72.9%) |
Disability Class by Sex by Age in Vergennes
Disability Class: Hearing Difficulty
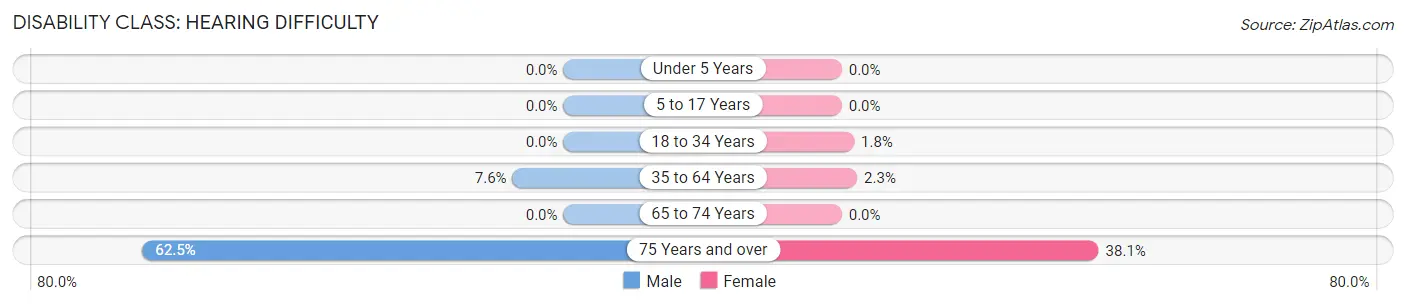
| Age Bracket | Male | Female |
| Under 5 Years | 0 (0.0%) | 0 (0.0%) |
| 5 to 17 Years | 0 (0.0%) | 0 (0.0%) |
| 18 to 34 Years | 0 (0.0%) | 6 (1.8%) |
| 35 to 64 Years | 40 (7.6%) | 14 (2.3%) |
| 65 to 74 Years | 0 (0.0%) | 0 (0.0%) |
| 75 Years and over | 15 (62.5%) | 45 (38.1%) |
Disability Class: Vision Difficulty
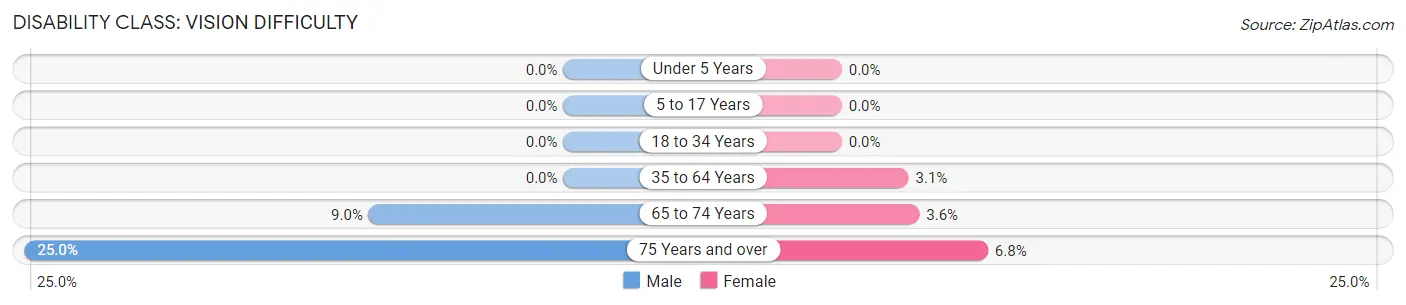
| Age Bracket | Male | Female |
| Under 5 Years | 0 (0.0%) | 0 (0.0%) |
| 5 to 17 Years | 0 (0.0%) | 0 (0.0%) |
| 18 to 34 Years | 0 (0.0%) | 0 (0.0%) |
| 35 to 64 Years | 0 (0.0%) | 19 (3.1%) |
| 65 to 74 Years | 13 (9.0%) | 4 (3.6%) |
| 75 Years and over | 6 (25.0%) | 8 (6.8%) |
Disability Class: Cognitive Difficulty
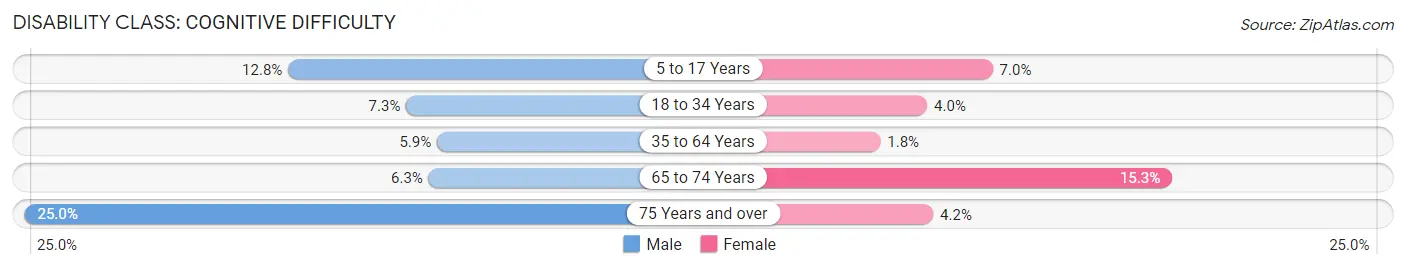
| Age Bracket | Male | Female |
| 5 to 17 Years | 18 (12.8%) | 14 (7.0%) |
| 18 to 34 Years | 18 (7.3%) | 13 (4.0%) |
| 35 to 64 Years | 31 (5.9%) | 11 (1.8%) |
| 65 to 74 Years | 9 (6.2%) | 17 (15.3%) |
| 75 Years and over | 6 (25.0%) | 5 (4.2%) |
Disability Class: Ambulatory Difficulty
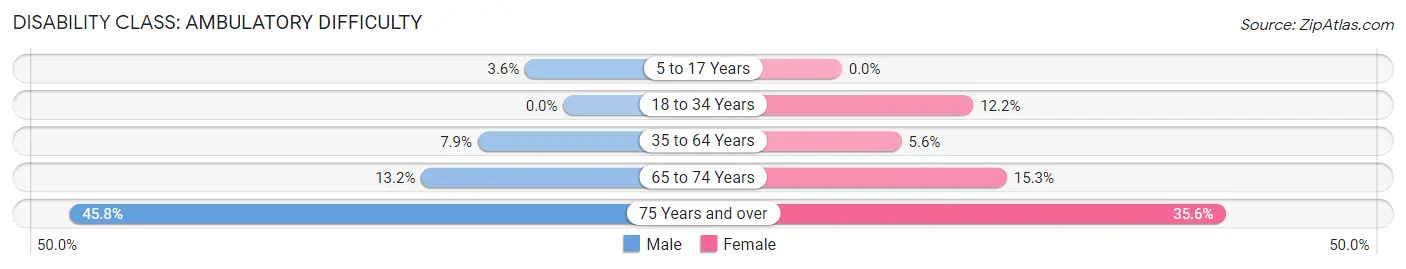
| Age Bracket | Male | Female |
| 5 to 17 Years | 5 (3.5%) | 0 (0.0%) |
| 18 to 34 Years | 0 (0.0%) | 40 (12.2%) |
| 35 to 64 Years | 42 (7.9%) | 34 (5.6%) |
| 65 to 74 Years | 19 (13.2%) | 17 (15.3%) |
| 75 Years and over | 11 (45.8%) | 42 (35.6%) |
Disability Class: Self-Care Difficulty
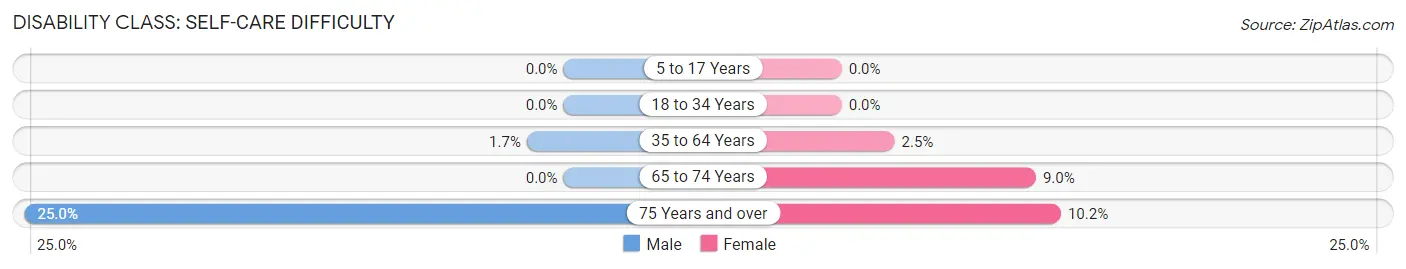
| Age Bracket | Male | Female |
| 5 to 17 Years | 0 (0.0%) | 0 (0.0%) |
| 18 to 34 Years | 0 (0.0%) | 0 (0.0%) |
| 35 to 64 Years | 9 (1.7%) | 15 (2.5%) |
| 65 to 74 Years | 0 (0.0%) | 10 (9.0%) |
| 75 Years and over | 6 (25.0%) | 12 (10.2%) |
Technology Access in Vergennes
Computing Device Access in Vergennes
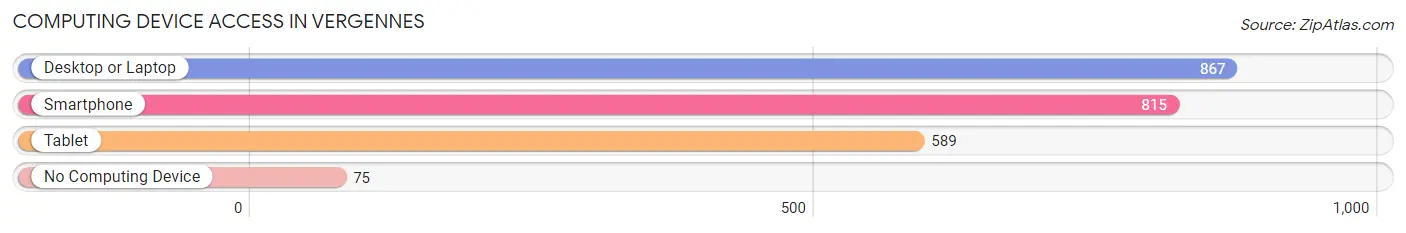
| Device Type | # Households | % Households |
| Desktop or Laptop | 867 | 82.8% |
| Smartphone | 815 | 77.8% |
| Tablet | 589 | 56.3% |
| No Computing Device | 75 | 7.2% |
| Total | 1,047 | 100.0% |
Internet Access in Vergennes
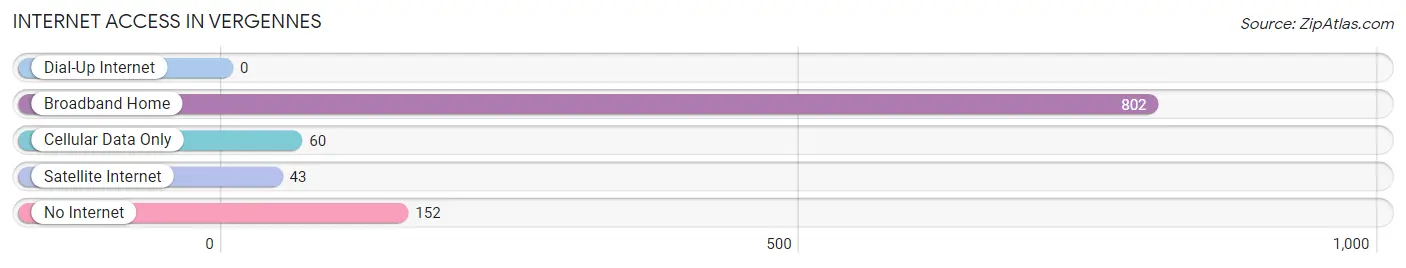
| Internet Type | # Households | % Households |
| Dial-Up Internet | 0 | 0.0% |
| Broadband Home | 802 | 76.6% |
| Cellular Data Only | 60 | 5.7% |
| Satellite Internet | 43 | 4.1% |
| No Internet | 152 | 14.5% |
| Total | 1,047 | 100.0% |
Vergennes Summary
Vergennes is a small city located in Addison County, Vermont, United States. It is the smallest city in the state, with a population of 2,588 as of the 2010 census. The city is situated on the Otter Creek, and is the county seat of Addison County. It is named after Charles Gravier, comte de Vergennes, the French minister of foreign affairs at the time of the American Revolution.
History
The area that is now Vergennes was first settled in 1766 by Ira Allen and his brother Heman. The town was officially chartered in 1788, and was named after Charles Gravier, comte de Vergennes, the French minister of foreign affairs at the time of the American Revolution.
The city was an important port on Lake Champlain during the 19th century, and was home to several shipyards and sawmills. The city was also the site of the first steamboat to travel on Lake Champlain, the Phoenix, which was built in 1809.
Geography
Vergennes is located in the western part of Addison County, in the Champlain Valley region of Vermont. The city is situated on the Otter Creek, and is bordered by the towns of Ferrisburgh, Panton, Waltham, and Addison. The city has a total area of 1.2 square miles, all of which is land.
The city is located in a hilly region, with elevations ranging from 400 to 800 feet above sea level. The highest point in the city is the summit of Mount Abraham, which has an elevation of 1,890 feet.
Economy
Vergennes is a small city with a limited economy. The city's largest employer is the Vergennes Union High School, which employs over 200 people. Other major employers in the city include the Vergennes Laundry, the Vergennes Opera House, and the Vergennes Area Chamber of Commerce.
The city also has a number of small businesses, including restaurants, retail stores, and professional services. The city is also home to several small manufacturing companies, including a furniture maker, a boat builder, and a metal fabricator.
Demographics
As of the 2010 census, there were 2,588 people, 1,093 households, and 645 families residing in the city. The population density was 2,097.3 people per square mile. The racial makeup of the city was 96.2% White, 0.9% African American, 0.4% Native American, 0.7% Asian, 0.1% Pacific Islander, 0.4% from other races, and 1.3% from two or more races. Hispanic or Latino of any race were 1.3% of the population.
The median income for a household in the city was $41,944, and the median income for a family was $50,938. The per capita income for the city was $20,945. About 8.2% of families and 11.2% of the population were below the poverty line, including 15.2% of those under age 18 and 8.2% of those age 65 or over.
Common Questions
What is the Total Population of Vergennes?
Total Population of Vergennes is 2,561.
What is the Total Male Population of Vergennes?
Total Male Population of Vergennes is 1,149.
What is the Total Female Population of Vergennes?
Total Female Population of Vergennes is 1,412.
What is the Ratio of Males per 100 Females in Vergennes?
There are 81.37 Males per 100 Females in Vergennes.
What is the Ratio of Females per 100 Males in Vergennes?
There are 122.89 Females per 100 Males in Vergennes.
What is the Median Population Age in Vergennes?
Median Population Age in Vergennes is 45.2 Years.
What is the Average Family Size in Vergennes
Average Family Size in Vergennes is 2.8 People.
What is the Average Household Size in Vergennes
Average Household Size in Vergennes is 2.4 People.
What is Per Capita Income in Vergennes?
Per Capita income in Vergennes is $36,848.
What is the Median Family Income in Vergennes?
Median Family Income in Vergennes is $91,154.
What is the Median Household income in Vergennes?
Median Household Income in Vergennes is $72,171.
What is Income or Wage Gap in Vergennes?
Income or Wage Gap in Vergennes is 11.8%.
Women in Vergennes earn 88.2 cents for every dollar earned by a man.
What is Family Income Deficit in Vergennes?
Family Income Deficit in Vergennes is $11,885.
Families that are below poverty line in Vergennes earn $11,885 less on average than the poverty threshold level.
What is Inequality or Gini Index in Vergennes?
Inequality or Gini Index in Vergennes is 0.42.
How Large is the Labor Force in Vergennes?
There are 1,575 People in the Labor Forcein in Vergennes.
What is the Percentage of People in the Labor Force in Vergennes?
71.1% of People are in the Labor Force in Vergennes.
What is the Unemployment Rate in Vergennes?
Unemployment Rate in Vergennes is 2.0%.