Brandon, VT
Brandon Map
Brandon Overview
1,858
TOTAL POPULATION
795
MALE POPULATION
1,063
FEMALE POPULATION
74.79
MALES / 100 FEMALES
133.71
FEMALES / 100 MALES
49.1
MEDIAN AGE
3.1
AVG FAMILY SIZE
2.5
AVG HOUSEHOLD SIZE
$27,810
PER CAPITA INCOME
$65,625
AVG FAMILY INCOME
$54,700
AVG HOUSEHOLD INCOME
33.9%
WAGE / INCOME GAP [ % ]
66.1¢/ $1
WAGE / INCOME GAP [ $ ]
0.41
INEQUALITY / GINI INDEX
848
LABOR FORCE [ PEOPLE ]
57.9%
PERCENT IN LABOR FORCE
1.3%
UNEMPLOYMENT RATE
Brandon Zip Codes
Brandon Area Codes
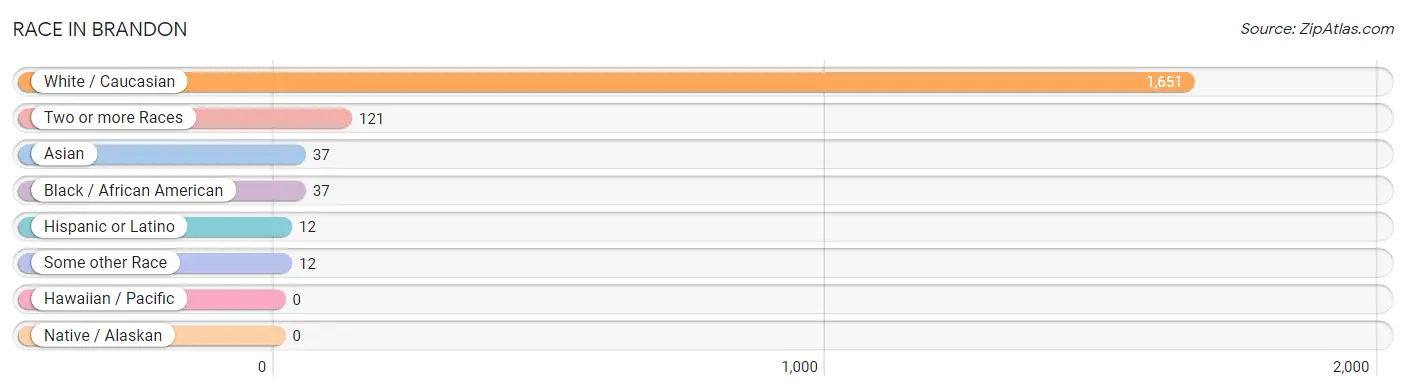
Race in Brandon
The most populous races in Brandon are White / Caucasian (1,651 | 88.9%), Two or more Races (121 | 6.5%), and Asian (37 | 2.0%).
| Race | # Population | % Population |
| Asian | 37 | 2.0% |
| Black / African American | 37 | 2.0% |
| Hawaiian / Pacific | 0 | 0.0% |
| Hispanic or Latino | 12 | 0.6% |
| Native / Alaskan | 0 | 0.0% |
| White / Caucasian | 1,651 | 88.9% |
| Two or more Races | 121 | 6.5% |
| Some other Race | 12 | 0.6% |
| Total | 1,858 | 100.0% |
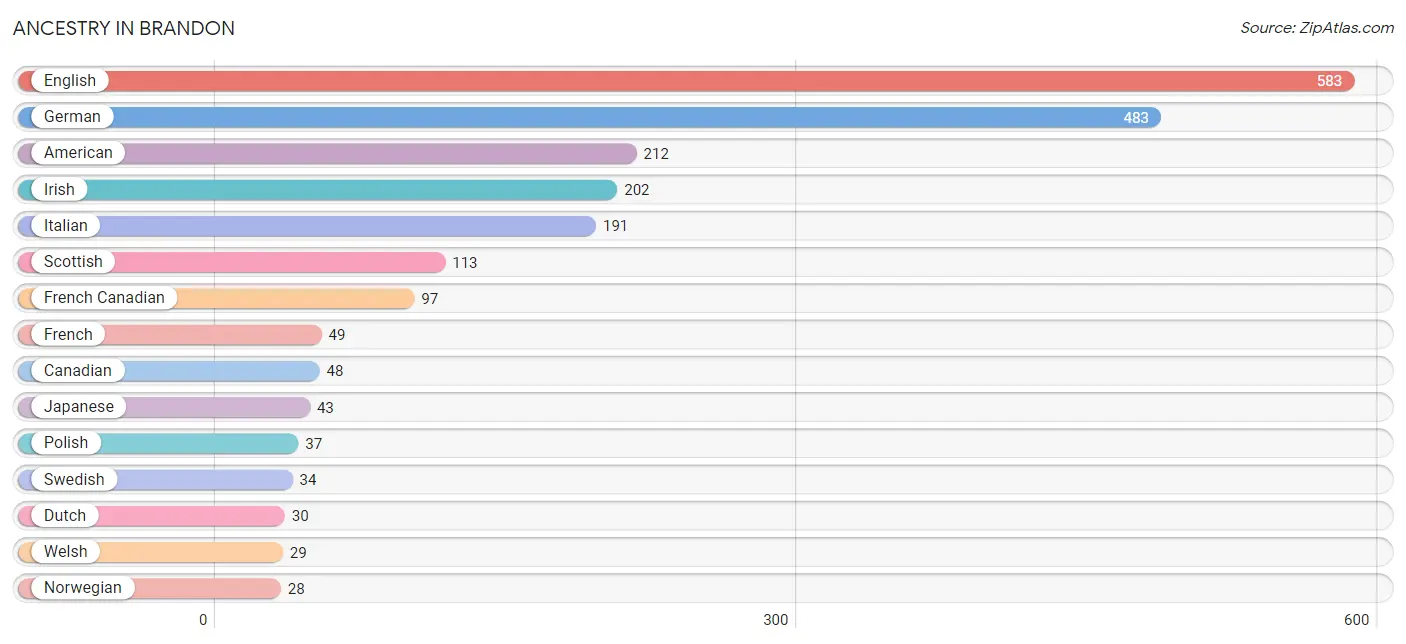
Ancestry in Brandon
The most populous ancestries reported in Brandon are English (583 | 31.4%), German (483 | 26.0%), American (212 | 11.4%), Irish (202 | 10.9%), and Italian (191 | 10.3%), together accounting for 89.9% of all Brandon residents.
| Ancestry | # Population | % Population |
| American | 212 | 11.4% |
| British | 27 | 1.5% |
| Canadian | 48 | 2.6% |
| Danish | 7 | 0.4% |
| Dutch | 30 | 1.6% |
| English | 583 | 31.4% |
| European | 9 | 0.5% |
| Finnish | 10 | 0.5% |
| French | 49 | 2.6% |
| French Canadian | 97 | 5.2% |
| German | 483 | 26.0% |
| Greek | 8 | 0.4% |
| Indian (Asian) | 26 | 1.4% |
| Irish | 202 | 10.9% |
| Italian | 191 | 10.3% |
| Japanese | 43 | 2.3% |
| Norwegian | 28 | 1.5% |
| Polish | 37 | 2.0% |
| Puerto Rican | 12 | 0.6% |
| Scotch-Irish | 6 | 0.3% |
| Scottish | 113 | 6.1% |
| Swedish | 34 | 1.8% |
| Swiss | 12 | 0.6% |
| Welsh | 29 | 1.6% | View All 24 Rows |
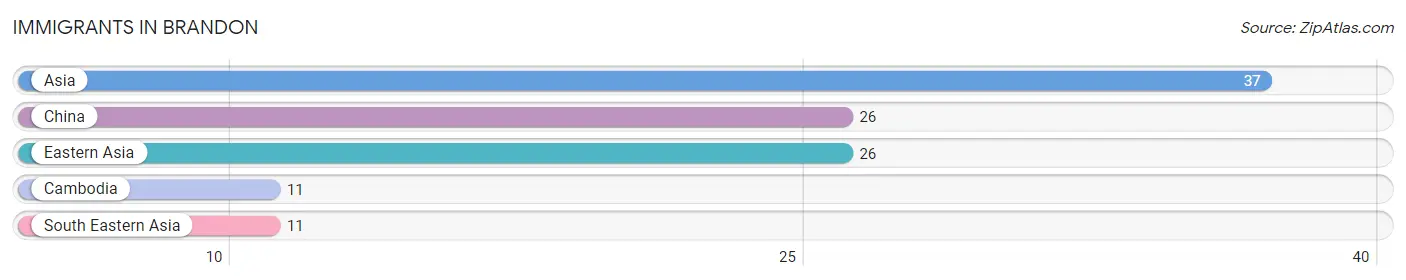
Immigrants in Brandon
The most numerous immigrant groups reported in Brandon came from Asia (37 | 2.0%), China (26 | 1.4%), Eastern Asia (26 | 1.4%), Cambodia (11 | 0.6%), and South Eastern Asia (11 | 0.6%), together accounting for 6.0% of all Brandon residents.
| Immigration Origin | # Population | % Population |
| Asia | 37 | 2.0% |
| Cambodia | 11 | 0.6% |
| China | 26 | 1.4% |
| Eastern Asia | 26 | 1.4% |
| South Eastern Asia | 11 | 0.6% | View All 5 Rows |
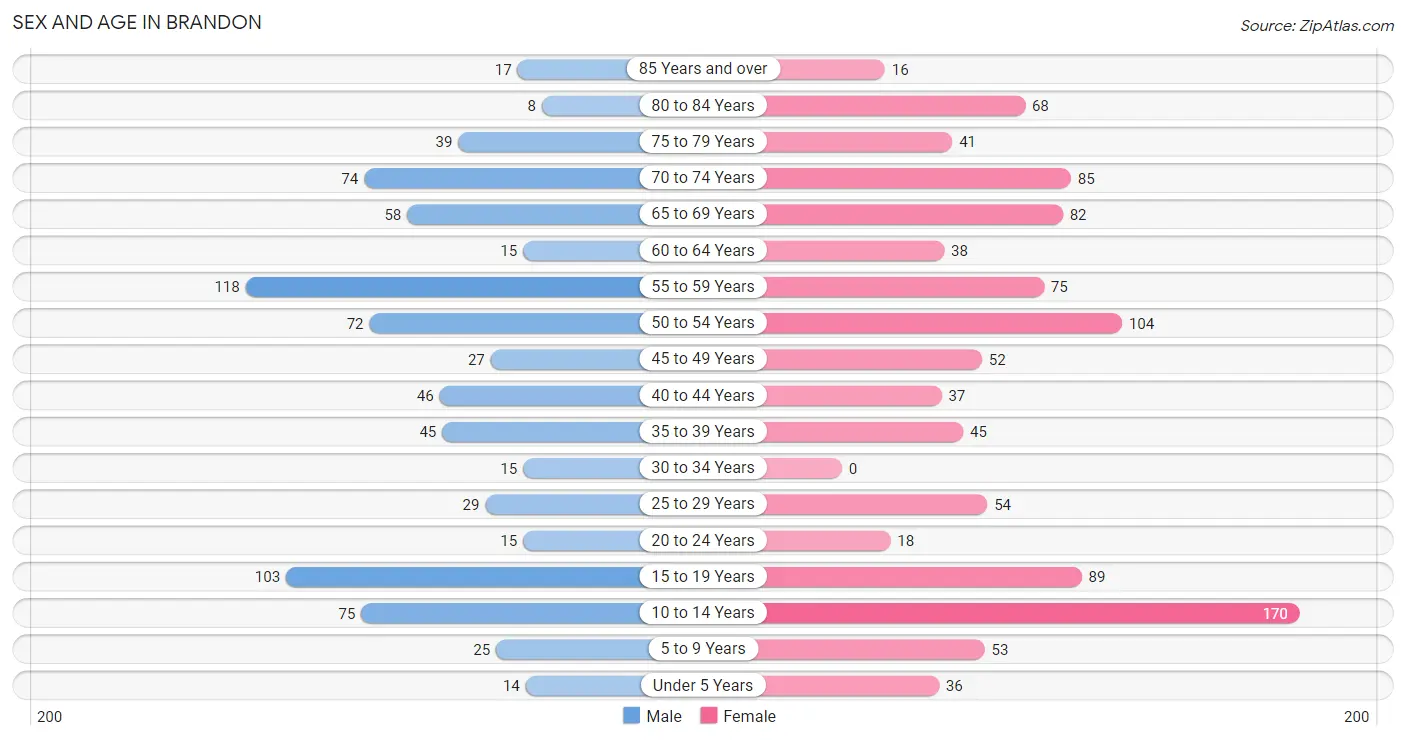
Sex and Age in Brandon
Sex and Age in Brandon
The most populous age groups in Brandon are 55 to 59 Years (118 | 14.8%) for men and 10 to 14 Years (170 | 16.0%) for women.
| Age Bracket | Male | Female |
| Under 5 Years | 14 (1.8%) | 36 (3.4%) |
| 5 to 9 Years | 25 (3.1%) | 53 (5.0%) |
| 10 to 14 Years | 75 (9.4%) | 170 (16.0%) |
| 15 to 19 Years | 103 (13.0%) | 89 (8.4%) |
| 20 to 24 Years | 15 (1.9%) | 18 (1.7%) |
| 25 to 29 Years | 29 (3.6%) | 54 (5.1%) |
| 30 to 34 Years | 15 (1.9%) | 0 (0.0%) |
| 35 to 39 Years | 45 (5.7%) | 45 (4.2%) |
| 40 to 44 Years | 46 (5.8%) | 37 (3.5%) |
| 45 to 49 Years | 27 (3.4%) | 52 (4.9%) |
| 50 to 54 Years | 72 (9.1%) | 104 (9.8%) |
| 55 to 59 Years | 118 (14.8%) | 75 (7.1%) |
| 60 to 64 Years | 15 (1.9%) | 38 (3.6%) |
| 65 to 69 Years | 58 (7.3%) | 82 (7.7%) |
| 70 to 74 Years | 74 (9.3%) | 85 (8.0%) |
| 75 to 79 Years | 39 (4.9%) | 41 (3.9%) |
| 80 to 84 Years | 8 (1.0%) | 68 (6.4%) |
| 85 Years and over | 17 (2.1%) | 16 (1.5%) |
| Total | 795 (100.0%) | 1,063 (100.0%) |
Families and Households in Brandon
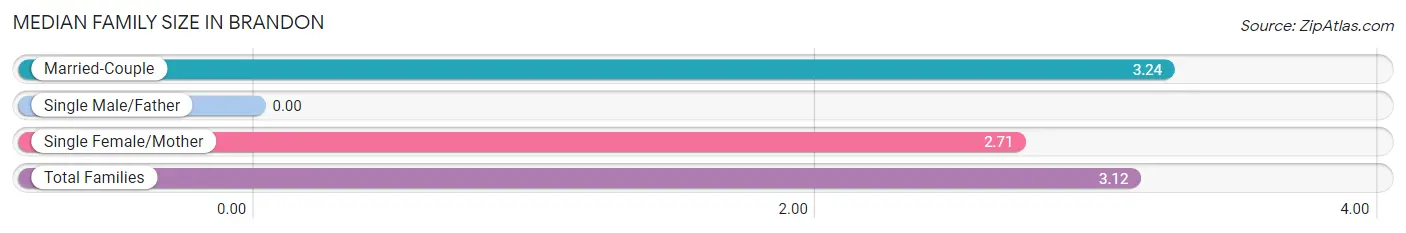
Median Family Size in Brandon
| Family Type | # Families | Family Size |
| Married-Couple | 370 (77.4%) | 3.24 |
| Single Male/Father | 0 (0.0%) | - |
| Single Female/Mother | 108 (22.6%) | 2.71 |
| Total Families | 478 (100.0%) | 3.12 |
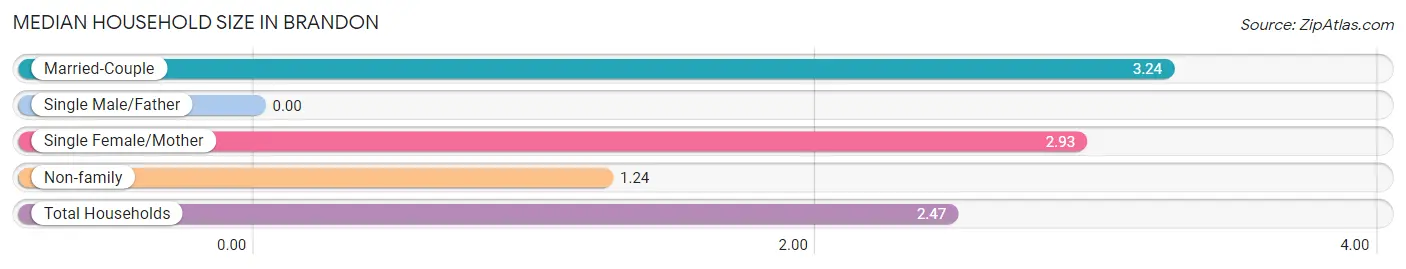
Median Household Size in Brandon
| Household Type | # Households | Household Size |
| Married-Couple | 370 (49.5%) | 3.24 |
| Single Male/Father | 0 (0.0%) | - |
| Single Female/Mother | 108 (14.4%) | 2.93 |
| Non-family | 270 (36.1%) | 1.24 |
| Total Households | 748 (100.0%) | 2.47 |
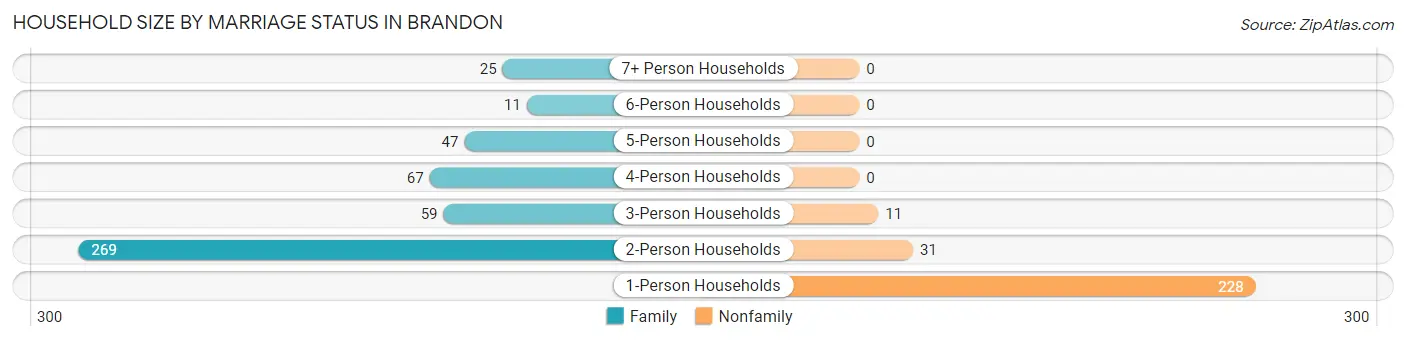
Household Size by Marriage Status in Brandon
Out of a total of 748 households in Brandon, 478 (63.9%) are family households, while 270 (36.1%) are nonfamily households. The most numerous type of family households are 2-person households, comprising 269, and the most common type of nonfamily households are 1-person households, comprising 228.
| Household Size | Family Households | Nonfamily Households |
| 1-Person Households | - | 228 (30.5%) |
| 2-Person Households | 269 (36.0%) | 31 (4.1%) |
| 3-Person Households | 59 (7.9%) | 11 (1.5%) |
| 4-Person Households | 67 (9.0%) | 0 (0.0%) |
| 5-Person Households | 47 (6.3%) | 0 (0.0%) |
| 6-Person Households | 11 (1.5%) | 0 (0.0%) |
| 7+ Person Households | 25 (3.3%) | 0 (0.0%) |
| Total | 478 (63.9%) | 270 (36.1%) |
Female Fertility in Brandon
Fertility by Age in Brandon
| Age Bracket | Women with Births | Births / 1,000 Women |
| 15 to 19 years | 0 (0.0%) | 0.0 |
| 20 to 34 years | 0 (0.0%) | 0.0 |
| 35 to 50 years | 0 (0.0%) | 0.0 |
| Total | 0 (0.0%) | 0.0 |
Fertility by Age by Marriage Status in Brandon
| Age Bracket | Married | Unmarried |
| 15 to 19 years | 0 (0.0%) | 0 (0.0%) |
| 20 to 34 years | 0 (0.0%) | 0 (0.0%) |
| 35 to 50 years | 0 (0.0%) | 0 (0.0%) |
| Total | 0 (0.0%) | 0 (0.0%) |
Fertility by Education in Brandon
| Educational Attainment | Women with Births | Births / 1,000 Women |
| Less than High School | 0 (0.0%) | 0.0 |
| High School Diploma | 0 (0.0%) | 0.0 |
| College or Associate's Degree | 0 (0.0%) | 0.0 |
| Bachelor's Degree | 0 (0.0%) | 0.0 |
| Graduate Degree | 0 (0.0%) | 0.0 |
| Total | 0 (0.0%) | 0.0 |
Fertility by Education by Marriage Status in Brandon
| Educational Attainment | Married | Unmarried |
| Less than High School | 0 (0.0%) | 0 (0.0%) |
| High School Diploma | 0 (0.0%) | 0 (0.0%) |
| College or Associate's Degree | 0 (0.0%) | 0 (0.0%) |
| Bachelor's Degree | 0 (0.0%) | 0 (0.0%) |
| Graduate Degree | 0 (0.0%) | 0 (0.0%) |
| Total | 0 (0.0%) | 0 (0.0%) |
Income in Brandon
Income Overview in Brandon
Per Capita Income in Brandon is $27,810, while median incomes of families and households are $65,625 and $54,700 respectively.
| Characteristic | Number | Measure |
| Per Capita Income | 1,858 | $27,810 |
| Median Family Income | 478 | $65,625 |
| Mean Family Income | 478 | $80,424 |
| Median Household Income | 748 | $54,700 |
| Mean Household Income | 748 | $67,912 |
| Income Deficit | 478 | $0 |
| Wage / Income Gap (%) | 1,858 | 33.93% |
| Wage / Income Gap ($) | 1,858 | 66.07¢ per $1 |
| Gini / Inequality Index | 1,858 | 0.41 |
Earnings by Sex in Brandon
Average Earnings in Brandon are $30,063, $34,688 for men and $22,917 for women, a difference of 33.9%.
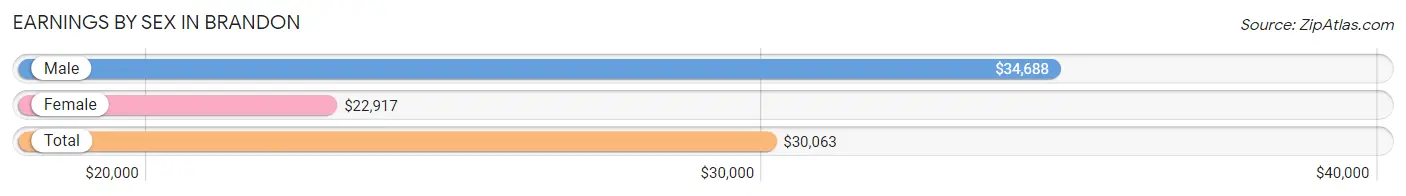
| Sex | Number | Average Earnings |
| Male | 432 (48.4%) | $34,688 |
| Female | 460 (51.6%) | $22,917 |
| Total | 892 (100.0%) | $30,063 |
Earnings by Sex by Income Bracket in Brandon
The most common earnings brackets in Brandon are $100,000+ for men (69 | 16.0%) and $2,499 or less for women (57 | 12.4%).
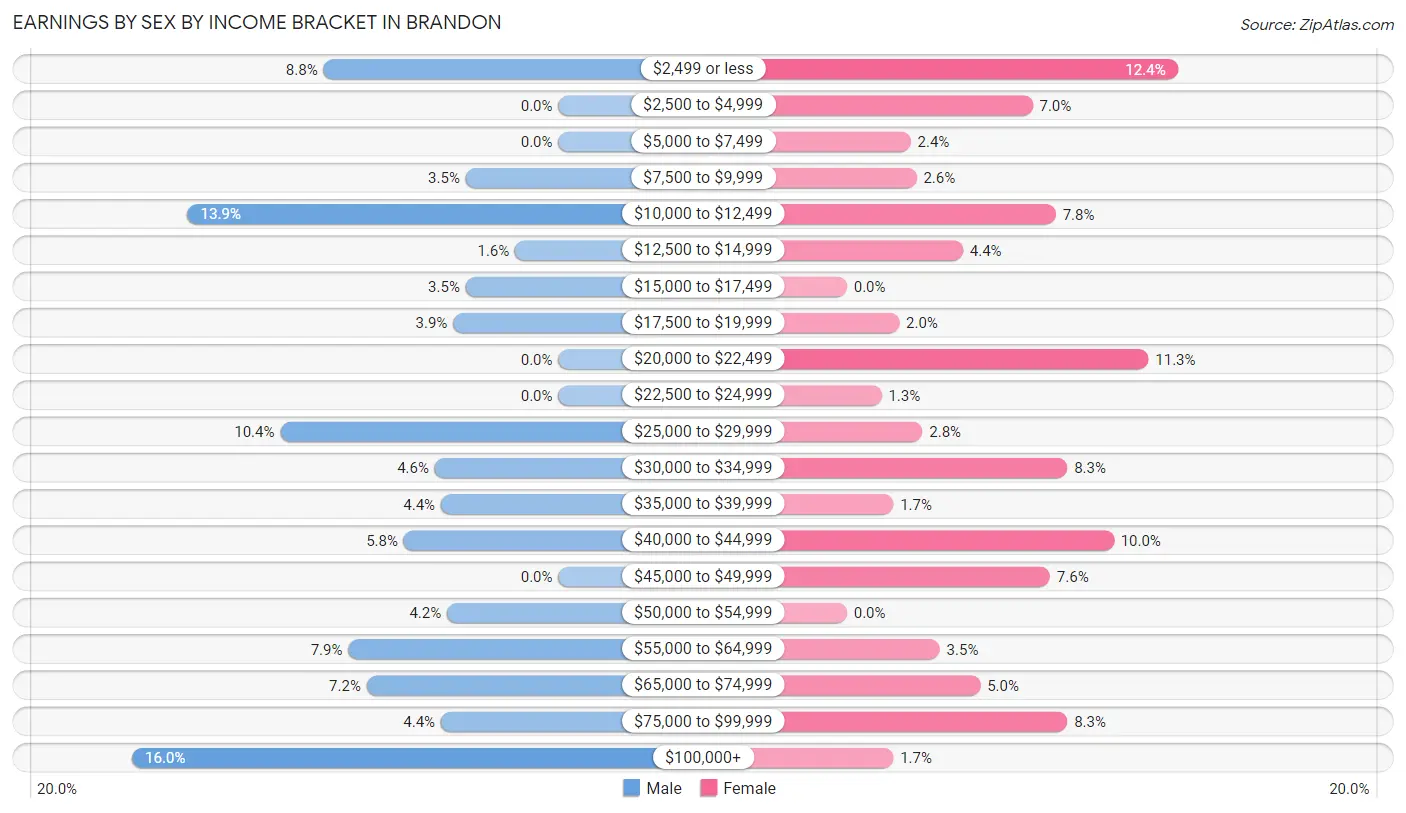
| Income | Male | Female |
| $2,499 or less | 38 (8.8%) | 57 (12.4%) |
| $2,500 to $4,999 | 0 (0.0%) | 32 (7.0%) |
| $5,000 to $7,499 | 0 (0.0%) | 11 (2.4%) |
| $7,500 to $9,999 | 15 (3.5%) | 12 (2.6%) |
| $10,000 to $12,499 | 60 (13.9%) | 36 (7.8%) |
| $12,500 to $14,999 | 7 (1.6%) | 20 (4.3%) |
| $15,000 to $17,499 | 15 (3.5%) | 0 (0.0%) |
| $17,500 to $19,999 | 17 (3.9%) | 9 (2.0%) |
| $20,000 to $22,499 | 0 (0.0%) | 52 (11.3%) |
| $22,500 to $24,999 | 0 (0.0%) | 6 (1.3%) |
| $25,000 to $29,999 | 45 (10.4%) | 13 (2.8%) |
| $30,000 to $34,999 | 20 (4.6%) | 38 (8.3%) |
| $35,000 to $39,999 | 19 (4.4%) | 8 (1.7%) |
| $40,000 to $44,999 | 25 (5.8%) | 46 (10.0%) |
| $45,000 to $49,999 | 0 (0.0%) | 35 (7.6%) |
| $50,000 to $54,999 | 18 (4.2%) | 0 (0.0%) |
| $55,000 to $64,999 | 34 (7.9%) | 16 (3.5%) |
| $65,000 to $74,999 | 31 (7.2%) | 23 (5.0%) |
| $75,000 to $99,999 | 19 (4.4%) | 38 (8.3%) |
| $100,000+ | 69 (16.0%) | 8 (1.7%) |
| Total | 432 (100.0%) | 460 (100.0%) |
Earnings by Sex by Educational Attainment in Brandon
Average earnings in Brandon are $40,850 for men and $23,125 for women, a difference of 43.4%. Men with an educational attainment of bachelor's degree enjoy the highest average annual earnings of $70,536, while those with high school diploma education earn the least with $26,389. Women with an educational attainment of graduate degree earn the most with the average annual earnings of $64,167, while those with high school diploma education have the smallest earnings of $40,833.
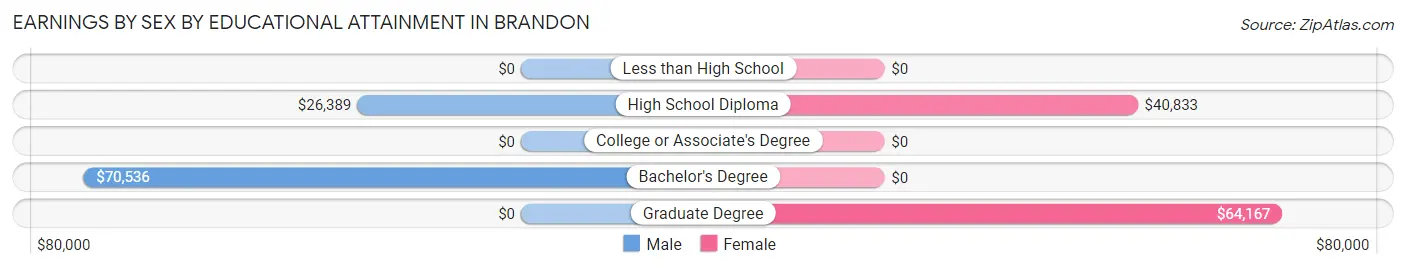
| Educational Attainment | Male Income | Female Income |
| Less than High School | - | - |
| High School Diploma | $26,389 | $40,833 |
| College or Associate's Degree | - | - |
| Bachelor's Degree | $70,536 | $0 |
| Graduate Degree | - | - |
| Total | $40,850 | $23,125 |
Family Income in Brandon
Family Income Brackets in Brandon
According to the Brandon family income data, there are 115 families falling into the $50,000 to $74,999 income range, which is the most common income bracket and makes up 24.1% of all families. Conversely, the $10,000 to $14,999 income bracket is the least frequent group with only 9 families (1.9%) belonging to this category.
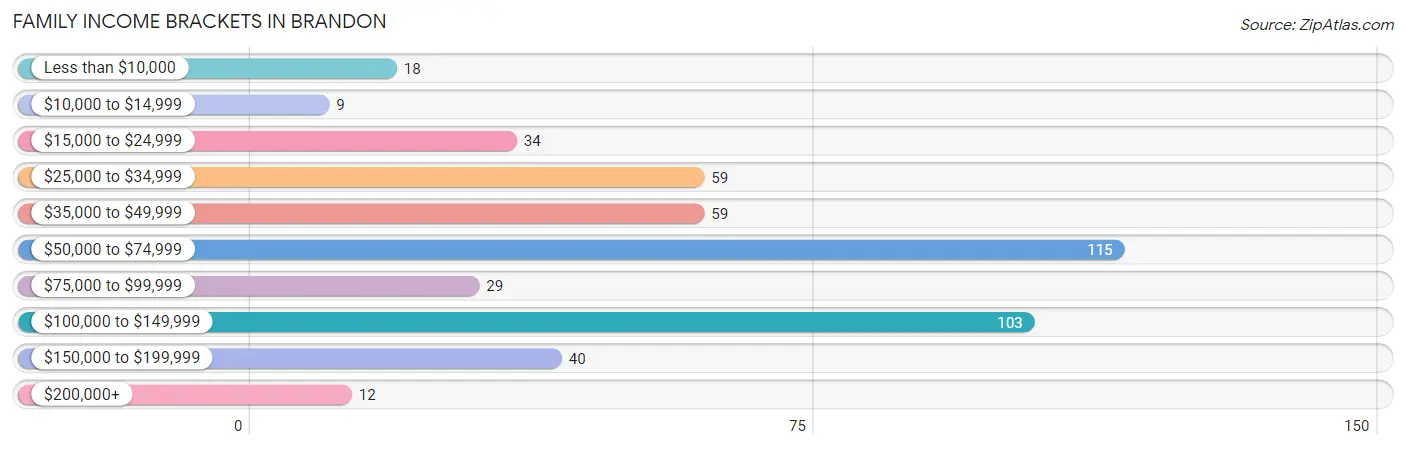
| Income Bracket | # Families | % Families |
| Less than $10,000 | 18 | 3.8% |
| $10,000 to $14,999 | 9 | 1.9% |
| $15,000 to $24,999 | 34 | 7.1% |
| $25,000 to $34,999 | 59 | 12.3% |
| $35,000 to $49,999 | 59 | 12.3% |
| $50,000 to $74,999 | 115 | 24.1% |
| $75,000 to $99,999 | 29 | 6.1% |
| $100,000 to $149,999 | 103 | 21.5% |
| $150,000 to $199,999 | 40 | 8.4% |
| $200,000+ | 12 | 2.5% |
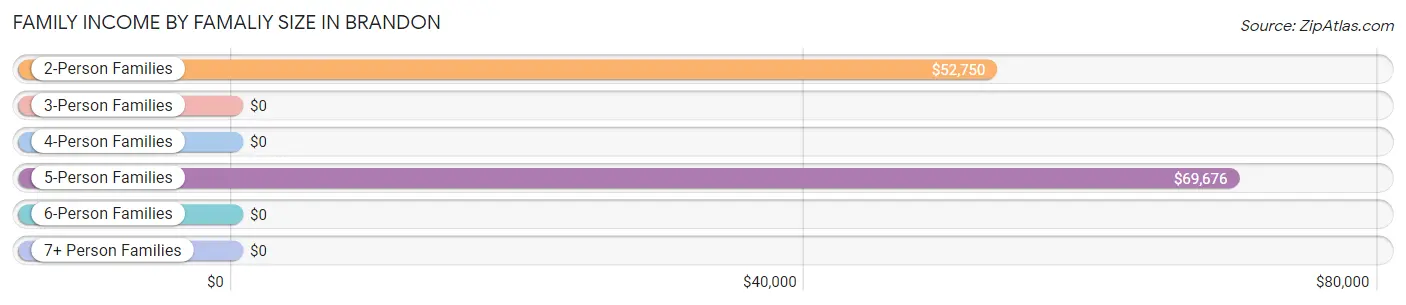
Family Income by Famaliy Size in Brandon
5-person families (47 | 9.8%) account for the highest median family income in Brandon with $69,676 per family, while 2-person families (299 | 62.5%) have the highest median income of $26,375 per family member.
| Income Bracket | # Families | Median Income |
| 2-Person Families | 299 (62.5%) | $52,750 |
| 3-Person Families | 37 (7.7%) | $0 |
| 4-Person Families | 59 (12.3%) | $0 |
| 5-Person Families | 47 (9.8%) | $69,676 |
| 6-Person Families | 11 (2.3%) | $0 |
| 7+ Person Families | 25 (5.2%) | $0 |
| Total | 478 (100.0%) | $65,625 |
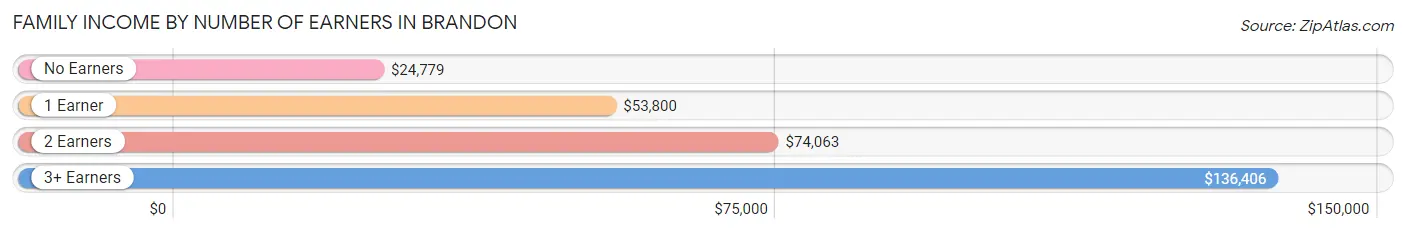
Family Income by Number of Earners in Brandon
The median family income in Brandon is $65,625, with families comprising 3+ earners (23) having the highest median family income of $136,406, while families with no earners (94) have the lowest median family income of $24,779, accounting for 4.8% and 19.7% of families, respectively.
| Number of Earners | # Families | Median Income |
| No Earners | 94 (19.7%) | $24,779 |
| 1 Earner | 192 (40.2%) | $53,800 |
| 2 Earners | 169 (35.4%) | $74,063 |
| 3+ Earners | 23 (4.8%) | $136,406 |
| Total | 478 (100.0%) | $65,625 |
Household Income in Brandon
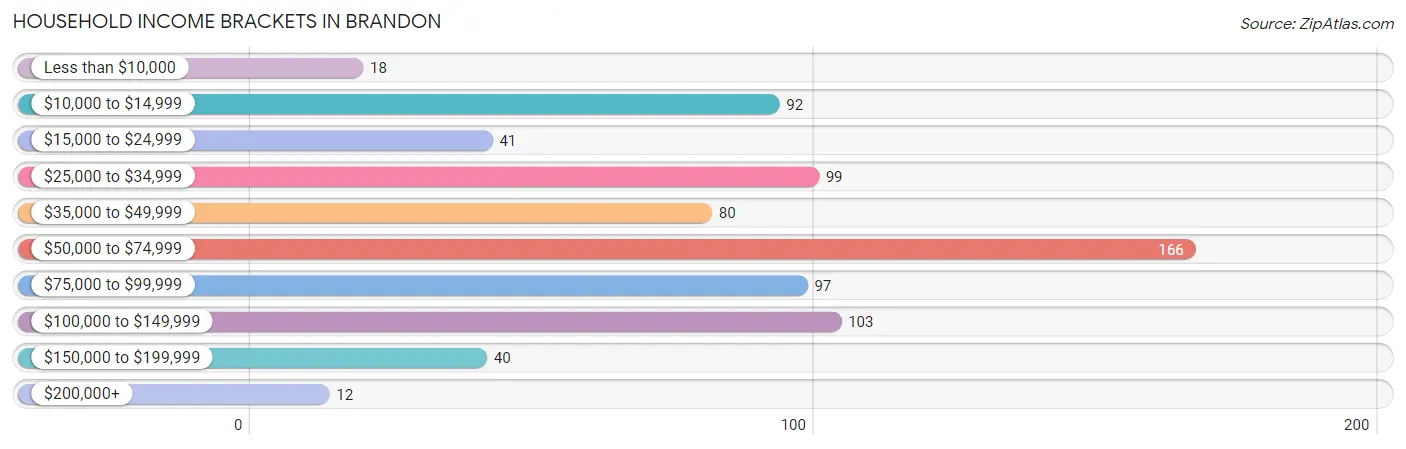
Household Income Brackets in Brandon
With 166 households falling in the category, the $50,000 to $74,999 income range is the most frequent in Brandon, accounting for 22.2% of all households. In contrast, only 12 households (1.6%) fall into the $200,000+ income bracket, making it the least populous group.
| Income Bracket | # Households | % Households |
| Less than $10,000 | 18 | 2.4% |
| $10,000 to $14,999 | 92 | 12.3% |
| $15,000 to $24,999 | 41 | 5.5% |
| $25,000 to $34,999 | 99 | 13.2% |
| $35,000 to $49,999 | 80 | 10.7% |
| $50,000 to $74,999 | 166 | 22.2% |
| $75,000 to $99,999 | 97 | 13.0% |
| $100,000 to $149,999 | 103 | 13.8% |
| $150,000 to $199,999 | 40 | 5.3% |
| $200,000+ | 12 | 1.6% |
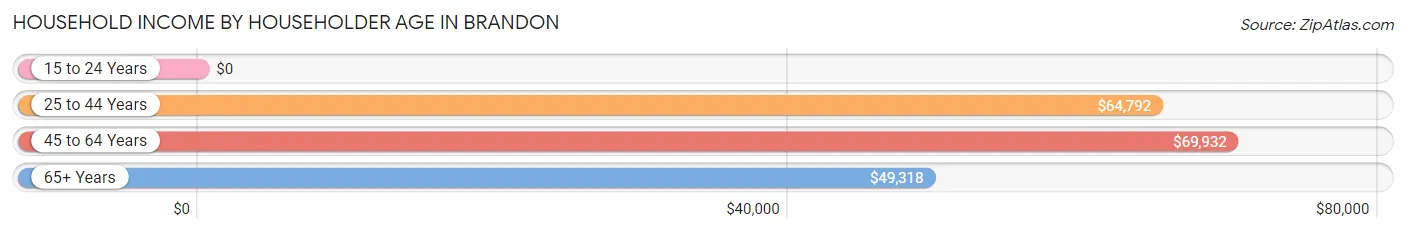
Household Income by Householder Age in Brandon
The median household income in Brandon is $54,700, with the highest median household income of $69,932 found in the 45 to 64 years age bracket for the primary householder. A total of 266 households (35.6%) fall into this category.
| Income Bracket | # Households | Median Income |
| 15 to 24 Years | 0 (0.0%) | $0 |
| 25 to 44 Years | 180 (24.1%) | $64,792 |
| 45 to 64 Years | 266 (35.6%) | $69,932 |
| 65+ Years | 302 (40.4%) | $49,318 |
| Total | 748 (100.0%) | $54,700 |
Poverty in Brandon
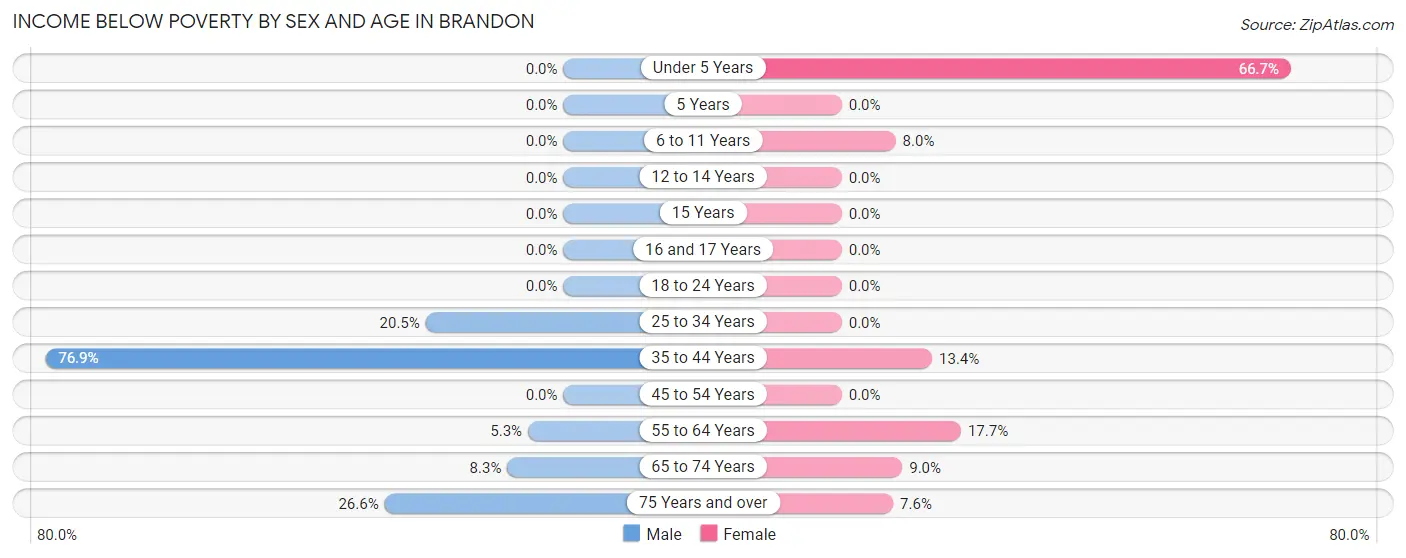
Income Below Poverty by Sex and Age in Brandon
With 14.3% poverty level for males and 8.2% for females among the residents of Brandon, 35 to 44 year old males and under 5 year old females are the most vulnerable to poverty, with 70 males (76.9%) and 24 females (66.7%) in their respective age groups living below the poverty level.
| Age Bracket | Male | Female |
| Under 5 Years | 0 (0.0%) | 24 (66.7%) |
| 5 Years | 0 (0.0%) | 0 (0.0%) |
| 6 to 11 Years | 0 (0.0%) | 8 (8.0%) |
| 12 to 14 Years | 0 (0.0%) | 0 (0.0%) |
| 15 Years | 0 (0.0%) | 0 (0.0%) |
| 16 and 17 Years | 0 (0.0%) | 0 (0.0%) |
| 18 to 24 Years | 0 (0.0%) | 0 (0.0%) |
| 25 to 34 Years | 9 (20.4%) | 0 (0.0%) |
| 35 to 44 Years | 70 (76.9%) | 11 (13.4%) |
| 45 to 54 Years | 0 (0.0%) | 0 (0.0%) |
| 55 to 64 Years | 7 (5.3%) | 20 (17.7%) |
| 65 to 74 Years | 11 (8.3%) | 15 (9.0%) |
| 75 Years and over | 17 (26.6%) | 9 (7.6%) |
| Total | 114 (14.3%) | 87 (8.2%) |
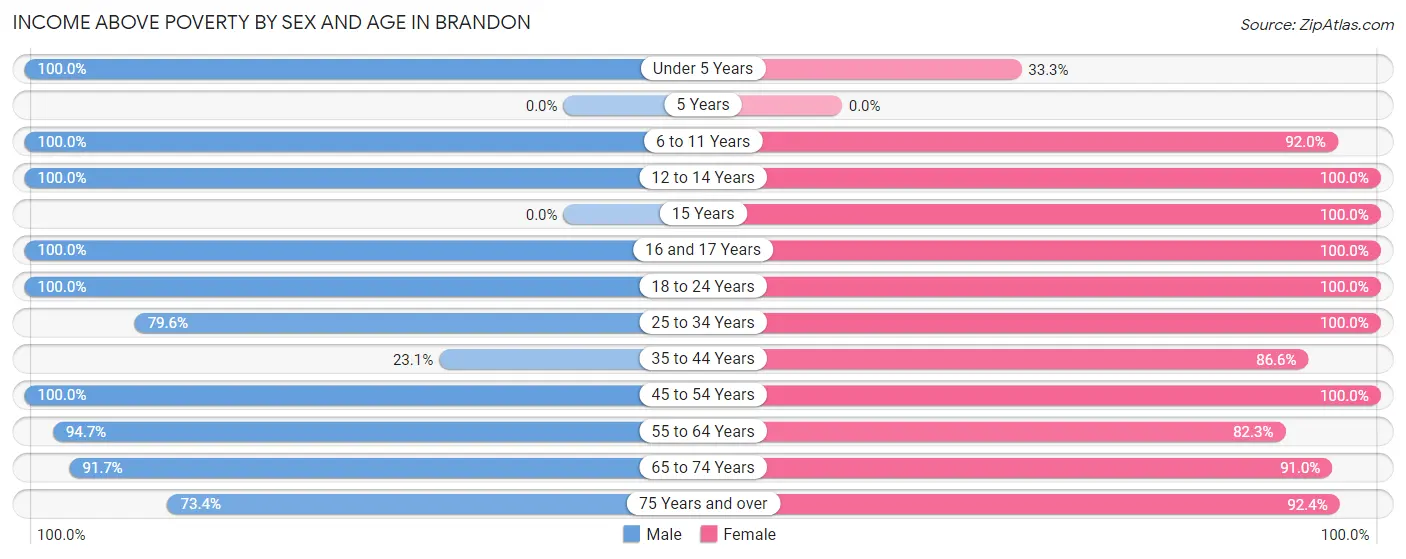
Income Above Poverty by Sex and Age in Brandon
According to the poverty statistics in Brandon, males aged under 5 years and females aged 12 to 14 years are the age groups that are most secure financially, with 100.0% of males and 100.0% of females in these age groups living above the poverty line.
| Age Bracket | Male | Female |
| Under 5 Years | 14 (100.0%) | 12 (33.3%) |
| 5 Years | 0 (0.0%) | 0 (0.0%) |
| 6 to 11 Years | 47 (100.0%) | 92 (92.0%) |
| 12 to 14 Years | 53 (100.0%) | 123 (100.0%) |
| 15 Years | 0 (0.0%) | 21 (100.0%) |
| 16 and 17 Years | 71 (100.0%) | 26 (100.0%) |
| 18 to 24 Years | 47 (100.0%) | 60 (100.0%) |
| 25 to 34 Years | 35 (79.5%) | 54 (100.0%) |
| 35 to 44 Years | 21 (23.1%) | 71 (86.6%) |
| 45 to 54 Years | 99 (100.0%) | 156 (100.0%) |
| 55 to 64 Years | 126 (94.7%) | 93 (82.3%) |
| 65 to 74 Years | 121 (91.7%) | 152 (91.0%) |
| 75 Years and over | 47 (73.4%) | 109 (92.4%) |
| Total | 681 (85.7%) | 969 (91.8%) |
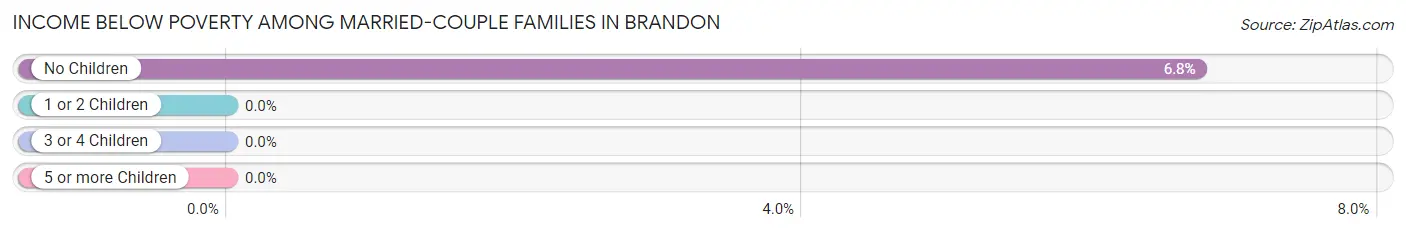
Income Below Poverty Among Married-Couple Families in Brandon
The poverty statistics for married-couple families in Brandon show that 4.3% or 16 of the total 370 families live below the poverty line. Families with no children have the highest poverty rate of 6.8%, comprising of 16 families. On the other hand, families with 1 or 2 children have the lowest poverty rate of 0.0%, which includes 0 families.
| Children | Above Poverty | Below Poverty |
| No Children | 221 (93.2%) | 16 (6.8%) |
| 1 or 2 Children | 58 (100.0%) | 0 (0.0%) |
| 3 or 4 Children | 75 (100.0%) | 0 (0.0%) |
| 5 or more Children | 0 (0.0%) | 0 (0.0%) |
| Total | 354 (95.7%) | 16 (4.3%) |
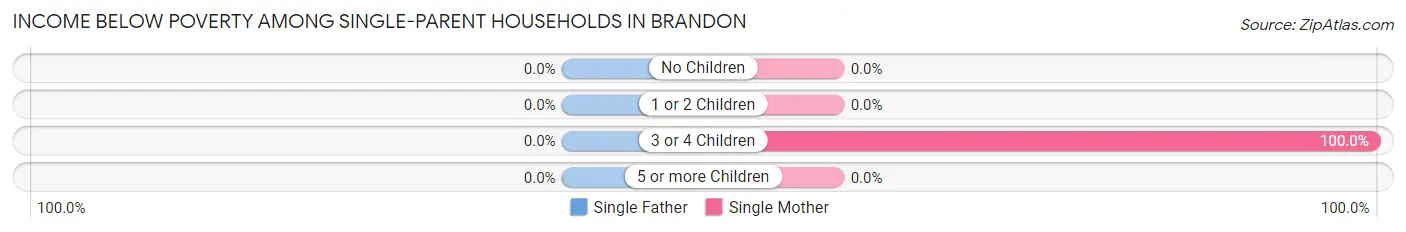
Income Below Poverty Among Single-Parent Households in Brandon
| Children | Single Father | Single Mother |
| No Children | 0 (0.0%) | 0 (0.0%) |
| 1 or 2 Children | 0 (0.0%) | 0 (0.0%) |
| 3 or 4 Children | 0 (0.0%) | 11 (100.0%) |
| 5 or more Children | 0 (0.0%) | 0 (0.0%) |
| Total | 0 (0.0%) | 11 (10.2%) |
Income Below Poverty Among Married-Couple vs Single-Parent Households in Brandon
The poverty data for Brandon shows that 16 of the married-couple family households (4.3%) and 11 of the single-parent households (10.2%) are living below the poverty level. Within the married-couple family households, those with no children have the highest poverty rate, with 16 households (6.8%) falling below the poverty line. Among the single-parent households, those with 3 or 4 children have the highest poverty rate, with 11 household (100.0%) living below poverty.
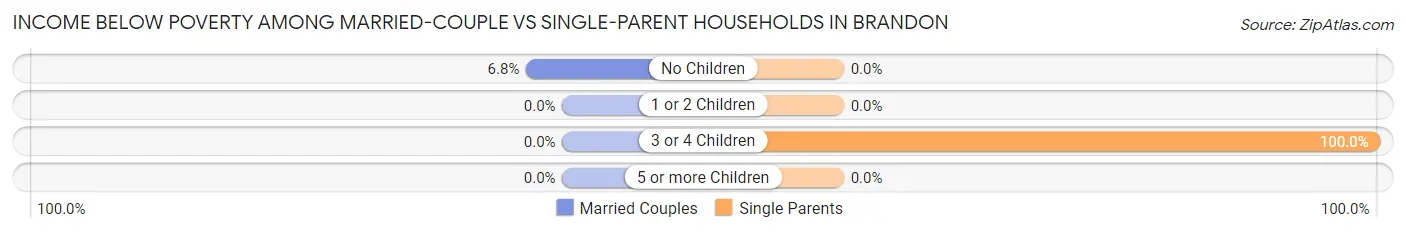
| Children | Married-Couple Families | Single-Parent Households |
| No Children | 16 (6.8%) | 0 (0.0%) |
| 1 or 2 Children | 0 (0.0%) | 0 (0.0%) |
| 3 or 4 Children | 0 (0.0%) | 11 (100.0%) |
| 5 or more Children | 0 (0.0%) | 0 (0.0%) |
| Total | 16 (4.3%) | 11 (10.2%) |
Employment Characteristics in Brandon
Employment by Class of Employer in Brandon
Among the 829 employed individuals in Brandon, private company employees (450 | 54.3%), not-for-profit organizations (192 | 23.2%), and self-employed (not incorporated) (94 | 11.3%) make up the most common classes of employment.
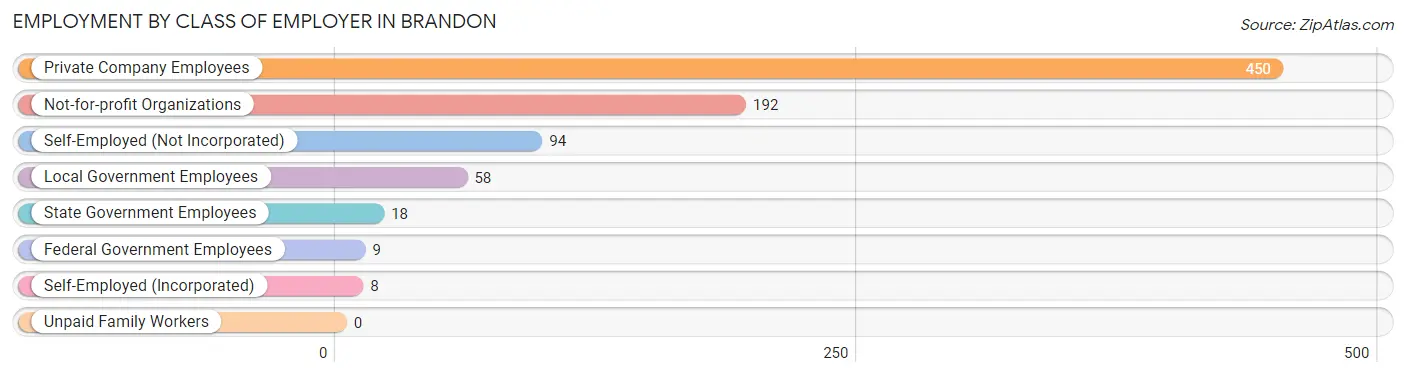
| Employer Class | # Employees | % Employees |
| Private Company Employees | 450 | 54.3% |
| Self-Employed (Incorporated) | 8 | 1.0% |
| Self-Employed (Not Incorporated) | 94 | 11.3% |
| Not-for-profit Organizations | 192 | 23.2% |
| Local Government Employees | 58 | 7.0% |
| State Government Employees | 18 | 2.2% |
| Federal Government Employees | 9 | 1.1% |
| Unpaid Family Workers | 0 | 0.0% |
| Total | 829 | 100.0% |
Employment Status by Age in Brandon
According to the labor force statistics for Brandon, out of the total population over 16 years of age (1,464), 57.9% or 848 individuals are in the labor force, with 1.3% or 11 of them unemployed. The age group with the highest labor force participation rate is 20 to 24 years, with 100.0% or 33 individuals in the labor force. Within the labor force, the 45 to 54 years age range has the highest percentage of unemployed individuals, with 4.7% or 11 of them being unemployed.
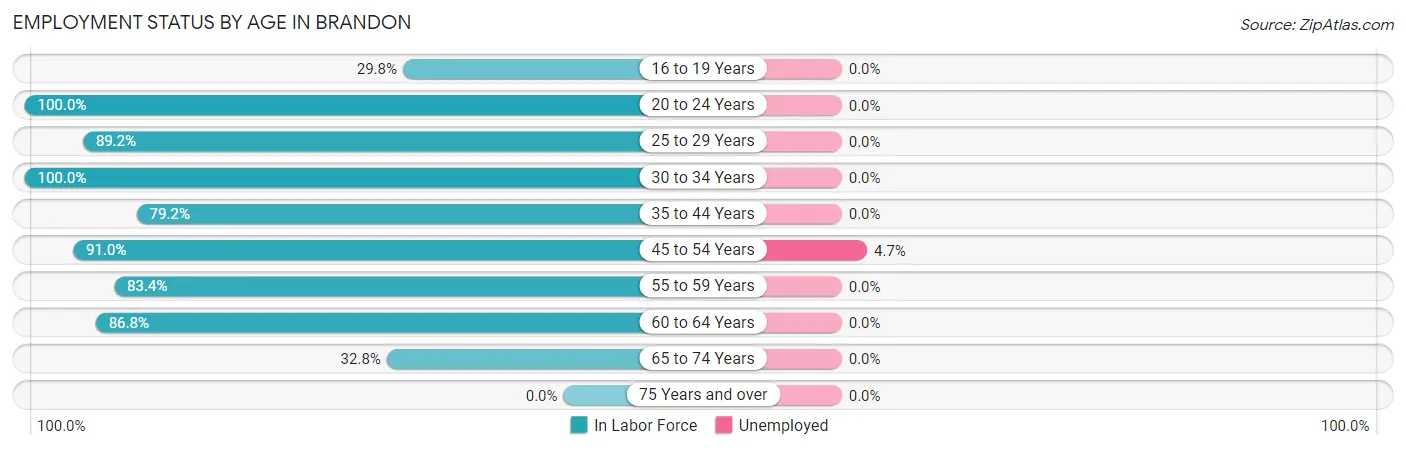
| Age Bracket | In Labor Force | Unemployed |
| 16 to 19 Years | 51 (29.8%) | 0 (0.0%) |
| 20 to 24 Years | 33 (100.0%) | 0 (0.0%) |
| 25 to 29 Years | 74 (89.2%) | 0 (0.0%) |
| 30 to 34 Years | 15 (100.0%) | 0 (0.0%) |
| 35 to 44 Years | 137 (79.2%) | 0 (0.0%) |
| 45 to 54 Years | 232 (91.0%) | 11 (4.7%) |
| 55 to 59 Years | 161 (83.4%) | 0 (0.0%) |
| 60 to 64 Years | 46 (86.8%) | 0 (0.0%) |
| 65 to 74 Years | 98 (32.8%) | 0 (0.0%) |
| 75 Years and over | 0 (0.0%) | 0 (0.0%) |
| Total | 848 (57.9%) | 11 (1.3%) |
Employment Status by Educational Attainment in Brandon
According to labor force statistics for Brandon, 86.1% of individuals (665) out of the total population between 25 and 64 years of age (772) are in the labor force, with 1.7% or 11 of them being unemployed. The group with the highest labor force participation rate are those with the educational attainment of bachelor's degree or higher, with 96.2% or 177 individuals in the labor force. Within the labor force, individuals with bachelor's degree or higher education have the highest percentage of unemployment, with 6.2% or 11 of them being unemployed.
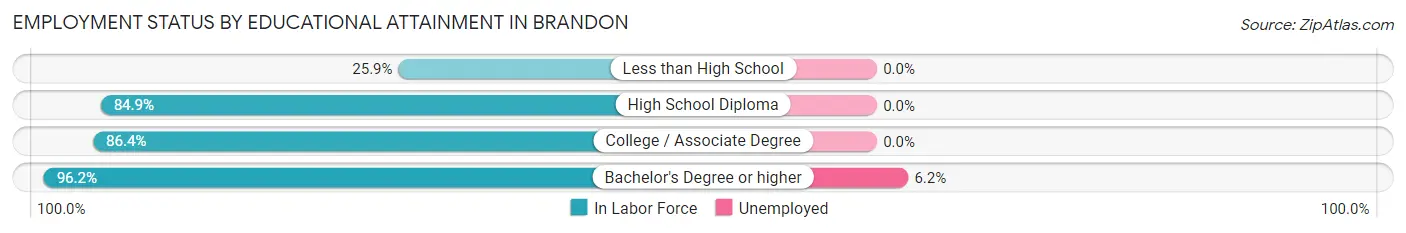
| Educational Attainment | In Labor Force | Unemployed |
| Less than High School | 7 (25.9%) | 0 (0.0%) |
| High School Diploma | 214 (84.9%) | 0 (0.0%) |
| College / Associate Degree | 267 (86.4%) | 0 (0.0%) |
| Bachelor's Degree or higher | 177 (96.2%) | 11 (6.2%) |
| Total | 665 (86.1%) | 13 (1.7%) |
Employment Occupations by Sex in Brandon
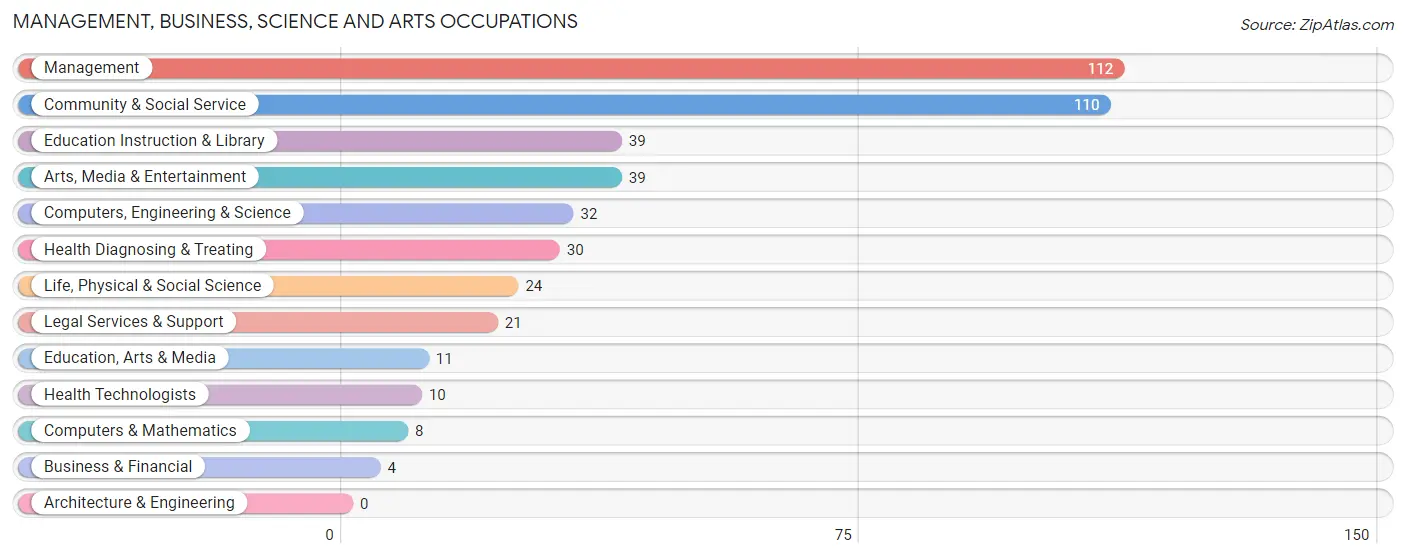
Management, Business, Science and Arts Occupations
The most common Management, Business, Science and Arts occupations in Brandon are Management (112 | 13.4%), Community & Social Service (110 | 13.2%), Education Instruction & Library (39 | 4.7%), Arts, Media & Entertainment (39 | 4.7%), and Computers, Engineering & Science (32 | 3.8%).
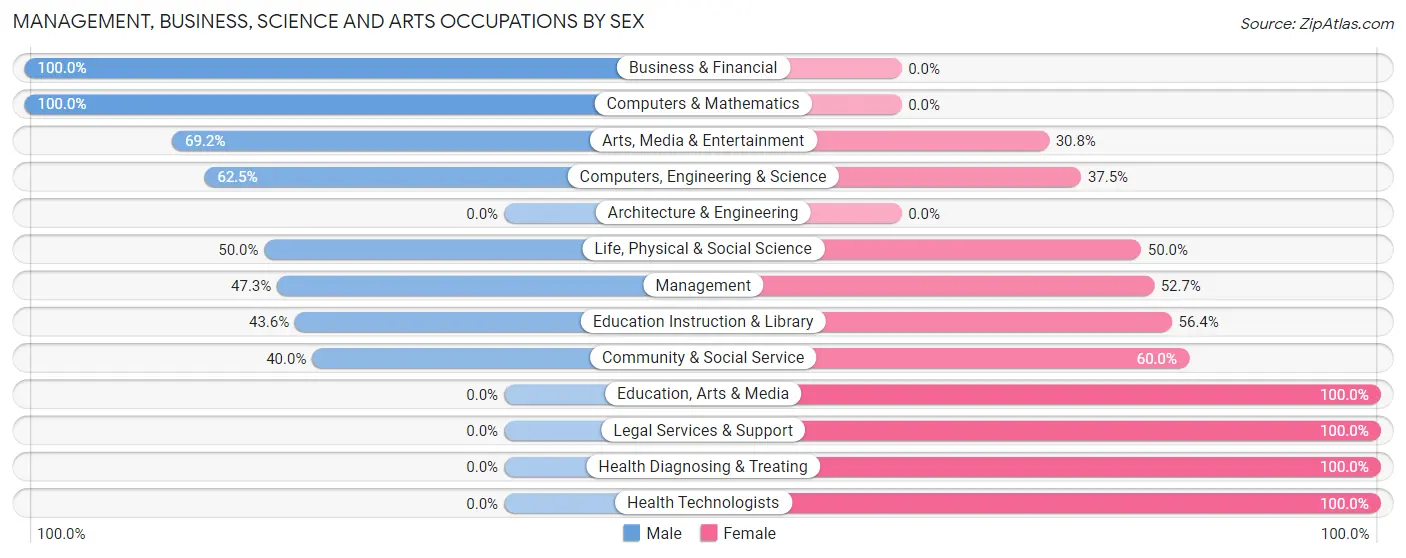
Management, Business, Science and Arts Occupations by Sex
Within the Management, Business, Science and Arts occupations in Brandon, the most male-oriented occupations are Business & Financial (100.0%), Computers & Mathematics (100.0%), and Arts, Media & Entertainment (69.2%), while the most female-oriented occupations are Education, Arts & Media (100.0%), Legal Services & Support (100.0%), and Health Diagnosing & Treating (100.0%).
| Occupation | Male | Female |
| Management | 53 (47.3%) | 59 (52.7%) |
| Business & Financial | 4 (100.0%) | 0 (0.0%) |
| Computers, Engineering & Science | 20 (62.5%) | 12 (37.5%) |
| Computers & Mathematics | 8 (100.0%) | 0 (0.0%) |
| Architecture & Engineering | 0 (0.0%) | 0 (0.0%) |
| Life, Physical & Social Science | 12 (50.0%) | 12 (50.0%) |
| Community & Social Service | 44 (40.0%) | 66 (60.0%) |
| Education, Arts & Media | 0 (0.0%) | 11 (100.0%) |
| Legal Services & Support | 0 (0.0%) | 21 (100.0%) |
| Education Instruction & Library | 17 (43.6%) | 22 (56.4%) |
| Arts, Media & Entertainment | 27 (69.2%) | 12 (30.8%) |
| Health Diagnosing & Treating | 0 (0.0%) | 30 (100.0%) |
| Health Technologists | 0 (0.0%) | 10 (100.0%) |
| Total (Category) | 121 (42.0%) | 167 (58.0%) |
| Total (Overall) | 403 (48.2%) | 433 (51.8%) |
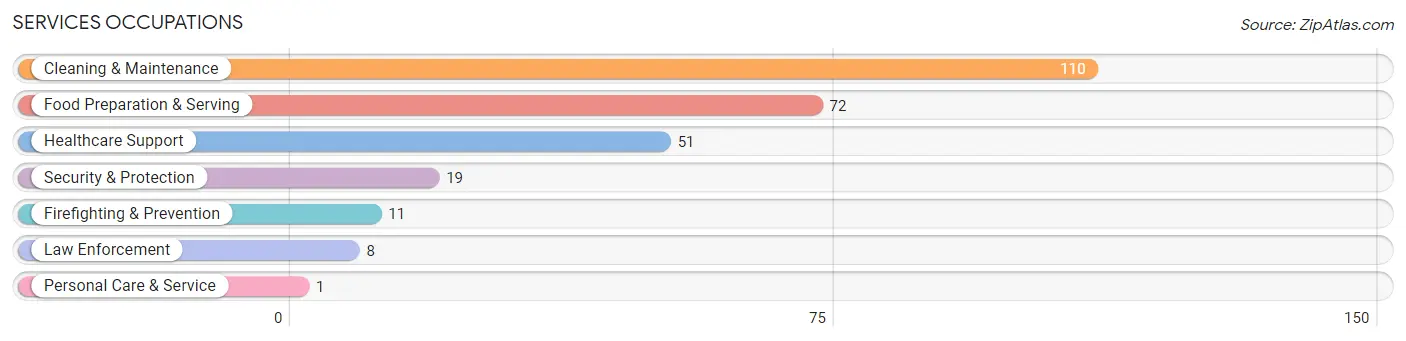
Services Occupations
The most common Services occupations in Brandon are Cleaning & Maintenance (110 | 13.2%), Food Preparation & Serving (72 | 8.6%), Healthcare Support (51 | 6.1%), Security & Protection (19 | 2.3%), and Firefighting & Prevention (11 | 1.3%).
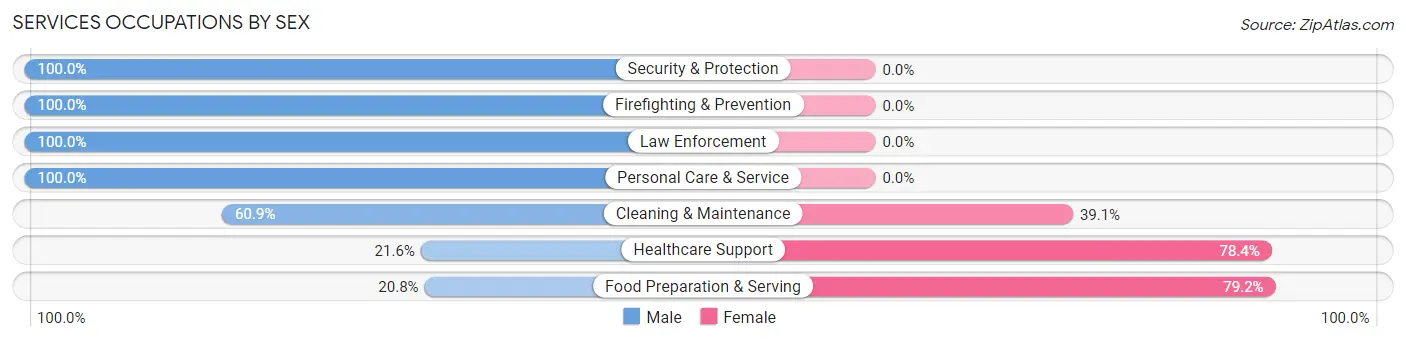
Services Occupations by Sex
Within the Services occupations in Brandon, the most male-oriented occupations are Security & Protection (100.0%), Firefighting & Prevention (100.0%), and Law Enforcement (100.0%), while the most female-oriented occupations are Food Preparation & Serving (79.2%), Healthcare Support (78.4%), and Cleaning & Maintenance (39.1%).
| Occupation | Male | Female |
| Healthcare Support | 11 (21.6%) | 40 (78.4%) |
| Security & Protection | 19 (100.0%) | 0 (0.0%) |
| Firefighting & Prevention | 11 (100.0%) | 0 (0.0%) |
| Law Enforcement | 8 (100.0%) | 0 (0.0%) |
| Food Preparation & Serving | 15 (20.8%) | 57 (79.2%) |
| Cleaning & Maintenance | 67 (60.9%) | 43 (39.1%) |
| Personal Care & Service | 1 (100.0%) | 0 (0.0%) |
| Total (Category) | 113 (44.7%) | 140 (55.3%) |
| Total (Overall) | 403 (48.2%) | 433 (51.8%) |
Sales and Office Occupations
The most common Sales and Office occupations in Brandon are Sales & Related (104 | 12.4%), and Office & Administration (69 | 8.3%).
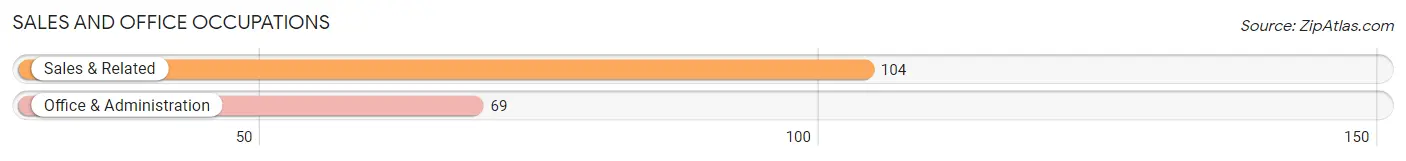
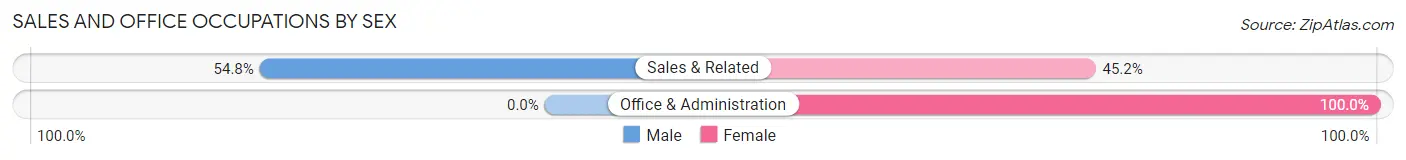
Sales and Office Occupations by Sex
| Occupation | Male | Female |
| Sales & Related | 57 (54.8%) | 47 (45.2%) |
| Office & Administration | 0 (0.0%) | 69 (100.0%) |
| Total (Category) | 57 (33.0%) | 116 (67.0%) |
| Total (Overall) | 403 (48.2%) | 433 (51.8%) |
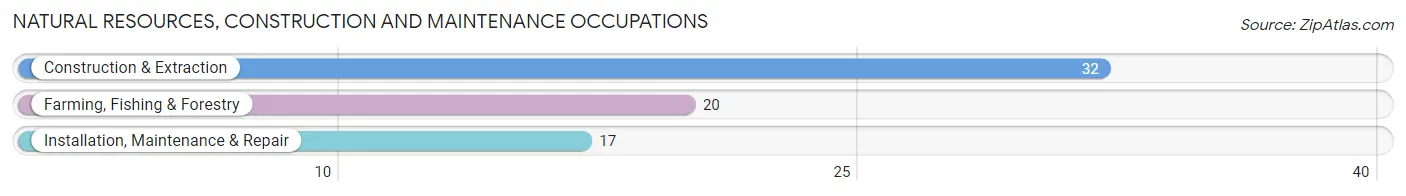
Natural Resources, Construction and Maintenance Occupations
The most common Natural Resources, Construction and Maintenance occupations in Brandon are Construction & Extraction (32 | 3.8%), Farming, Fishing & Forestry (20 | 2.4%), and Installation, Maintenance & Repair (17 | 2.0%).
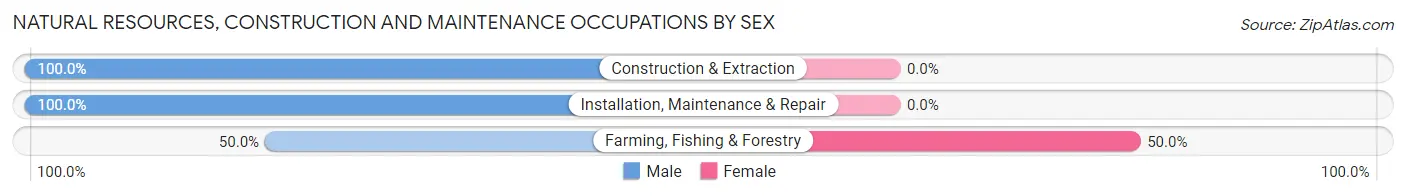
Natural Resources, Construction and Maintenance Occupations by Sex
| Occupation | Male | Female |
| Farming, Fishing & Forestry | 10 (50.0%) | 10 (50.0%) |
| Construction & Extraction | 32 (100.0%) | 0 (0.0%) |
| Installation, Maintenance & Repair | 17 (100.0%) | 0 (0.0%) |
| Total (Category) | 59 (85.5%) | 10 (14.5%) |
| Total (Overall) | 403 (48.2%) | 433 (51.8%) |
Production, Transportation and Moving Occupations
The most common Production, Transportation and Moving occupations in Brandon are Production (33 | 4.0%), and Transportation (20 | 2.4%).
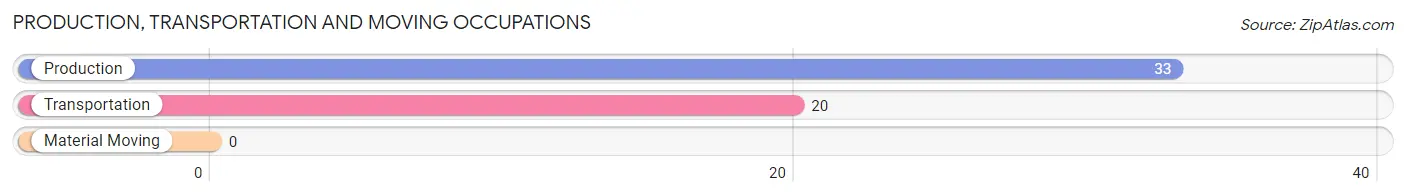
Production, Transportation and Moving Occupations by Sex
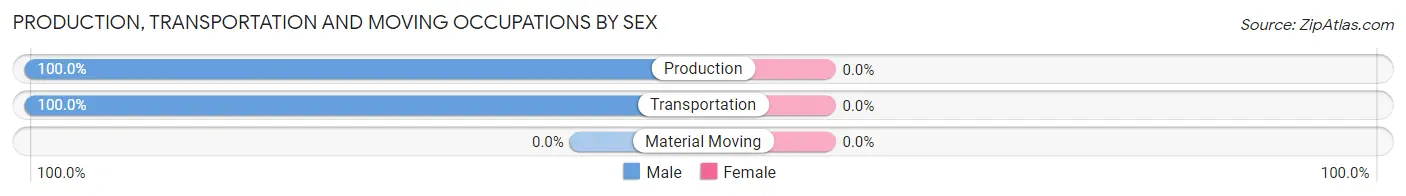
| Occupation | Male | Female |
| Production | 33 (100.0%) | 0 (0.0%) |
| Transportation | 20 (100.0%) | 0 (0.0%) |
| Material Moving | 0 (0.0%) | 0 (0.0%) |
| Total (Category) | 53 (100.0%) | 0 (0.0%) |
| Total (Overall) | 403 (48.2%) | 433 (51.8%) |
Employment Industries by Sex in Brandon
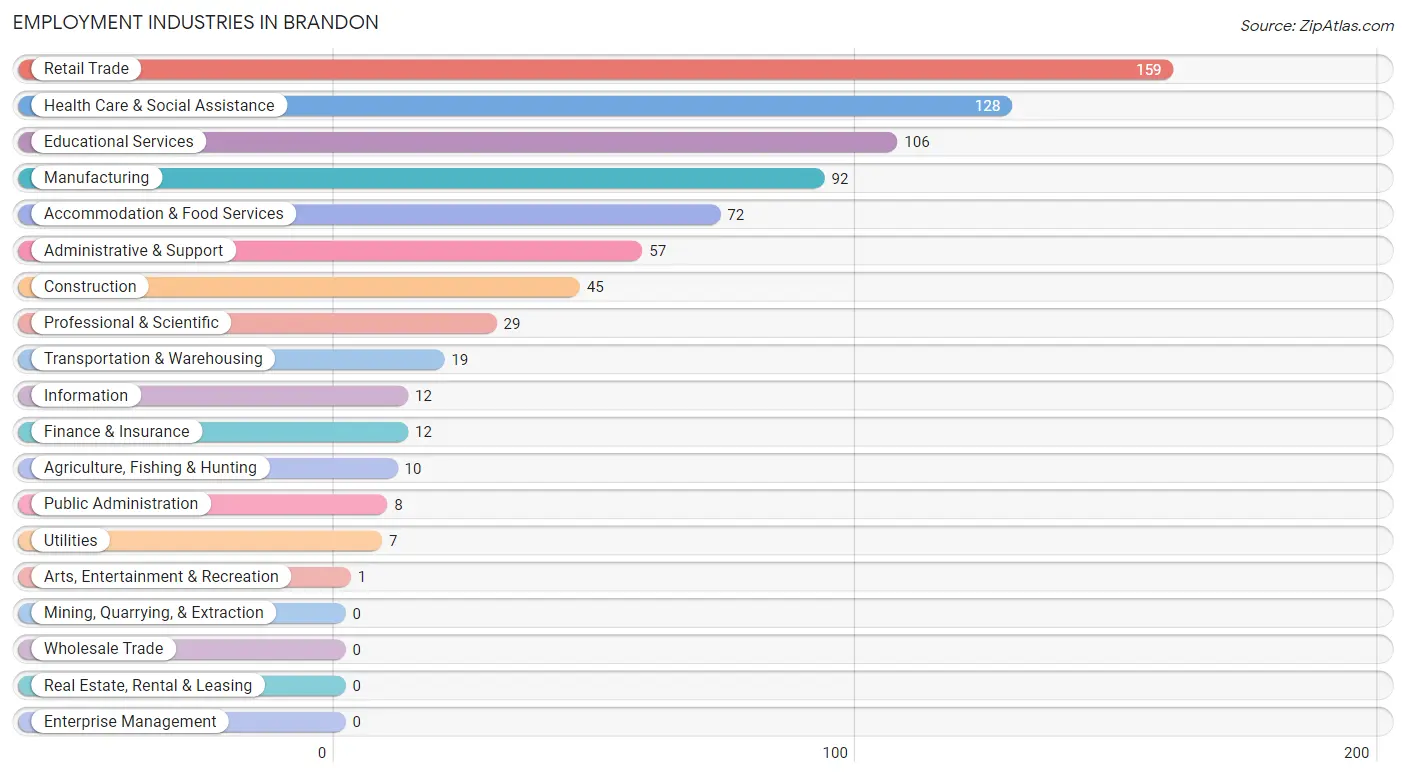
Employment Industries in Brandon
The major employment industries in Brandon include Retail Trade (159 | 19.0%), Health Care & Social Assistance (128 | 15.3%), Educational Services (106 | 12.7%), Manufacturing (92 | 11.0%), and Accommodation & Food Services (72 | 8.6%).
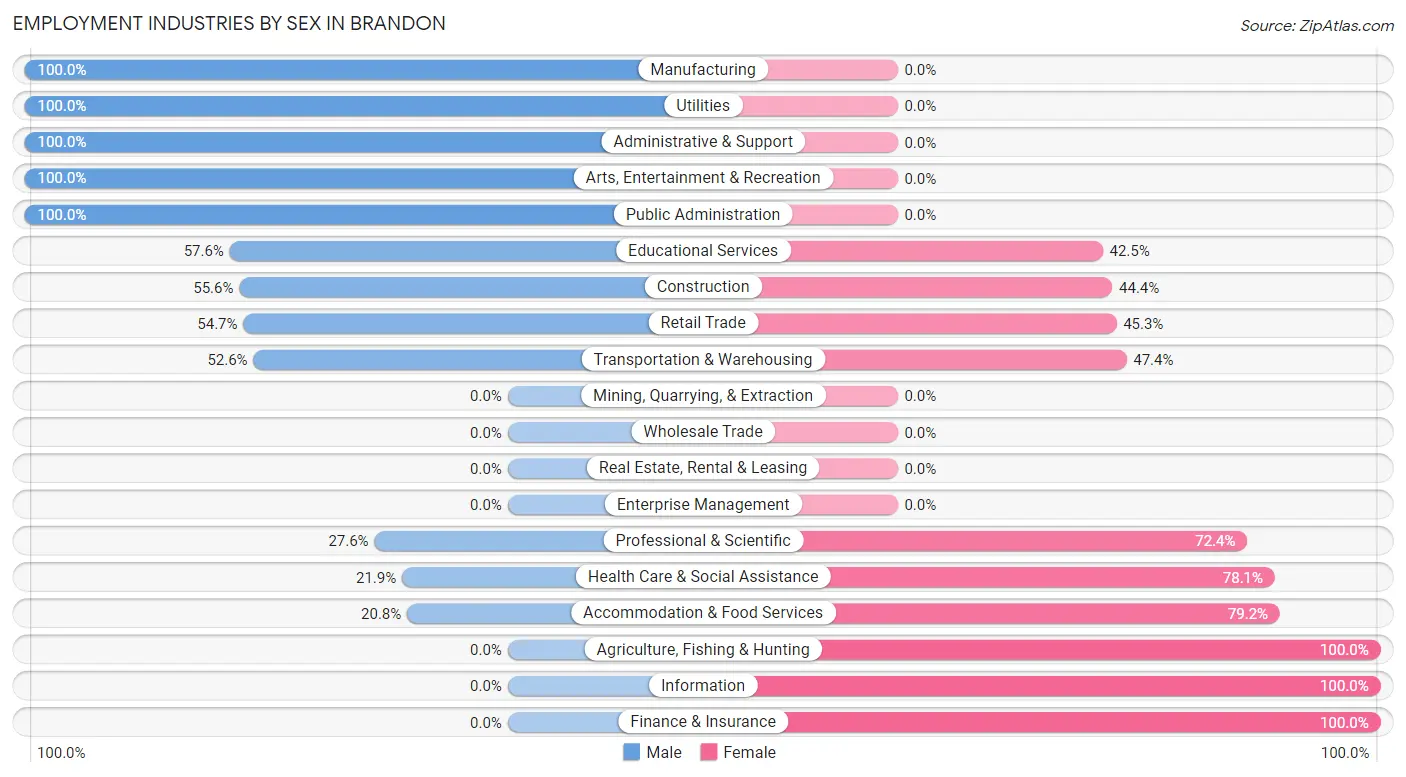
Employment Industries by Sex in Brandon
The Brandon industries that see more men than women are Manufacturing (100.0%), Utilities (100.0%), and Administrative & Support (100.0%), whereas the industries that tend to have a higher number of women are Agriculture, Fishing & Hunting (100.0%), Information (100.0%), and Finance & Insurance (100.0%).
| Industry | Male | Female |
| Agriculture, Fishing & Hunting | 0 (0.0%) | 10 (100.0%) |
| Mining, Quarrying, & Extraction | 0 (0.0%) | 0 (0.0%) |
| Construction | 25 (55.6%) | 20 (44.4%) |
| Manufacturing | 92 (100.0%) | 0 (0.0%) |
| Wholesale Trade | 0 (0.0%) | 0 (0.0%) |
| Retail Trade | 87 (54.7%) | 72 (45.3%) |
| Transportation & Warehousing | 10 (52.6%) | 9 (47.4%) |
| Utilities | 7 (100.0%) | 0 (0.0%) |
| Information | 0 (0.0%) | 12 (100.0%) |
| Finance & Insurance | 0 (0.0%) | 12 (100.0%) |
| Real Estate, Rental & Leasing | 0 (0.0%) | 0 (0.0%) |
| Professional & Scientific | 8 (27.6%) | 21 (72.4%) |
| Enterprise Management | 0 (0.0%) | 0 (0.0%) |
| Administrative & Support | 57 (100.0%) | 0 (0.0%) |
| Educational Services | 61 (57.6%) | 45 (42.4%) |
| Health Care & Social Assistance | 28 (21.9%) | 100 (78.1%) |
| Arts, Entertainment & Recreation | 1 (100.0%) | 0 (0.0%) |
| Accommodation & Food Services | 15 (20.8%) | 57 (79.2%) |
| Public Administration | 8 (100.0%) | 0 (0.0%) |
| Total | 403 (48.2%) | 433 (51.8%) |
Education in Brandon
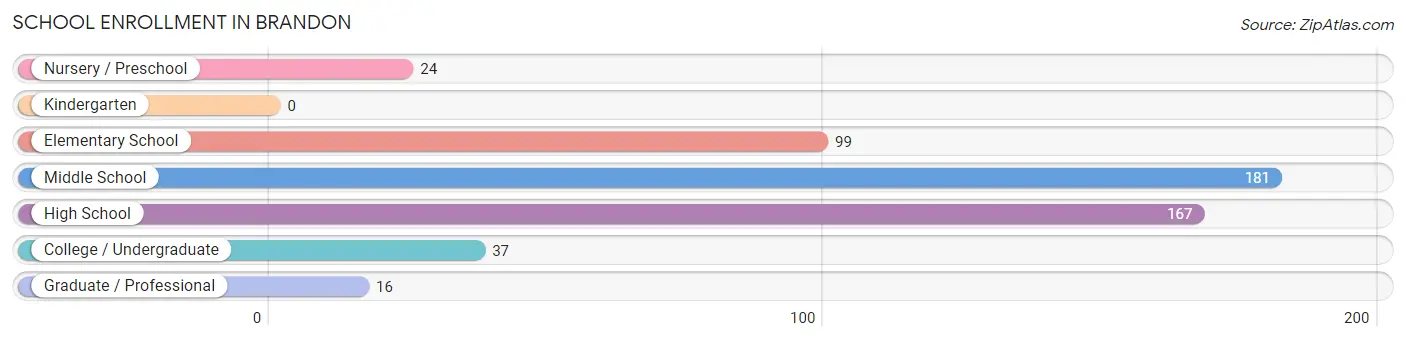
School Enrollment in Brandon
The most common levels of schooling among the 524 students in Brandon are middle school (181 | 34.5%), high school (167 | 31.9%), and elementary school (99 | 18.9%).
| School Level | # Students | % Students |
| Nursery / Preschool | 24 | 4.6% |
| Kindergarten | 0 | 0.0% |
| Elementary School | 99 | 18.9% |
| Middle School | 181 | 34.5% |
| High School | 167 | 31.9% |
| College / Undergraduate | 37 | 7.1% |
| Graduate / Professional | 16 | 3.0% |
| Total | 524 | 100.0% |
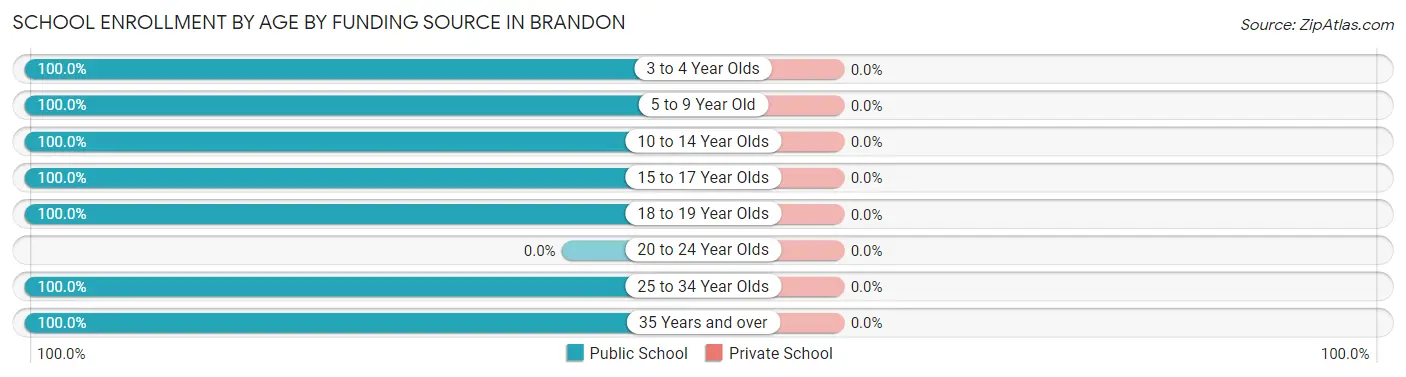
School Enrollment by Age by Funding Source in Brandon
| Age Bracket | Public School | Private School |
| 3 to 4 Year Olds | 24 (100.0%) | 0 (0.0%) |
| 5 to 9 Year Old | 78 (100.0%) | 0 (0.0%) |
| 10 to 14 Year Olds | 232 (100.0%) | 0 (0.0%) |
| 15 to 17 Year Olds | 118 (100.0%) | 0 (0.0%) |
| 18 to 19 Year Olds | 34 (100.0%) | 0 (0.0%) |
| 20 to 24 Year Olds | 0 (0.0%) | 0 (0.0%) |
| 25 to 34 Year Olds | 12 (100.0%) | 0 (0.0%) |
| 35 Years and over | 26 (100.0%) | 0 (0.0%) |
| Total | 524 (100.0%) | 0 (0.0%) |
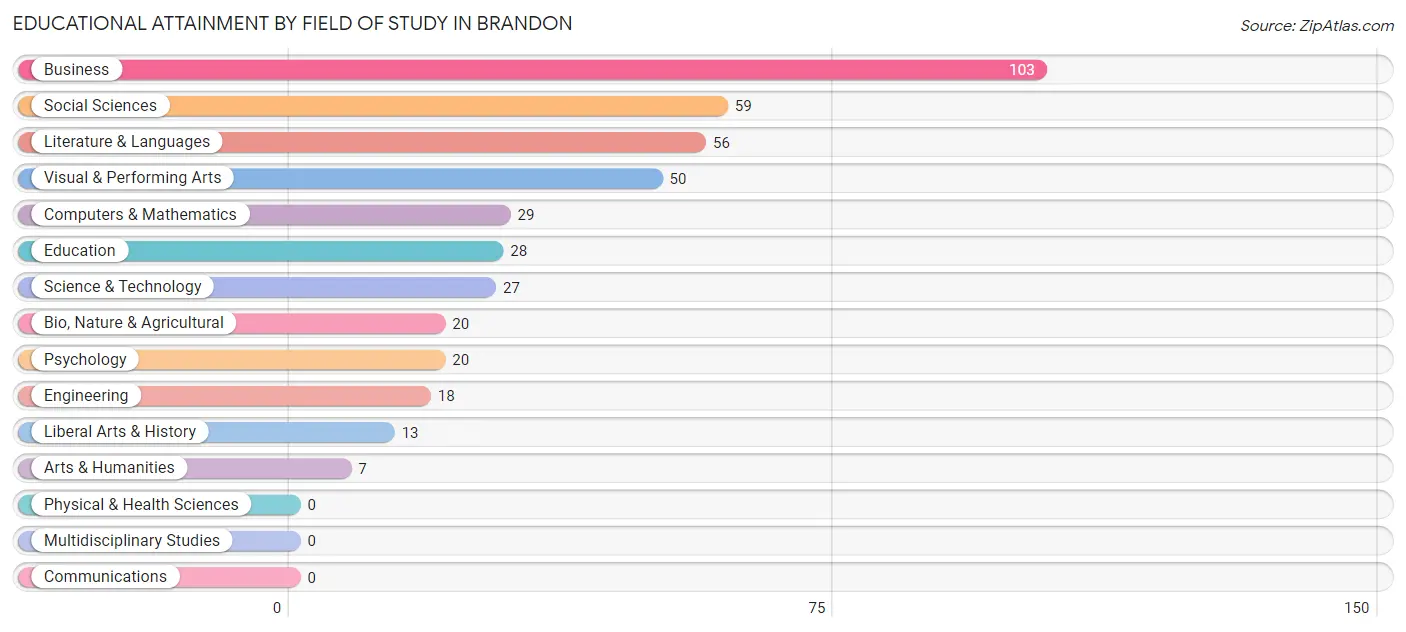
Educational Attainment by Field of Study in Brandon
Business (103 | 23.9%), social sciences (59 | 13.7%), literature & languages (56 | 13.0%), visual & performing arts (50 | 11.6%), and computers & mathematics (29 | 6.7%) are the most common fields of study among 430 individuals in Brandon who have obtained a bachelor's degree or higher.
| Field of Study | # Graduates | % Graduates |
| Computers & Mathematics | 29 | 6.7% |
| Bio, Nature & Agricultural | 20 | 4.6% |
| Physical & Health Sciences | 0 | 0.0% |
| Psychology | 20 | 4.6% |
| Social Sciences | 59 | 13.7% |
| Engineering | 18 | 4.2% |
| Multidisciplinary Studies | 0 | 0.0% |
| Science & Technology | 27 | 6.3% |
| Business | 103 | 23.9% |
| Education | 28 | 6.5% |
| Literature & Languages | 56 | 13.0% |
| Liberal Arts & History | 13 | 3.0% |
| Visual & Performing Arts | 50 | 11.6% |
| Communications | 0 | 0.0% |
| Arts & Humanities | 7 | 1.6% |
| Total | 430 | 100.0% |
Transportation & Commute in Brandon
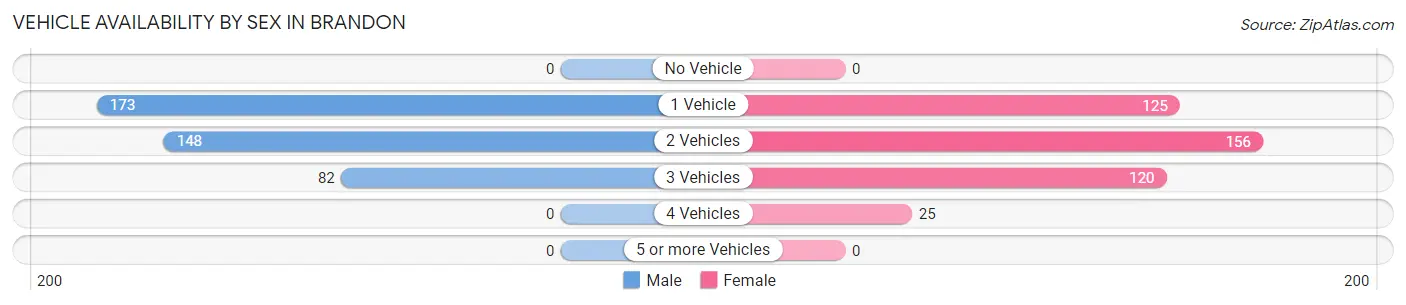
Vehicle Availability by Sex in Brandon
The most prevalent vehicle ownership categories in Brandon are males with 1 vehicle (173, accounting for 42.9%) and females with 1 vehicle (125, making up 40.6%).
| Vehicles Available | Male | Female |
| No Vehicle | 0 (0.0%) | 0 (0.0%) |
| 1 Vehicle | 173 (42.9%) | 125 (29.3%) |
| 2 Vehicles | 148 (36.7%) | 156 (36.6%) |
| 3 Vehicles | 82 (20.3%) | 120 (28.2%) |
| 4 Vehicles | 0 (0.0%) | 25 (5.9%) |
| 5 or more Vehicles | 0 (0.0%) | 0 (0.0%) |
| Total | 403 (100.0%) | 426 (100.0%) |
Commute Time in Brandon
The most frequently occuring commute durations in Brandon are 20 to 24 minutes (167 commuters, 24.2%), 30 to 34 minutes (116 commuters, 16.8%), and 15 to 19 minutes (97 commuters, 14.0%).
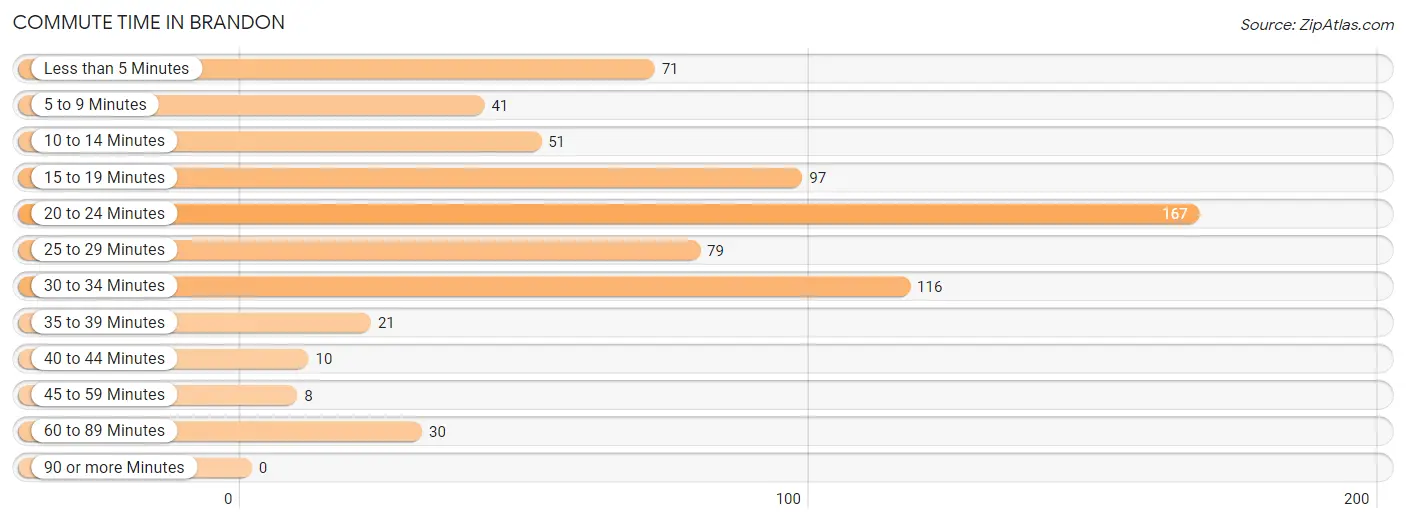
| Commute Time | # Commuters | % Commuters |
| Less than 5 Minutes | 71 | 10.3% |
| 5 to 9 Minutes | 41 | 5.9% |
| 10 to 14 Minutes | 51 | 7.4% |
| 15 to 19 Minutes | 97 | 14.0% |
| 20 to 24 Minutes | 167 | 24.2% |
| 25 to 29 Minutes | 79 | 11.4% |
| 30 to 34 Minutes | 116 | 16.8% |
| 35 to 39 Minutes | 21 | 3.0% |
| 40 to 44 Minutes | 10 | 1.5% |
| 45 to 59 Minutes | 8 | 1.2% |
| 60 to 89 Minutes | 30 | 4.3% |
| 90 or more Minutes | 0 | 0.0% |
Commute Time by Sex in Brandon
The most common commute times in Brandon are 20 to 24 minutes (97 commuters, 30.2%) for males and 30 to 34 minutes (76 commuters, 20.5%) for females.
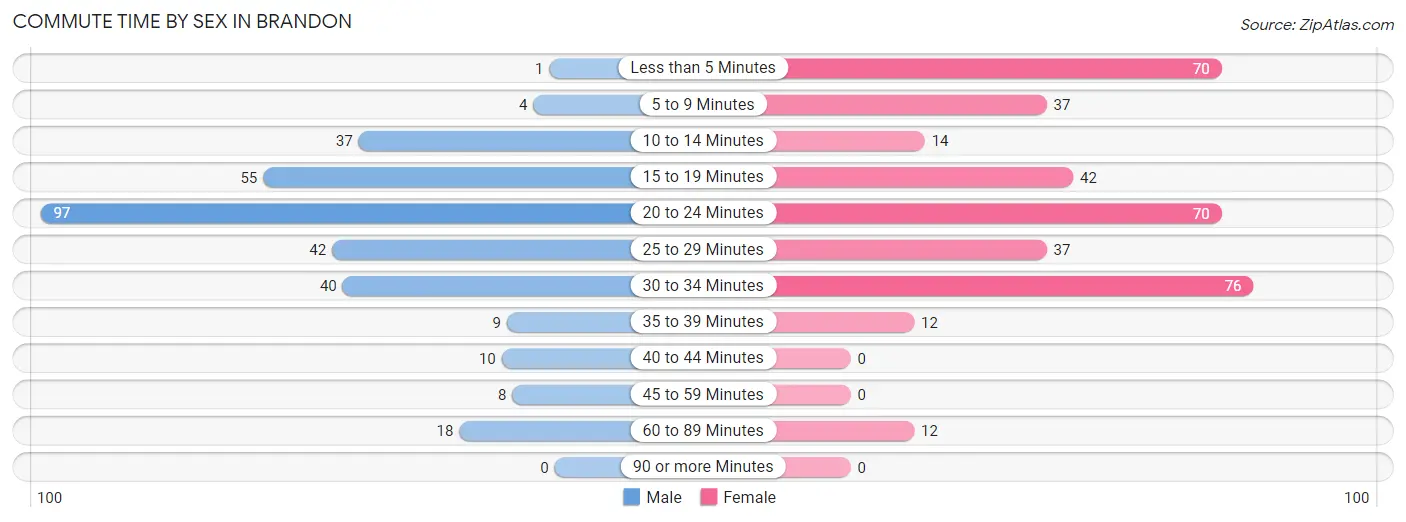
| Commute Time | Male | Female |
| Less than 5 Minutes | 1 (0.3%) | 70 (18.9%) |
| 5 to 9 Minutes | 4 (1.3%) | 37 (10.0%) |
| 10 to 14 Minutes | 37 (11.5%) | 14 (3.8%) |
| 15 to 19 Minutes | 55 (17.1%) | 42 (11.4%) |
| 20 to 24 Minutes | 97 (30.2%) | 70 (18.9%) |
| 25 to 29 Minutes | 42 (13.1%) | 37 (10.0%) |
| 30 to 34 Minutes | 40 (12.5%) | 76 (20.5%) |
| 35 to 39 Minutes | 9 (2.8%) | 12 (3.2%) |
| 40 to 44 Minutes | 10 (3.1%) | 0 (0.0%) |
| 45 to 59 Minutes | 8 (2.5%) | 0 (0.0%) |
| 60 to 89 Minutes | 18 (5.6%) | 12 (3.2%) |
| 90 or more Minutes | 0 (0.0%) | 0 (0.0%) |
Time of Departure to Work by Sex in Brandon
The most frequent times of departure to work in Brandon are 7:30 AM to 7:59 AM (81, 25.2%) for males and 8:30 AM to 8:59 AM (90, 24.3%) for females.
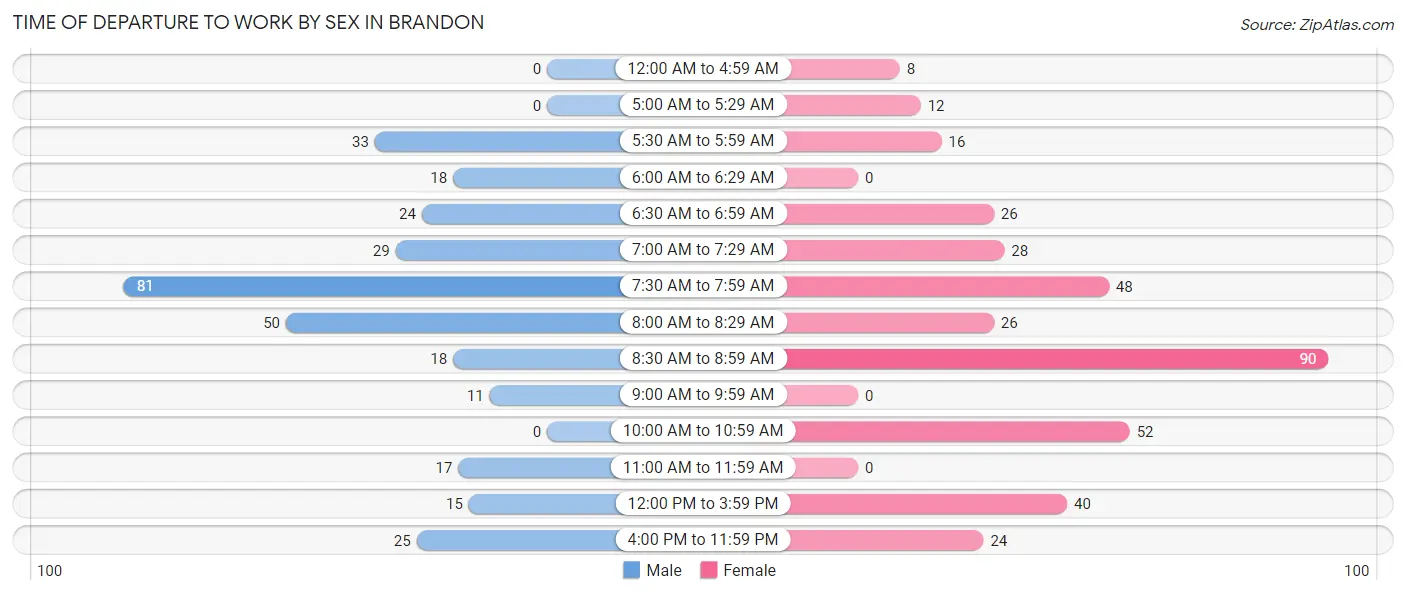
| Time of Departure | Male | Female |
| 12:00 AM to 4:59 AM | 0 (0.0%) | 8 (2.2%) |
| 5:00 AM to 5:29 AM | 0 (0.0%) | 12 (3.2%) |
| 5:30 AM to 5:59 AM | 33 (10.3%) | 16 (4.3%) |
| 6:00 AM to 6:29 AM | 18 (5.6%) | 0 (0.0%) |
| 6:30 AM to 6:59 AM | 24 (7.5%) | 26 (7.0%) |
| 7:00 AM to 7:29 AM | 29 (9.0%) | 28 (7.6%) |
| 7:30 AM to 7:59 AM | 81 (25.2%) | 48 (13.0%) |
| 8:00 AM to 8:29 AM | 50 (15.6%) | 26 (7.0%) |
| 8:30 AM to 8:59 AM | 18 (5.6%) | 90 (24.3%) |
| 9:00 AM to 9:59 AM | 11 (3.4%) | 0 (0.0%) |
| 10:00 AM to 10:59 AM | 0 (0.0%) | 52 (14.1%) |
| 11:00 AM to 11:59 AM | 17 (5.3%) | 0 (0.0%) |
| 12:00 PM to 3:59 PM | 15 (4.7%) | 40 (10.8%) |
| 4:00 PM to 11:59 PM | 25 (7.8%) | 24 (6.5%) |
| Total | 321 (100.0%) | 370 (100.0%) |
Housing Occupancy in Brandon
Occupancy by Ownership in Brandon
Of the total 748 dwellings in Brandon, owner-occupied units account for 570 (76.2%), while renter-occupied units make up 178 (23.8%).
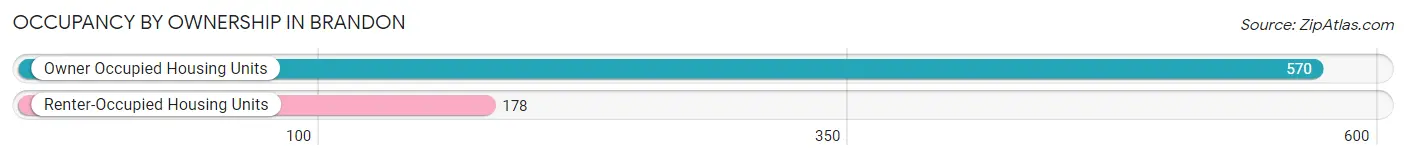
| Occupancy | # Housing Units | % Housing Units |
| Owner Occupied Housing Units | 570 | 76.2% |
| Renter-Occupied Housing Units | 178 | 23.8% |
| Total Occupied Housing Units | 748 | 100.0% |
Occupancy by Household Size in Brandon
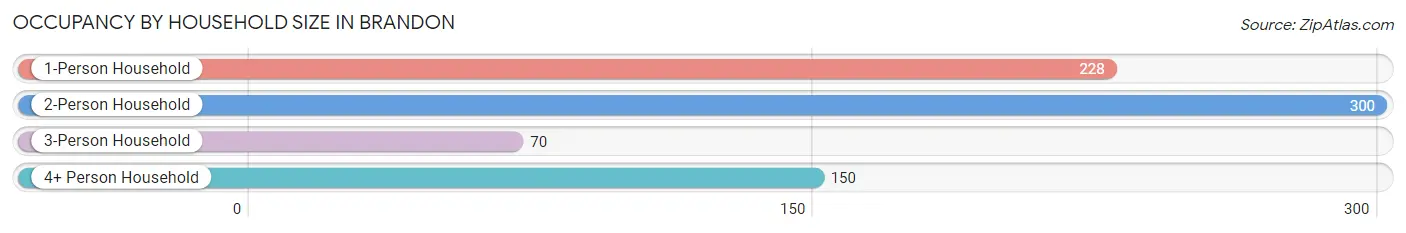
| Household Size | # Housing Units | % Housing Units |
| 1-Person Household | 228 | 30.5% |
| 2-Person Household | 300 | 40.1% |
| 3-Person Household | 70 | 9.4% |
| 4+ Person Household | 150 | 20.1% |
| Total Housing Units | 748 | 100.0% |
Occupancy by Ownership by Household Size in Brandon
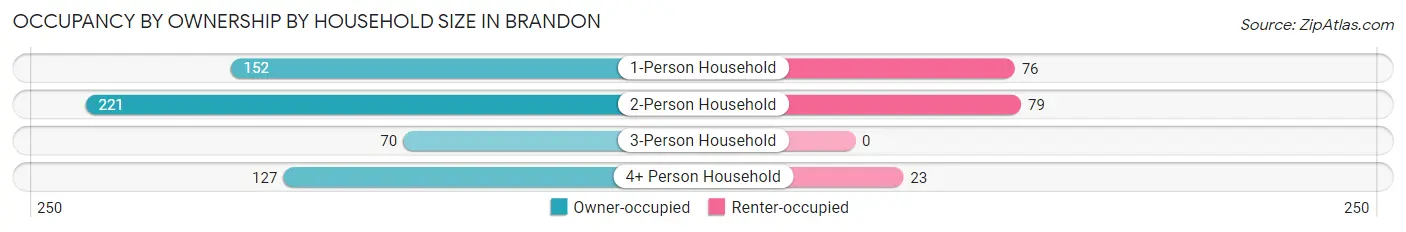
| Household Size | Owner-occupied | Renter-occupied |
| 1-Person Household | 152 (66.7%) | 76 (33.3%) |
| 2-Person Household | 221 (73.7%) | 79 (26.3%) |
| 3-Person Household | 70 (100.0%) | 0 (0.0%) |
| 4+ Person Household | 127 (84.7%) | 23 (15.3%) |
| Total Housing Units | 570 (76.2%) | 178 (23.8%) |
Occupancy by Educational Attainment in Brandon
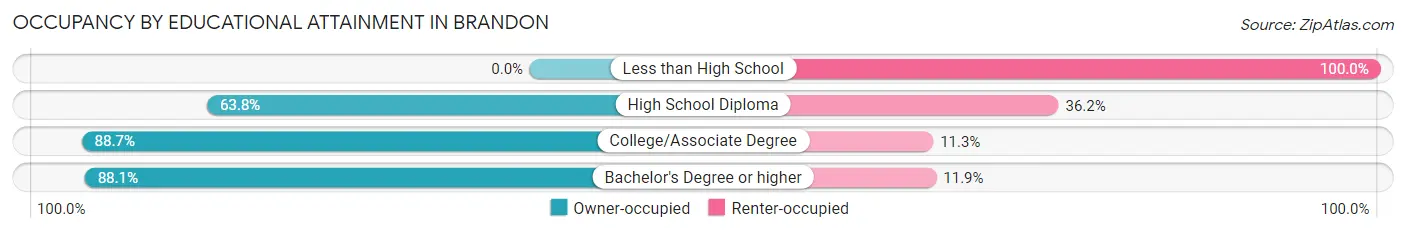
| Household Size | Owner-occupied | Renter-occupied |
| Less than High School | 0 (0.0%) | 54 (100.0%) |
| High School Diploma | 113 (63.8%) | 64 (36.2%) |
| College/Associate Degree | 243 (88.7%) | 31 (11.3%) |
| Bachelor's Degree or higher | 214 (88.1%) | 29 (11.9%) |
Occupancy by Age of Householder in Brandon
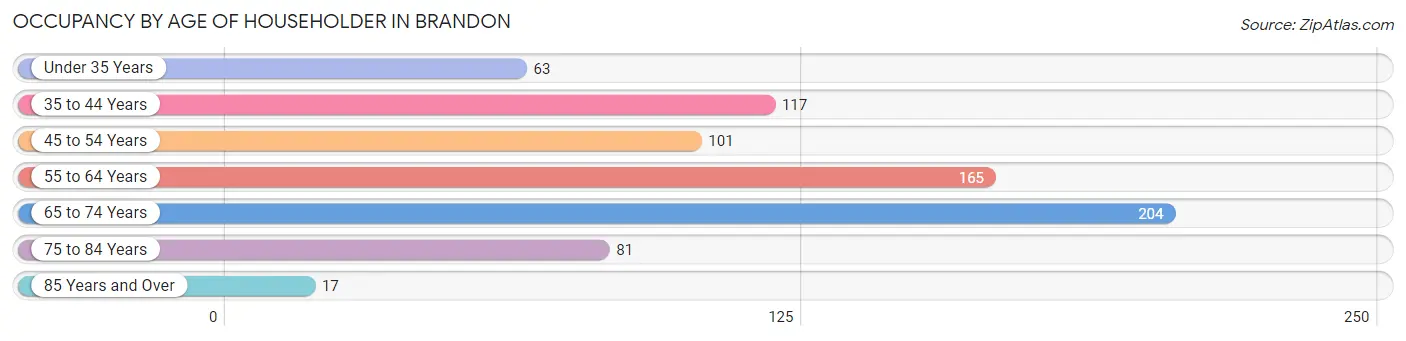
| Age Bracket | # Households | % Households |
| Under 35 Years | 63 | 8.4% |
| 35 to 44 Years | 117 | 15.6% |
| 45 to 54 Years | 101 | 13.5% |
| 55 to 64 Years | 165 | 22.1% |
| 65 to 74 Years | 204 | 27.3% |
| 75 to 84 Years | 81 | 10.8% |
| 85 Years and Over | 17 | 2.3% |
| Total | 748 | 100.0% |
Housing Finances in Brandon
Median Income by Occupancy in Brandon
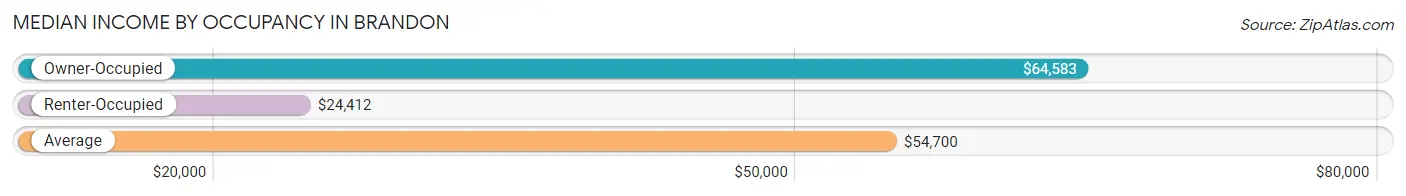
| Occupancy Type | # Households | Median Income |
| Owner-Occupied | 570 (76.2%) | $64,583 |
| Renter-Occupied | 178 (23.8%) | $24,412 |
| Average | 748 (100.0%) | $54,700 |
Occupancy by Householder Income Bracket in Brandon
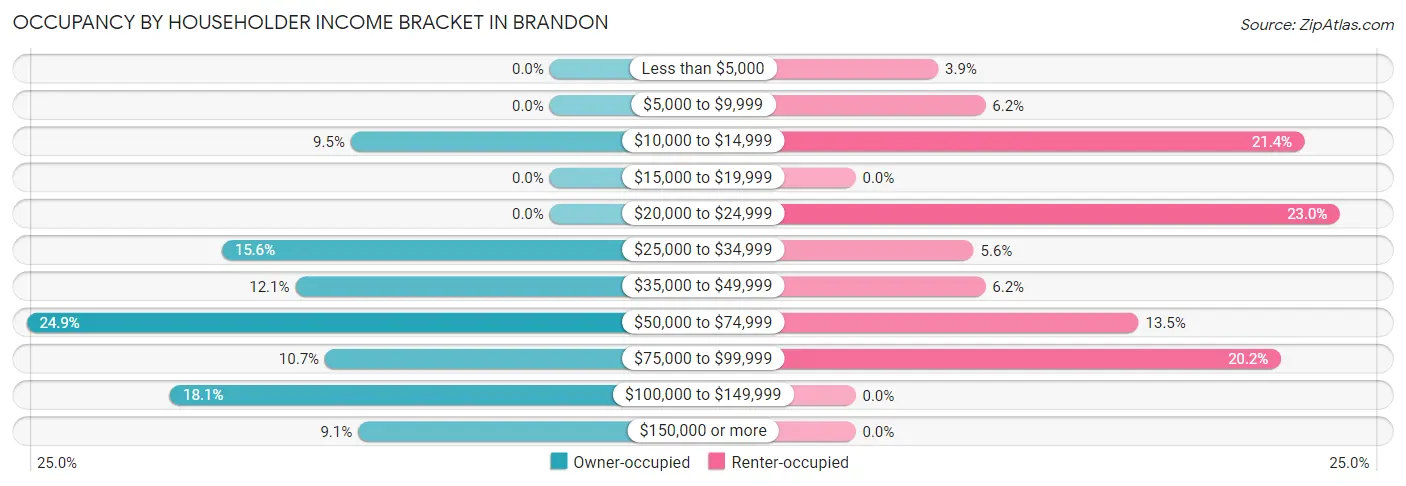
| Income Bracket | Owner-occupied | Renter-occupied |
| Less than $5,000 | 0 (0.0%) | 7 (3.9%) |
| $5,000 to $9,999 | 0 (0.0%) | 11 (6.2%) |
| $10,000 to $14,999 | 54 (9.5%) | 38 (21.3%) |
| $15,000 to $19,999 | 0 (0.0%) | 0 (0.0%) |
| $20,000 to $24,999 | 0 (0.0%) | 41 (23.0%) |
| $25,000 to $34,999 | 89 (15.6%) | 10 (5.6%) |
| $35,000 to $49,999 | 69 (12.1%) | 11 (6.2%) |
| $50,000 to $74,999 | 142 (24.9%) | 24 (13.5%) |
| $75,000 to $99,999 | 61 (10.7%) | 36 (20.2%) |
| $100,000 to $149,999 | 103 (18.1%) | 0 (0.0%) |
| $150,000 or more | 52 (9.1%) | 0 (0.0%) |
| Total | 570 (100.0%) | 178 (100.0%) |
Monthly Housing Cost Tiers in Brandon
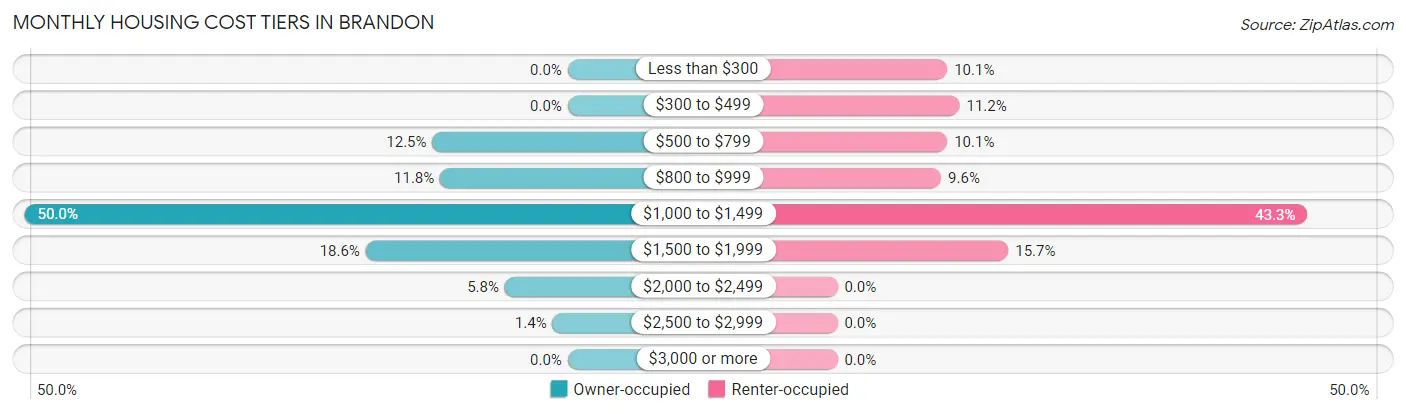
| Monthly Cost | Owner-occupied | Renter-occupied |
| Less than $300 | 0 (0.0%) | 18 (10.1%) |
| $300 to $499 | 0 (0.0%) | 20 (11.2%) |
| $500 to $799 | 71 (12.5%) | 18 (10.1%) |
| $800 to $999 | 67 (11.7%) | 17 (9.6%) |
| $1,000 to $1,499 | 285 (50.0%) | 77 (43.3%) |
| $1,500 to $1,999 | 106 (18.6%) | 28 (15.7%) |
| $2,000 to $2,499 | 33 (5.8%) | 0 (0.0%) |
| $2,500 to $2,999 | 8 (1.4%) | 0 (0.0%) |
| $3,000 or more | 0 (0.0%) | 0 (0.0%) |
| Total | 570 (100.0%) | 178 (100.0%) |
Physical Housing Characteristics in Brandon
Housing Structures in Brandon
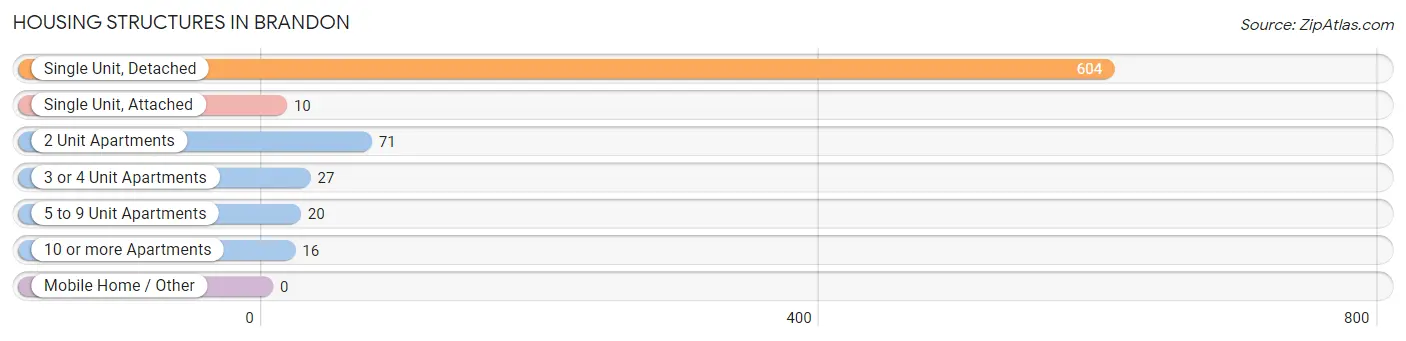
| Structure Type | # Housing Units | % Housing Units |
| Single Unit, Detached | 604 | 80.7% |
| Single Unit, Attached | 10 | 1.3% |
| 2 Unit Apartments | 71 | 9.5% |
| 3 or 4 Unit Apartments | 27 | 3.6% |
| 5 to 9 Unit Apartments | 20 | 2.7% |
| 10 or more Apartments | 16 | 2.1% |
| Mobile Home / Other | 0 | 0.0% |
| Total | 748 | 100.0% |
Housing Structures by Occupancy in Brandon
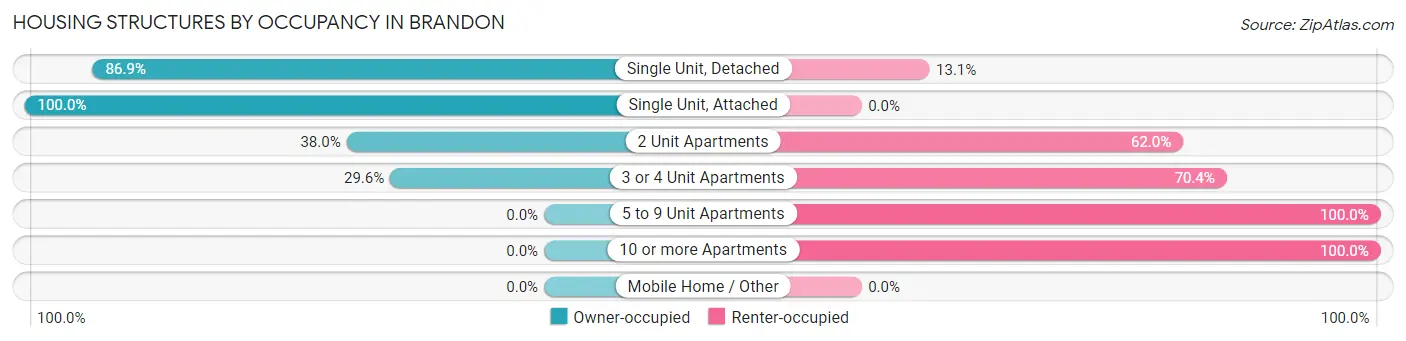
| Structure Type | Owner-occupied | Renter-occupied |
| Single Unit, Detached | 525 (86.9%) | 79 (13.1%) |
| Single Unit, Attached | 10 (100.0%) | 0 (0.0%) |
| 2 Unit Apartments | 27 (38.0%) | 44 (62.0%) |
| 3 or 4 Unit Apartments | 8 (29.6%) | 19 (70.4%) |
| 5 to 9 Unit Apartments | 0 (0.0%) | 20 (100.0%) |
| 10 or more Apartments | 0 (0.0%) | 16 (100.0%) |
| Mobile Home / Other | 0 (0.0%) | 0 (0.0%) |
| Total | 570 (76.2%) | 178 (23.8%) |
Housing Structures by Number of Rooms in Brandon
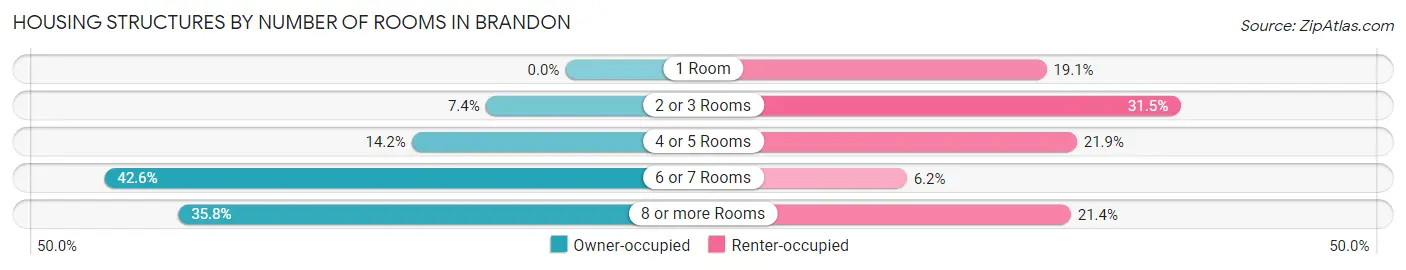
| Number of Rooms | Owner-occupied | Renter-occupied |
| 1 Room | 0 (0.0%) | 34 (19.1%) |
| 2 or 3 Rooms | 42 (7.4%) | 56 (31.5%) |
| 4 or 5 Rooms | 81 (14.2%) | 39 (21.9%) |
| 6 or 7 Rooms | 243 (42.6%) | 11 (6.2%) |
| 8 or more Rooms | 204 (35.8%) | 38 (21.3%) |
| Total | 570 (100.0%) | 178 (100.0%) |
Housing Structure by Heating Type in Brandon
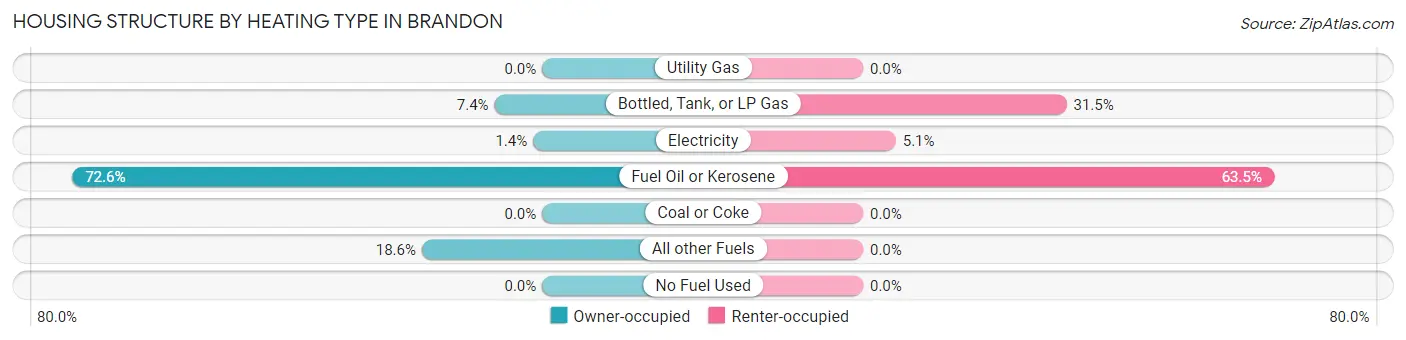
| Heating Type | Owner-occupied | Renter-occupied |
| Utility Gas | 0 (0.0%) | 0 (0.0%) |
| Bottled, Tank, or LP Gas | 42 (7.4%) | 56 (31.5%) |
| Electricity | 8 (1.4%) | 9 (5.1%) |
| Fuel Oil or Kerosene | 414 (72.6%) | 113 (63.5%) |
| Coal or Coke | 0 (0.0%) | 0 (0.0%) |
| All other Fuels | 106 (18.6%) | 0 (0.0%) |
| No Fuel Used | 0 (0.0%) | 0 (0.0%) |
| Total | 570 (100.0%) | 178 (100.0%) |
Household Vehicle Usage in Brandon
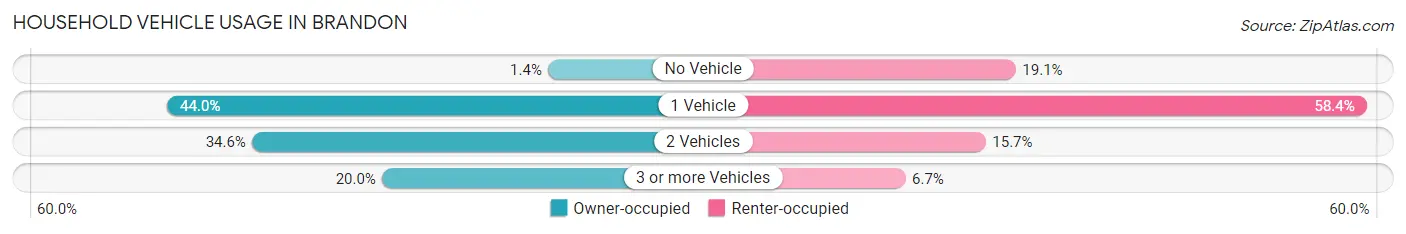
| Vehicles per Household | Owner-occupied | Renter-occupied |
| No Vehicle | 8 (1.4%) | 34 (19.1%) |
| 1 Vehicle | 251 (44.0%) | 104 (58.4%) |
| 2 Vehicles | 197 (34.6%) | 28 (15.7%) |
| 3 or more Vehicles | 114 (20.0%) | 12 (6.7%) |
| Total | 570 (100.0%) | 178 (100.0%) |
Real Estate & Mortgages in Brandon
Real Estate and Mortgage Overview in Brandon
| Characteristic | Without Mortgage | With Mortgage |
| Housing Units | 231 | 339 |
| Median Property Value | $238,100 | $175,200 |
| Median Household Income | $65,781 | $16 |
| Monthly Housing Costs | $891 | $0 |
| Real Estate Taxes | $4,728 | $0 |
Property Value by Mortgage Status in Brandon
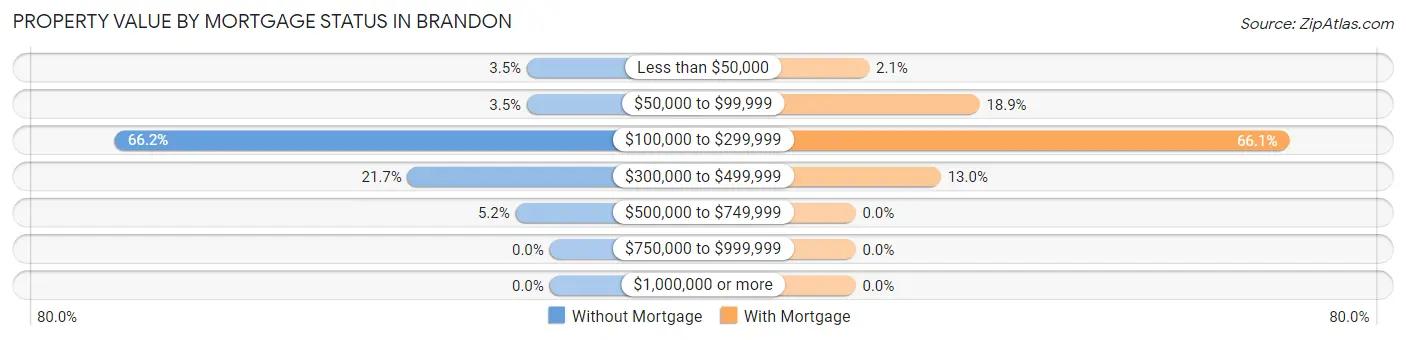
| Property Value | Without Mortgage | With Mortgage |
| Less than $50,000 | 8 (3.5%) | 7 (2.1%) |
| $50,000 to $99,999 | 8 (3.5%) | 64 (18.9%) |
| $100,000 to $299,999 | 153 (66.2%) | 224 (66.1%) |
| $300,000 to $499,999 | 50 (21.6%) | 44 (13.0%) |
| $500,000 to $749,999 | 12 (5.2%) | 0 (0.0%) |
| $750,000 to $999,999 | 0 (0.0%) | 0 (0.0%) |
| $1,000,000 or more | 0 (0.0%) | 0 (0.0%) |
| Total | 231 (100.0%) | 339 (100.0%) |
Household Income by Mortgage Status in Brandon
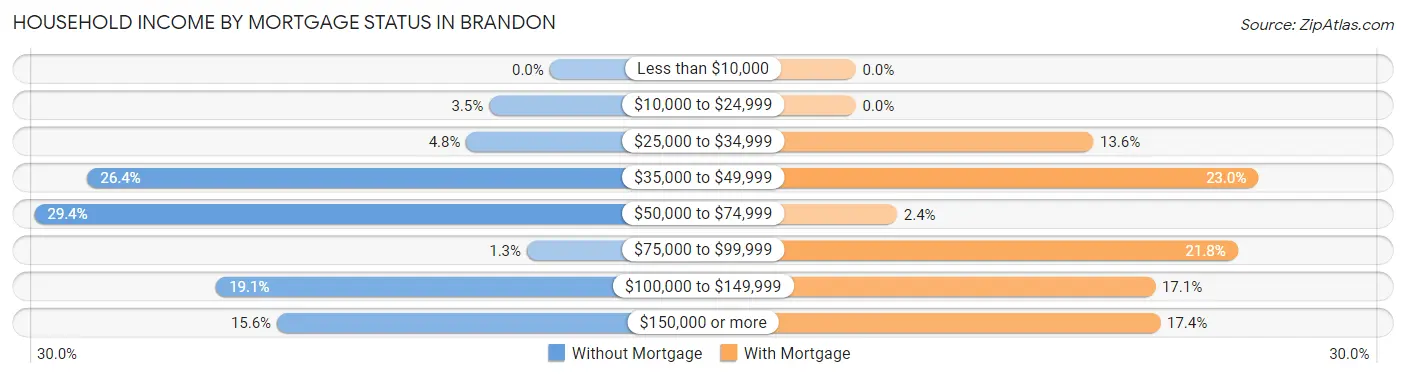
| Household Income | Without Mortgage | With Mortgage |
| Less than $10,000 | 0 (0.0%) | 0 (0.0%) |
| $10,000 to $24,999 | 8 (3.5%) | 0 (0.0%) |
| $25,000 to $34,999 | 11 (4.8%) | 46 (13.6%) |
| $35,000 to $49,999 | 61 (26.4%) | 78 (23.0%) |
| $50,000 to $74,999 | 68 (29.4%) | 8 (2.4%) |
| $75,000 to $99,999 | 3 (1.3%) | 74 (21.8%) |
| $100,000 to $149,999 | 44 (19.1%) | 58 (17.1%) |
| $150,000 or more | 36 (15.6%) | 59 (17.4%) |
| Total | 231 (100.0%) | 339 (100.0%) |
Property Value to Household Income Ratio in Brandon
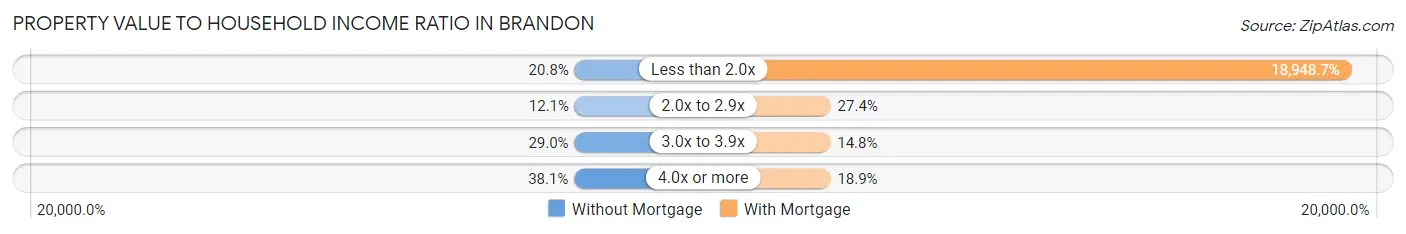
| Value-to-Income Ratio | Without Mortgage | With Mortgage |
| Less than 2.0x | 48 (20.8%) | 64,236 (18,948.7%) |
| 2.0x to 2.9x | 28 (12.1%) | 93 (27.4%) |
| 3.0x to 3.9x | 67 (29.0%) | 50 (14.7%) |
| 4.0x or more | 88 (38.1%) | 64 (18.9%) |
| Total | 231 (100.0%) | 339 (100.0%) |
Real Estate Taxes by Mortgage Status in Brandon
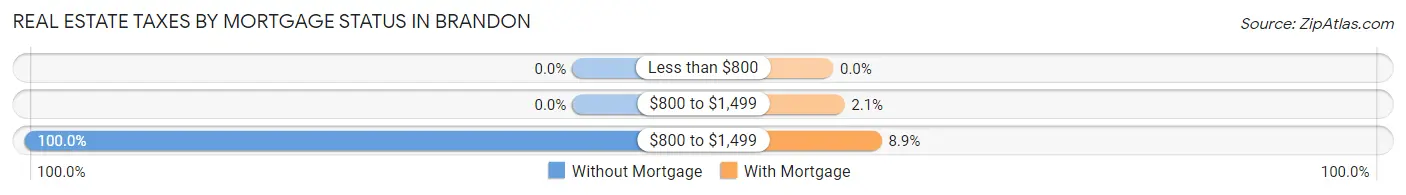
| Property Taxes | Without Mortgage | With Mortgage |
| Less than $800 | 0 (0.0%) | 0 (0.0%) |
| $800 to $1,499 | 0 (0.0%) | 7 (2.1%) |
| $800 to $1,499 | 231 (100.0%) | 30 (8.8%) |
| Total | 231 (100.0%) | 339 (100.0%) |
Health & Disability in Brandon
Health Insurance Coverage by Age in Brandon
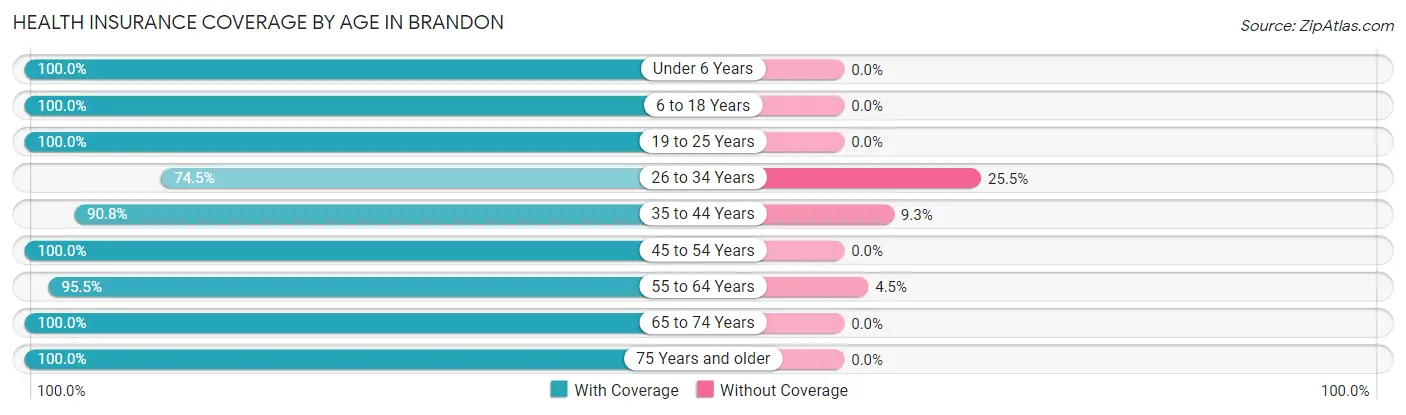
| Age Bracket | With Coverage | Without Coverage |
| Under 6 Years | 50 (100.0%) | 0 (0.0%) |
| 6 to 18 Years | 477 (100.0%) | 0 (0.0%) |
| 19 to 25 Years | 71 (100.0%) | 0 (0.0%) |
| 26 to 34 Years | 73 (74.5%) | 25 (25.5%) |
| 35 to 44 Years | 157 (90.7%) | 16 (9.2%) |
| 45 to 54 Years | 255 (100.0%) | 0 (0.0%) |
| 55 to 64 Years | 235 (95.5%) | 11 (4.5%) |
| 65 to 74 Years | 299 (100.0%) | 0 (0.0%) |
| 75 Years and older | 182 (100.0%) | 0 (0.0%) |
| Total | 1,799 (97.2%) | 52 (2.8%) |
Health Insurance Coverage by Citizenship Status in Brandon
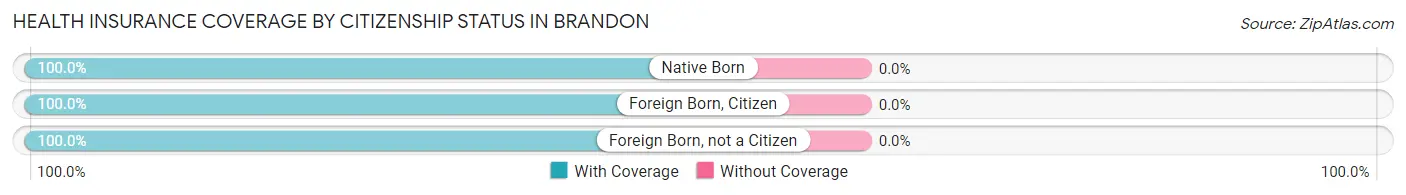
| Citizenship Status | With Coverage | Without Coverage |
| Native Born | 50 (100.0%) | 0 (0.0%) |
| Foreign Born, Citizen | 477 (100.0%) | 0 (0.0%) |
| Foreign Born, not a Citizen | 71 (100.0%) | 0 (0.0%) |
Health Insurance Coverage by Household Income in Brandon
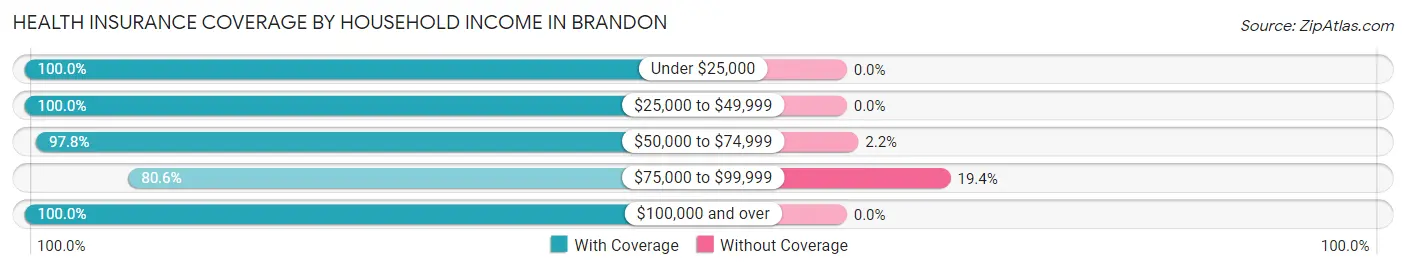
| Household Income | With Coverage | Without Coverage |
| Under $25,000 | 225 (100.0%) | 0 (0.0%) |
| $25,000 to $49,999 | 304 (100.0%) | 0 (0.0%) |
| $50,000 to $74,999 | 454 (97.8%) | 10 (2.2%) |
| $75,000 to $99,999 | 174 (80.6%) | 42 (19.4%) |
| $100,000 and over | 642 (100.0%) | 0 (0.0%) |
Public vs Private Health Insurance Coverage by Age in Brandon
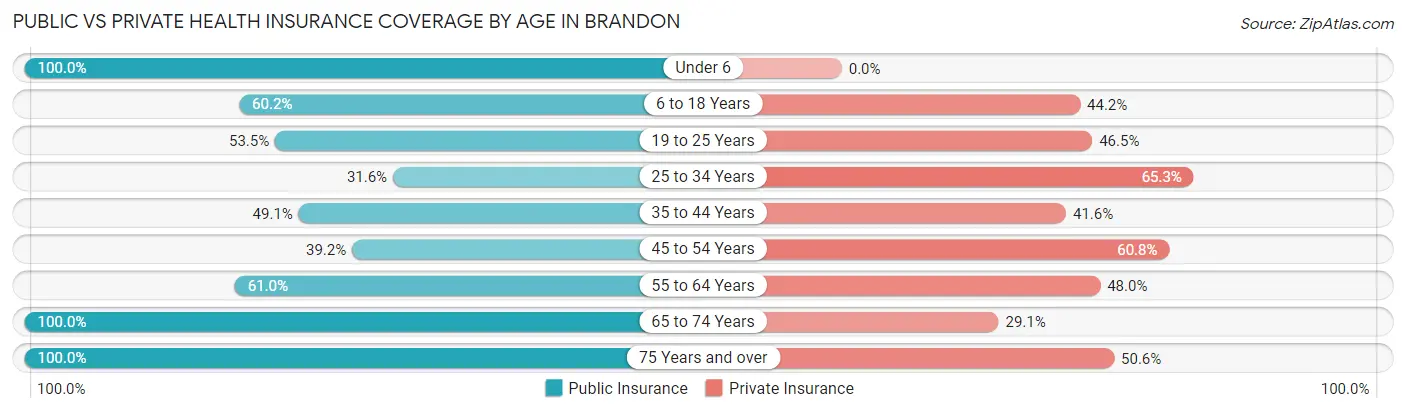
| Age Bracket | Public Insurance | Private Insurance |
| Under 6 | 50 (100.0%) | 0 (0.0%) |
| 6 to 18 Years | 287 (60.2%) | 211 (44.2%) |
| 19 to 25 Years | 38 (53.5%) | 33 (46.5%) |
| 25 to 34 Years | 31 (31.6%) | 64 (65.3%) |
| 35 to 44 Years | 85 (49.1%) | 72 (41.6%) |
| 45 to 54 Years | 100 (39.2%) | 155 (60.8%) |
| 55 to 64 Years | 150 (61.0%) | 118 (48.0%) |
| 65 to 74 Years | 299 (100.0%) | 87 (29.1%) |
| 75 Years and over | 182 (100.0%) | 92 (50.5%) |
| Total | 1,222 (66.0%) | 832 (45.0%) |
Disability Status by Sex by Age in Brandon
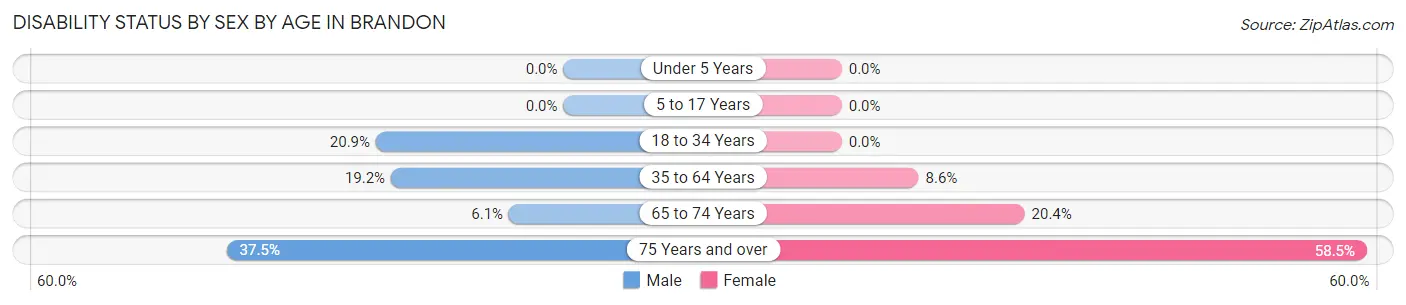
| Age Bracket | Male | Female |
| Under 5 Years | 0 (0.0%) | 0 (0.0%) |
| 5 to 17 Years | 0 (0.0%) | 0 (0.0%) |
| 18 to 34 Years | 19 (20.9%) | 0 (0.0%) |
| 35 to 64 Years | 62 (19.2%) | 30 (8.6%) |
| 65 to 74 Years | 8 (6.1%) | 34 (20.4%) |
| 75 Years and over | 24 (37.5%) | 69 (58.5%) |
Disability Class by Sex by Age in Brandon
Disability Class: Hearing Difficulty
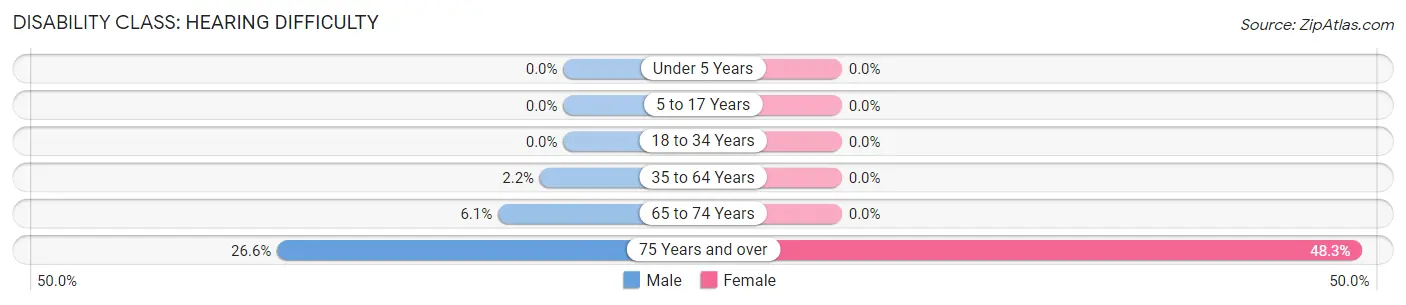
| Age Bracket | Male | Female |
| Under 5 Years | 0 (0.0%) | 0 (0.0%) |
| 5 to 17 Years | 0 (0.0%) | 0 (0.0%) |
| 18 to 34 Years | 0 (0.0%) | 0 (0.0%) |
| 35 to 64 Years | 7 (2.2%) | 0 (0.0%) |
| 65 to 74 Years | 8 (6.1%) | 0 (0.0%) |
| 75 Years and over | 17 (26.6%) | 57 (48.3%) |
Disability Class: Vision Difficulty
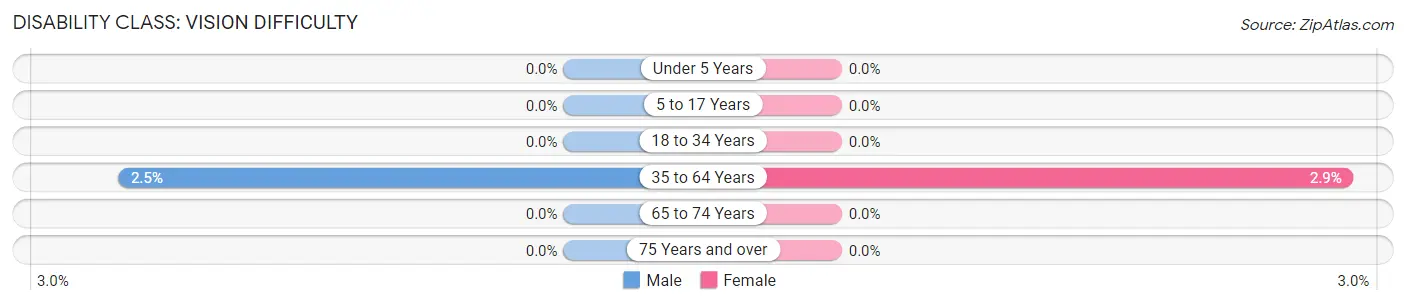
| Age Bracket | Male | Female |
| Under 5 Years | 0 (0.0%) | 0 (0.0%) |
| 5 to 17 Years | 0 (0.0%) | 0 (0.0%) |
| 18 to 34 Years | 0 (0.0%) | 0 (0.0%) |
| 35 to 64 Years | 8 (2.5%) | 10 (2.9%) |
| 65 to 74 Years | 0 (0.0%) | 0 (0.0%) |
| 75 Years and over | 0 (0.0%) | 0 (0.0%) |
Disability Class: Cognitive Difficulty
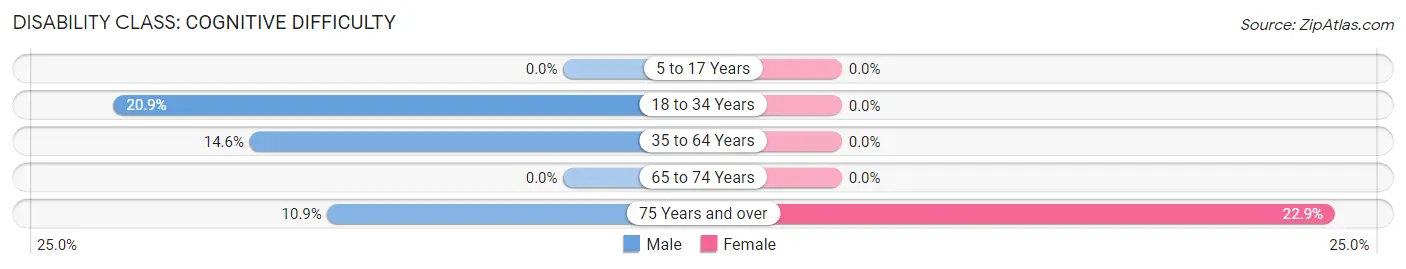
| Age Bracket | Male | Female |
| 5 to 17 Years | 0 (0.0%) | 0 (0.0%) |
| 18 to 34 Years | 19 (20.9%) | 0 (0.0%) |
| 35 to 64 Years | 47 (14.5%) | 0 (0.0%) |
| 65 to 74 Years | 0 (0.0%) | 0 (0.0%) |
| 75 Years and over | 7 (10.9%) | 27 (22.9%) |
Disability Class: Ambulatory Difficulty
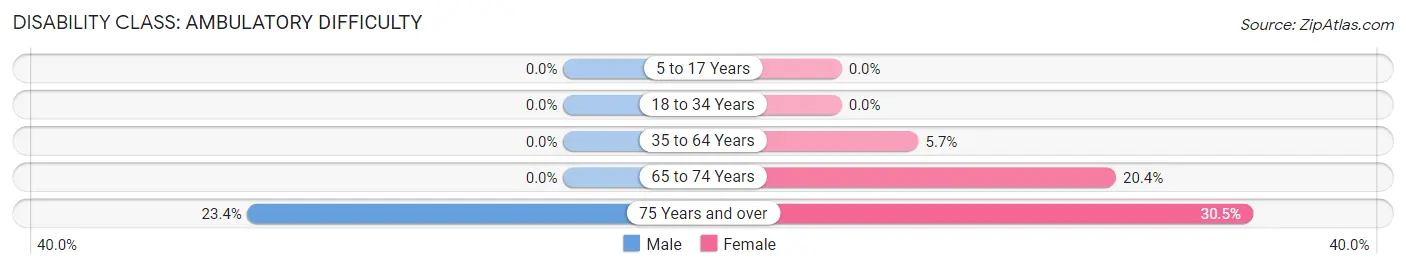
| Age Bracket | Male | Female |
| 5 to 17 Years | 0 (0.0%) | 0 (0.0%) |
| 18 to 34 Years | 0 (0.0%) | 0 (0.0%) |
| 35 to 64 Years | 0 (0.0%) | 20 (5.7%) |
| 65 to 74 Years | 0 (0.0%) | 34 (20.4%) |
| 75 Years and over | 15 (23.4%) | 36 (30.5%) |
Disability Class: Self-Care Difficulty
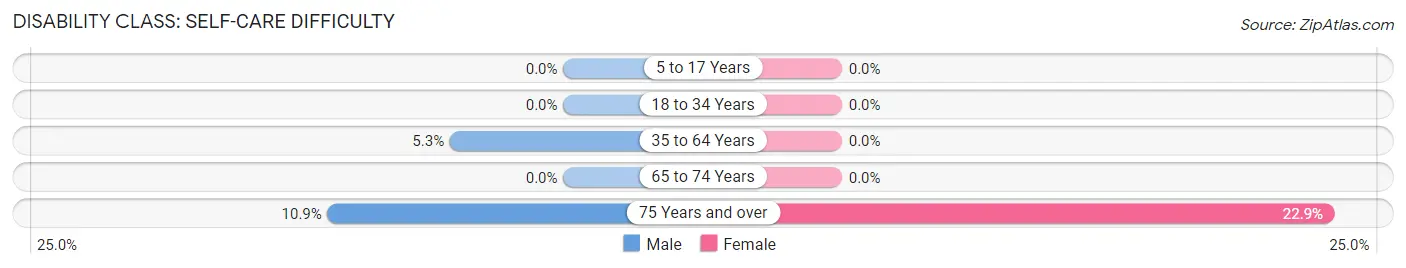
| Age Bracket | Male | Female |
| 5 to 17 Years | 0 (0.0%) | 0 (0.0%) |
| 18 to 34 Years | 0 (0.0%) | 0 (0.0%) |
| 35 to 64 Years | 17 (5.3%) | 0 (0.0%) |
| 65 to 74 Years | 0 (0.0%) | 0 (0.0%) |
| 75 Years and over | 7 (10.9%) | 27 (22.9%) |
Technology Access in Brandon
Computing Device Access in Brandon
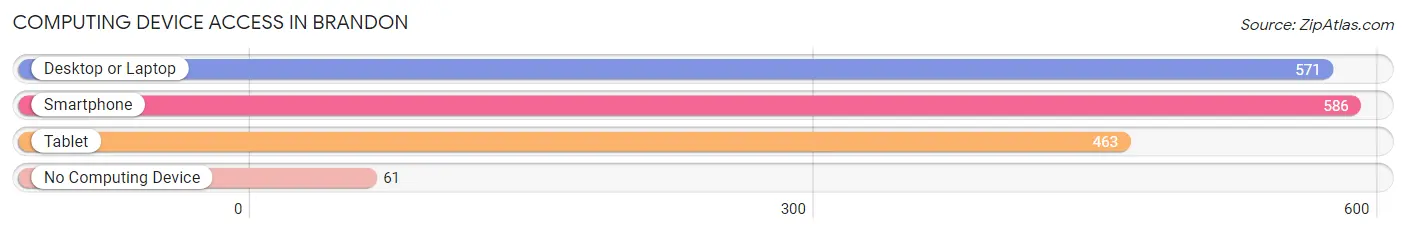
| Device Type | # Households | % Households |
| Desktop or Laptop | 571 | 76.3% |
| Smartphone | 586 | 78.3% |
| Tablet | 463 | 61.9% |
| No Computing Device | 61 | 8.2% |
| Total | 748 | 100.0% |
Internet Access in Brandon
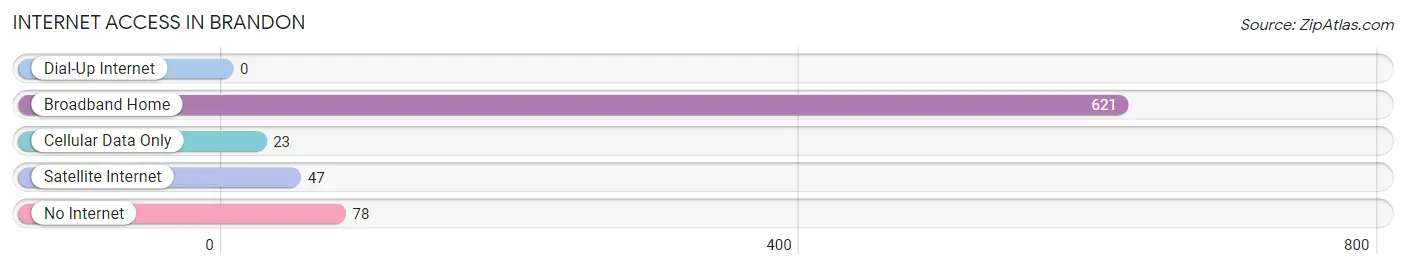
| Internet Type | # Households | % Households |
| Dial-Up Internet | 0 | 0.0% |
| Broadband Home | 621 | 83.0% |
| Cellular Data Only | 23 | 3.1% |
| Satellite Internet | 47 | 6.3% |
| No Internet | 78 | 10.4% |
| Total | 748 | 100.0% |
Brandon Summary
Brandon, Vermont is a small town located in Rutland County in the state of Vermont. It is situated in the Green Mountains and is bordered by the towns of Sudbury, Pittsford, and Leicester. The town has a population of 4,711 people, according to the 2010 census.
History
The town of Brandon was first settled in 1761 by a group of settlers from Massachusetts. The town was named after the English town of Brandon, Suffolk. The town was incorporated in 1761 and was the first town in Rutland County.
The town of Brandon was an important center of industry in the 19th century. It was home to several mills, including a woolen mill, a paper mill, and a grist mill. The town was also home to a number of quarries, which provided stone for many of the buildings in the area.
Geography
Brandon is located in the Green Mountains of Vermont. The town is bordered by the towns of Sudbury, Pittsford, and Leicester. The town is situated on the Ottauquechee River, which flows through the town. The town is also home to several lakes, including Lake Dunmore, Lake Hortonia, and Lake Amherst.
The town of Brandon has a total area of 24.2 square miles, of which 24.1 square miles is land and 0.1 square miles is water. The town has a total elevation of 1,068 feet.
Economy
The economy of Brandon is largely based on tourism and agriculture. The town is home to several ski resorts, including Killington Ski Resort, which is the largest ski resort in the eastern United States. The town is also home to several farms, which produce dairy products, vegetables, and fruits.
The town is also home to several manufacturing companies, including a paper mill, a printing company, and a furniture manufacturer. The town is also home to several retail stores, including a grocery store, a hardware store, and a clothing store.
Demographics
According to the 2010 census, the town of Brandon has a population of 4,711 people. The population is spread out with a median age of 43.7 years. The town has a gender ratio of 49.7% male and 50.3% female.
The racial makeup of the town is 97.2% White, 0.7% African American, 0.3% Native American, 0.3% Asian, 0.1% Pacific Islander, 0.3% from other races, and 1.2% from two or more races. The town has a Hispanic or Latino population of 1.2%.
The town has a median household income of $50,945 and a per capita income of $25,945. The town has a poverty rate of 8.3%. The town has a high school graduation rate of 93.3%.
Common Questions
What is the Total Population of Brandon?
Total Population of Brandon is 1,858.
What is the Total Male Population of Brandon?
Total Male Population of Brandon is 795.
What is the Total Female Population of Brandon?
Total Female Population of Brandon is 1,063.
What is the Ratio of Males per 100 Females in Brandon?
There are 74.79 Males per 100 Females in Brandon.
What is the Ratio of Females per 100 Males in Brandon?
There are 133.71 Females per 100 Males in Brandon.
What is the Median Population Age in Brandon?
Median Population Age in Brandon is 49.1 Years.
What is the Average Family Size in Brandon
Average Family Size in Brandon is 3.1 People.
What is the Average Household Size in Brandon
Average Household Size in Brandon is 2.5 People.
What is Per Capita Income in Brandon?
Per Capita income in Brandon is $27,810.
What is the Median Family Income in Brandon?
Median Family Income in Brandon is $65,625.
What is the Median Household income in Brandon?
Median Household Income in Brandon is $54,700.
What is Income or Wage Gap in Brandon?
Income or Wage Gap in Brandon is 33.9%.
Women in Brandon earn 66.1 cents for every dollar earned by a man.
What is Inequality or Gini Index in Brandon?
Inequality or Gini Index in Brandon is 0.41.
How Large is the Labor Force in Brandon?
There are 848 People in the Labor Forcein in Brandon.
What is the Percentage of People in the Labor Force in Brandon?
57.9% of People are in the Labor Force in Brandon.
What is the Unemployment Rate in Brandon?
Unemployment Rate in Brandon is 1.3%.