Fair Haven, VT
Fair Haven Map
Fair Haven Overview
2,422
TOTAL POPULATION
1,201
MALE POPULATION
1,221
FEMALE POPULATION
98.36
MALES / 100 FEMALES
101.67
FEMALES / 100 MALES
38.6
MEDIAN AGE
3.2
AVG FAMILY SIZE
2.8
AVG HOUSEHOLD SIZE
$29,000
PER CAPITA INCOME
$82,574
AVG FAMILY INCOME
$67,300
AVG HOUSEHOLD INCOME
51.2%
WAGE / INCOME GAP [ % ]
48.8¢/ $1
WAGE / INCOME GAP [ $ ]
0.36
INEQUALITY / GINI INDEX
1,261
LABOR FORCE [ PEOPLE ]
64.5%
PERCENT IN LABOR FORCE
3.5%
UNEMPLOYMENT RATE
Fair Haven Zip Codes
Fair Haven Area Codes
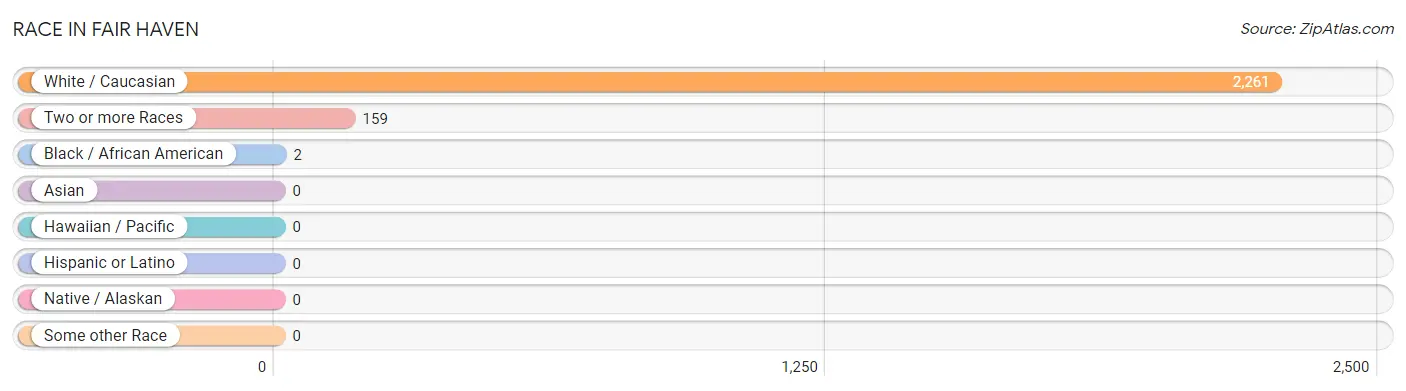
Race in Fair Haven
The most populous races in Fair Haven are White / Caucasian (2,261 | 93.3%), Two or more Races (159 | 6.6%), and Black / African American (2 | 0.1%).
| Race | # Population | % Population |
| Asian | 0 | 0.0% |
| Black / African American | 2 | 0.1% |
| Hawaiian / Pacific | 0 | 0.0% |
| Hispanic or Latino | 0 | 0.0% |
| Native / Alaskan | 0 | 0.0% |
| White / Caucasian | 2,261 | 93.3% |
| Two or more Races | 159 | 6.6% |
| Some other Race | 0 | 0.0% |
| Total | 2,422 | 100.0% |
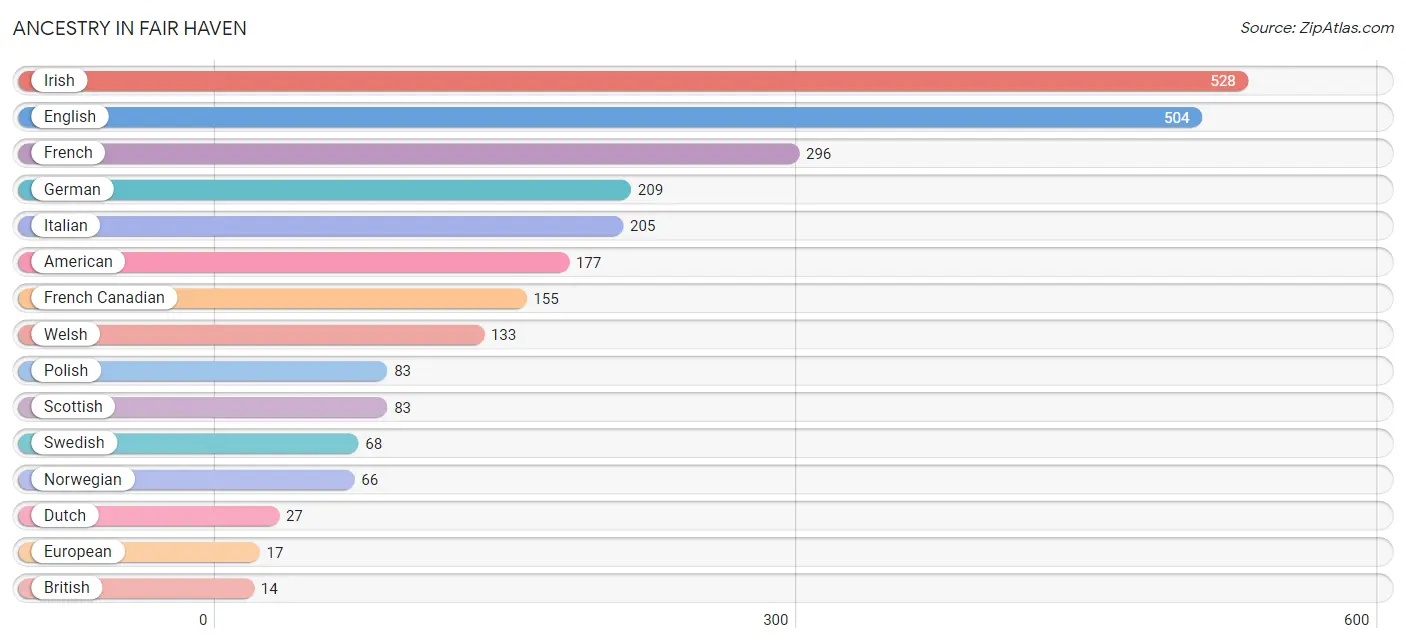
Ancestry in Fair Haven
The most populous ancestries reported in Fair Haven are Irish (528 | 21.8%), English (504 | 20.8%), French (296 | 12.2%), German (209 | 8.6%), and Italian (205 | 8.5%), together accounting for 71.9% of all Fair Haven residents.
| Ancestry | # Population | % Population |
| American | 177 | 7.3% |
| British | 14 | 0.6% |
| Cherokee | 14 | 0.6% |
| Czech | 13 | 0.5% |
| Dutch | 27 | 1.1% |
| Eastern European | 5 | 0.2% |
| English | 504 | 20.8% |
| European | 17 | 0.7% |
| French | 296 | 12.2% |
| French Canadian | 155 | 6.4% |
| German | 209 | 8.6% |
| Hungarian | 9 | 0.4% |
| Irish | 528 | 21.8% |
| Italian | 205 | 8.5% |
| Norwegian | 66 | 2.7% |
| Polish | 83 | 3.4% |
| Scottish | 83 | 3.4% |
| Swedish | 68 | 2.8% |
| Ukrainian | 8 | 0.3% |
| Welsh | 133 | 5.5% | View All 20 Rows |
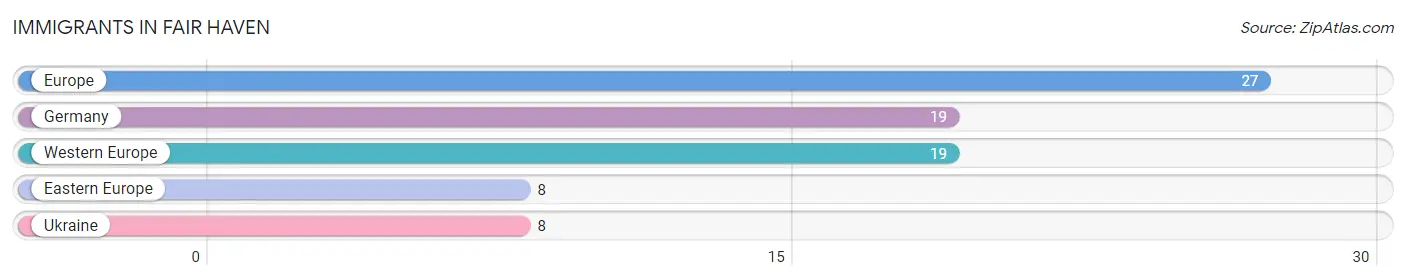
Immigrants in Fair Haven
The most numerous immigrant groups reported in Fair Haven came from Europe (27 | 1.1%), Germany (19 | 0.8%), Western Europe (19 | 0.8%), Eastern Europe (8 | 0.3%), and Ukraine (8 | 0.3%), together accounting for 3.3% of all Fair Haven residents.
| Immigration Origin | # Population | % Population |
| Eastern Europe | 8 | 0.3% |
| Europe | 27 | 1.1% |
| Germany | 19 | 0.8% |
| Ukraine | 8 | 0.3% |
| Western Europe | 19 | 0.8% | View All 5 Rows |
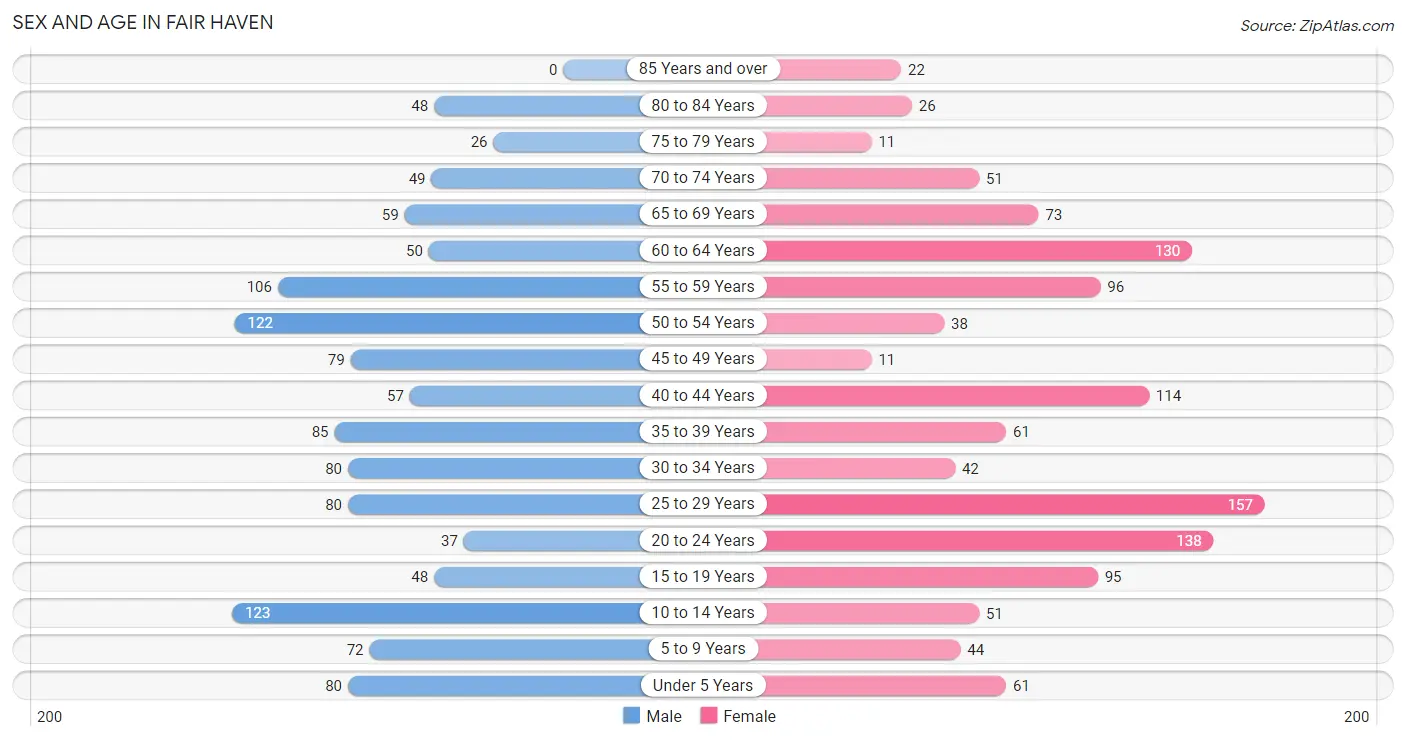
Sex and Age in Fair Haven
Sex and Age in Fair Haven
The most populous age groups in Fair Haven are 10 to 14 Years (123 | 10.2%) for men and 25 to 29 Years (157 | 12.9%) for women.
| Age Bracket | Male | Female |
| Under 5 Years | 80 (6.7%) | 61 (5.0%) |
| 5 to 9 Years | 72 (6.0%) | 44 (3.6%) |
| 10 to 14 Years | 123 (10.2%) | 51 (4.2%) |
| 15 to 19 Years | 48 (4.0%) | 95 (7.8%) |
| 20 to 24 Years | 37 (3.1%) | 138 (11.3%) |
| 25 to 29 Years | 80 (6.7%) | 157 (12.9%) |
| 30 to 34 Years | 80 (6.7%) | 42 (3.4%) |
| 35 to 39 Years | 85 (7.1%) | 61 (5.0%) |
| 40 to 44 Years | 57 (4.8%) | 114 (9.3%) |
| 45 to 49 Years | 79 (6.6%) | 11 (0.9%) |
| 50 to 54 Years | 122 (10.2%) | 38 (3.1%) |
| 55 to 59 Years | 106 (8.8%) | 96 (7.9%) |
| 60 to 64 Years | 50 (4.2%) | 130 (10.6%) |
| 65 to 69 Years | 59 (4.9%) | 73 (6.0%) |
| 70 to 74 Years | 49 (4.1%) | 51 (4.2%) |
| 75 to 79 Years | 26 (2.2%) | 11 (0.9%) |
| 80 to 84 Years | 48 (4.0%) | 26 (2.1%) |
| 85 Years and over | 0 (0.0%) | 22 (1.8%) |
| Total | 1,201 (100.0%) | 1,221 (100.0%) |
Families and Households in Fair Haven
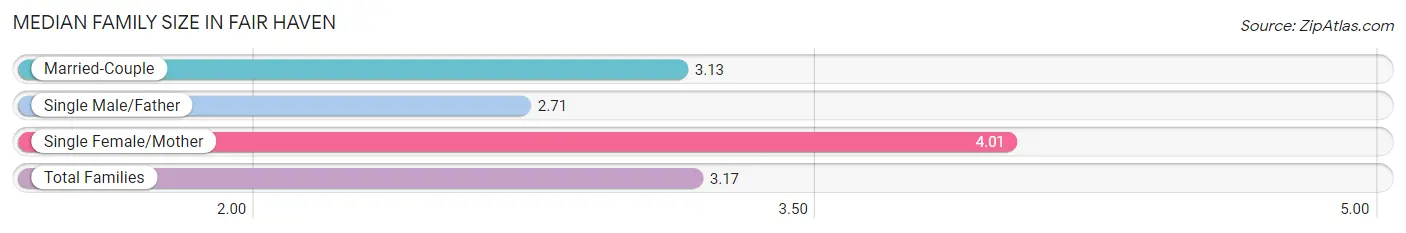
Median Family Size in Fair Haven
The median family size in Fair Haven is 3.17 persons per family, with single female/mother families (77 | 13.1%) accounting for the largest median family size of 4.01 persons per family. On the other hand, single male/father families (112 | 19.0%) represent the smallest median family size with 2.71 persons per family.
| Family Type | # Families | Family Size |
| Married-Couple | 400 (67.9%) | 3.13 |
| Single Male/Father | 112 (19.0%) | 2.71 |
| Single Female/Mother | 77 (13.1%) | 4.01 |
| Total Families | 589 (100.0%) | 3.17 |
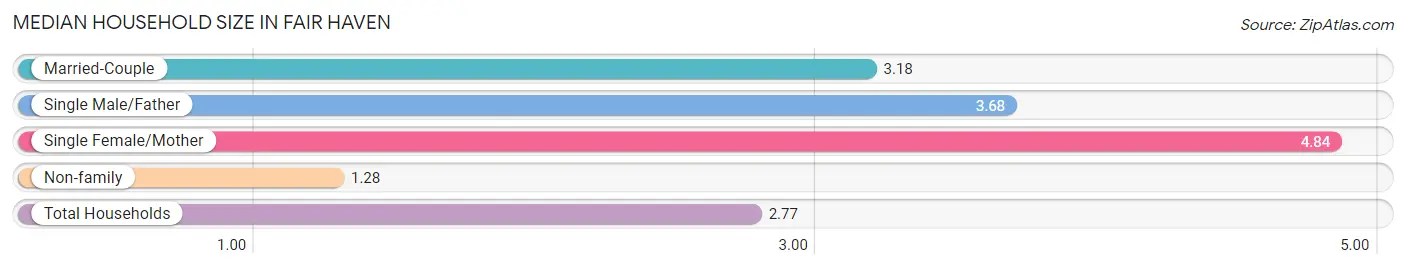
Median Household Size in Fair Haven
The median household size in Fair Haven is 2.77 persons per household, with single female/mother households (77 | 8.8%) accounting for the largest median household size of 4.84 persons per household. non-family households (285 | 32.6%) represent the smallest median household size with 1.28 persons per household.
| Household Type | # Households | Household Size |
| Married-Couple | 400 (45.8%) | 3.18 |
| Single Male/Father | 112 (12.8%) | 3.68 |
| Single Female/Mother | 77 (8.8%) | 4.84 |
| Non-family | 285 (32.6%) | 1.28 |
| Total Households | 874 (100.0%) | 2.77 |
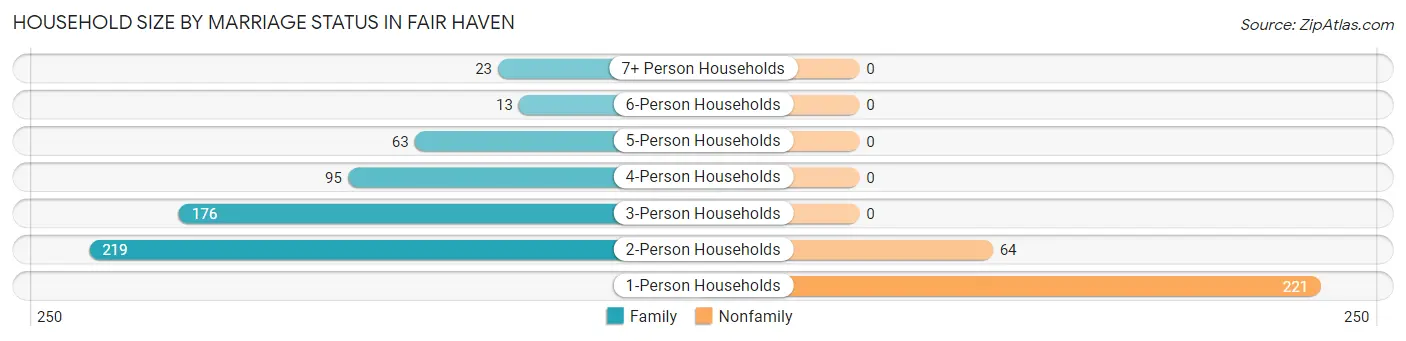
Household Size by Marriage Status in Fair Haven
Out of a total of 874 households in Fair Haven, 589 (67.4%) are family households, while 285 (32.6%) are nonfamily households. The most numerous type of family households are 2-person households, comprising 219, and the most common type of nonfamily households are 1-person households, comprising 221.
| Household Size | Family Households | Nonfamily Households |
| 1-Person Households | - | 221 (25.3%) |
| 2-Person Households | 219 (25.1%) | 64 (7.3%) |
| 3-Person Households | 176 (20.1%) | 0 (0.0%) |
| 4-Person Households | 95 (10.9%) | 0 (0.0%) |
| 5-Person Households | 63 (7.2%) | 0 (0.0%) |
| 6-Person Households | 13 (1.5%) | 0 (0.0%) |
| 7+ Person Households | 23 (2.6%) | 0 (0.0%) |
| Total | 589 (67.4%) | 285 (32.6%) |
Female Fertility in Fair Haven
Fertility by Age in Fair Haven
Average fertility rate in Fair Haven is 25.0 births per 1,000 women. Women in the age bracket of 20 to 34 years have the highest fertility rate with 47.0 births per 1,000 women. Women in the age bracket of 20 to 34 years acount for 100.0% of all women with births.
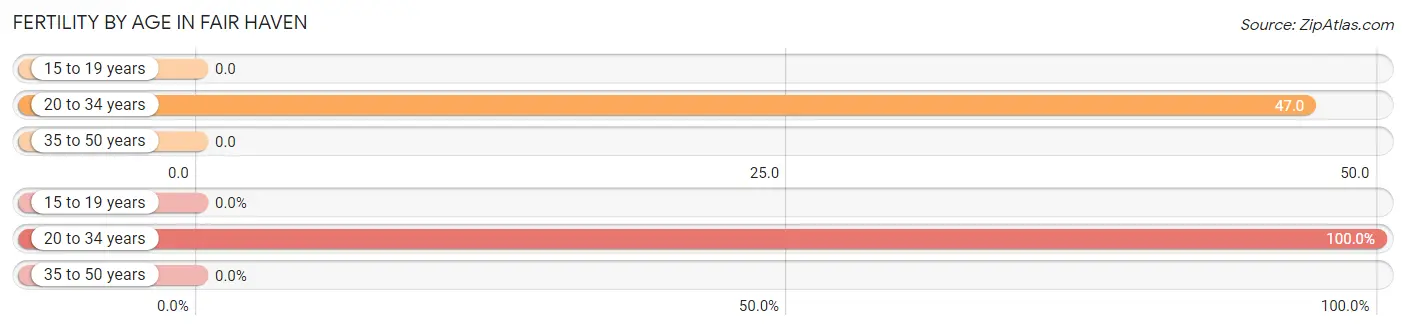
| Age Bracket | Women with Births | Births / 1,000 Women |
| 15 to 19 years | 0 (0.0%) | 0.0 |
| 20 to 34 years | 16 (100.0%) | 47.0 |
| 35 to 50 years | 0 (0.0%) | 0.0 |
| Total | 16 (100.0%) | 25.0 |
Fertility by Age by Marriage Status in Fair Haven

| Age Bracket | Married | Unmarried |
| 15 to 19 years | 0 (0.0%) | 0 (0.0%) |
| 20 to 34 years | 16 (100.0%) | 0 (0.0%) |
| 35 to 50 years | 0 (0.0%) | 0 (0.0%) |
| Total | 16 (100.0%) | 0 (0.0%) |
Fertility by Education in Fair Haven
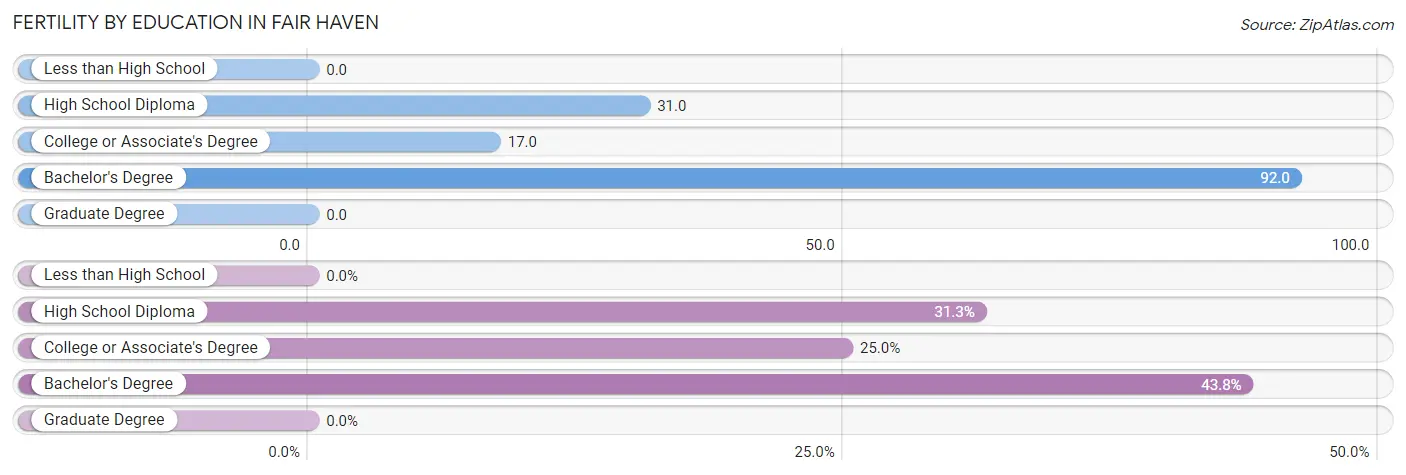
| Educational Attainment | Women with Births | Births / 1,000 Women |
| Less than High School | 0 (0.0%) | 0.0 |
| High School Diploma | 5 (31.2%) | 31.0 |
| College or Associate's Degree | 4 (25.0%) | 17.0 |
| Bachelor's Degree | 7 (43.8%) | 92.0 |
| Graduate Degree | 0 (0.0%) | 0.0 |
| Total | 16 (100.0%) | 25.0 |
Fertility by Education by Marriage Status in Fair Haven
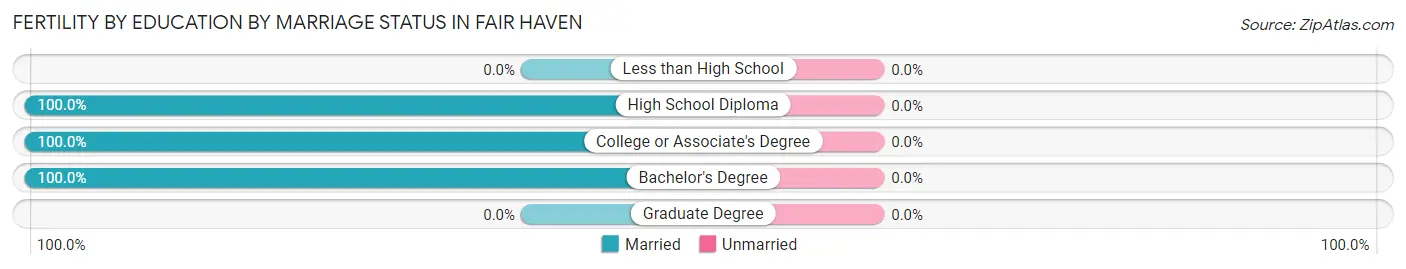
| Educational Attainment | Married | Unmarried |
| Less than High School | 0 (0.0%) | 0 (0.0%) |
| High School Diploma | 5 (100.0%) | 0 (0.0%) |
| College or Associate's Degree | 4 (100.0%) | 0 (0.0%) |
| Bachelor's Degree | 7 (100.0%) | 0 (0.0%) |
| Graduate Degree | 0 (0.0%) | 0 (0.0%) |
| Total | 16 (100.0%) | 0 (0.0%) |
Income in Fair Haven
Income Overview in Fair Haven
Per Capita Income in Fair Haven is $29,000, while median incomes of families and households are $82,574 and $67,300 respectively.
| Characteristic | Number | Measure |
| Per Capita Income | 2,422 | $29,000 |
| Median Family Income | 589 | $82,574 |
| Mean Family Income | 589 | $85,293 |
| Median Household Income | 874 | $67,300 |
| Mean Household Income | 874 | $79,721 |
| Income Deficit | 589 | $0 |
| Wage / Income Gap (%) | 2,422 | 51.20% |
| Wage / Income Gap ($) | 2,422 | 48.80¢ per $1 |
| Gini / Inequality Index | 2,422 | 0.36 |
Earnings by Sex in Fair Haven
Average Earnings in Fair Haven are $33,693, $44,348 for men and $21,641 for women, a difference of 51.2%.
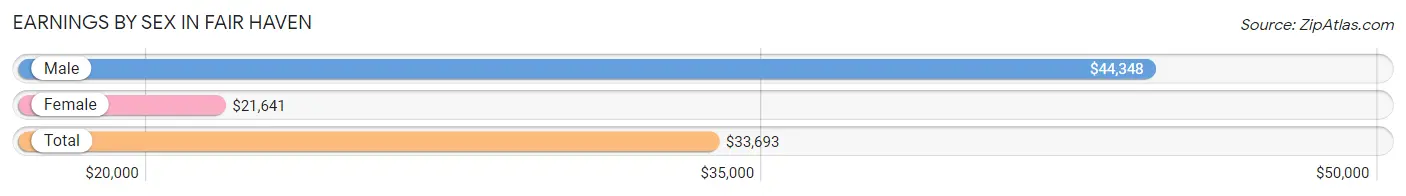
| Sex | Number | Average Earnings |
| Male | 660 (49.7%) | $44,348 |
| Female | 668 (50.3%) | $21,641 |
| Total | 1,328 (100.0%) | $33,693 |
Earnings by Sex by Income Bracket in Fair Haven
The most common earnings brackets in Fair Haven are $55,000 to $64,999 for men (100 | 15.1%) and $2,500 to $4,999 for women (114 | 17.1%).
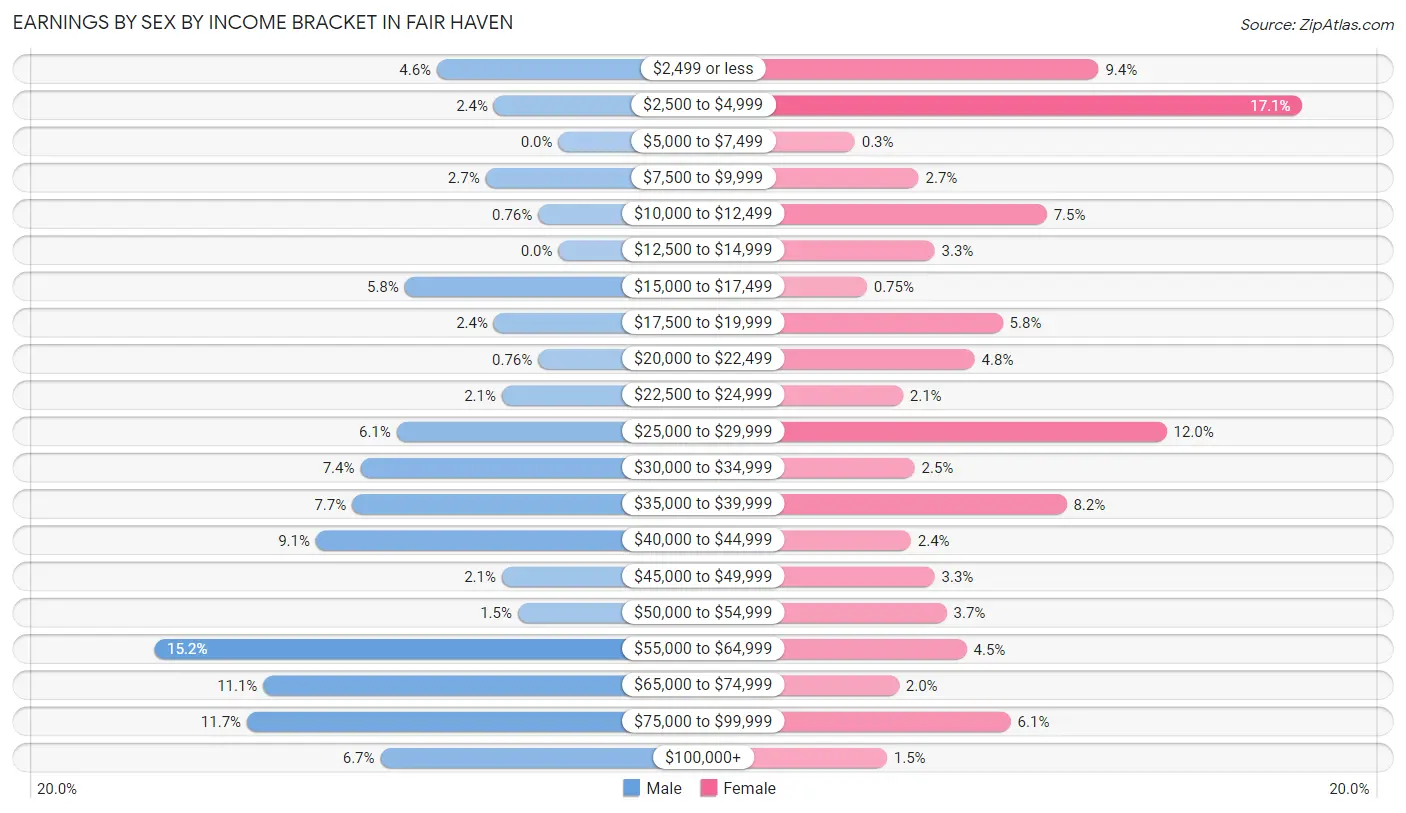
| Income | Male | Female |
| $2,499 or less | 30 (4.5%) | 63 (9.4%) |
| $2,500 to $4,999 | 16 (2.4%) | 114 (17.1%) |
| $5,000 to $7,499 | 0 (0.0%) | 2 (0.3%) |
| $7,500 to $9,999 | 18 (2.7%) | 18 (2.7%) |
| $10,000 to $12,499 | 5 (0.8%) | 50 (7.5%) |
| $12,500 to $14,999 | 0 (0.0%) | 22 (3.3%) |
| $15,000 to $17,499 | 38 (5.8%) | 5 (0.7%) |
| $17,500 to $19,999 | 16 (2.4%) | 39 (5.8%) |
| $20,000 to $22,499 | 5 (0.8%) | 32 (4.8%) |
| $22,500 to $24,999 | 14 (2.1%) | 14 (2.1%) |
| $25,000 to $29,999 | 40 (6.1%) | 80 (12.0%) |
| $30,000 to $34,999 | 49 (7.4%) | 17 (2.5%) |
| $35,000 to $39,999 | 51 (7.7%) | 55 (8.2%) |
| $40,000 to $44,999 | 60 (9.1%) | 16 (2.4%) |
| $45,000 to $49,999 | 14 (2.1%) | 22 (3.3%) |
| $50,000 to $54,999 | 10 (1.5%) | 25 (3.7%) |
| $55,000 to $64,999 | 100 (15.1%) | 30 (4.5%) |
| $65,000 to $74,999 | 73 (11.1%) | 13 (1.9%) |
| $75,000 to $99,999 | 77 (11.7%) | 41 (6.1%) |
| $100,000+ | 44 (6.7%) | 10 (1.5%) |
| Total | 660 (100.0%) | 668 (100.0%) |
Earnings by Sex by Educational Attainment in Fair Haven
Average earnings in Fair Haven are $49,167 for men and $27,331 for women, a difference of 44.4%. Men with an educational attainment of bachelor's degree enjoy the highest average annual earnings of $66,250, while those with high school diploma education earn the least with $44,810. Women with an educational attainment of graduate degree earn the most with the average annual earnings of $49,000, while those with college or associate's degree education have the smallest earnings of $20,195.
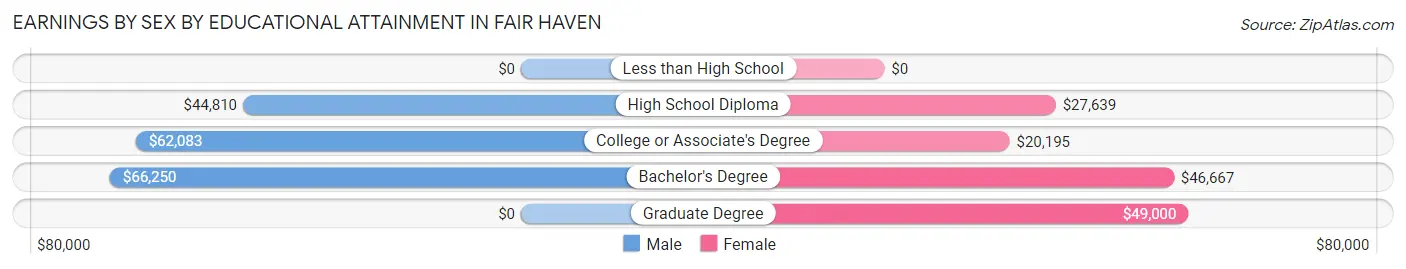
| Educational Attainment | Male Income | Female Income |
| Less than High School | - | - |
| High School Diploma | $44,810 | $27,639 |
| College or Associate's Degree | $62,083 | $20,195 |
| Bachelor's Degree | $66,250 | $46,667 |
| Graduate Degree | - | - |
| Total | $49,167 | $27,331 |
Family Income in Fair Haven
Family Income Brackets in Fair Haven
According to the Fair Haven family income data, there are 151 families falling into the $100,000 to $149,999 income range, which is the most common income bracket and makes up 25.6% of all families. Conversely, the less than $10,000 income bracket is the least frequent group with only 4 families (0.7%) belonging to this category.
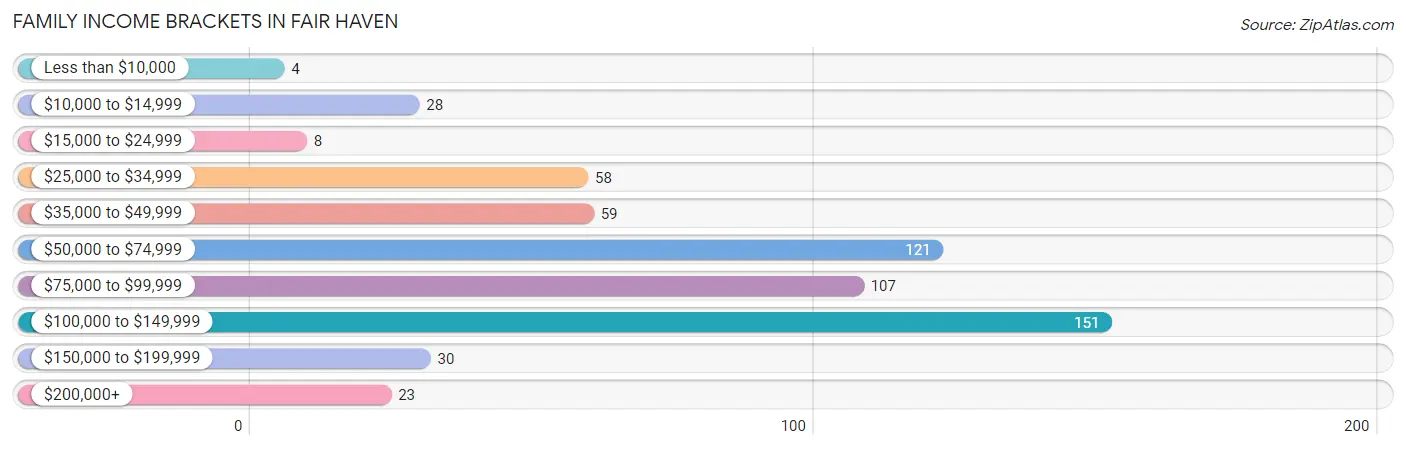
| Income Bracket | # Families | % Families |
| Less than $10,000 | 4 | 0.7% |
| $10,000 to $14,999 | 28 | 4.8% |
| $15,000 to $24,999 | 8 | 1.4% |
| $25,000 to $34,999 | 58 | 9.8% |
| $35,000 to $49,999 | 59 | 10.0% |
| $50,000 to $74,999 | 121 | 20.5% |
| $75,000 to $99,999 | 107 | 18.2% |
| $100,000 to $149,999 | 151 | 25.6% |
| $150,000 to $199,999 | 30 | 5.1% |
| $200,000+ | 23 | 3.9% |
Family Income by Famaliy Size in Fair Haven
3-person families (133 | 22.6%) account for the highest median family income in Fair Haven with $99,018 per family, while 2-person families (297 | 50.4%) have the highest median income of $33,490 per family member.
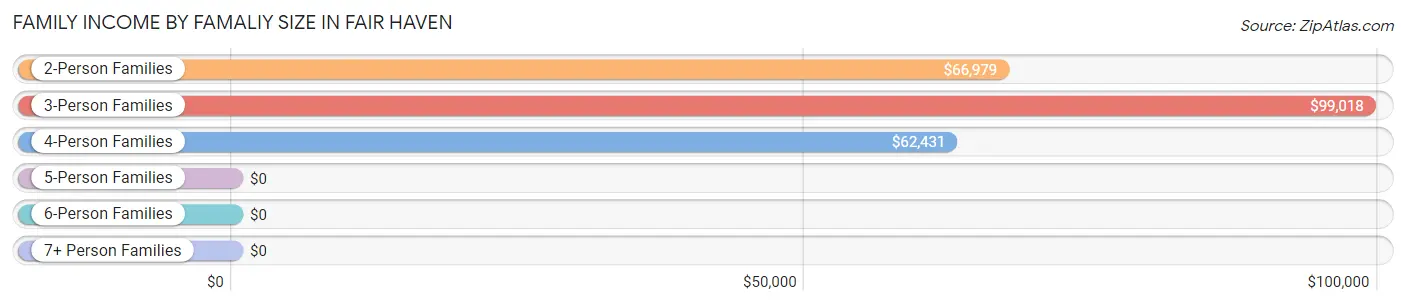
| Income Bracket | # Families | Median Income |
| 2-Person Families | 297 (50.4%) | $66,979 |
| 3-Person Families | 133 (22.6%) | $99,018 |
| 4-Person Families | 127 (21.6%) | $62,431 |
| 5-Person Families | 19 (3.2%) | $0 |
| 6-Person Families | 13 (2.2%) | $0 |
| 7+ Person Families | 0 (0.0%) | $0 |
| Total | 589 (100.0%) | $82,574 |
Family Income by Number of Earners in Fair Haven
The median family income in Fair Haven is $82,574, with families comprising 3+ earners (60) having the highest median family income of $107,273, while families with no earners (91) have the lowest median family income of $47,125, accounting for 10.2% and 15.4% of families, respectively.
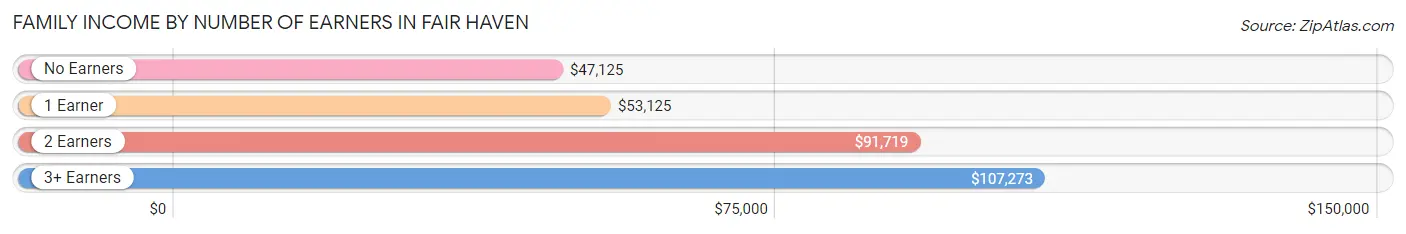
| Number of Earners | # Families | Median Income |
| No Earners | 91 (15.4%) | $47,125 |
| 1 Earner | 131 (22.2%) | $53,125 |
| 2 Earners | 307 (52.1%) | $91,719 |
| 3+ Earners | 60 (10.2%) | $107,273 |
| Total | 589 (100.0%) | $82,574 |
Household Income in Fair Haven
Household Income Brackets in Fair Haven
With 198 households falling in the category, the $50,000 to $74,999 income range is the most frequent in Fair Haven, accounting for 22.7% of all households. In contrast, only 11 households (1.3%) fall into the less than $10,000 income bracket, making it the least populous group.
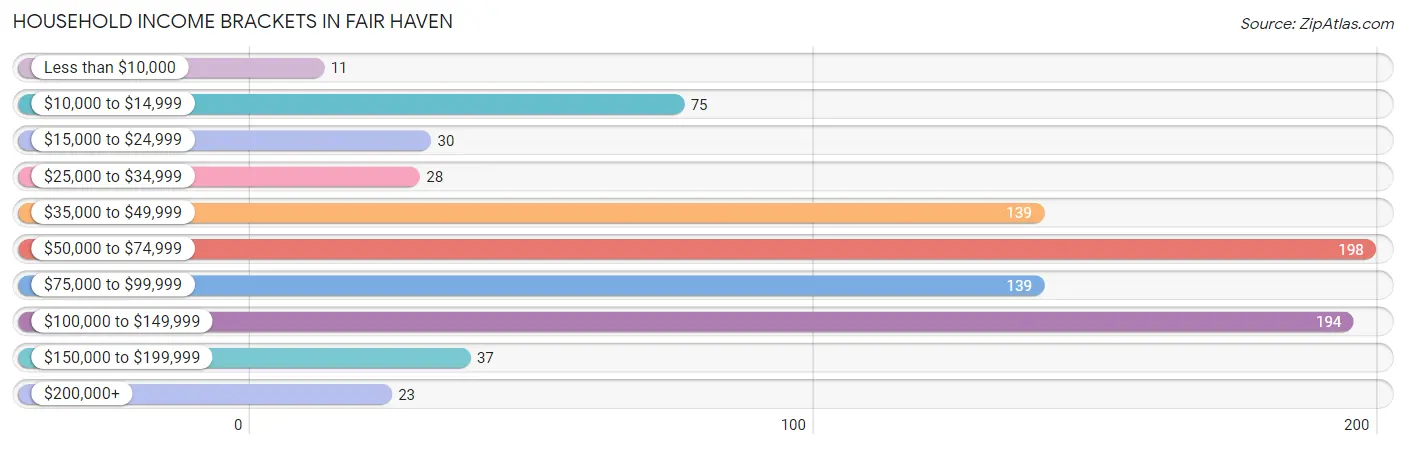
| Income Bracket | # Households | % Households |
| Less than $10,000 | 11 | 1.3% |
| $10,000 to $14,999 | 75 | 8.6% |
| $15,000 to $24,999 | 30 | 3.4% |
| $25,000 to $34,999 | 28 | 3.2% |
| $35,000 to $49,999 | 139 | 15.9% |
| $50,000 to $74,999 | 198 | 22.7% |
| $75,000 to $99,999 | 139 | 15.9% |
| $100,000 to $149,999 | 194 | 22.2% |
| $150,000 to $199,999 | 37 | 4.2% |
| $200,000+ | 23 | 2.6% |
Household Income by Householder Age in Fair Haven
The median household income in Fair Haven is $67,300, with the highest median household income of $83,958 found in the 45 to 64 years age bracket for the primary householder. A total of 337 households (38.6%) fall into this category. Meanwhile, the 15 to 24 years age bracket for the primary householder has the lowest median household income of $0, with 19 households (2.2%) in this group.
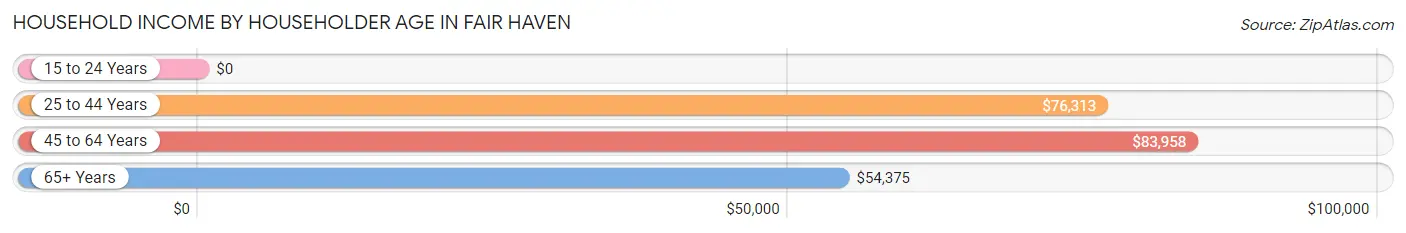
| Income Bracket | # Households | Median Income |
| 15 to 24 Years | 19 (2.2%) | $0 |
| 25 to 44 Years | 277 (31.7%) | $76,313 |
| 45 to 64 Years | 337 (38.6%) | $83,958 |
| 65+ Years | 241 (27.6%) | $54,375 |
| Total | 874 (100.0%) | $67,300 |
Poverty in Fair Haven
Income Below Poverty by Sex and Age in Fair Haven
With 10.2% poverty level for males and 12.6% for females among the residents of Fair Haven, 12 to 14 year old males and 16 and 17 year old females are the most vulnerable to poverty, with 29 males (50.0%) and 29 females (42.0%) in their respective age groups living below the poverty level.
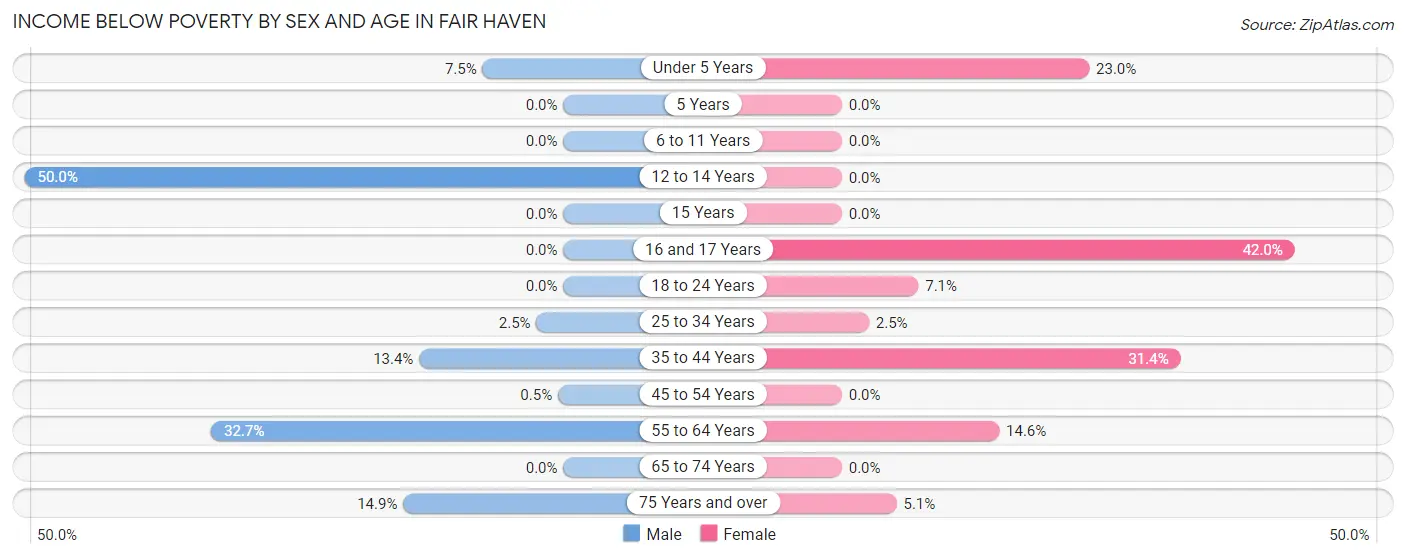
| Age Bracket | Male | Female |
| Under 5 Years | 6 (7.5%) | 14 (23.0%) |
| 5 Years | 0 (0.0%) | 0 (0.0%) |
| 6 to 11 Years | 0 (0.0%) | 0 (0.0%) |
| 12 to 14 Years | 29 (50.0%) | 0 (0.0%) |
| 15 Years | 0 (0.0%) | 0 (0.0%) |
| 16 and 17 Years | 0 (0.0%) | 29 (42.0%) |
| 18 to 24 Years | 0 (0.0%) | 11 (7.1%) |
| 25 to 34 Years | 4 (2.5%) | 5 (2.5%) |
| 35 to 44 Years | 19 (13.4%) | 55 (31.4%) |
| 45 to 54 Years | 1 (0.5%) | 0 (0.0%) |
| 55 to 64 Years | 51 (32.7%) | 33 (14.6%) |
| 65 to 74 Years | 0 (0.0%) | 0 (0.0%) |
| 75 Years and over | 11 (14.9%) | 3 (5.1%) |
| Total | 121 (10.2%) | 150 (12.6%) |
Income Above Poverty by Sex and Age in Fair Haven
According to the poverty statistics in Fair Haven, males aged 5 years and females aged 6 to 11 years are the age groups that are most secure financially, with 100.0% of males and 100.0% of females in these age groups living above the poverty line.
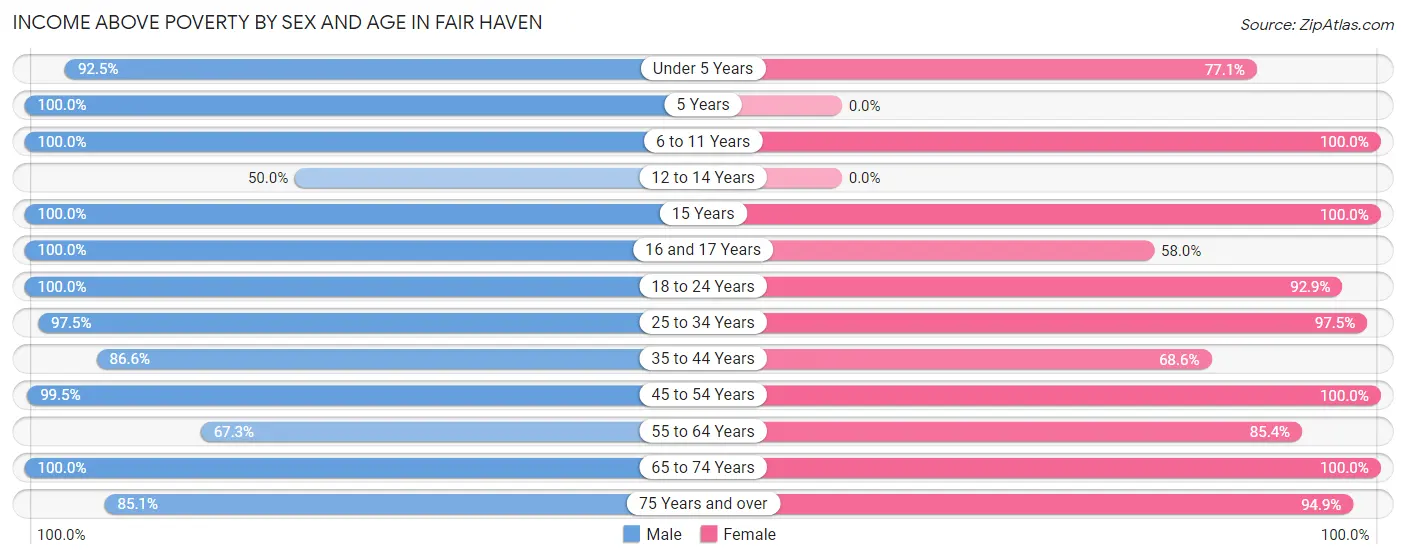
| Age Bracket | Male | Female |
| Under 5 Years | 74 (92.5%) | 47 (77.0%) |
| 5 Years | 3 (100.0%) | 0 (0.0%) |
| 6 to 11 Years | 124 (100.0%) | 65 (100.0%) |
| 12 to 14 Years | 29 (50.0%) | 0 (0.0%) |
| 15 Years | 27 (100.0%) | 9 (100.0%) |
| 16 and 17 Years | 8 (100.0%) | 40 (58.0%) |
| 18 to 24 Years | 50 (100.0%) | 144 (92.9%) |
| 25 to 34 Years | 156 (97.5%) | 194 (97.5%) |
| 35 to 44 Years | 123 (86.6%) | 120 (68.6%) |
| 45 to 54 Years | 200 (99.5%) | 49 (100.0%) |
| 55 to 64 Years | 105 (67.3%) | 193 (85.4%) |
| 65 to 74 Years | 108 (100.0%) | 124 (100.0%) |
| 75 Years and over | 63 (85.1%) | 56 (94.9%) |
| Total | 1,070 (89.8%) | 1,041 (87.4%) |
Income Below Poverty Among Married-Couple Families in Fair Haven
The poverty statistics for married-couple families in Fair Haven show that 8.3% or 33 of the total 400 families live below the poverty line. Families with no children have the highest poverty rate of 12.8%, comprising of 33 families. On the other hand, families with 1 or 2 children have the lowest poverty rate of 0.0%, which includes 0 families.
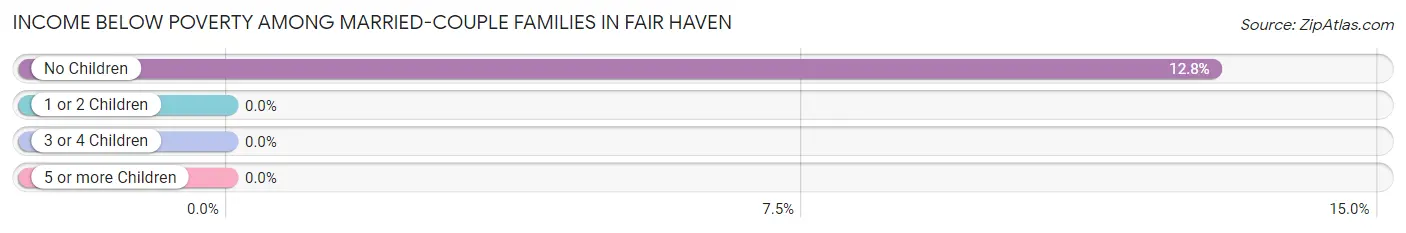
| Children | Above Poverty | Below Poverty |
| No Children | 224 (87.2%) | 33 (12.8%) |
| 1 or 2 Children | 117 (100.0%) | 0 (0.0%) |
| 3 or 4 Children | 26 (100.0%) | 0 (0.0%) |
| 5 or more Children | 0 (0.0%) | 0 (0.0%) |
| Total | 367 (91.7%) | 33 (8.3%) |
Income Below Poverty Among Single-Parent Households in Fair Haven
According to the poverty data in Fair Haven, 3.6% or 4 single-father households and 29.9% or 23 single-mother households are living below the poverty line. Among single-father households, those with 1 or 2 children have the highest poverty rate, with 4 households (17.4%) experiencing poverty. Likewise, among single-mother households, those with 3 or 4 children have the highest poverty rate, with 23 households (71.9%) falling below the poverty line.
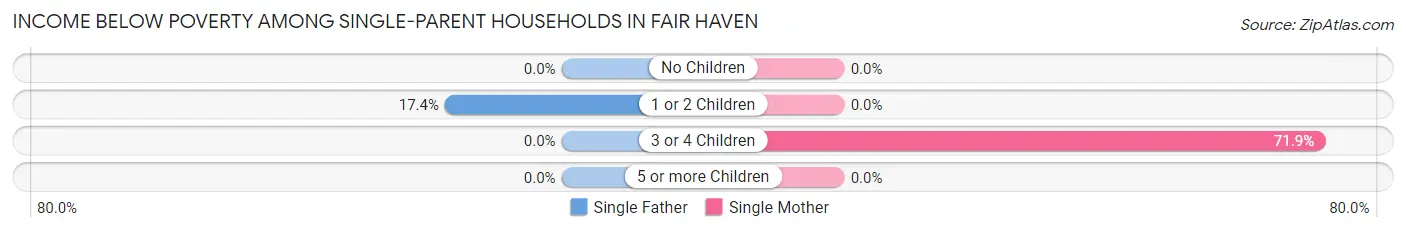
| Children | Single Father | Single Mother |
| No Children | 0 (0.0%) | 0 (0.0%) |
| 1 or 2 Children | 4 (17.4%) | 0 (0.0%) |
| 3 or 4 Children | 0 (0.0%) | 23 (71.9%) |
| 5 or more Children | 0 (0.0%) | 0 (0.0%) |
| Total | 4 (3.6%) | 23 (29.9%) |
Income Below Poverty Among Married-Couple vs Single-Parent Households in Fair Haven
The poverty data for Fair Haven shows that 33 of the married-couple family households (8.3%) and 27 of the single-parent households (14.3%) are living below the poverty level. Within the married-couple family households, those with no children have the highest poverty rate, with 33 households (12.8%) falling below the poverty line. Among the single-parent households, those with 3 or 4 children have the highest poverty rate, with 23 household (50.0%) living below poverty.
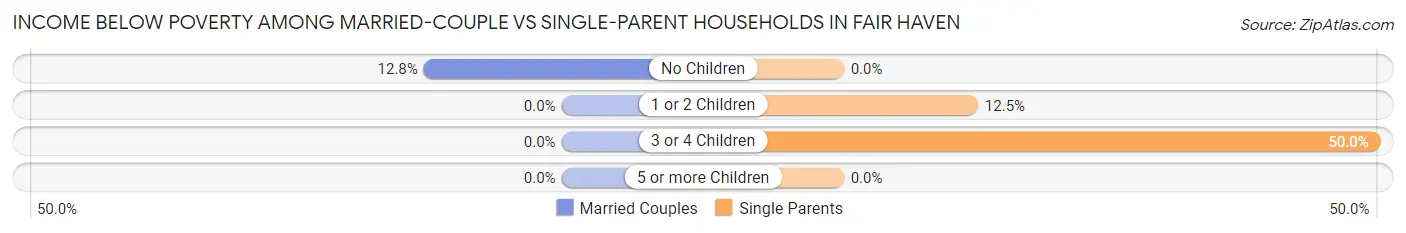
| Children | Married-Couple Families | Single-Parent Households |
| No Children | 33 (12.8%) | 0 (0.0%) |
| 1 or 2 Children | 0 (0.0%) | 4 (12.5%) |
| 3 or 4 Children | 0 (0.0%) | 23 (50.0%) |
| 5 or more Children | 0 (0.0%) | 0 (0.0%) |
| Total | 33 (8.3%) | 27 (14.3%) |
Employment Characteristics in Fair Haven
Employment by Class of Employer in Fair Haven
Among the 1,186 employed individuals in Fair Haven, private company employees (871 | 73.4%), not-for-profit organizations (92 | 7.8%), and self-employed (not incorporated) (72 | 6.1%) make up the most common classes of employment.
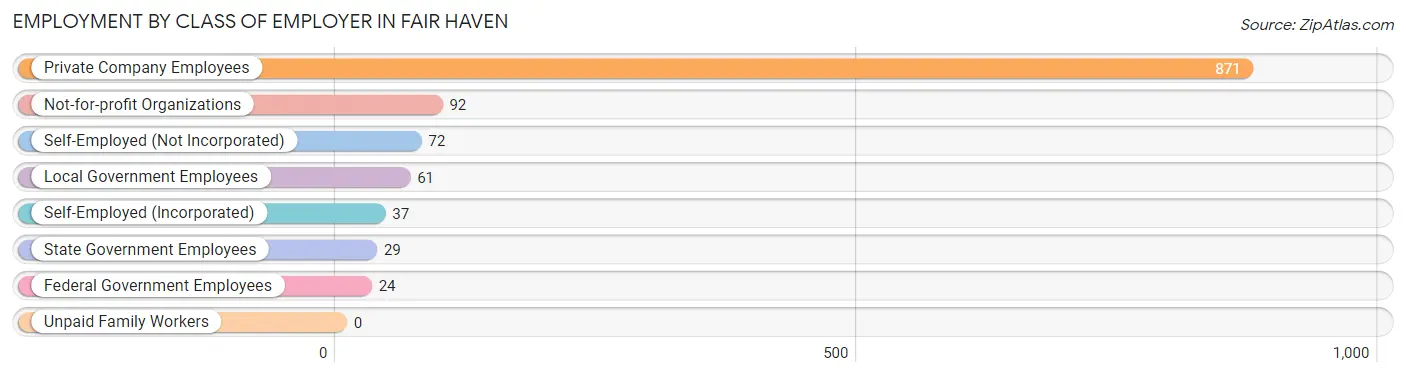
| Employer Class | # Employees | % Employees |
| Private Company Employees | 871 | 73.4% |
| Self-Employed (Incorporated) | 37 | 3.1% |
| Self-Employed (Not Incorporated) | 72 | 6.1% |
| Not-for-profit Organizations | 92 | 7.8% |
| Local Government Employees | 61 | 5.1% |
| State Government Employees | 29 | 2.5% |
| Federal Government Employees | 24 | 2.0% |
| Unpaid Family Workers | 0 | 0.0% |
| Total | 1,186 | 100.0% |
Employment Status by Age in Fair Haven
According to the labor force statistics for Fair Haven, out of the total population over 16 years of age (1,955), 64.5% or 1,261 individuals are in the labor force, with 3.5% or 44 of them unemployed. The age group with the highest labor force participation rate is 45 to 54 years, with 97.6% or 244 individuals in the labor force. Within the labor force, the 65 to 74 years age range has the highest percentage of unemployed individuals, with 18.5% or 15 of them being unemployed.
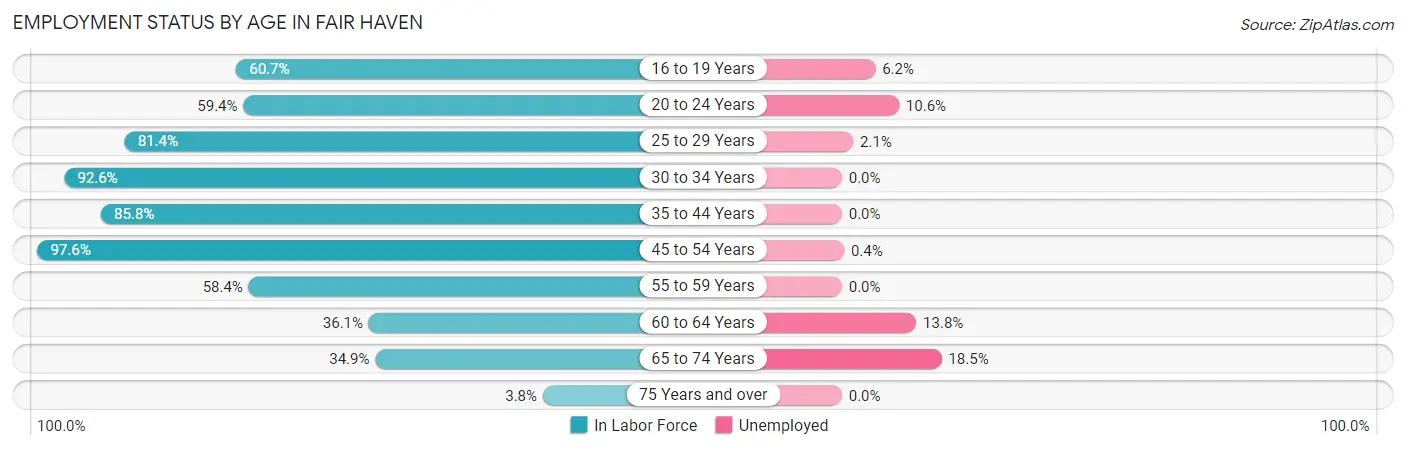
| Age Bracket | In Labor Force | Unemployed |
| 16 to 19 Years | 65 (60.7%) | 4 (6.2%) |
| 20 to 24 Years | 104 (59.4%) | 11 (10.6%) |
| 25 to 29 Years | 193 (81.4%) | 4 (2.1%) |
| 30 to 34 Years | 113 (92.6%) | 0 (0.0%) |
| 35 to 44 Years | 272 (85.8%) | 0 (0.0%) |
| 45 to 54 Years | 244 (97.6%) | 1 (0.4%) |
| 55 to 59 Years | 118 (58.4%) | 0 (0.0%) |
| 60 to 64 Years | 65 (36.1%) | 9 (13.8%) |
| 65 to 74 Years | 81 (34.9%) | 15 (18.5%) |
| 75 Years and over | 5 (3.8%) | 0 (0.0%) |
| Total | 1,261 (64.5%) | 44 (3.5%) |
Employment Status by Educational Attainment in Fair Haven
According to labor force statistics for Fair Haven, 76.8% of individuals (1,005) out of the total population between 25 and 64 years of age (1,308) are in the labor force, with 1.4% or 14 of them being unemployed. The group with the highest labor force participation rate are those with the educational attainment of bachelor's degree or higher, with 95.3% or 183 individuals in the labor force. Within the labor force, individuals with less than high school education have the highest percentage of unemployment, with 15.4% or 4 of them being unemployed.
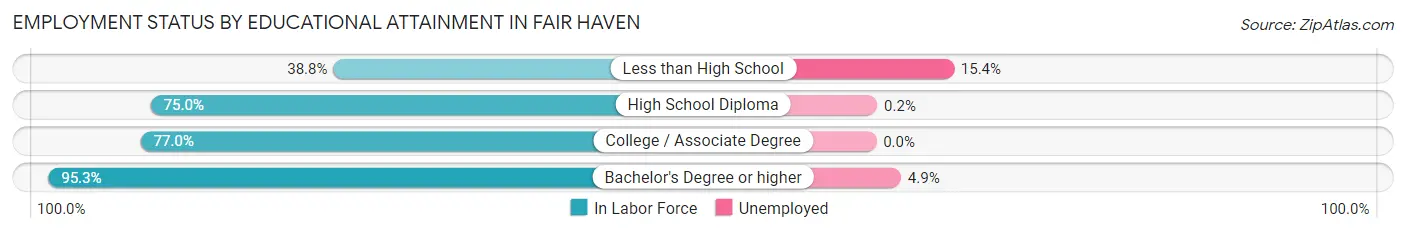
| Educational Attainment | In Labor Force | Unemployed |
| Less than High School | 26 (38.8%) | 10 (15.4%) |
| High School Diploma | 445 (75.0%) | 1 (0.2%) |
| College / Associate Degree | 351 (77.0%) | 0 (0.0%) |
| Bachelor's Degree or higher | 183 (95.3%) | 9 (4.9%) |
| Total | 1,005 (76.8%) | 18 (1.4%) |
Employment Occupations by Sex in Fair Haven
Management, Business, Science and Arts Occupations
The most common Management, Business, Science and Arts occupations in Fair Haven are Management (95 | 7.8%), Community & Social Service (93 | 7.6%), Education Instruction & Library (50 | 4.1%), Business & Financial (35 | 2.9%), and Health Diagnosing & Treating (28 | 2.3%).
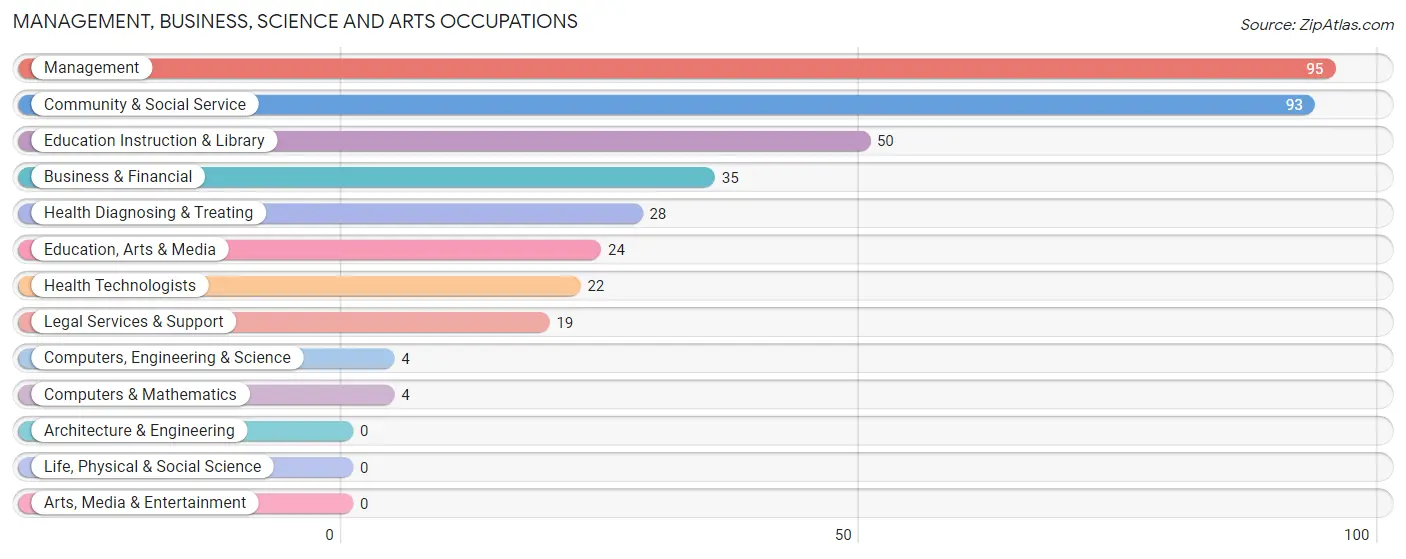
Management, Business, Science and Arts Occupations by Sex
Within the Management, Business, Science and Arts occupations in Fair Haven, the most male-oriented occupations are Computers, Engineering & Science (100.0%), Computers & Mathematics (100.0%), and Management (88.4%), while the most female-oriented occupations are Education, Arts & Media (100.0%), Legal Services & Support (100.0%), and Health Diagnosing & Treating (100.0%).
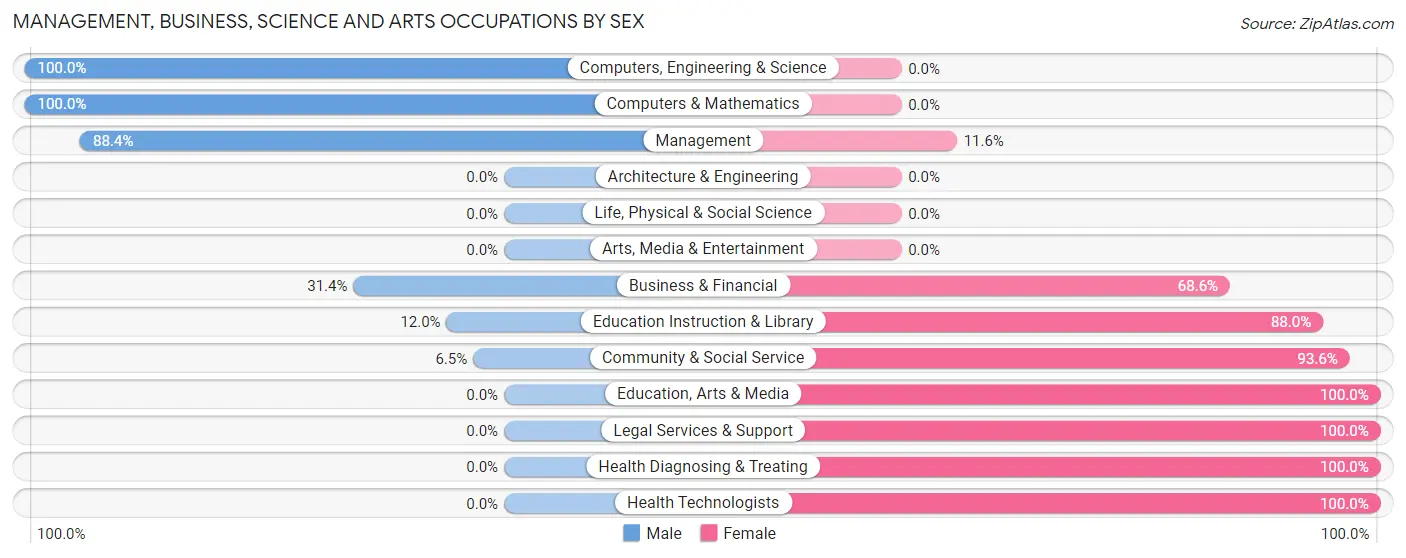
| Occupation | Male | Female |
| Management | 84 (88.4%) | 11 (11.6%) |
| Business & Financial | 11 (31.4%) | 24 (68.6%) |
| Computers, Engineering & Science | 4 (100.0%) | 0 (0.0%) |
| Computers & Mathematics | 4 (100.0%) | 0 (0.0%) |
| Architecture & Engineering | 0 (0.0%) | 0 (0.0%) |
| Life, Physical & Social Science | 0 (0.0%) | 0 (0.0%) |
| Community & Social Service | 6 (6.5%) | 87 (93.5%) |
| Education, Arts & Media | 0 (0.0%) | 24 (100.0%) |
| Legal Services & Support | 0 (0.0%) | 19 (100.0%) |
| Education Instruction & Library | 6 (12.0%) | 44 (88.0%) |
| Arts, Media & Entertainment | 0 (0.0%) | 0 (0.0%) |
| Health Diagnosing & Treating | 0 (0.0%) | 28 (100.0%) |
| Health Technologists | 0 (0.0%) | 22 (100.0%) |
| Total (Category) | 105 (41.2%) | 150 (58.8%) |
| Total (Overall) | 606 (49.8%) | 610 (50.2%) |
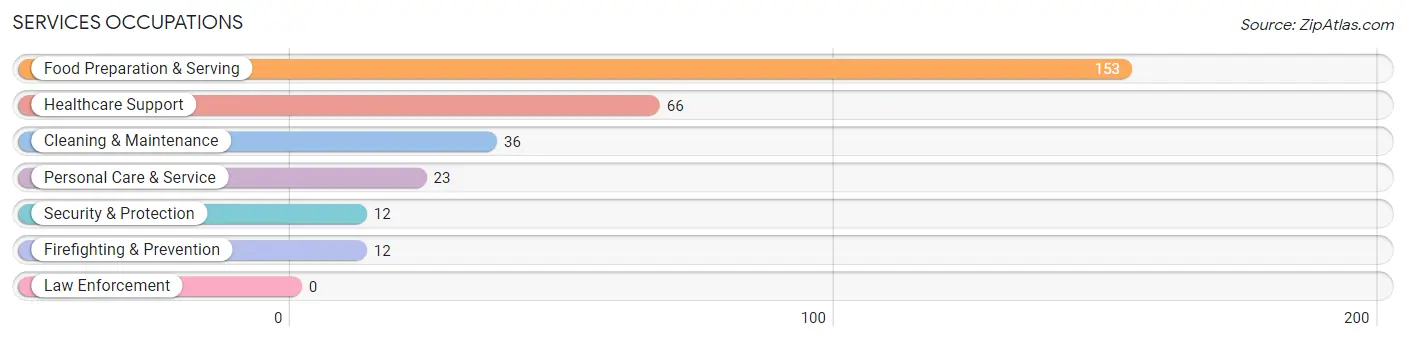
Services Occupations
The most common Services occupations in Fair Haven are Food Preparation & Serving (153 | 12.6%), Healthcare Support (66 | 5.4%), Cleaning & Maintenance (36 | 3.0%), Personal Care & Service (23 | 1.9%), and Security & Protection (12 | 1.0%).
Services Occupations by Sex
Within the Services occupations in Fair Haven, the most male-oriented occupations are Security & Protection (100.0%), Firefighting & Prevention (100.0%), and Food Preparation & Serving (26.8%), while the most female-oriented occupations are Personal Care & Service (100.0%), Healthcare Support (78.8%), and Cleaning & Maintenance (75.0%).
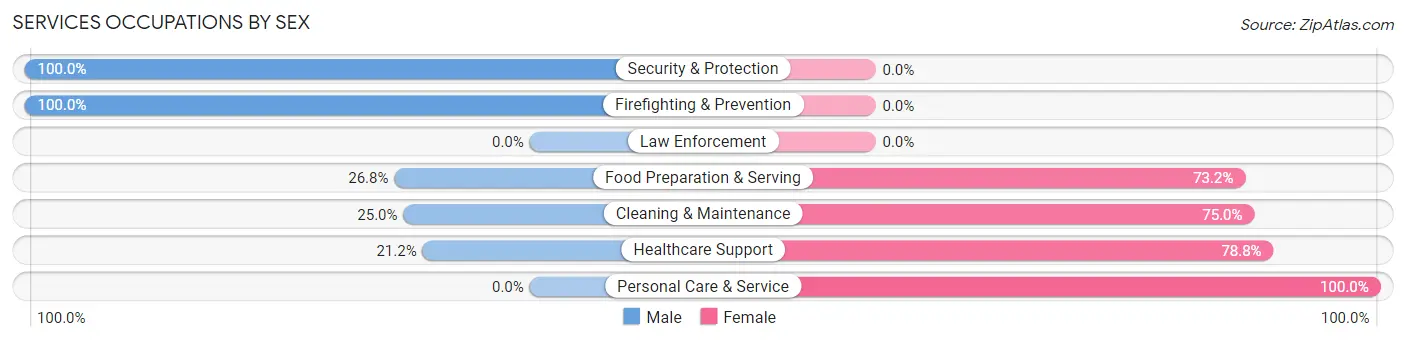
| Occupation | Male | Female |
| Healthcare Support | 14 (21.2%) | 52 (78.8%) |
| Security & Protection | 12 (100.0%) | 0 (0.0%) |
| Firefighting & Prevention | 12 (100.0%) | 0 (0.0%) |
| Law Enforcement | 0 (0.0%) | 0 (0.0%) |
| Food Preparation & Serving | 41 (26.8%) | 112 (73.2%) |
| Cleaning & Maintenance | 9 (25.0%) | 27 (75.0%) |
| Personal Care & Service | 0 (0.0%) | 23 (100.0%) |
| Total (Category) | 76 (26.2%) | 214 (73.8%) |
| Total (Overall) | 606 (49.8%) | 610 (50.2%) |
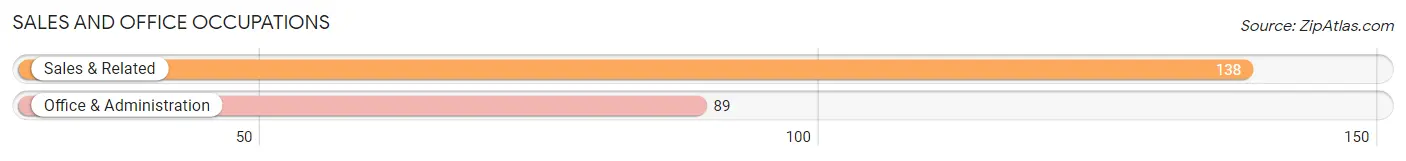
Sales and Office Occupations
The most common Sales and Office occupations in Fair Haven are Sales & Related (138 | 11.4%), and Office & Administration (89 | 7.3%).
Sales and Office Occupations by Sex
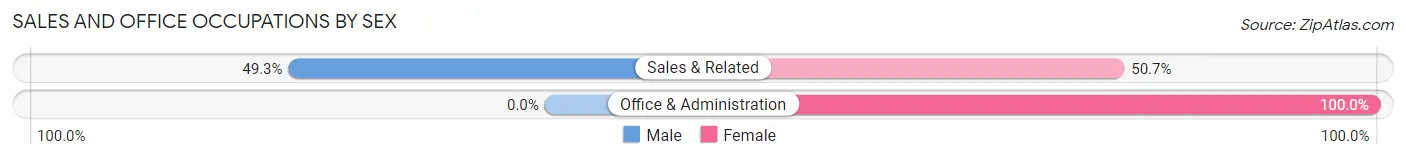
| Occupation | Male | Female |
| Sales & Related | 68 (49.3%) | 70 (50.7%) |
| Office & Administration | 0 (0.0%) | 89 (100.0%) |
| Total (Category) | 68 (30.0%) | 159 (70.0%) |
| Total (Overall) | 606 (49.8%) | 610 (50.2%) |
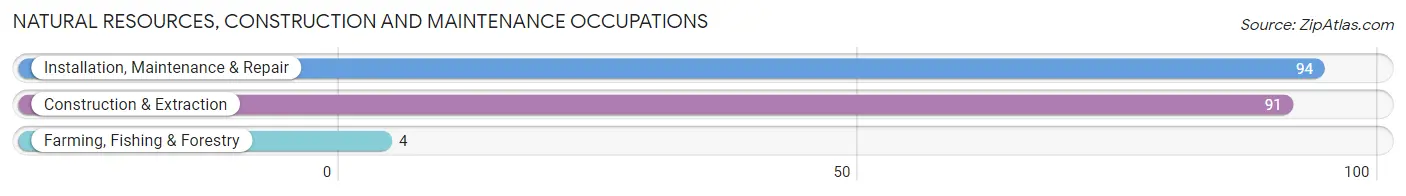
Natural Resources, Construction and Maintenance Occupations
The most common Natural Resources, Construction and Maintenance occupations in Fair Haven are Installation, Maintenance & Repair (94 | 7.7%), Construction & Extraction (91 | 7.5%), and Farming, Fishing & Forestry (4 | 0.3%).
Natural Resources, Construction and Maintenance Occupations by Sex
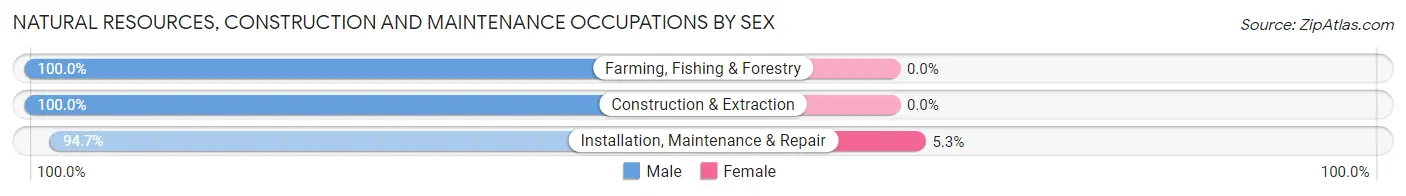
| Occupation | Male | Female |
| Farming, Fishing & Forestry | 4 (100.0%) | 0 (0.0%) |
| Construction & Extraction | 91 (100.0%) | 0 (0.0%) |
| Installation, Maintenance & Repair | 89 (94.7%) | 5 (5.3%) |
| Total (Category) | 184 (97.4%) | 5 (2.6%) |
| Total (Overall) | 606 (49.8%) | 610 (50.2%) |
Production, Transportation and Moving Occupations
The most common Production, Transportation and Moving occupations in Fair Haven are Production (118 | 9.7%), Material Moving (99 | 8.1%), and Transportation (38 | 3.1%).
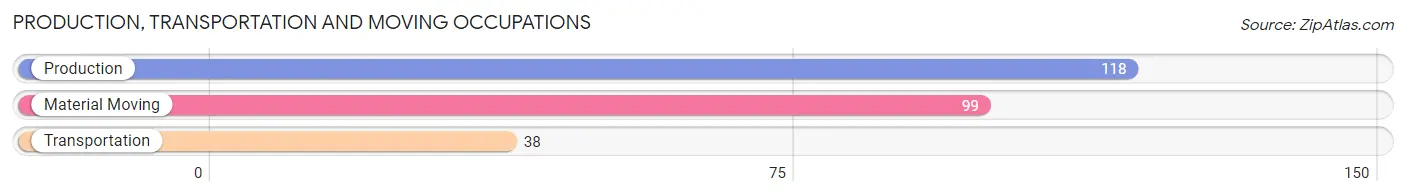
Production, Transportation and Moving Occupations by Sex
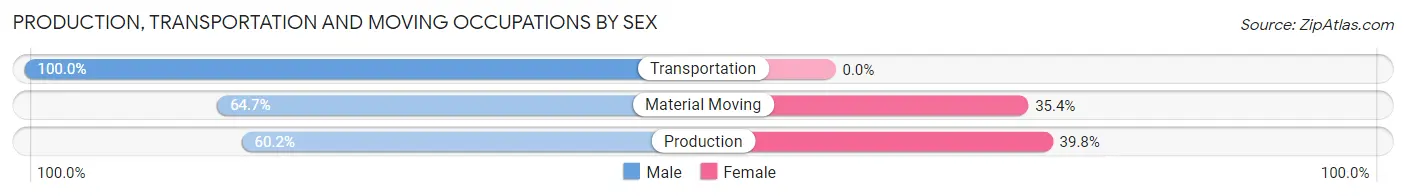
| Occupation | Male | Female |
| Production | 71 (60.2%) | 47 (39.8%) |
| Transportation | 38 (100.0%) | 0 (0.0%) |
| Material Moving | 64 (64.6%) | 35 (35.3%) |
| Total (Category) | 173 (67.8%) | 82 (32.2%) |
| Total (Overall) | 606 (49.8%) | 610 (50.2%) |
Employment Industries by Sex in Fair Haven
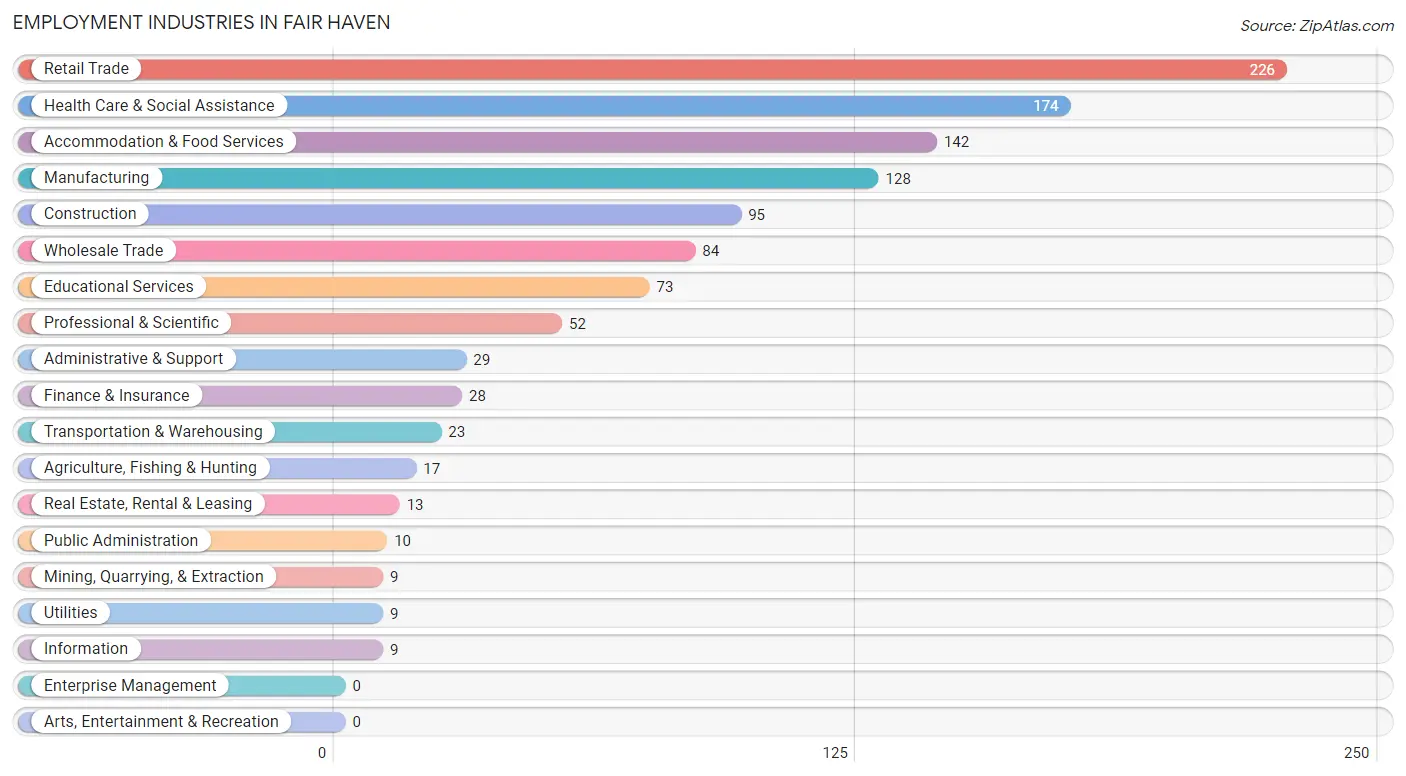
Employment Industries in Fair Haven
The major employment industries in Fair Haven include Retail Trade (226 | 18.6%), Health Care & Social Assistance (174 | 14.3%), Accommodation & Food Services (142 | 11.7%), Manufacturing (128 | 10.5%), and Construction (95 | 7.8%).
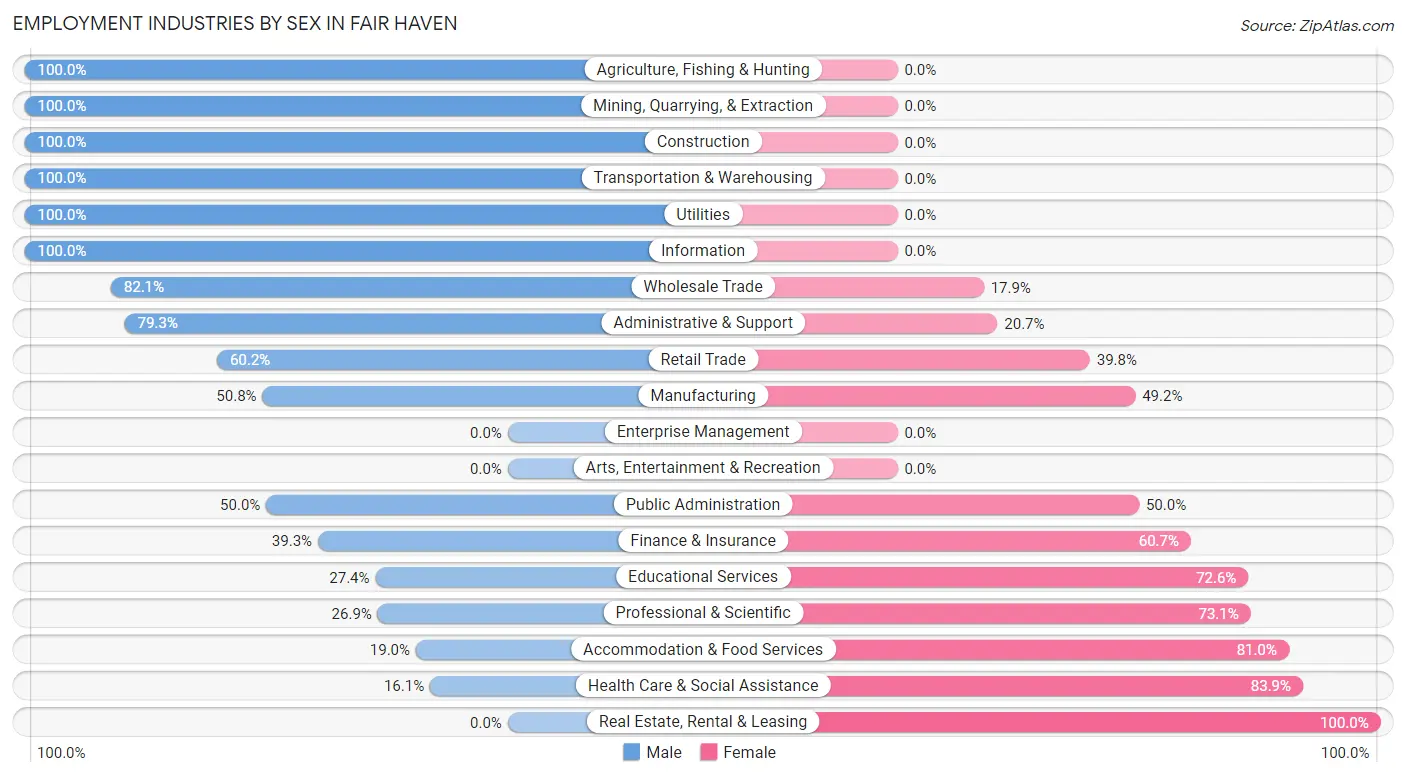
Employment Industries by Sex in Fair Haven
The Fair Haven industries that see more men than women are Agriculture, Fishing & Hunting (100.0%), Mining, Quarrying, & Extraction (100.0%), and Construction (100.0%), whereas the industries that tend to have a higher number of women are Real Estate, Rental & Leasing (100.0%), Health Care & Social Assistance (83.9%), and Accommodation & Food Services (81.0%).
| Industry | Male | Female |
| Agriculture, Fishing & Hunting | 17 (100.0%) | 0 (0.0%) |
| Mining, Quarrying, & Extraction | 9 (100.0%) | 0 (0.0%) |
| Construction | 95 (100.0%) | 0 (0.0%) |
| Manufacturing | 65 (50.8%) | 63 (49.2%) |
| Wholesale Trade | 69 (82.1%) | 15 (17.9%) |
| Retail Trade | 136 (60.2%) | 90 (39.8%) |
| Transportation & Warehousing | 23 (100.0%) | 0 (0.0%) |
| Utilities | 9 (100.0%) | 0 (0.0%) |
| Information | 9 (100.0%) | 0 (0.0%) |
| Finance & Insurance | 11 (39.3%) | 17 (60.7%) |
| Real Estate, Rental & Leasing | 0 (0.0%) | 13 (100.0%) |
| Professional & Scientific | 14 (26.9%) | 38 (73.1%) |
| Enterprise Management | 0 (0.0%) | 0 (0.0%) |
| Administrative & Support | 23 (79.3%) | 6 (20.7%) |
| Educational Services | 20 (27.4%) | 53 (72.6%) |
| Health Care & Social Assistance | 28 (16.1%) | 146 (83.9%) |
| Arts, Entertainment & Recreation | 0 (0.0%) | 0 (0.0%) |
| Accommodation & Food Services | 27 (19.0%) | 115 (81.0%) |
| Public Administration | 5 (50.0%) | 5 (50.0%) |
| Total | 606 (49.8%) | 610 (50.2%) |
Education in Fair Haven
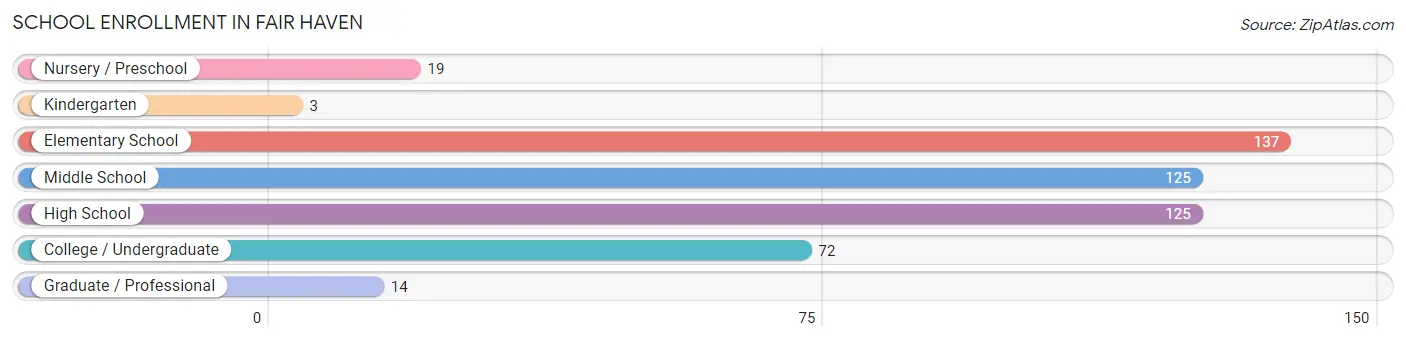
School Enrollment in Fair Haven
The most common levels of schooling among the 495 students in Fair Haven are elementary school (137 | 27.7%), middle school (125 | 25.3%), and high school (125 | 25.3%).
| School Level | # Students | % Students |
| Nursery / Preschool | 19 | 3.8% |
| Kindergarten | 3 | 0.6% |
| Elementary School | 137 | 27.7% |
| Middle School | 125 | 25.3% |
| High School | 125 | 25.3% |
| College / Undergraduate | 72 | 14.5% |
| Graduate / Professional | 14 | 2.8% |
| Total | 495 | 100.0% |
School Enrollment by Age by Funding Source in Fair Haven
Out of a total of 495 students who are enrolled in schools in Fair Haven, 77 (15.6%) attend a private institution, while the remaining 418 (84.4%) are enrolled in public schools. The age group of 35 years and over has the highest likelihood of being enrolled in private schools, with 15 (51.7% in the age bracket) enrolled. Conversely, the age group of 3 to 4 year olds has the lowest likelihood of being enrolled in a private school, with 19 (100.0% in the age bracket) attending a public institution.
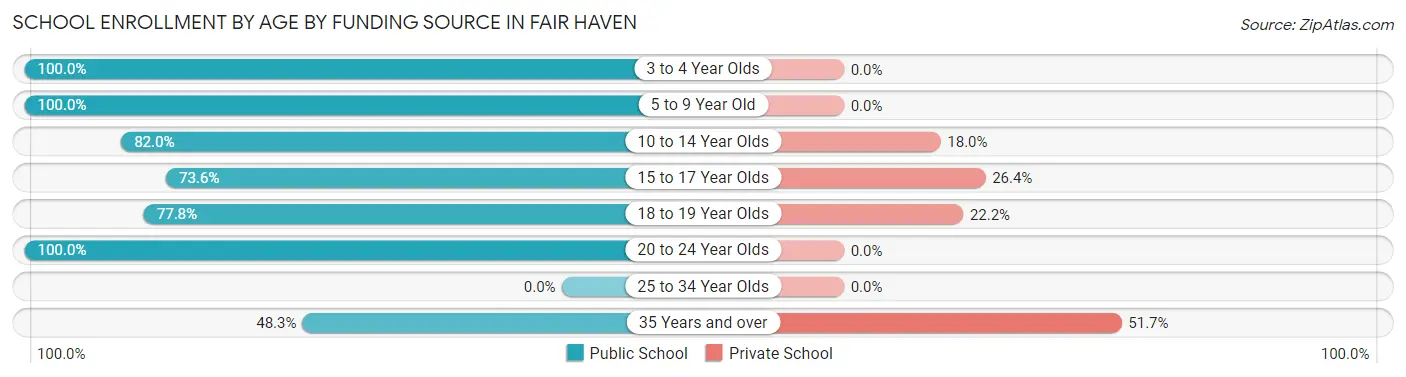
| Age Bracket | Public School | Private School |
| 3 to 4 Year Olds | 19 (100.0%) | 0 (0.0%) |
| 5 to 9 Year Old | 104 (100.0%) | 0 (0.0%) |
| 10 to 14 Year Olds | 132 (82.0%) | 29 (18.0%) |
| 15 to 17 Year Olds | 81 (73.6%) | 29 (26.4%) |
| 18 to 19 Year Olds | 14 (77.8%) | 4 (22.2%) |
| 20 to 24 Year Olds | 54 (100.0%) | 0 (0.0%) |
| 25 to 34 Year Olds | 0 (0.0%) | 0 (0.0%) |
| 35 Years and over | 14 (48.3%) | 15 (51.7%) |
| Total | 418 (84.4%) | 77 (15.6%) |
Educational Attainment by Field of Study in Fair Haven
Business (86 | 26.5%), education (72 | 22.2%), science & technology (50 | 15.4%), bio, nature & agricultural (26 | 8.0%), and liberal arts & history (21 | 6.5%) are the most common fields of study among 325 individuals in Fair Haven who have obtained a bachelor's degree or higher.
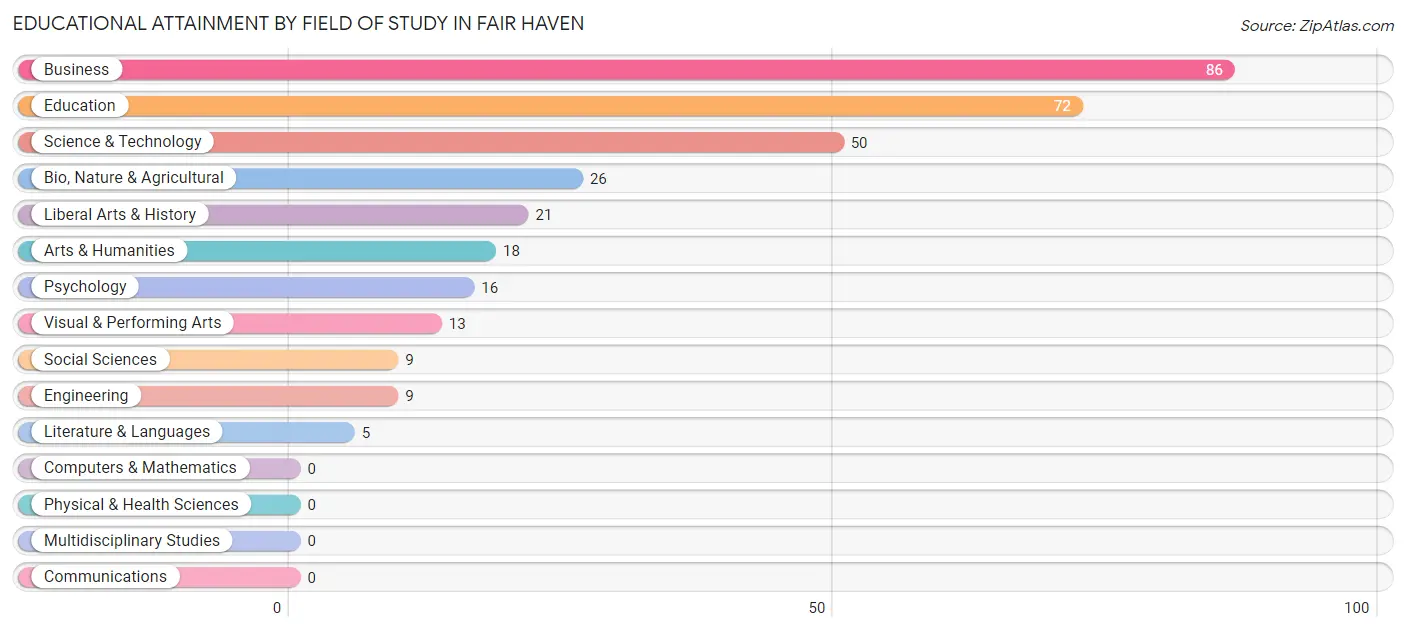
| Field of Study | # Graduates | % Graduates |
| Computers & Mathematics | 0 | 0.0% |
| Bio, Nature & Agricultural | 26 | 8.0% |
| Physical & Health Sciences | 0 | 0.0% |
| Psychology | 16 | 4.9% |
| Social Sciences | 9 | 2.8% |
| Engineering | 9 | 2.8% |
| Multidisciplinary Studies | 0 | 0.0% |
| Science & Technology | 50 | 15.4% |
| Business | 86 | 26.5% |
| Education | 72 | 22.2% |
| Literature & Languages | 5 | 1.5% |
| Liberal Arts & History | 21 | 6.5% |
| Visual & Performing Arts | 13 | 4.0% |
| Communications | 0 | 0.0% |
| Arts & Humanities | 18 | 5.5% |
| Total | 325 | 100.0% |
Transportation & Commute in Fair Haven
Vehicle Availability by Sex in Fair Haven
The most prevalent vehicle ownership categories in Fair Haven are males with 2 vehicles (219, accounting for 37.1%) and females with 2 vehicles (320, making up 36.7%).
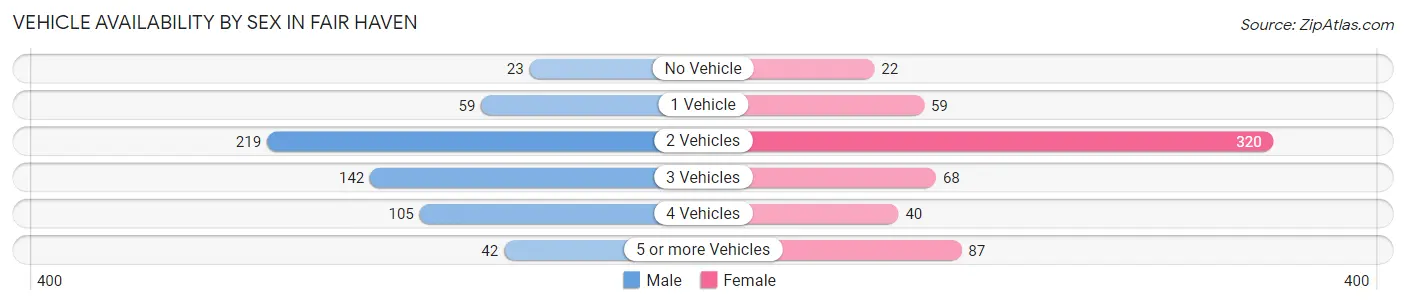
| Vehicles Available | Male | Female |
| No Vehicle | 23 (3.9%) | 22 (3.7%) |
| 1 Vehicle | 59 (10.0%) | 59 (9.9%) |
| 2 Vehicles | 219 (37.1%) | 320 (53.7%) |
| 3 Vehicles | 142 (24.1%) | 68 (11.4%) |
| 4 Vehicles | 105 (17.8%) | 40 (6.7%) |
| 5 or more Vehicles | 42 (7.1%) | 87 (14.6%) |
| Total | 590 (100.0%) | 596 (100.0%) |
Commute Time in Fair Haven
The most frequently occuring commute durations in Fair Haven are 30 to 34 minutes (159 commuters, 14.1%), 25 to 29 minutes (139 commuters, 12.3%), and 5 to 9 minutes (123 commuters, 10.9%).
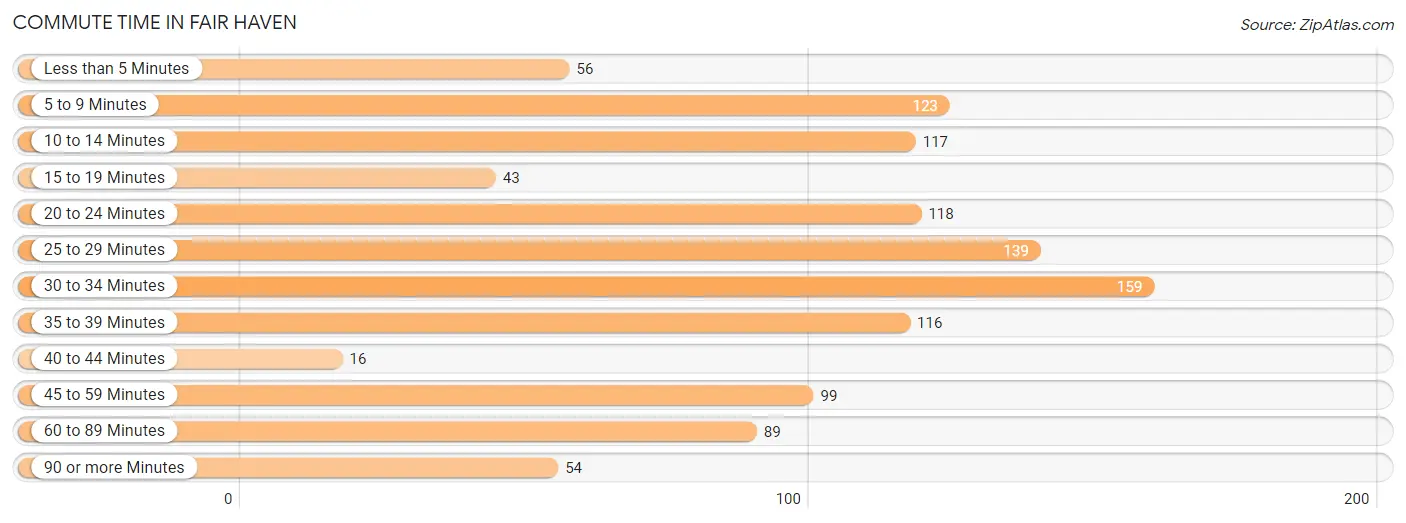
| Commute Time | # Commuters | % Commuters |
| Less than 5 Minutes | 56 | 5.0% |
| 5 to 9 Minutes | 123 | 10.9% |
| 10 to 14 Minutes | 117 | 10.4% |
| 15 to 19 Minutes | 43 | 3.8% |
| 20 to 24 Minutes | 118 | 10.4% |
| 25 to 29 Minutes | 139 | 12.3% |
| 30 to 34 Minutes | 159 | 14.1% |
| 35 to 39 Minutes | 116 | 10.3% |
| 40 to 44 Minutes | 16 | 1.4% |
| 45 to 59 Minutes | 99 | 8.8% |
| 60 to 89 Minutes | 89 | 7.9% |
| 90 or more Minutes | 54 | 4.8% |
Commute Time by Sex in Fair Haven
The most common commute times in Fair Haven are 35 to 39 minutes (100 commuters, 17.6%) for males and 20 to 24 minutes (113 commuters, 20.1%) for females.
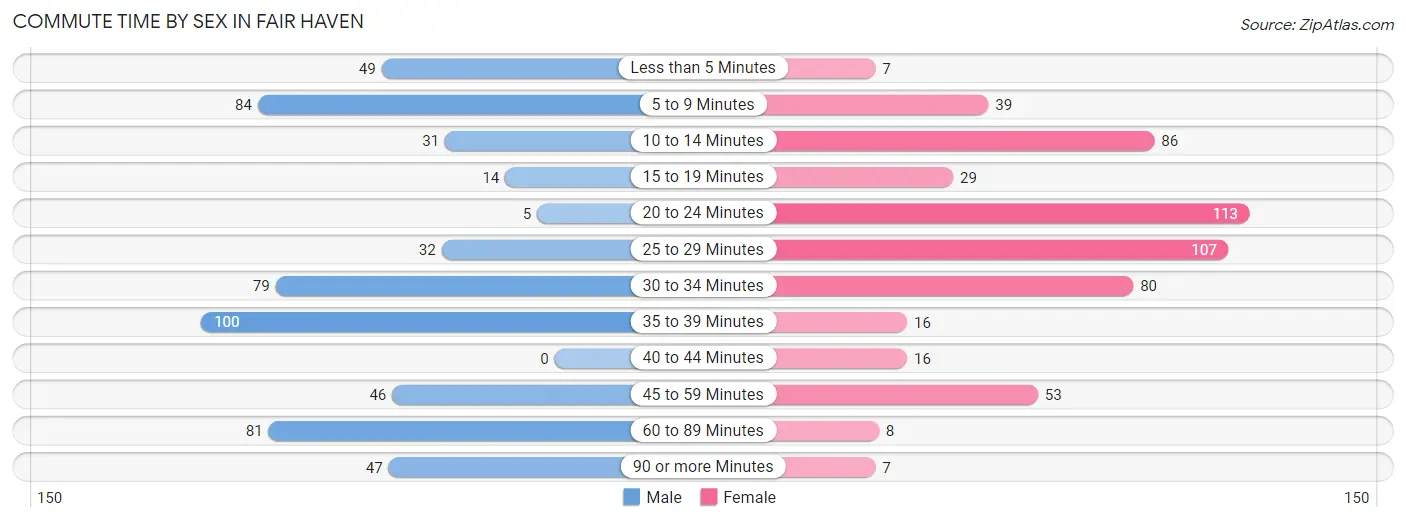
| Commute Time | Male | Female |
| Less than 5 Minutes | 49 (8.6%) | 7 (1.3%) |
| 5 to 9 Minutes | 84 (14.8%) | 39 (7.0%) |
| 10 to 14 Minutes | 31 (5.5%) | 86 (15.3%) |
| 15 to 19 Minutes | 14 (2.5%) | 29 (5.2%) |
| 20 to 24 Minutes | 5 (0.9%) | 113 (20.1%) |
| 25 to 29 Minutes | 32 (5.6%) | 107 (19.1%) |
| 30 to 34 Minutes | 79 (13.9%) | 80 (14.3%) |
| 35 to 39 Minutes | 100 (17.6%) | 16 (2.9%) |
| 40 to 44 Minutes | 0 (0.0%) | 16 (2.9%) |
| 45 to 59 Minutes | 46 (8.1%) | 53 (9.5%) |
| 60 to 89 Minutes | 81 (14.3%) | 8 (1.4%) |
| 90 or more Minutes | 47 (8.3%) | 7 (1.3%) |
Time of Departure to Work by Sex in Fair Haven
The most frequent times of departure to work in Fair Haven are 7:00 AM to 7:29 AM (164, 28.9%) for males and 7:00 AM to 7:29 AM (118, 21.0%) for females.
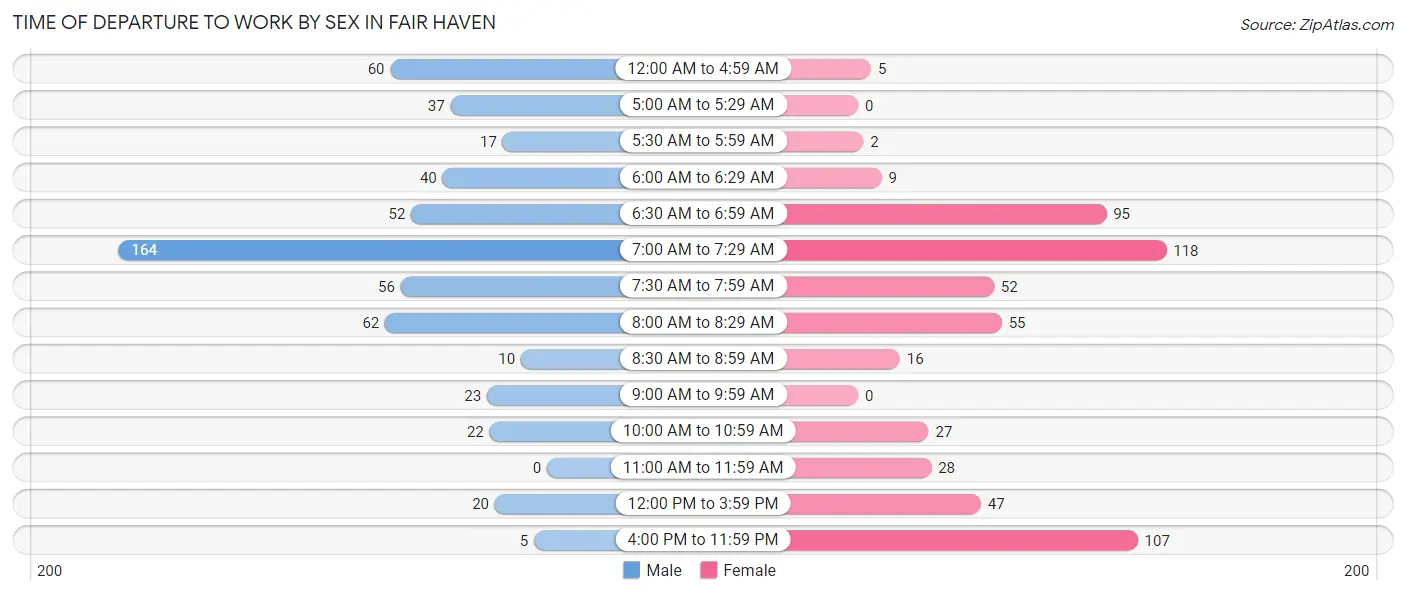
| Time of Departure | Male | Female |
| 12:00 AM to 4:59 AM | 60 (10.6%) | 5 (0.9%) |
| 5:00 AM to 5:29 AM | 37 (6.5%) | 0 (0.0%) |
| 5:30 AM to 5:59 AM | 17 (3.0%) | 2 (0.4%) |
| 6:00 AM to 6:29 AM | 40 (7.0%) | 9 (1.6%) |
| 6:30 AM to 6:59 AM | 52 (9.1%) | 95 (16.9%) |
| 7:00 AM to 7:29 AM | 164 (28.9%) | 118 (21.0%) |
| 7:30 AM to 7:59 AM | 56 (9.9%) | 52 (9.3%) |
| 8:00 AM to 8:29 AM | 62 (10.9%) | 55 (9.8%) |
| 8:30 AM to 8:59 AM | 10 (1.8%) | 16 (2.9%) |
| 9:00 AM to 9:59 AM | 23 (4.1%) | 0 (0.0%) |
| 10:00 AM to 10:59 AM | 22 (3.9%) | 27 (4.8%) |
| 11:00 AM to 11:59 AM | 0 (0.0%) | 28 (5.0%) |
| 12:00 PM to 3:59 PM | 20 (3.5%) | 47 (8.4%) |
| 4:00 PM to 11:59 PM | 5 (0.9%) | 107 (19.1%) |
| Total | 568 (100.0%) | 561 (100.0%) |
Housing Occupancy in Fair Haven
Occupancy by Ownership in Fair Haven
Of the total 874 dwellings in Fair Haven, owner-occupied units account for 670 (76.7%), while renter-occupied units make up 204 (23.3%).
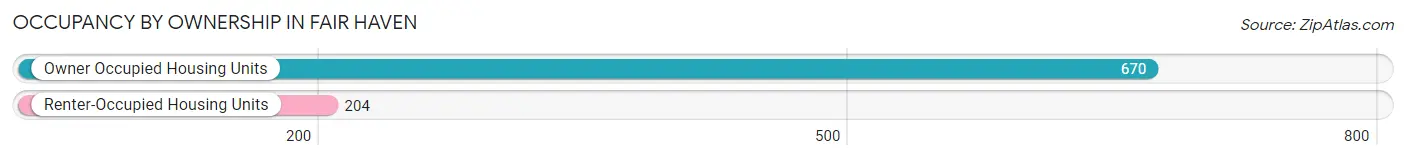
| Occupancy | # Housing Units | % Housing Units |
| Owner Occupied Housing Units | 670 | 76.7% |
| Renter-Occupied Housing Units | 204 | 23.3% |
| Total Occupied Housing Units | 874 | 100.0% |
Occupancy by Household Size in Fair Haven
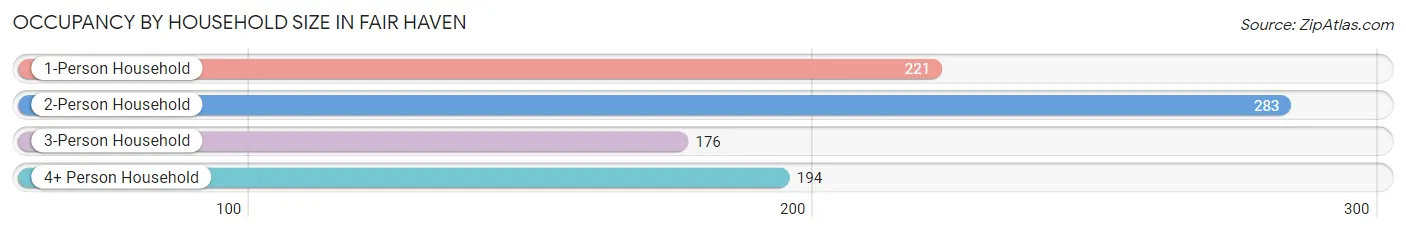
| Household Size | # Housing Units | % Housing Units |
| 1-Person Household | 221 | 25.3% |
| 2-Person Household | 283 | 32.4% |
| 3-Person Household | 176 | 20.1% |
| 4+ Person Household | 194 | 22.2% |
| Total Housing Units | 874 | 100.0% |
Occupancy by Ownership by Household Size in Fair Haven
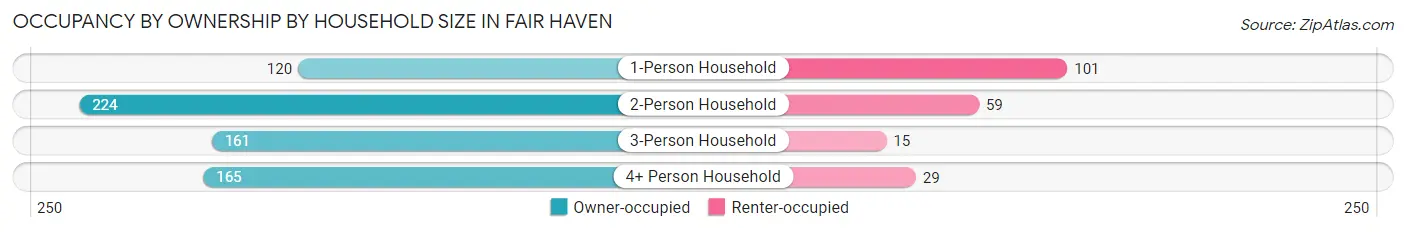
| Household Size | Owner-occupied | Renter-occupied |
| 1-Person Household | 120 (54.3%) | 101 (45.7%) |
| 2-Person Household | 224 (79.1%) | 59 (20.8%) |
| 3-Person Household | 161 (91.5%) | 15 (8.5%) |
| 4+ Person Household | 165 (85.1%) | 29 (14.9%) |
| Total Housing Units | 670 (76.7%) | 204 (23.3%) |
Occupancy by Educational Attainment in Fair Haven
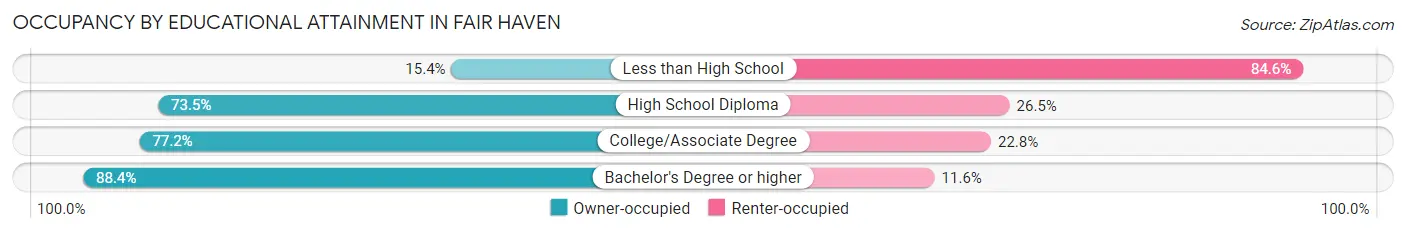
| Household Size | Owner-occupied | Renter-occupied |
| Less than High School | 4 (15.4%) | 22 (84.6%) |
| High School Diploma | 239 (73.5%) | 86 (26.5%) |
| College/Associate Degree | 244 (77.2%) | 72 (22.8%) |
| Bachelor's Degree or higher | 183 (88.4%) | 24 (11.6%) |
Occupancy by Age of Householder in Fair Haven
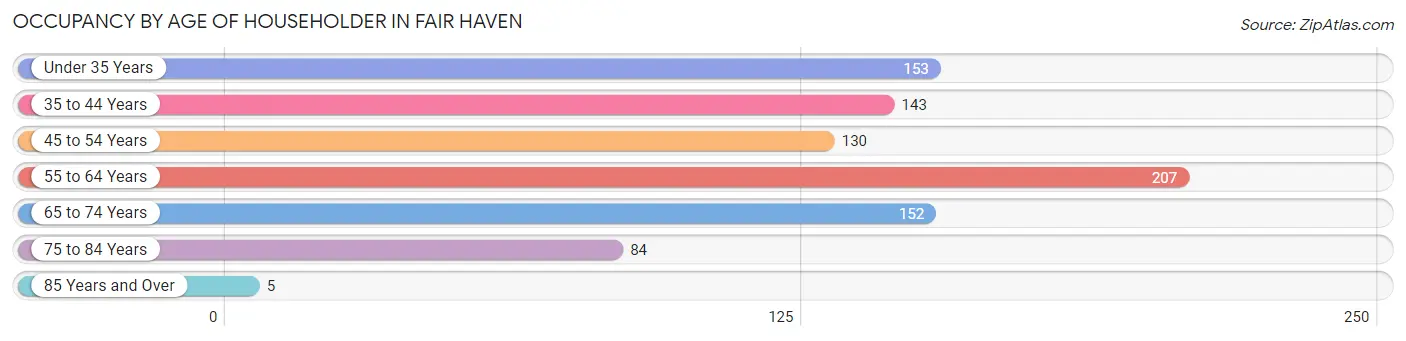
| Age Bracket | # Households | % Households |
| Under 35 Years | 153 | 17.5% |
| 35 to 44 Years | 143 | 16.4% |
| 45 to 54 Years | 130 | 14.9% |
| 55 to 64 Years | 207 | 23.7% |
| 65 to 74 Years | 152 | 17.4% |
| 75 to 84 Years | 84 | 9.6% |
| 85 Years and Over | 5 | 0.6% |
| Total | 874 | 100.0% |
Housing Finances in Fair Haven
Median Income by Occupancy in Fair Haven
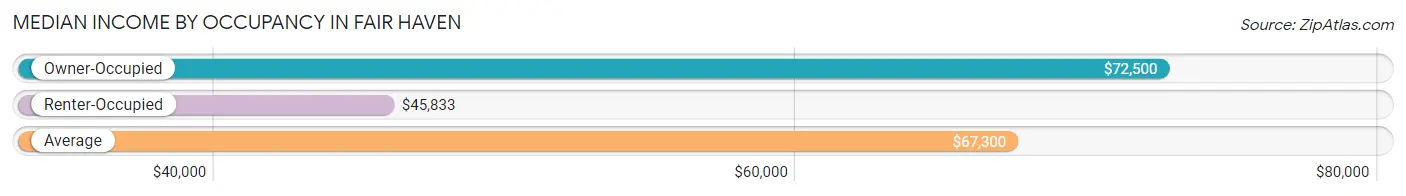
| Occupancy Type | # Households | Median Income |
| Owner-Occupied | 670 (76.7%) | $72,500 |
| Renter-Occupied | 204 (23.3%) | $45,833 |
| Average | 874 (100.0%) | $67,300 |
Occupancy by Householder Income Bracket in Fair Haven
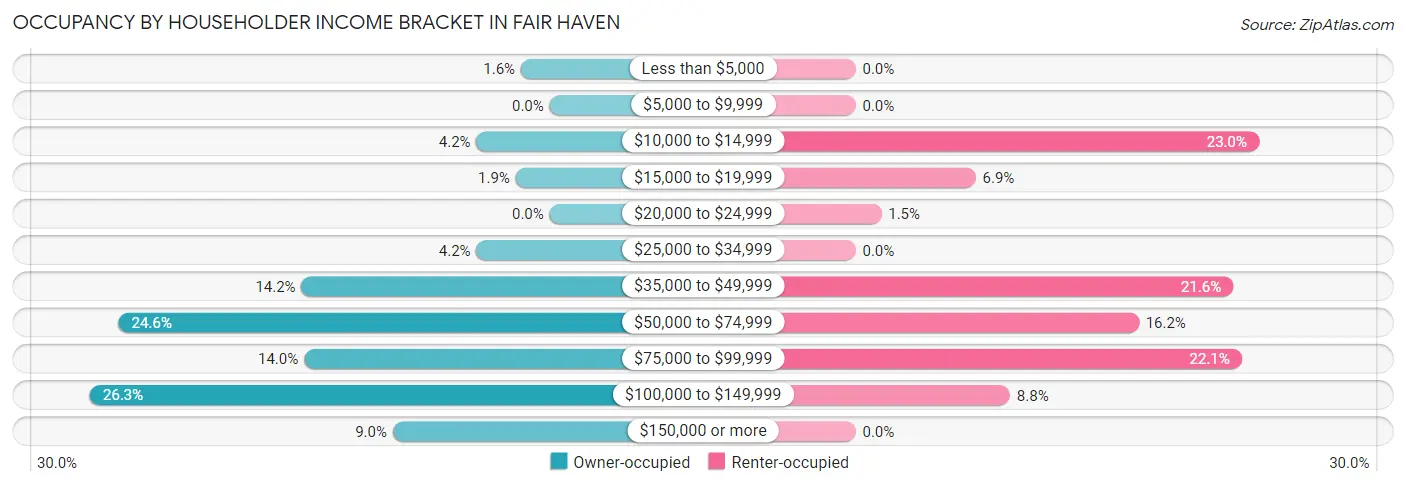
| Income Bracket | Owner-occupied | Renter-occupied |
| Less than $5,000 | 11 (1.6%) | 0 (0.0%) |
| $5,000 to $9,999 | 0 (0.0%) | 0 (0.0%) |
| $10,000 to $14,999 | 28 (4.2%) | 47 (23.0%) |
| $15,000 to $19,999 | 13 (1.9%) | 14 (6.9%) |
| $20,000 to $24,999 | 0 (0.0%) | 3 (1.5%) |
| $25,000 to $34,999 | 28 (4.2%) | 0 (0.0%) |
| $35,000 to $49,999 | 95 (14.2%) | 44 (21.6%) |
| $50,000 to $74,999 | 165 (24.6%) | 33 (16.2%) |
| $75,000 to $99,999 | 94 (14.0%) | 45 (22.1%) |
| $100,000 to $149,999 | 176 (26.3%) | 18 (8.8%) |
| $150,000 or more | 60 (9.0%) | 0 (0.0%) |
| Total | 670 (100.0%) | 204 (100.0%) |
Monthly Housing Cost Tiers in Fair Haven
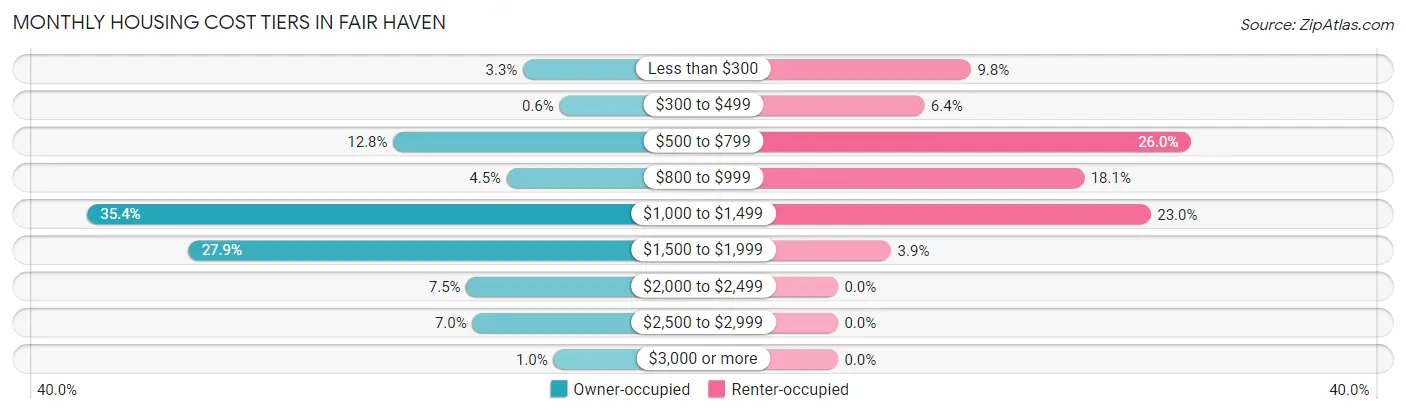
| Monthly Cost | Owner-occupied | Renter-occupied |
| Less than $300 | 22 (3.3%) | 20 (9.8%) |
| $300 to $499 | 4 (0.6%) | 13 (6.4%) |
| $500 to $799 | 86 (12.8%) | 53 (26.0%) |
| $800 to $999 | 30 (4.5%) | 37 (18.1%) |
| $1,000 to $1,499 | 237 (35.4%) | 47 (23.0%) |
| $1,500 to $1,999 | 187 (27.9%) | 8 (3.9%) |
| $2,000 to $2,499 | 50 (7.5%) | 0 (0.0%) |
| $2,500 to $2,999 | 47 (7.0%) | 0 (0.0%) |
| $3,000 or more | 7 (1.0%) | 0 (0.0%) |
| Total | 670 (100.0%) | 204 (100.0%) |
Physical Housing Characteristics in Fair Haven
Housing Structures in Fair Haven
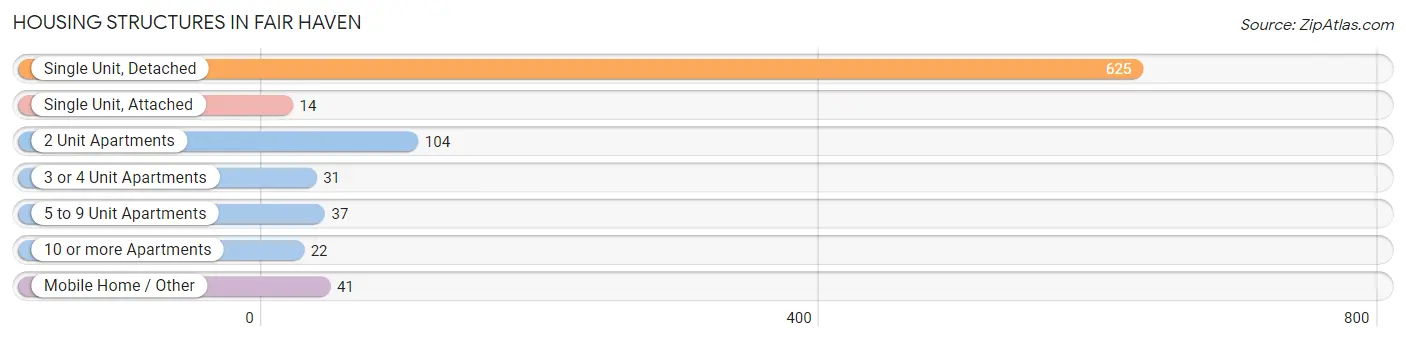
| Structure Type | # Housing Units | % Housing Units |
| Single Unit, Detached | 625 | 71.5% |
| Single Unit, Attached | 14 | 1.6% |
| 2 Unit Apartments | 104 | 11.9% |
| 3 or 4 Unit Apartments | 31 | 3.5% |
| 5 to 9 Unit Apartments | 37 | 4.2% |
| 10 or more Apartments | 22 | 2.5% |
| Mobile Home / Other | 41 | 4.7% |
| Total | 874 | 100.0% |
Housing Structures by Occupancy in Fair Haven
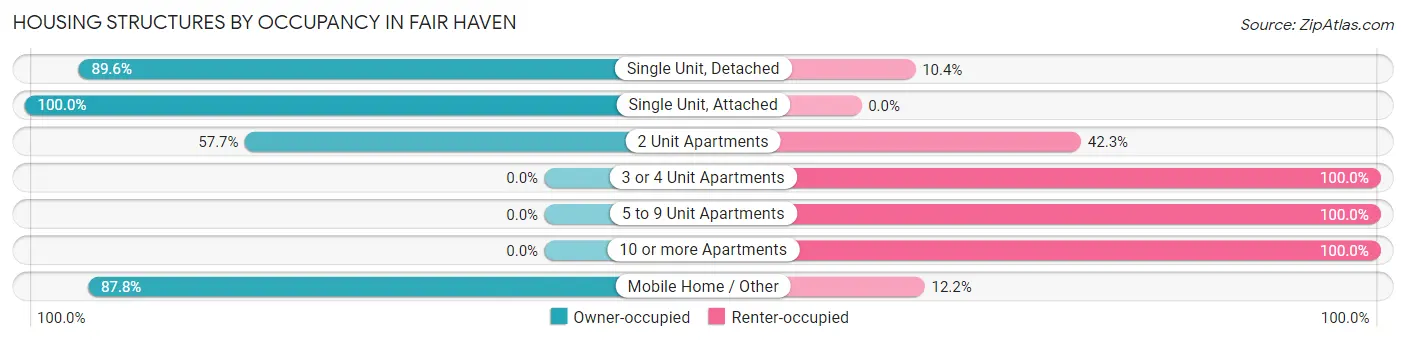
| Structure Type | Owner-occupied | Renter-occupied |
| Single Unit, Detached | 560 (89.6%) | 65 (10.4%) |
| Single Unit, Attached | 14 (100.0%) | 0 (0.0%) |
| 2 Unit Apartments | 60 (57.7%) | 44 (42.3%) |
| 3 or 4 Unit Apartments | 0 (0.0%) | 31 (100.0%) |
| 5 to 9 Unit Apartments | 0 (0.0%) | 37 (100.0%) |
| 10 or more Apartments | 0 (0.0%) | 22 (100.0%) |
| Mobile Home / Other | 36 (87.8%) | 5 (12.2%) |
| Total | 670 (76.7%) | 204 (23.3%) |
Housing Structures by Number of Rooms in Fair Haven
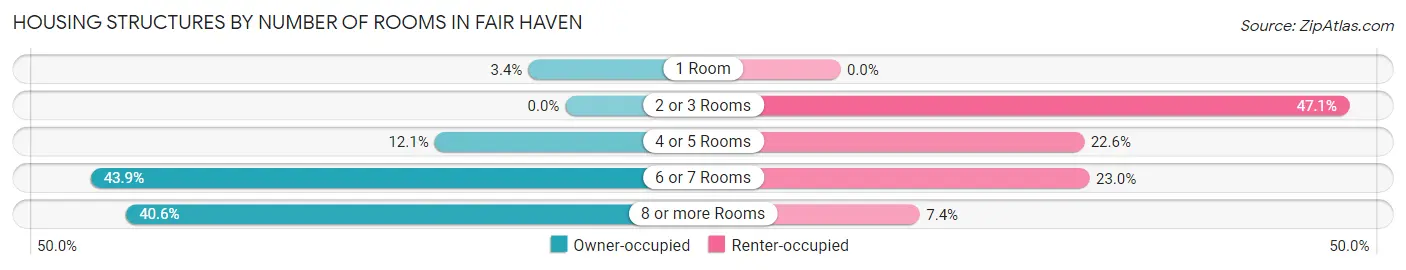
| Number of Rooms | Owner-occupied | Renter-occupied |
| 1 Room | 23 (3.4%) | 0 (0.0%) |
| 2 or 3 Rooms | 0 (0.0%) | 96 (47.1%) |
| 4 or 5 Rooms | 81 (12.1%) | 46 (22.6%) |
| 6 or 7 Rooms | 294 (43.9%) | 47 (23.0%) |
| 8 or more Rooms | 272 (40.6%) | 15 (7.3%) |
| Total | 670 (100.0%) | 204 (100.0%) |
Housing Structure by Heating Type in Fair Haven
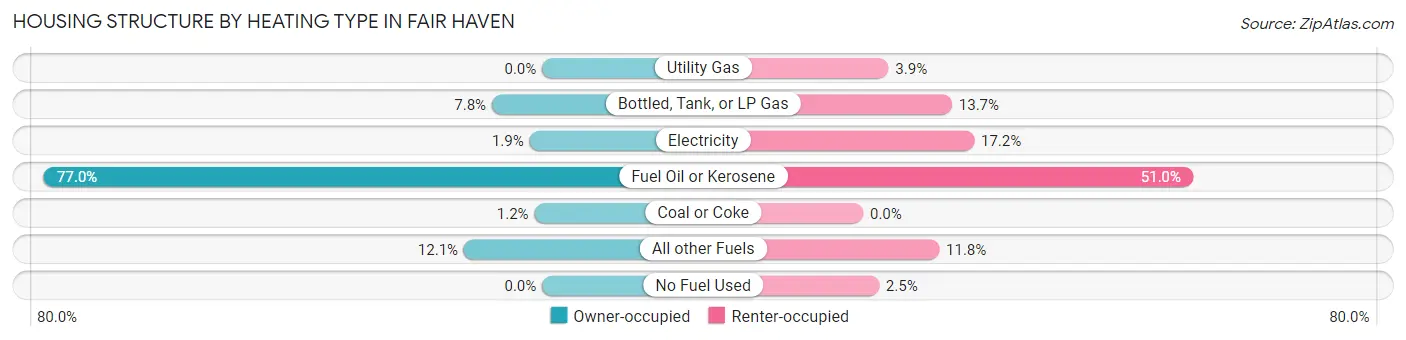
| Heating Type | Owner-occupied | Renter-occupied |
| Utility Gas | 0 (0.0%) | 8 (3.9%) |
| Bottled, Tank, or LP Gas | 52 (7.8%) | 28 (13.7%) |
| Electricity | 13 (1.9%) | 35 (17.2%) |
| Fuel Oil or Kerosene | 516 (77.0%) | 104 (51.0%) |
| Coal or Coke | 8 (1.2%) | 0 (0.0%) |
| All other Fuels | 81 (12.1%) | 24 (11.8%) |
| No Fuel Used | 0 (0.0%) | 5 (2.5%) |
| Total | 670 (100.0%) | 204 (100.0%) |
Household Vehicle Usage in Fair Haven
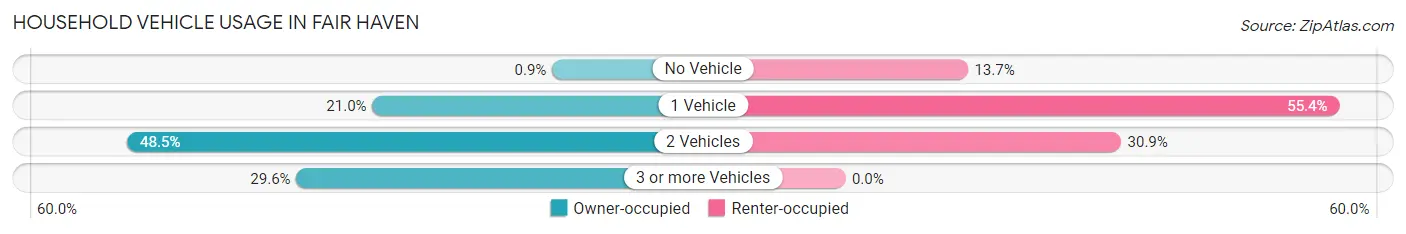
| Vehicles per Household | Owner-occupied | Renter-occupied |
| No Vehicle | 6 (0.9%) | 28 (13.7%) |
| 1 Vehicle | 141 (21.0%) | 113 (55.4%) |
| 2 Vehicles | 325 (48.5%) | 63 (30.9%) |
| 3 or more Vehicles | 198 (29.5%) | 0 (0.0%) |
| Total | 670 (100.0%) | 204 (100.0%) |
Real Estate & Mortgages in Fair Haven
Real Estate and Mortgage Overview in Fair Haven
| Characteristic | Without Mortgage | With Mortgage |
| Housing Units | 174 | 496 |
| Median Property Value | $168,800 | $160,600 |
| Median Household Income | $63,500 | $37 |
| Monthly Housing Costs | $714 | $7 |
| Real Estate Taxes | $3,568 | $0 |
Property Value by Mortgage Status in Fair Haven
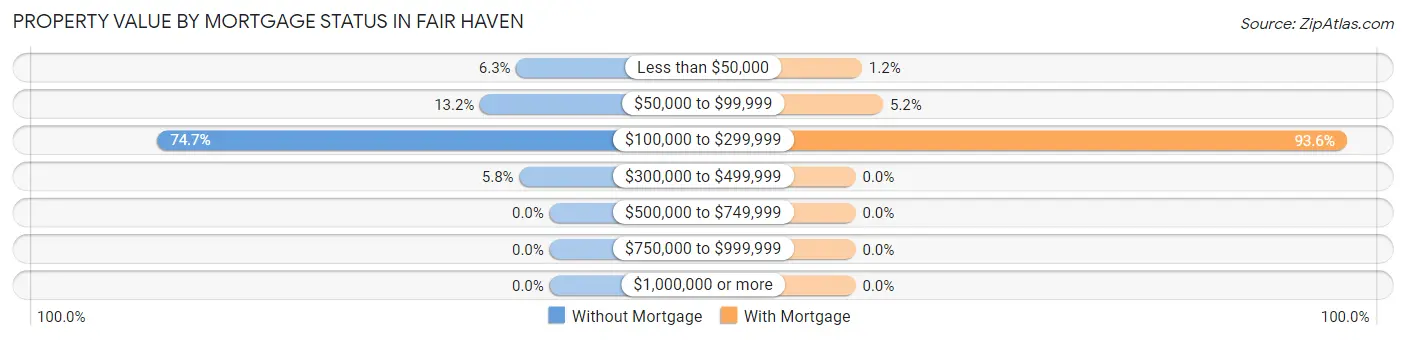
| Property Value | Without Mortgage | With Mortgage |
| Less than $50,000 | 11 (6.3%) | 6 (1.2%) |
| $50,000 to $99,999 | 23 (13.2%) | 26 (5.2%) |
| $100,000 to $299,999 | 130 (74.7%) | 464 (93.5%) |
| $300,000 to $499,999 | 10 (5.8%) | 0 (0.0%) |
| $500,000 to $749,999 | 0 (0.0%) | 0 (0.0%) |
| $750,000 to $999,999 | 0 (0.0%) | 0 (0.0%) |
| $1,000,000 or more | 0 (0.0%) | 0 (0.0%) |
| Total | 174 (100.0%) | 496 (100.0%) |
Household Income by Mortgage Status in Fair Haven
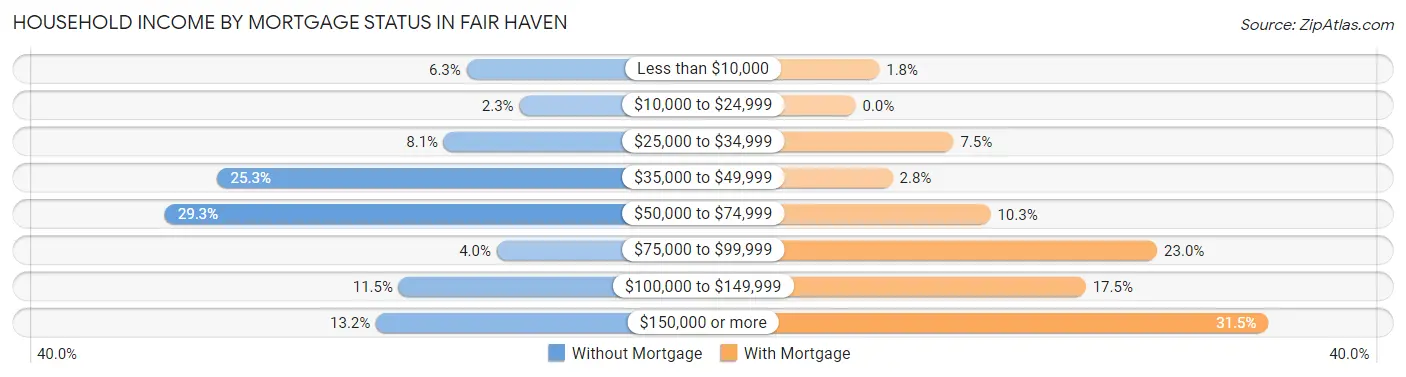
| Household Income | Without Mortgage | With Mortgage |
| Less than $10,000 | 11 (6.3%) | 9 (1.8%) |
| $10,000 to $24,999 | 4 (2.3%) | 0 (0.0%) |
| $25,000 to $34,999 | 14 (8.1%) | 37 (7.5%) |
| $35,000 to $49,999 | 44 (25.3%) | 14 (2.8%) |
| $50,000 to $74,999 | 51 (29.3%) | 51 (10.3%) |
| $75,000 to $99,999 | 7 (4.0%) | 114 (23.0%) |
| $100,000 to $149,999 | 20 (11.5%) | 87 (17.5%) |
| $150,000 or more | 23 (13.2%) | 156 (31.5%) |
| Total | 174 (100.0%) | 496 (100.0%) |
Property Value to Household Income Ratio in Fair Haven
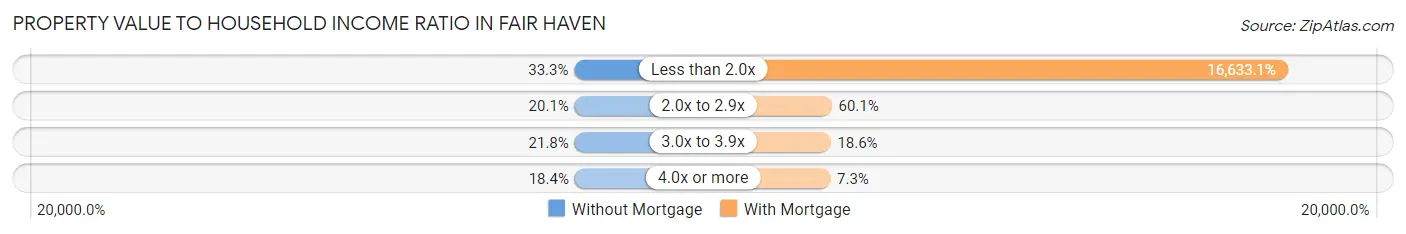
| Value-to-Income Ratio | Without Mortgage | With Mortgage |
| Less than 2.0x | 58 (33.3%) | 82,500 (16,633.1%) |
| 2.0x to 2.9x | 35 (20.1%) | 298 (60.1%) |
| 3.0x to 3.9x | 38 (21.8%) | 92 (18.5%) |
| 4.0x or more | 32 (18.4%) | 36 (7.3%) |
| Total | 174 (100.0%) | 496 (100.0%) |
Real Estate Taxes by Mortgage Status in Fair Haven
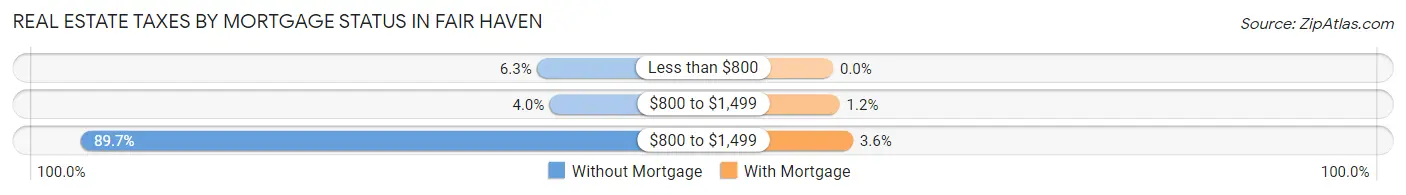
| Property Taxes | Without Mortgage | With Mortgage |
| Less than $800 | 11 (6.3%) | 0 (0.0%) |
| $800 to $1,499 | 7 (4.0%) | 6 (1.2%) |
| $800 to $1,499 | 156 (89.7%) | 18 (3.6%) |
| Total | 174 (100.0%) | 496 (100.0%) |
Health & Disability in Fair Haven
Health Insurance Coverage by Age in Fair Haven
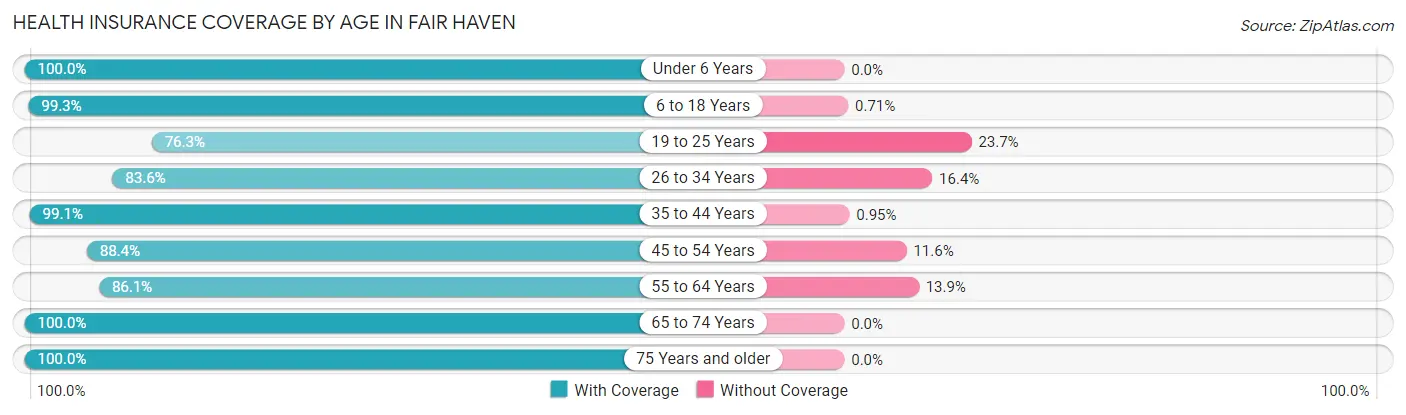
| Age Bracket | With Coverage | Without Coverage |
| Under 6 Years | 144 (100.0%) | 0 (0.0%) |
| 6 to 18 Years | 419 (99.3%) | 3 (0.7%) |
| 19 to 25 Years | 148 (76.3%) | 46 (23.7%) |
| 26 to 34 Years | 291 (83.6%) | 57 (16.4%) |
| 35 to 44 Years | 314 (99.1%) | 3 (0.9%) |
| 45 to 54 Years | 221 (88.4%) | 29 (11.6%) |
| 55 to 64 Years | 329 (86.1%) | 53 (13.9%) |
| 65 to 74 Years | 232 (100.0%) | 0 (0.0%) |
| 75 Years and older | 133 (100.0%) | 0 (0.0%) |
| Total | 2,231 (92.1%) | 191 (7.9%) |
Health Insurance Coverage by Citizenship Status in Fair Haven
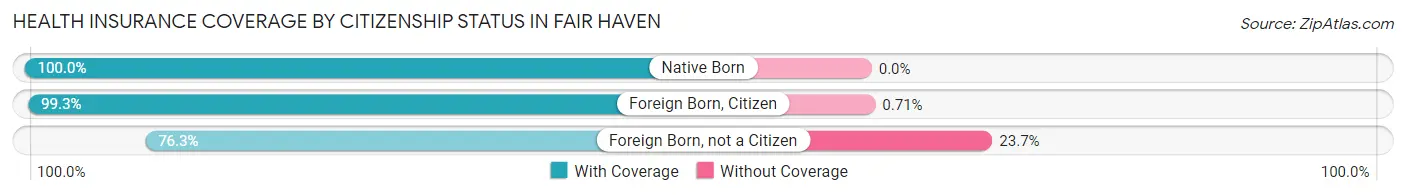
| Citizenship Status | With Coverage | Without Coverage |
| Native Born | 144 (100.0%) | 0 (0.0%) |
| Foreign Born, Citizen | 419 (99.3%) | 3 (0.7%) |
| Foreign Born, not a Citizen | 148 (76.3%) | 46 (23.7%) |
Health Insurance Coverage by Household Income in Fair Haven
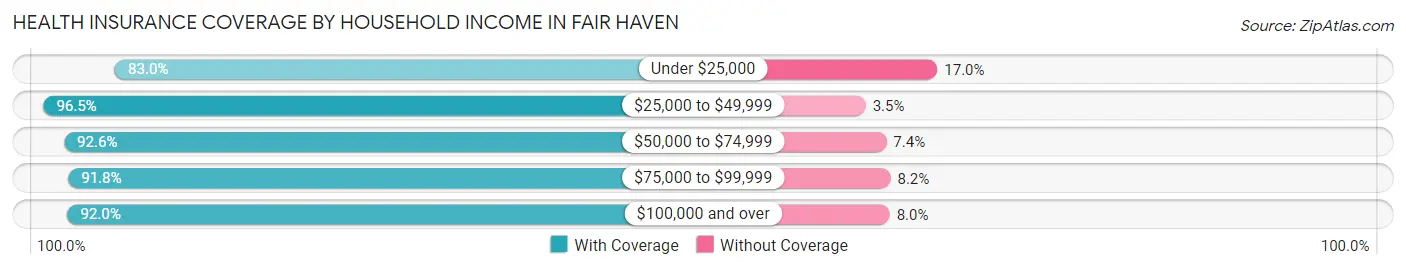
| Household Income | With Coverage | Without Coverage |
| Under $25,000 | 137 (83.0%) | 28 (17.0%) |
| $25,000 to $49,999 | 327 (96.5%) | 12 (3.5%) |
| $50,000 to $74,999 | 586 (92.6%) | 47 (7.4%) |
| $75,000 to $99,999 | 403 (91.8%) | 36 (8.2%) |
| $100,000 and over | 778 (92.0%) | 68 (8.0%) |
Public vs Private Health Insurance Coverage by Age in Fair Haven
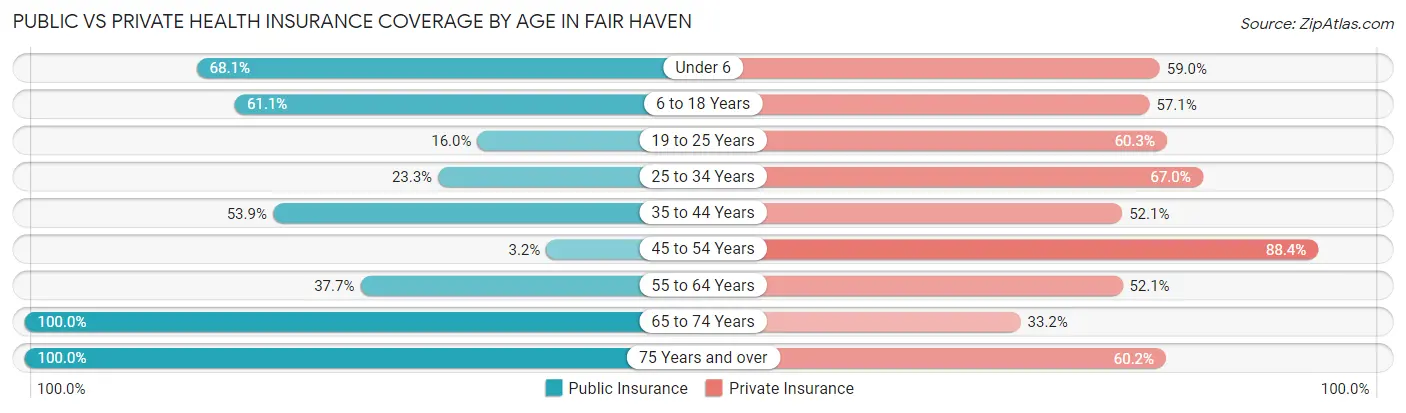
| Age Bracket | Public Insurance | Private Insurance |
| Under 6 | 98 (68.1%) | 85 (59.0%) |
| 6 to 18 Years | 258 (61.1%) | 241 (57.1%) |
| 19 to 25 Years | 31 (16.0%) | 117 (60.3%) |
| 25 to 34 Years | 81 (23.3%) | 233 (66.9%) |
| 35 to 44 Years | 171 (53.9%) | 165 (52.0%) |
| 45 to 54 Years | 8 (3.2%) | 221 (88.4%) |
| 55 to 64 Years | 144 (37.7%) | 199 (52.1%) |
| 65 to 74 Years | 232 (100.0%) | 77 (33.2%) |
| 75 Years and over | 133 (100.0%) | 80 (60.2%) |
| Total | 1,156 (47.7%) | 1,418 (58.6%) |
Disability Status by Sex by Age in Fair Haven
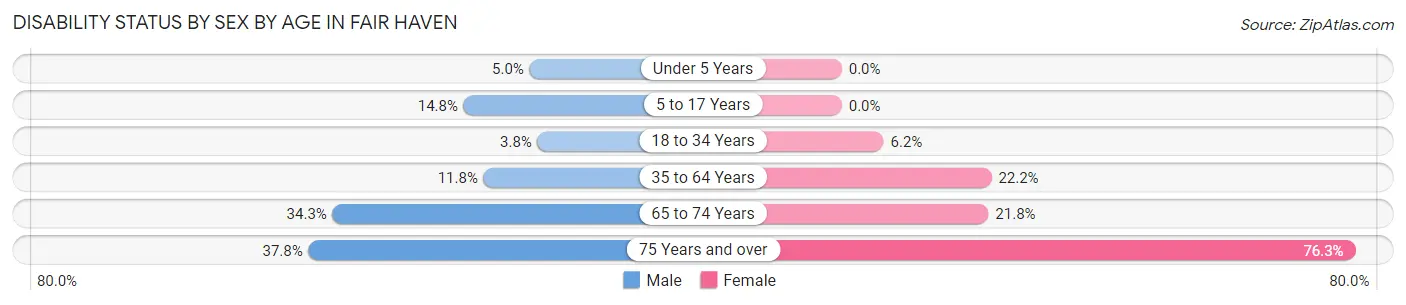
| Age Bracket | Male | Female |
| Under 5 Years | 4 (5.0%) | 0 (0.0%) |
| 5 to 17 Years | 34 (14.8%) | 0 (0.0%) |
| 18 to 34 Years | 8 (3.8%) | 22 (6.2%) |
| 35 to 64 Years | 59 (11.8%) | 100 (22.2%) |
| 65 to 74 Years | 37 (34.3%) | 27 (21.8%) |
| 75 Years and over | 28 (37.8%) | 45 (76.3%) |
Disability Class by Sex by Age in Fair Haven
Disability Class: Hearing Difficulty
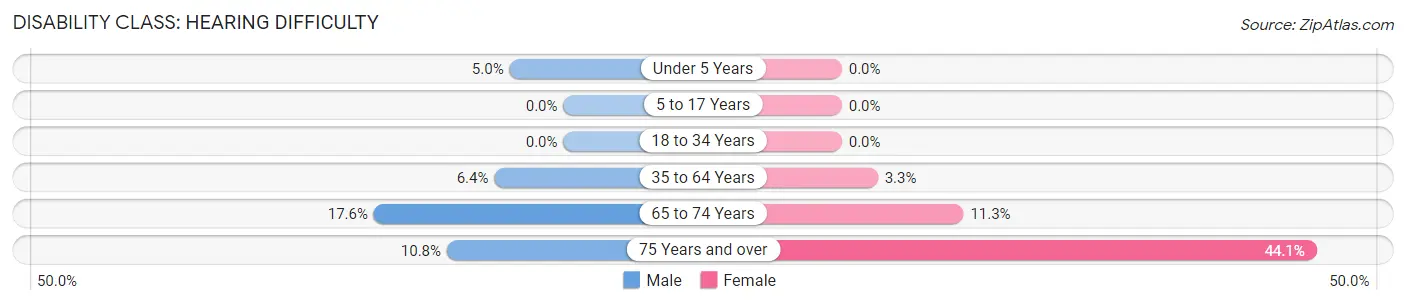
| Age Bracket | Male | Female |
| Under 5 Years | 4 (5.0%) | 0 (0.0%) |
| 5 to 17 Years | 0 (0.0%) | 0 (0.0%) |
| 18 to 34 Years | 0 (0.0%) | 0 (0.0%) |
| 35 to 64 Years | 32 (6.4%) | 15 (3.3%) |
| 65 to 74 Years | 19 (17.6%) | 14 (11.3%) |
| 75 Years and over | 8 (10.8%) | 26 (44.1%) |
Disability Class: Vision Difficulty
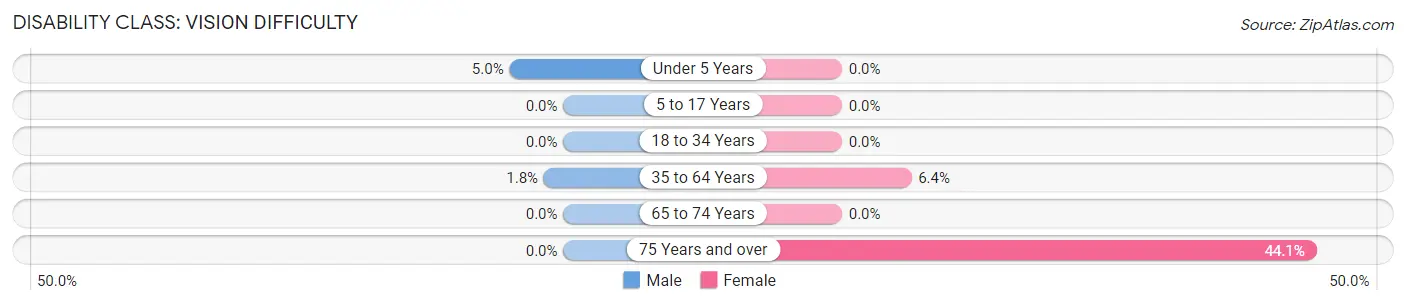
| Age Bracket | Male | Female |
| Under 5 Years | 4 (5.0%) | 0 (0.0%) |
| 5 to 17 Years | 0 (0.0%) | 0 (0.0%) |
| 18 to 34 Years | 0 (0.0%) | 0 (0.0%) |
| 35 to 64 Years | 9 (1.8%) | 29 (6.4%) |
| 65 to 74 Years | 0 (0.0%) | 0 (0.0%) |
| 75 Years and over | 0 (0.0%) | 26 (44.1%) |
Disability Class: Cognitive Difficulty
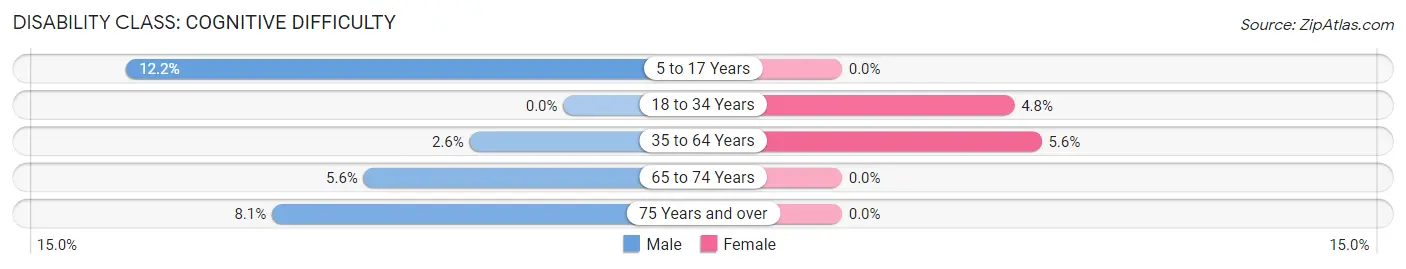
| Age Bracket | Male | Female |
| 5 to 17 Years | 28 (12.2%) | 0 (0.0%) |
| 18 to 34 Years | 0 (0.0%) | 17 (4.8%) |
| 35 to 64 Years | 13 (2.6%) | 25 (5.6%) |
| 65 to 74 Years | 6 (5.6%) | 0 (0.0%) |
| 75 Years and over | 6 (8.1%) | 0 (0.0%) |
Disability Class: Ambulatory Difficulty
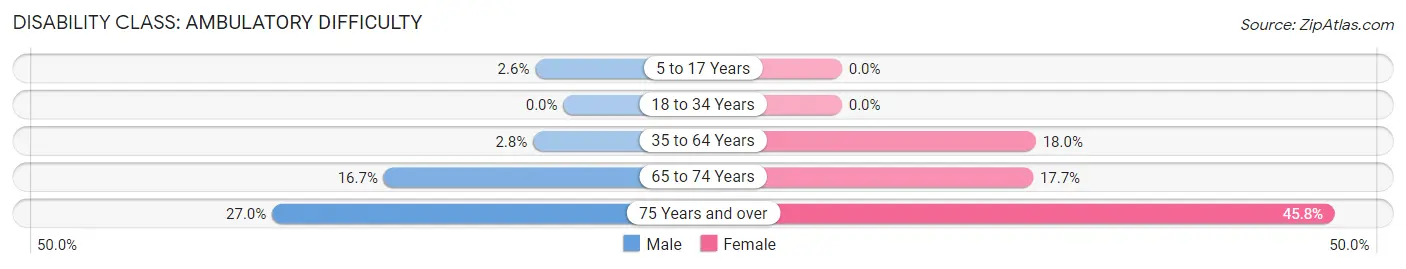
| Age Bracket | Male | Female |
| 5 to 17 Years | 6 (2.6%) | 0 (0.0%) |
| 18 to 34 Years | 0 (0.0%) | 0 (0.0%) |
| 35 to 64 Years | 14 (2.8%) | 81 (18.0%) |
| 65 to 74 Years | 18 (16.7%) | 22 (17.7%) |
| 75 Years and over | 20 (27.0%) | 27 (45.8%) |
Disability Class: Self-Care Difficulty
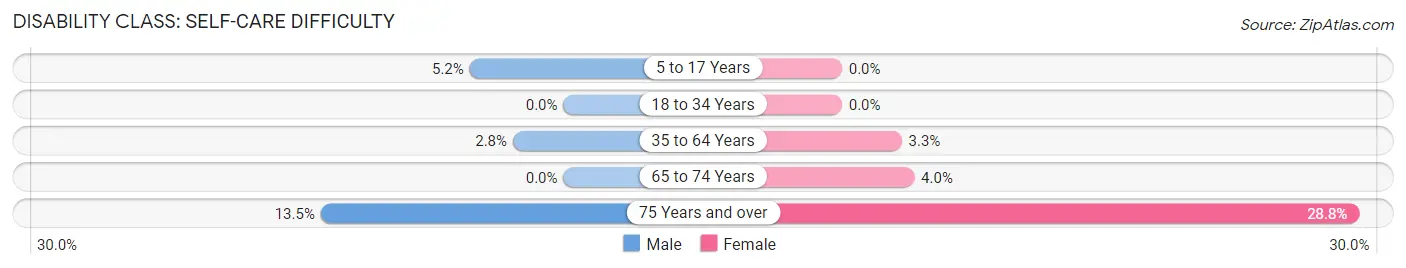
| Age Bracket | Male | Female |
| 5 to 17 Years | 12 (5.2%) | 0 (0.0%) |
| 18 to 34 Years | 0 (0.0%) | 0 (0.0%) |
| 35 to 64 Years | 14 (2.8%) | 15 (3.3%) |
| 65 to 74 Years | 0 (0.0%) | 5 (4.0%) |
| 75 Years and over | 10 (13.5%) | 17 (28.8%) |
Technology Access in Fair Haven
Computing Device Access in Fair Haven
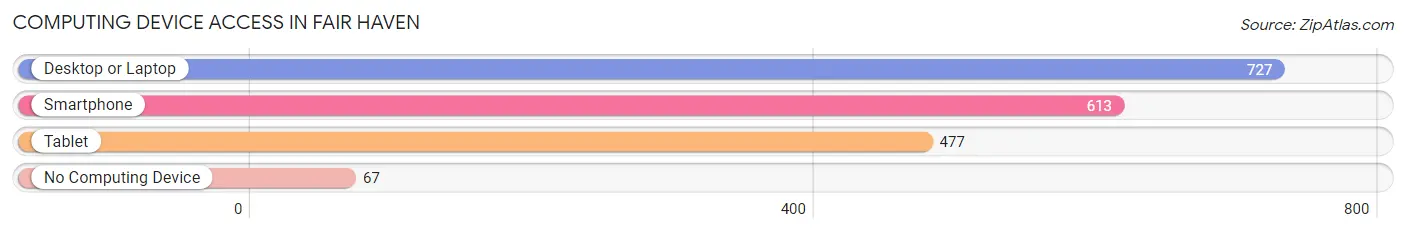
| Device Type | # Households | % Households |
| Desktop or Laptop | 727 | 83.2% |
| Smartphone | 613 | 70.1% |
| Tablet | 477 | 54.6% |
| No Computing Device | 67 | 7.7% |
| Total | 874 | 100.0% |
Internet Access in Fair Haven
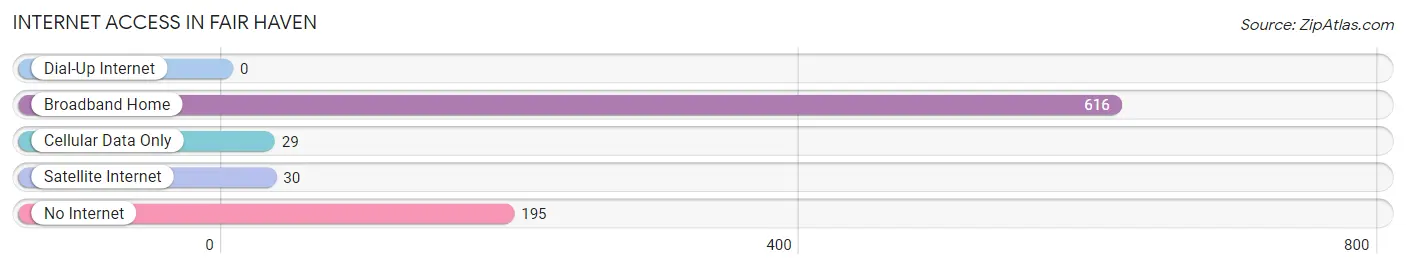
| Internet Type | # Households | % Households |
| Dial-Up Internet | 0 | 0.0% |
| Broadband Home | 616 | 70.5% |
| Cellular Data Only | 29 | 3.3% |
| Satellite Internet | 30 | 3.4% |
| No Internet | 195 | 22.3% |
| Total | 874 | 100.0% |
Fair Haven Summary
History
Fair Haven, Vermont is a small town located in the southwestern corner of the state, near the border of New York. It was first settled in 1790 by a group of settlers from Connecticut, and was incorporated in 1820. The town was named after Fair Haven, Connecticut, the hometown of the settlers.
The town was originally an agricultural community, with the main crops being wheat, corn, and potatoes. In the late 19th century, the town began to industrialize, with the construction of a paper mill and a woolen mill. The paper mill was the largest employer in the town, and it remained in operation until the early 20th century.
The town was also home to a number of other industries, including a sawmill, a gristmill, a tannery, and a brickyard. The town also had a number of stores, including a general store, a drug store, and a hardware store.
Geography
Fair Haven is located in the southwestern corner of Vermont, near the border of New York. It is situated on the east bank of the Otter Creek, and is bordered by the towns of Castleton, Benson, and West Haven. The town has a total area of 8.3 square miles, of which 8.2 square miles is land and 0.1 square miles is water.
The town is located in the Green Mountains, and is surrounded by rolling hills and forests. The highest point in the town is Mount Tom, which has an elevation of 1,890 feet. The town is also home to several small lakes, including Lake Bomoseen, Lake St. Catherine, and Lake Hortonia.
Economy
The economy of Fair Haven is largely based on tourism and manufacturing. The town is home to several small businesses, including a brewery, a winery, and a number of restaurants. The town is also home to a number of small manufacturing companies, including a plastics manufacturer and a machine shop.
The town is also home to a number of small farms, which produce a variety of crops, including corn, wheat, and potatoes. The town is also home to a number of small retail stores, including a general store, a drug store, and a hardware store.
Demographics
As of the 2010 census, the town had a population of 2,717. The racial makeup of the town was 97.2% White, 0.7% African American, 0.2% Native American, 0.3% Asian, 0.1% Pacific Islander, 0.3% from other races, and 1.3% from two or more races. Hispanic or Latino of any race were 1.2% of the population.
The median income for a household in the town was $41,944, and the median income for a family was $50,000. The per capita income for the town was $20,945. About 8.3% of families and 11.2% of the population were below the poverty line, including 15.2% of those under age 18 and 8.2% of those age 65 or over.
Common Questions
What is the Total Population of Fair Haven?
Total Population of Fair Haven is 2,422.
What is the Total Male Population of Fair Haven?
Total Male Population of Fair Haven is 1,201.
What is the Total Female Population of Fair Haven?
Total Female Population of Fair Haven is 1,221.
What is the Ratio of Males per 100 Females in Fair Haven?
There are 98.36 Males per 100 Females in Fair Haven.
What is the Ratio of Females per 100 Males in Fair Haven?
There are 101.67 Females per 100 Males in Fair Haven.
What is the Median Population Age in Fair Haven?
Median Population Age in Fair Haven is 38.6 Years.
What is the Average Family Size in Fair Haven
Average Family Size in Fair Haven is 3.2 People.
What is the Average Household Size in Fair Haven
Average Household Size in Fair Haven is 2.8 People.
What is Per Capita Income in Fair Haven?
Per Capita income in Fair Haven is $29,000.
What is the Median Family Income in Fair Haven?
Median Family Income in Fair Haven is $82,574.
What is the Median Household income in Fair Haven?
Median Household Income in Fair Haven is $67,300.
What is Income or Wage Gap in Fair Haven?
Income or Wage Gap in Fair Haven is 51.2%.
Women in Fair Haven earn 48.8 cents for every dollar earned by a man.
What is Inequality or Gini Index in Fair Haven?
Inequality or Gini Index in Fair Haven is 0.36.
How Large is the Labor Force in Fair Haven?
There are 1,261 People in the Labor Forcein in Fair Haven.
What is the Percentage of People in the Labor Force in Fair Haven?
64.5% of People are in the Labor Force in Fair Haven.
What is the Unemployment Rate in Fair Haven?
Unemployment Rate in Fair Haven is 3.5%.